Article

SnO2 Nanowire/MoS2 Nanosheet Composite Gas Sensor in Self-Heating Mode for Selective and ppb-Level Detection of NO2 Gas

1
Department of Materials Science and Engineering, Inha University, Incheon 22212, Republic of Korea
2
Department of Materials Science and Engineering, Shiraz University of Technology, Shiraz 71557-13876, Iran
*
Authors to whom correspondence should be addressed.
Chemosensors 2024, 12(6), 107; https://doi.org/10.3390/chemosensors12060107
Submission received: 10 May 2024 / Revised: 7 June 2024 / Accepted: 7 June 2024 / Published: 9 June 2024

Abstract

:
The development of low-cost and low-power gas sensors for reliable NO2 gas detection is important due to the highly toxic nature of NO2 gas. Herein, initially, SnO2 nanowires (NWs) were synthesized through a simple vapor–liquid–solid growth mechanism. Subsequently, different amounts of SnO2 NWs were composited with MoS2 nanosheets (NSs) to fabricate SnO2 NWs/MoS2 NS nanocomposite gas sensors for NO2 gas sensing. The operation of the sensors in self-heating mode at 1–3.5 V showed that the sensor with 20 wt.% SnO2 (SM-20 nanocomposite) had the highest response of 13 to 1000 ppb NO2 under 3.2 V applied voltage. Furthermore, the SM-20 nanocomposite gas sensor exhibited high selectivity and excellent long-term stability. The enhanced NO2 gas response was ascribed to the formation of n-n heterojunctions between SnO2 NWs and MoS2, high surface area, and the presence of some voids in the SM-20 composite gas sensor due to having different morphologies of SnO2 NWs and MoS2 NSs. It is believed that the present strategy combining MoS2 and SnO2 with different morphologies and different sensing properties is a good approach to realize high-performance NO2 gas sensors with merits such as simple synthesis and fabrication procedures, low cost, and low power consumption, which are currently in demand in the gas sensor market.

1. Introduction

NO2 is a highly dangerous gas emitted from industrial activities, fuel combustion, biomass burning, and electricity generation [1]. NO2 can affect global air quality and human health [2]. Long-term exposure to parts per million (ppm) levels of NO2 can cause infections in the respiratory tract and lungs. Asthma, tissue hypoxia, pulmonary edema, and cardiovascular disease are affected by the presence of NO2 gas [3,4,5]. Additionally, NO2 contributes to the formation of acid rain and reduces the visibility of atmospheric photochemical smog [6,7]. Therefore, the threshold limit for NO2 gas is set at 3 ppm [8]. In addition to its toxic effects, NO2 gas is also considered a biomarker of lung infections [9]. Thus, the detection of NO2 gas is highly important from safety and health perspectives.
Semiconducting metal oxides are often used for the detection of toxic gases. However, they often need a high temperature to show their best sensing performance [10,11]. Transition metal dichalcogenides (TMDs) with a two-dimensional (2D) nanosheet (NS) nature have the general formula MX2 (M = Mo or W; X = S, Se, or Te), in which the metal layers are sandwiched between two chalcogen layers [12,13]. They can be used in different applications as a gas adsorbent [14], microwave adsorbent [15], and gas sensor.
WS2 [16], WSe2 [17], MoS2 [18], and MoSe2 [19] are the most important TMDs for gas sensing studies. In particular, MoS2 has features such as fast charge transfer, adjustable band gap, high carrier mobility, and large surface area owing to its 2D nature, making it a favorable TMD for gas sensing applications, particularly low- or room-temperature gas sensing [20]. However, its sensing properties in pristine form are generally not adequate for the high standards of today’s life. Accordingly, it can be decorated [21], doped [22], or composited with other materials [23,24] to enhance its sensing properties. In particular, composite fabrication leads to the formation of heterojunctions, which can provide an additional source of resistance modulation, ultimately leading to significant resistance modulation [25].
Semiconducting n-type SnO2 (Eg = 3.37 eV) [26] has high electron mobility, high availability, ease of synthesis, high stability, and excellent gas sensing properties [27,28]. Accordingly, different morphologies of SnO2-like nanoparticles (NPs) [29], nanorods [30], nanobelts [31], nanotubes [32], nanofibers [33], and nanowires (NWs) [34] have been used for the detection of various gases. Even though some room temperature SnO2 gas sensors have been reported in the literature [35], SnO2 gas sensors often require high temperatures to achieve their best performance.
Thus, SnO2-MoS2 nanocomposites are a good choice for gas sensing [36,37,38,39], combining the relatively good sensitivity of MoS2 at room temperature (RT) with the high sensitivity of SnO2 at higher temperatures, resulting in the realization of a room-temperature or relatively low-temperature gas sensor with good performance. For example, Bai et al. [40] reported the growth of vertically aligned MoS2 on SnO2 nanotubes for the room-temperature detection of NO2 gas with a response of approximately 35 to 100 ppm NO2 gas. In addition, polyaniline-MOS2-SnO2 nanotubes were reported as room-temperature ammonia gas sensors [41]. Wang et al. [42] used SnO2 NPs-MoS2 NSs for ammonia sensing at RT. Viet et al. [43] decorated MoS2 NSs on SnO2 NWs to detect and discriminate between CO, NH3, and H2 gases. Xu et al. [44] used MoS2 NSs/SnO2 nanotubes for the detection of trimethylamine at 200 °C. Han et al. reported a MoS2 NSs-SnO2 NPs composite gas sensor with an 18.7–5 ppm response of NO2 gas at RT [45]. Anyway, less attention has been paid to the composites of SnO2 NWs with MoS2 NSs. SnO2 NWs with strong intrinsic gas sensing features, high surface area, and one-dimensional (1D) nature, in combination with MoS2 NSs, can generate numerous heterojunctions, which offer new opportunities for the detection of NO2 gas. Additionally, the operation of gas sensors in self-heating conditions is a promising approach to not only significantly decrease the sensing temperature but also remarkably lower power consumption. Hence, self-heated sensors offer opportunities for application in places with limited energy access.
In this study, SnO2 NWs were initially produced using a vapor–liquid–solid (VLS) growth mechanism, which is a simple, low-cost, and highly efficient method for the synthesis of metal oxide NWs [46]. Afterward, SnO2 NWs (10, 20, and 30 wt.%) were composited with MoS2 NSs. Overall, the synthesis procedure is highly cost-effective, and even large-scale synthesis is feasible for possible industrial applications. After different advanced characterizations, gas sensors were fabricated, and the sensor with 20 wt.% SnO2 NWs revealed the highest response to NO2 gas under 3.2 V in self-heating mode with parts per billion (ppb)-level detection ability, high selectivity, and long-term stability. The enhanced NO2 gas sensing performance was mainly related to the formation of SnO2-MoS2 n-n heterojunctions and the high surface area of the nanocomposite. We believe that the optimal sensor developed in this study, with low power consumption, low synthesis cost, and high sensing performance, can be regarded as a potential choice for industrial and practical applications.

2. Materials and Methods

2.1. Starting Materials

Metallic Sn powders with high purity of 99.5% (Merck, <150 µm size, Darmstadt, Germany) were used for growth of SnO2 NWs. Also, commercial MoS2 NSs (ACS Material, 100–200 nm, Pasadena, CA, USA) were used to prepare the SnO2/MoS2 nanocomposites.

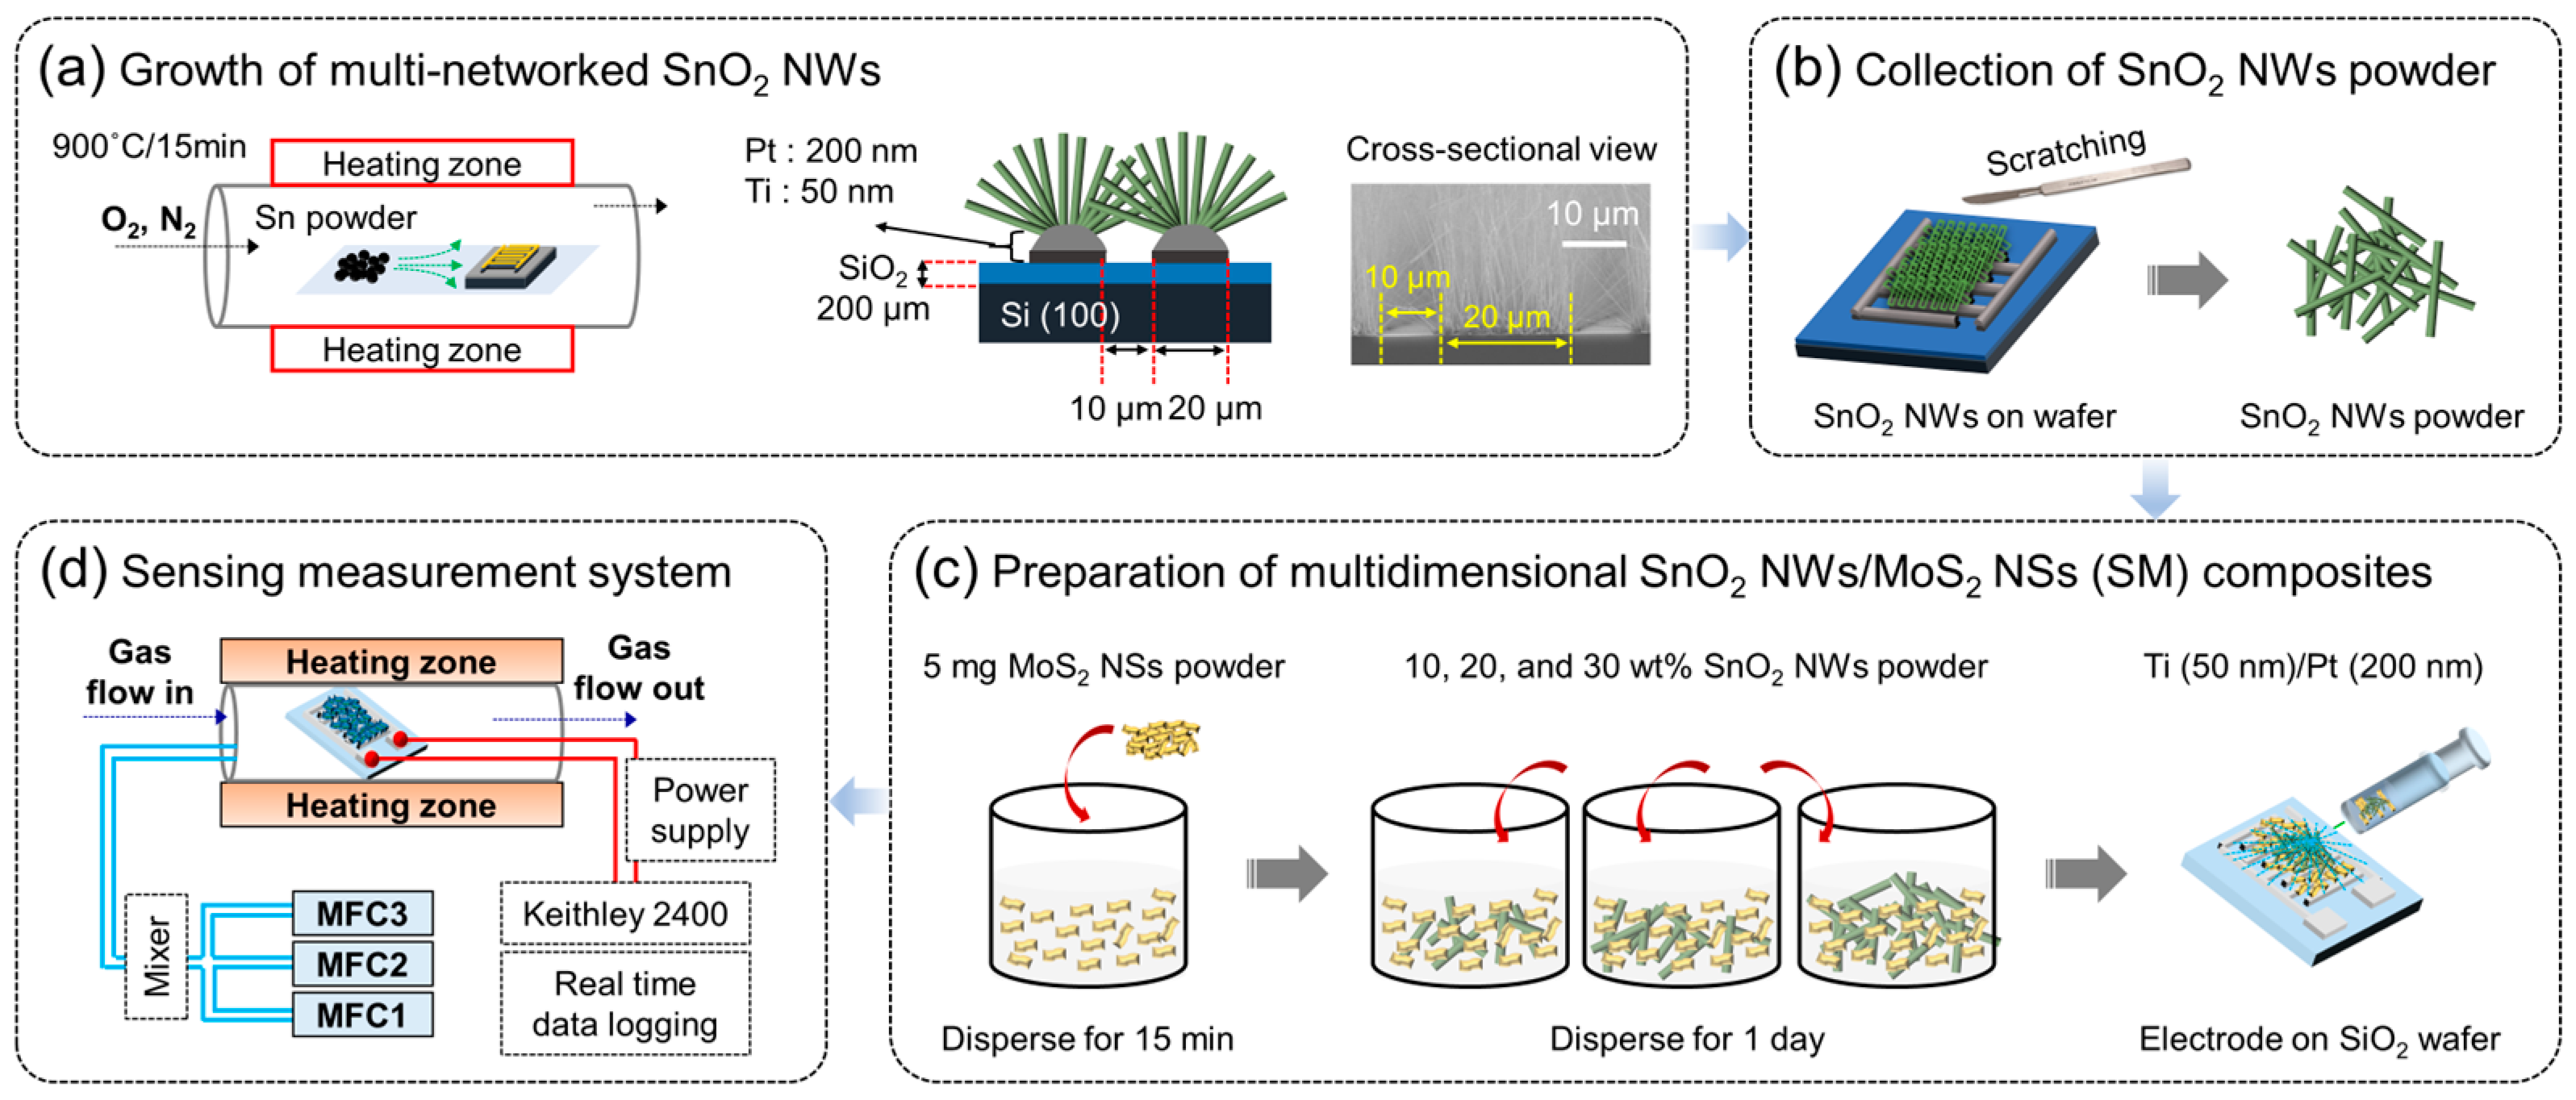
2.2. Synthesis of SnO2 NWs and SnO2 NWs/MoS2 NS Composite

Networked SnO2 NWs were synthesized via a VLS growth mechanism similar to that reported in a previous study [47]. First, high-purity metallic Sn powder was put in a crucible inside a tubular furnace. A SiO2-grown (200 µm) Si substrate equipped Ti (50 nm)/Pt (200 nm) bi-electrode was placed within a short distance. Then, the temperature was gradually increased in the presence of flowing O2 (10 sccm) and N2 (300 sccm) gases, and SnO2 NWs were grown at 900 °C for 15 min on the substrate (Figure 1a). The SnO2 NWs were then scratched from the substrate (Figure 1b) to form a composite with MoS2 NSs. To prepare the composite, 5 mg MoS2 NSs were mixed with 10, 20, and 30 wt.% SnO2 NWs (denoted as SM-10, SM-20, and SM-30, respectively) under magnetic stirring for 24 h (Figure 1c).

2.3. Characterizations

Field-emission scanning electron microscopy (FE-SEM; Hitachi S-4200, Tokyo, Japan) and transmission electron microscopy (TEM; JEM2100F/JEOL, Tokyo, Japan) were used for morphological analysis. In FE-SEM, cold type was used as field emission gun with 15 kV power. X-ray photoelectron spectroscopy (XPS; K-Alpha/Thermo scientific, Seoul, Republic of Korea) was used for compositional analysis of the surface elements. Monochromated Al Kα was used as the X-ray source. The surface area was evaluated using the Brunauer–Emmett–Teller method (BET, MICROMERITICS Tristar, Norcross, GA, USA) from the N2 adsorption–desorption isotherms. Induced temperature due to the Joule effect during the operation of the sensor in self-heating mode was monitored using a thermometer (IT-480S, Horiba, Kyoto, Japan). Ultraviolet photoemission spectroscopy (UPS, Thermo Fisher Scientific Co. Theta probe, Seoul, Republic of Korea) was used to estimate the work function values. He I (21.22 eV) was used as the light source.

2.4. Gas Sensing Tests

First, 5 mg of the sensing material was mixed with ethanol, and 0.075 μL of the solution (in three drops) was drop-coated onto the SiO2 substrate equipped with Ti (50 nm)/Pt (200 nm) bi-layer electrodes (Figure 1c). Also, digital images of fabricated sensor are provided in Figure S1. A lab-made gas-sensing apparatus was used for the experiments (Figure 1d). The chamber was placed inside a tubular quartz furnace connected to a Keithley 2400 source meter. The gas was mixed with dry air and injected into the gas chamber using MFCs at a total flow rate of 100 sccm. The resistances in air (Ra) and in the presence of the target gas (Rg) were measured constantly, and the sensor response was calculated as R = Rg/Ra for NO2 gas and vice versa for reducing gases. Additionally, the response time (τres) and recovery time (τrec) were defined as the times required for the resistance to reach its 90% final value after injection and stoppage of NO2 gas, respectively [48]. During the gas sensing tests, the relative humidity (RH) in the chamber was 30% at RT. However, to evaluate the effect of higher humidity on the gas response, 80% RH was introduced into the gas chamber and measured at RT.

3. Results and Discussion

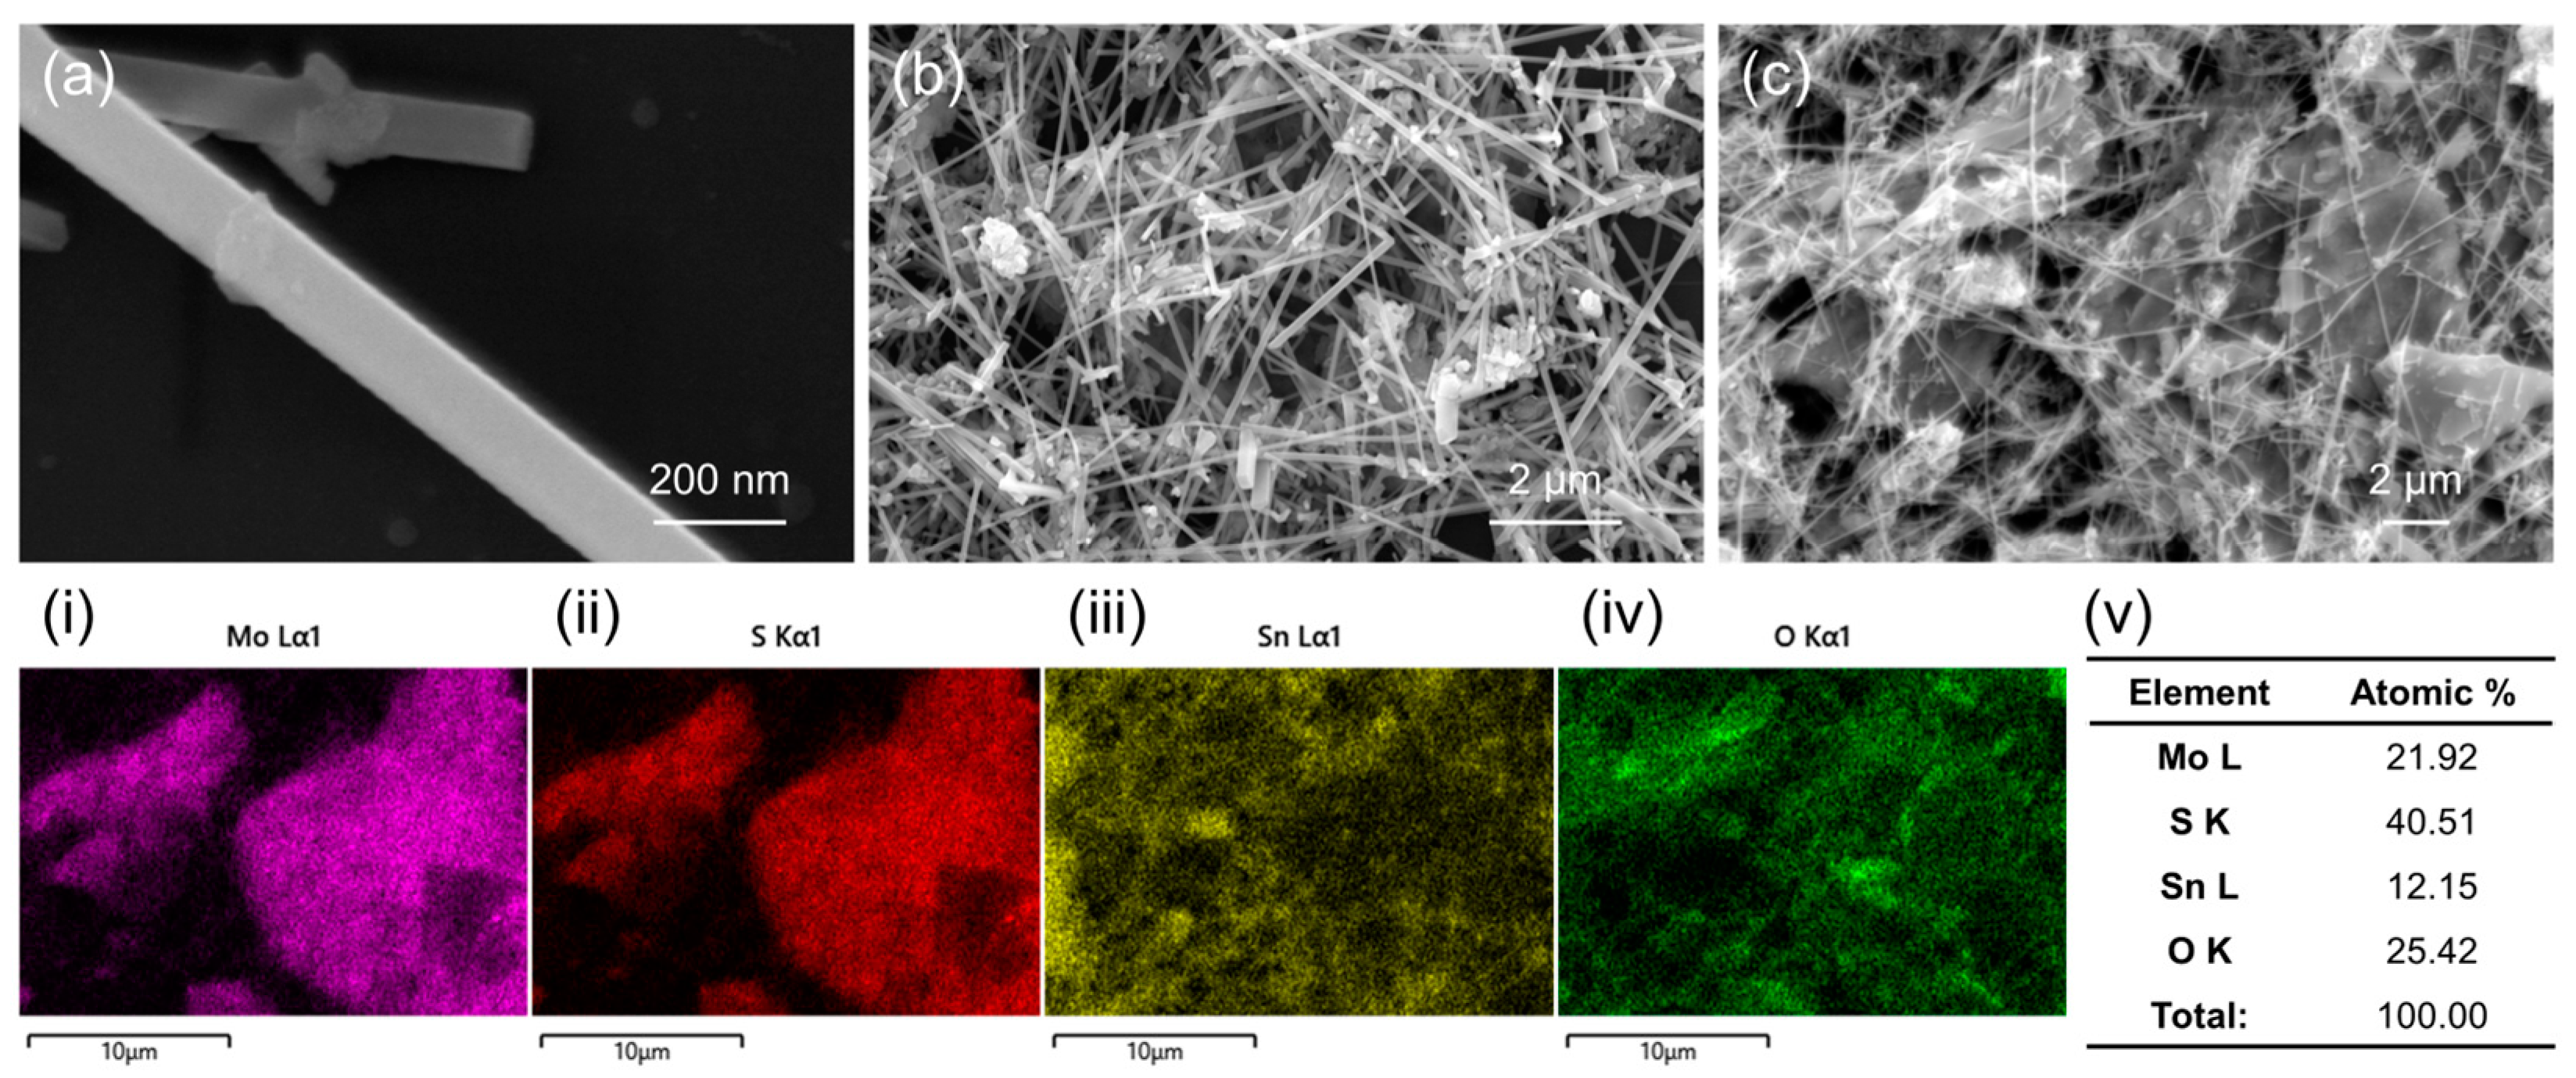
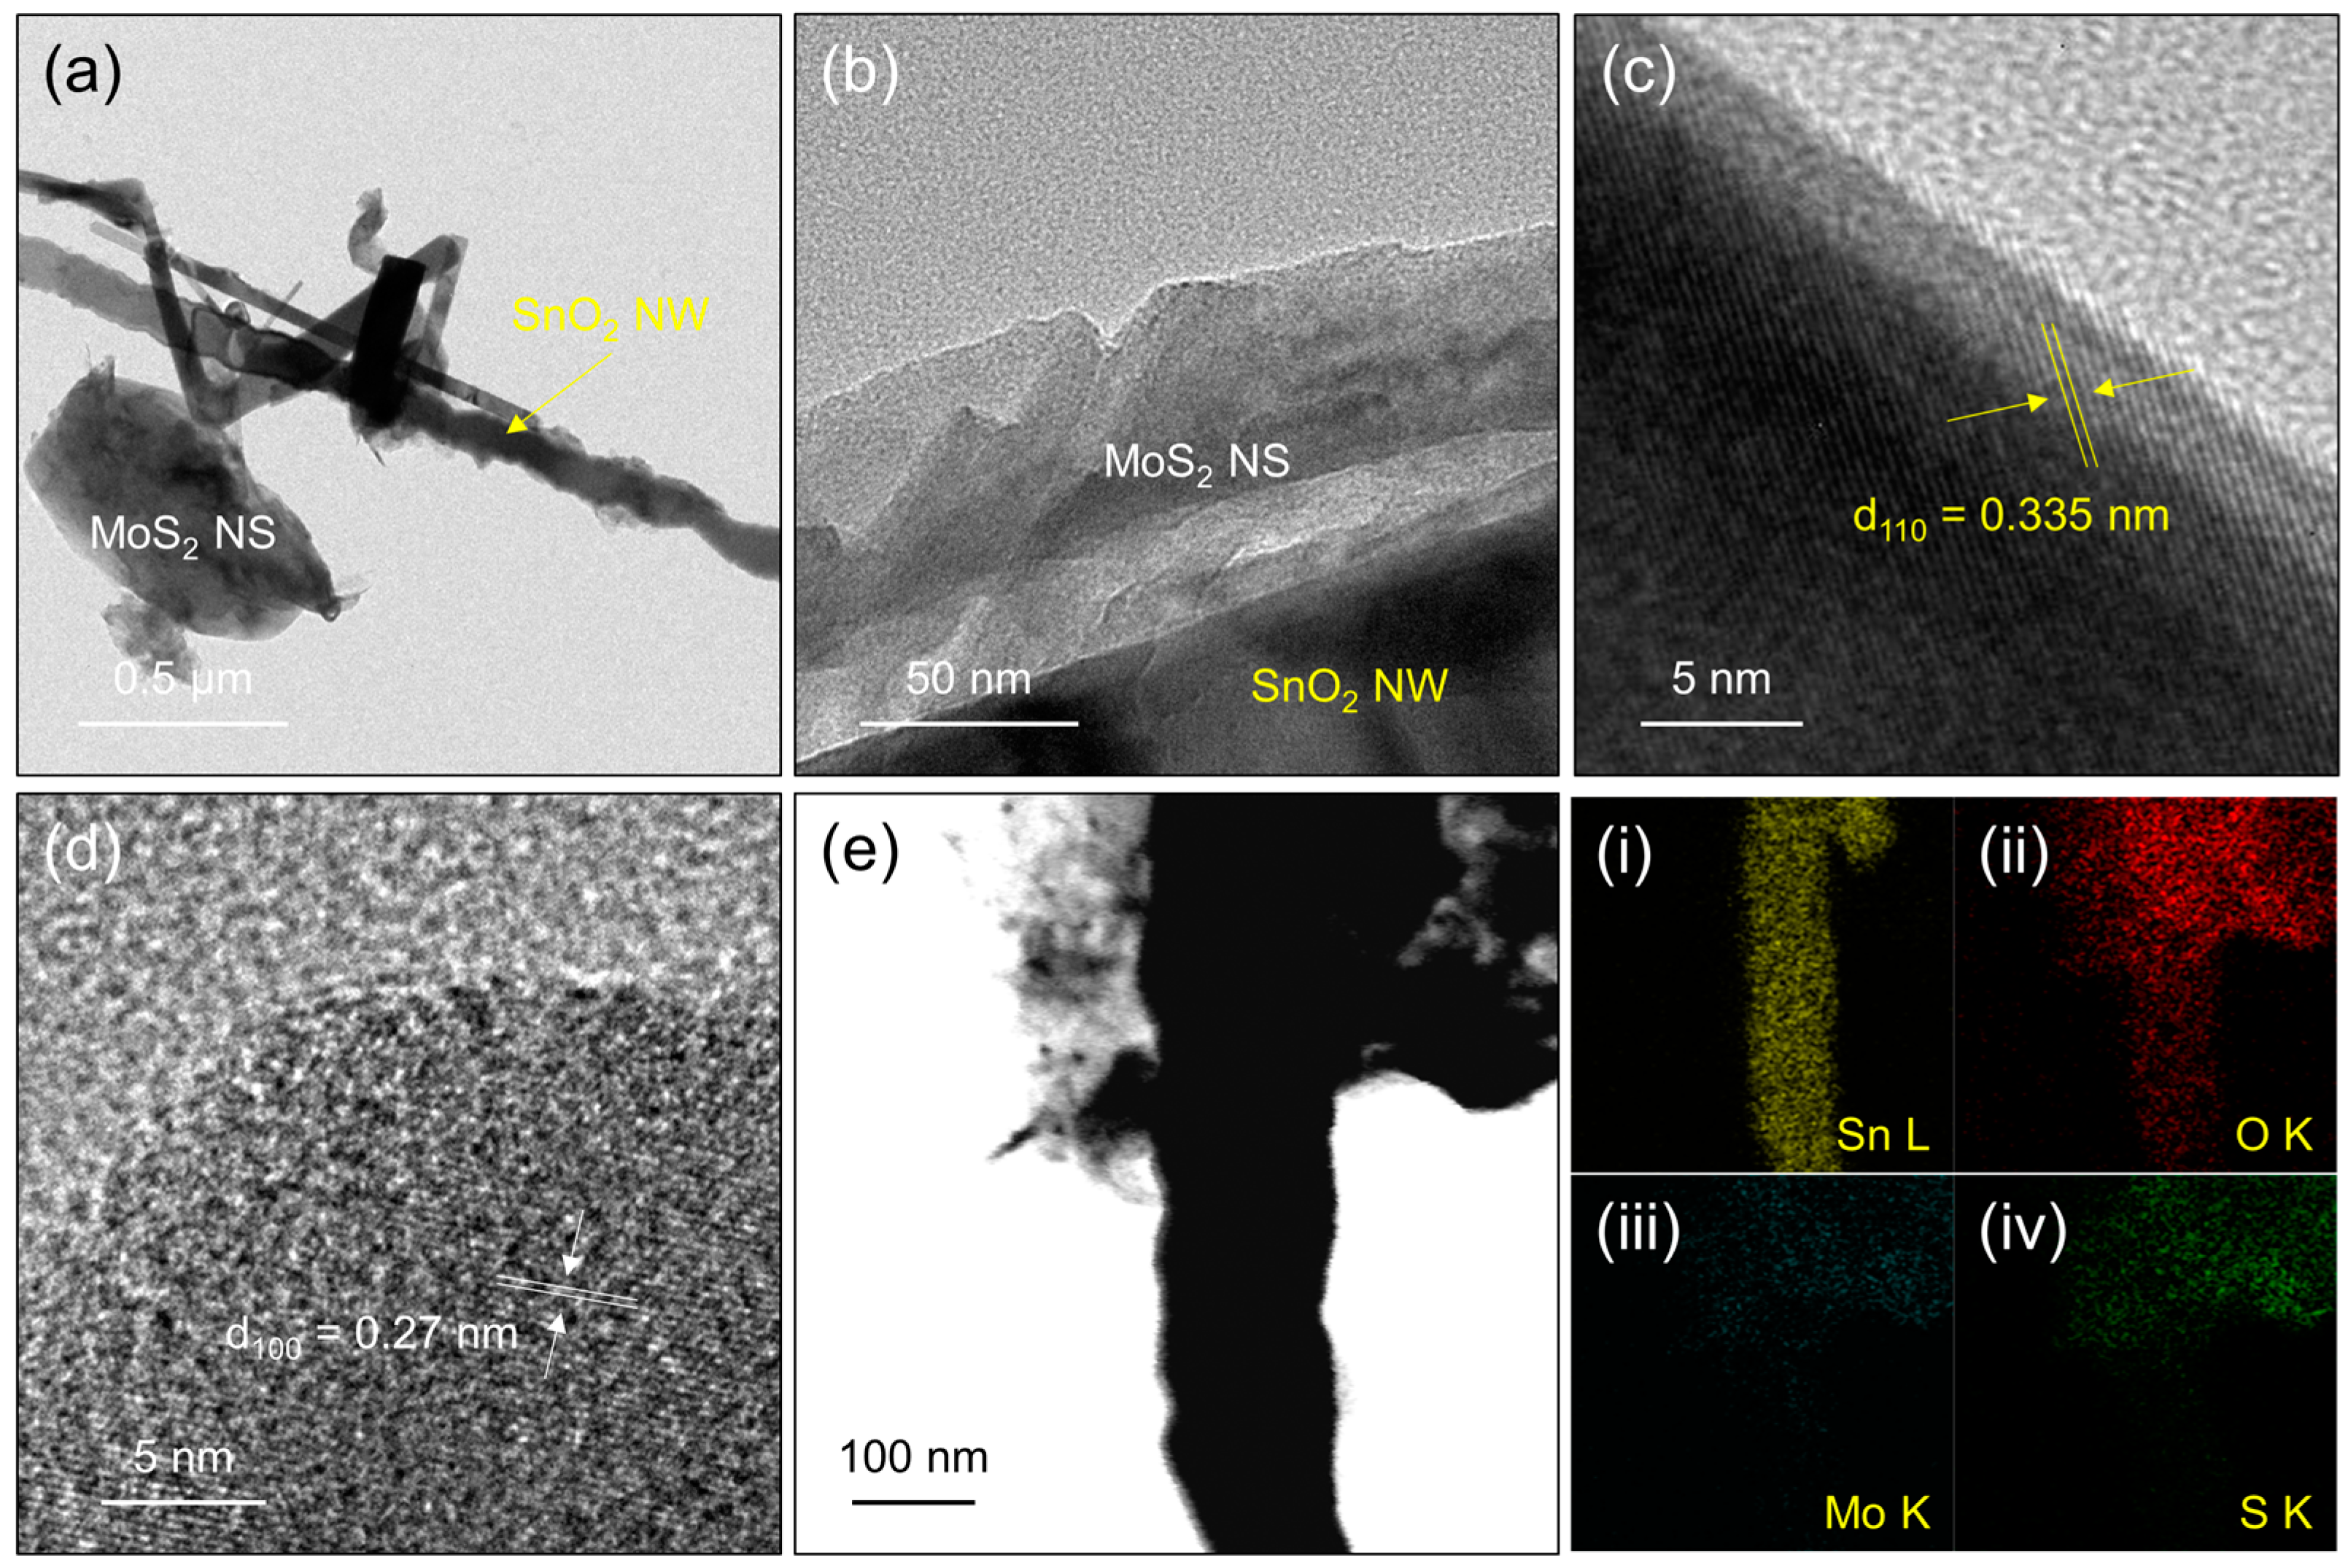
3.1. Characterization Studies

Figure S2a–c present low-magnification SEM images of pristine SnO2, pristine MoS2, and SM-20 nanocomposite samples, respectively. SnO2 NWs are densely packed, while MoS2 are loosely packed. Also, the SM-20 nanocomposite is comprised of both SnO2 NWs and MoS2 NSs with some voids among different components.
Figure 2a–c display SEM images of the SM-20 composite. In the high-magnification image (Figure 2a), the diameter of SnO2 NWs is approximately 60–100 nm. Furthermore, in the lower-magnification images (Figure 2b,c), the formation of a nanocomposite comprising NSs and NWs is demonstrated. Due to the 1D morphology of SnO2 NWs and 2D morphology of MoS2 NSs, there are some voids among them, which are advantageous for the diffusion of gases. SEM-TEM EDS mapping analysis of different elements, namely Mo (panel i), S (panel ii), Sn (panel iii), and O (panel iv), shows that the composition of NSs is MoS2 and the composition of NWs is SnO2. SEM-EDS compositional analysis is presented in panel v of Figure 2. The amounts of Mo, S, Sn, and O elements were 21.92, 40.51, 12.15, and 25.42 at.%, respectively.
Figure 3a,b show TEM views of the SM-20 nanocomposite at two different magnifications. Both MoS2 NSs and SnO2 NWs co-exist in the composite. High-resolution TEM (HRTEM) images of the SM-20 nanocomposite are shown in Figure 3c,d. The spacings between the parallel fringes are 0.335 and 0.27 nm, which correspond to (110) and (100) crystalline planes of SnO2 and MoS2, respectively [49,50]. TEM-EDS elemental mapping is presented in Figure 3e, panel i–iv. Based on the distribution of Sn, O, Mo, and S in panel i–iv of Figure 3, the NW morphology is mainly composed of Sn and O and, therefore, has a composition of SnO2, whereas NSs have an MoS2 composition. Figure S3a shows the XPS survey of the SM-20 composite. It shows the signals related to C (ambient carbon), Mo, S, Sn, and O, which demonstrates a high purity of the synthesized SM-20 composite. Figure S3b displays the Mo 3d core-level region of the SM-20 composite, with two main peaks related to Mo 3d3/2 and Mo 3d5/2 at 233.1 and 229.9 eV, respectively, which can be attributed to Mo6+ ions in MoS2 [51]. Additionally, a peak related to S 2s is observed near the Mo 3d peaks. Figure S3c manifests the S 2p core-level region of the SM-20 composite. It is comprised of S 2p1/2 and S 2p3/2 peaks, corresponding to S2− ions in MoS2 [52]. Figure S3d presents the Sn 3d core-level region of the SM-20 composite, where two high-intensity peaks at 495.5 and 487.1 eV with a separation of 8.4 eV belong to Sn 3d3/2 and Sn 3d5/2, respectively, in SnO2 [53]. The O 1s core-level region is also presented in Figure S3e.
Figure S4a–e display the N2 adsorption–desorption curves of different samples. Based on these curves, the surface areas of the pristine MoS2 and pristine SnO2, SM-10, SM20, and SM-30 nanocomposites were samples were 0.65, 1.69, 2.14, 2.32, and 2.67 m2/g, respectively. Therefore, after composite formation, the surface area increased by approximately four times relative to the MoS2 NSs. In addition, it was approximately 1.4 times higher relative to the SnO2 NWs. Thus, the composite sensors are expected to provide more adsorption sites for NO2 gas and a higher response. Also, even though the SM-30 sample has a higher surface area relative to the SM-20 sample, it is expected to show a lower response due to the fact that in the SM-30 sample, more SnO2 NWs are present, which have poorer sensing properties relative to MoS2 at low temperatures.

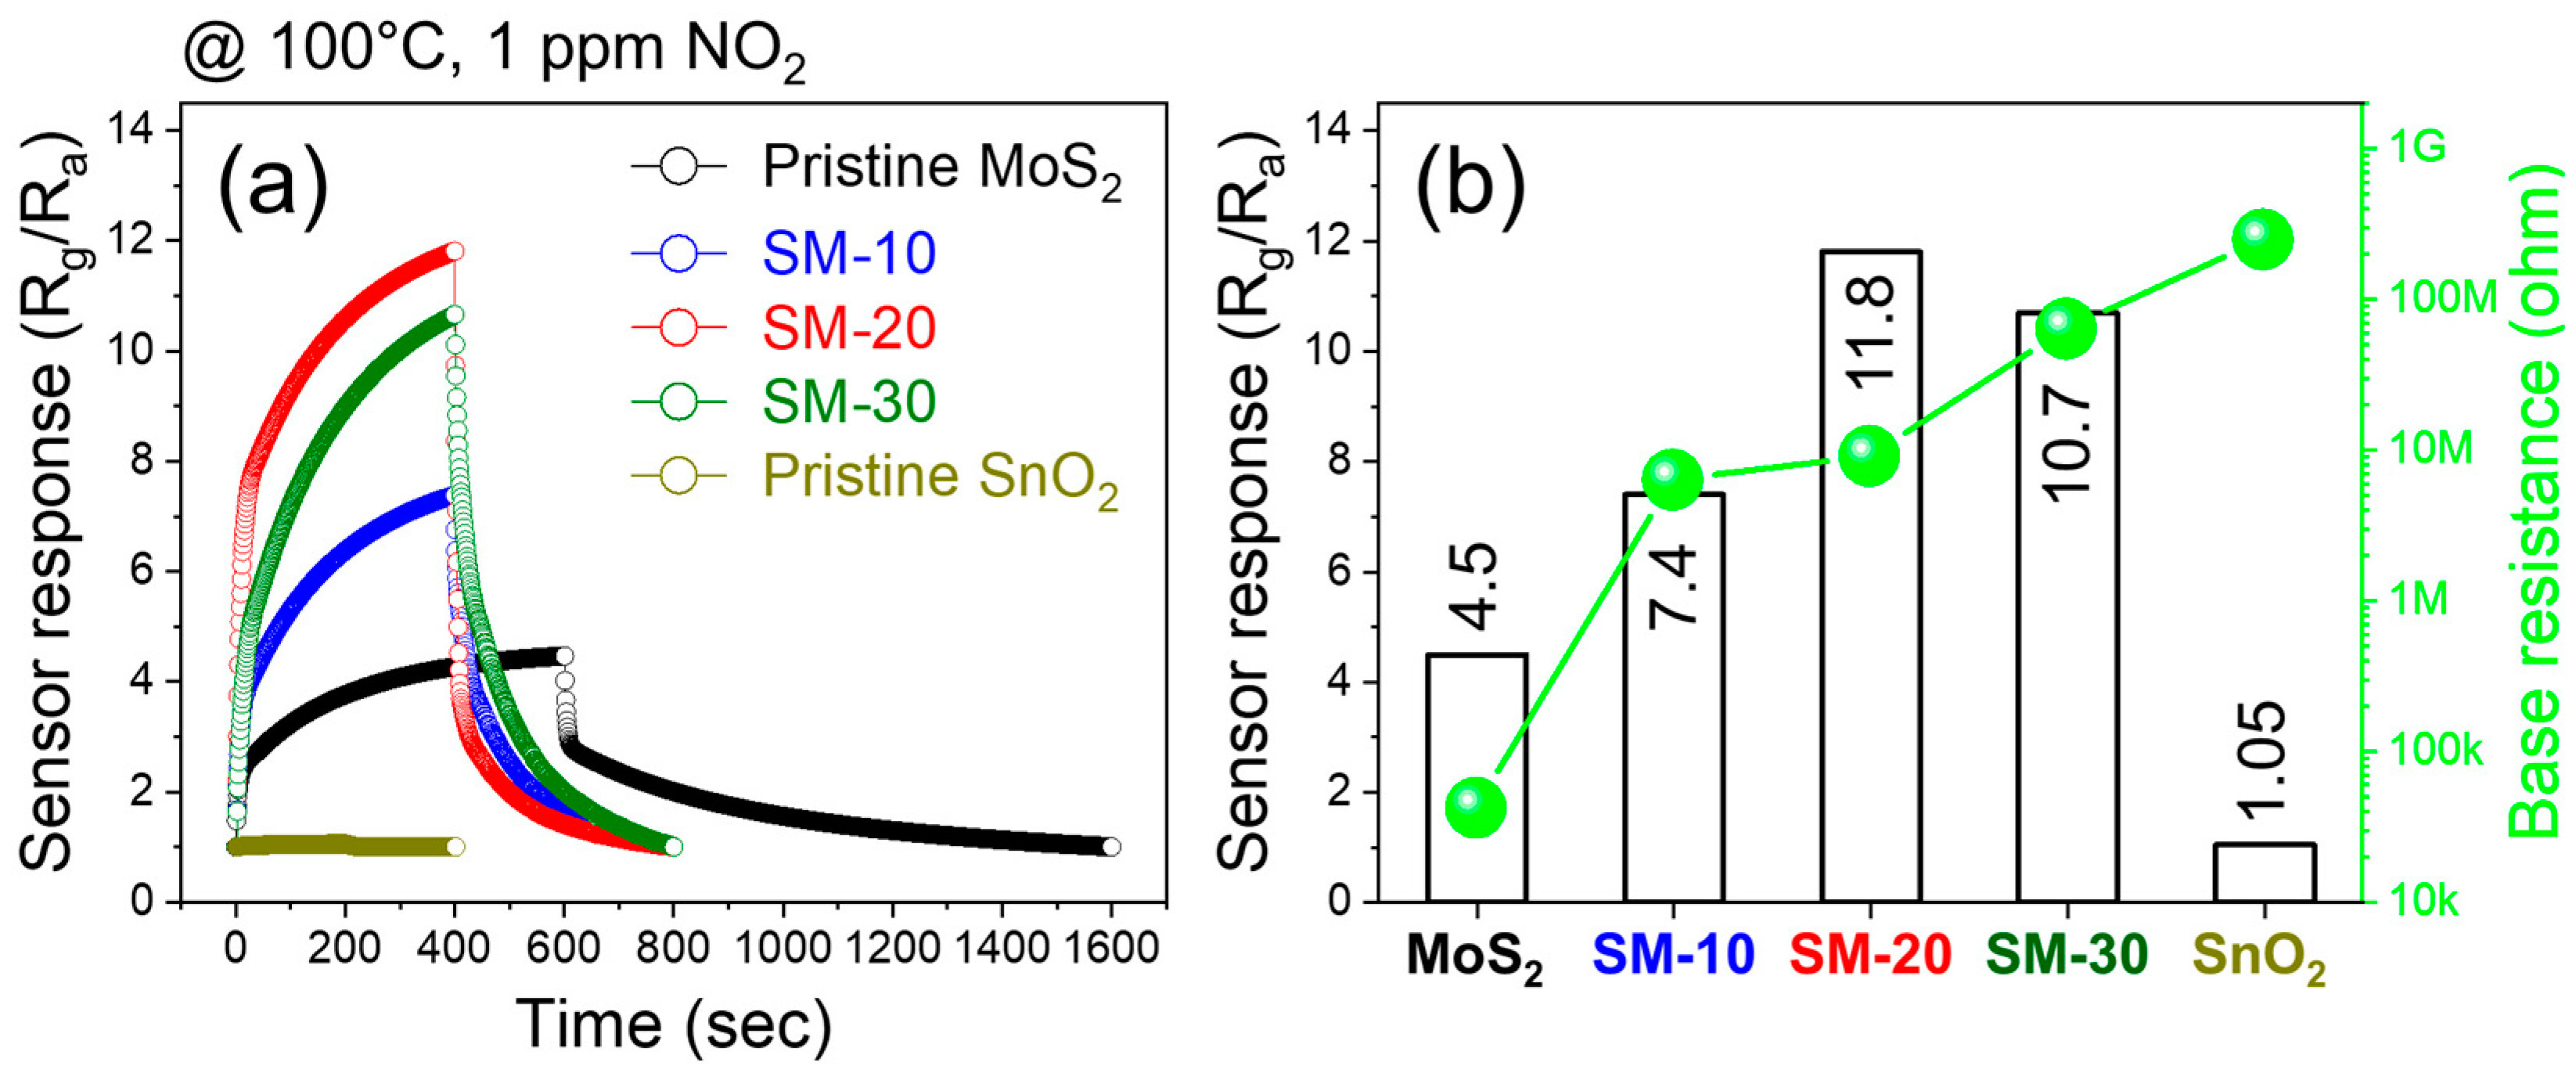
3.2. Gas Sensing Studies

Figure S5a,b exhibit the dynamic resistance and dynamic response plots of the pristine MoS2 NSs gas sensor to 1 ppm NO2 at 25 °C (RH 30%) and higher temperatures (50–150 °C) under 1 V applied voltage, respectively. The resistance increased upon injection of the NO2 gas, revealing the n-type nature of MoS2. For better insight, the corresponding NO2 gas response and baseline resistance versus operating temperature are depicted in Figure S5c. The baseline resistance gradually decreased with increasing temperature due to the jumping of electrons to the conduction band under the influence of temperature. This behavior demonstrates the semiconducting nature of the MoS2 gas sensor. Furthermore, the tracking of response versus temperature shows that the highest response occurs at 100 °C, with a response of 4.5–1 ppm NO2 gas. At lower temperatures, there is insufficient energy for NO2 gas to be sufficiently adsorbed on the sensor surface, and at higher temperatures, the desorption rate surpassed the adsorption rate. At 100 °C, maximum net adsorption occurs, resulting in enhanced gas response. Figure S5d,e show dynamic resistance and response plots of pristine SnO2 NW gas sensors to 1 ppm NO2 at 25 °C (RH 30%) and higher temperatures (50–350 °C) under 1 V applied voltage, respectively. Additionally, the corresponding NO2 gas response and baseline resistance versus operating temperature are plotted in Figure S5f. Similar to the MoS2 NSs gas sensor, the SnO2 NWs gas sensor displays an n-type semiconducting behavior. However, its optimal sensing temperature was at 300 °C, with a high response of 38–1 ppm NO2 gas. Therefore, although the optimal sensing temperature (100 °C) of the MoS2 NSs sensor was lower relative to that of the SnO2 NWs gas sensor (300 °C), the response of the SnO2 NWs sensor (Rg/Ra = 38) was almost eight times that of the MoS2 NSs gas sensor (Rg/Ra = 4.5). Conversely, at 100 °C, which is considered a low temperature for sensors, the response of the MoS2 NSs sensor (Rg/Ra = 4.5) was more than four times higher than that of the SnO2 NWs gas sensor (Rg/Ra = 1.05). This implies that to achieve high-performance gas sensors at low temperatures, the presence of only SnO2 NWs is insufficient, and they should be used in combination with other materials, such as MoS2, which have better sensing properties at low temperatures.
In the next step, we explored the NO2 gas-sensing features of all fabricated gas sensors at 100 °C. Figure 4a displays the dynamic response curves of different gas sensors to 1 ppm NO2 gas at 100 °C, and Figure 4b compares the response and baseline values of different gas sensors. The SnO2 NWs gas sensor showed the lowest response of 1.05, whereas the response of the MoS2 NSs gas sensor was 4.5. The responses of the SM-10, SM-20, and SM-30 sensors to 1 ppm NO2 gas were 7.4, 11.8, and 10.7, respectively. Thus, all composite gas sensors exhibited a higher response than both the SnO2 and MoS2 gas sensors alone. In addition, among all gas sensors, the SM-20 composite exhibited the highest response; hence, it was selected for further study. In addition, the resistance of the gas sensors increased with increasing SnO2 content, and pure MoS2 and SnO2 sensors exhibited the lowest and highest baseline resistances, respectively. Next, we exposed the SM-20 composite gas sensor to 1 ppm NO2 gas at different applied voltages (1–3.5 V), as shown in Figure 5a. Figure 5b plots the response as a function of voltage. The response gradually increased with the applied voltage, and the maximum response occurred at 3.2 V. Thus, the optimal applied voltage was 3.2 V, and subsequent experiments were performed under this applied voltage.
Figure 6a shows the dynamic normalized resistance curves of the SM-20 sensor at low concentrations of various gases at a fixed 3.2 V. The corresponding selectivity histogram is presented in Figure 6b. The responses to 1000 ppb NO2, SO2, CO, and C3H6O were 13, 2, 1.9, and 2, respectively. Thus, the sensor exhibited a much higher response to NO2 gas than to other gases, demonstrating its high selectivity towards NO2 gas. To check the reproducibility of the optimal sensor, we prepared three gas sensors under the same experimental procedures and checked their selectivity behavior, as shown in Figure S6a–c. All fabricated sensors revealed almost the same sensing response towards different gases, as shown in Figure S6d. Thus, the reproducibility of the sensor was demonstrated. In addition, the sensor exhibited a linear calibration curve for the detection of ppb levels of NO2 gas (Figure 6c). Based on extrapolation to the y-axis, the experimental detection limit was 15 ppb, which was close to the theoretically calculated (Text S1 in Supporting Information) LOD (17.9). Figure 6d exhibits the sensing graphs (five cycles) of the SM-20 composite sensor in the fresh state and after three months of exposure to 1 ppm NO2 gas at 3.2 V, and Figure 6e compares the responses in the fresh state and after three months. Overall, negligible differences were observed in the responses, even after three months. To be more quantitative, the average response and standard deviation of the sensor in the fresh state were 12.6 and 0.525, respectively, and those parameters for the sensor after three months were 12.52 and 0.386, respectively. If we define the stability factor as the average response after three months to the average response in the fresh state, it is 12.52/12.6 = 0.99. This demonstrates the good long-term stability of the sensor.
Finally, we explored the response of the SM-20 composite sensor at 80% RH (Figure 6f). The response to 1 ppm NO2 gas at 3.2 V under dry conditions was 12.6, which decreased to 11.4 under humid (80% RH) conditions. Thus, although the response decreased in a humid environment, the sensor still exhibited a high response. In humid conditions, H2O molecules are adsorbed on the sensor surface, limiting the number of available adsorption sites. Therefore, a smaller amount of NO2 gas can be adsorbed onto the sensor surface, bringing about a decrease in the sensor response in humid atmospheres [54].
Table 1 compares the NO2 gas-sensing properties of present work with those obtained in other studies, which demonstrates good performance of present sensor.

3.3. Gas-Sensing Mechanism

Initially, when the fresh sensors are in the air, oxygen gas is adsorbed on the sensor surface; because of the high electron affinity of oxygen, it takes electrons from the conduction band of the sensing material as follows [67].
O 2 ( g ) O 2 ( a d s )
O 2 ( a d s ) + e O 2   ( a d s )   T < 150   ° C
O 2   a d s + e 2 O   150   ° C < T < 300   ° C
2 O + e O 2   T > 300   ° C
Hence, at room temperature and at 300 °C, dominant oxygen species are O 2   and O , respectively. The depletion of electrons from the exposed surfaces of the sensing layer with n-type semiconducting nature leads to the appearance of an electron depletion layer (EDL), where the concentration of electrons is lower than that in the core regions, resulting in the high resistance of n-type sensors in air. Upon exposure to NO2 gas, which is an oxidizing gas, more electrons are abstracted from the sensing layer as follows [8].
N O 2 ( g ) N O 2 ( a d s )
N O 2 ( a d s ) + e N O 2 ( a d s )
N O 2 ( a d s ) + O N O 2 ( a d s ) + 1 / 2 O 2 ( g )
Consequently, the EDL width increases in the presence of NO2, which brings about the higher resistance of the sensor in the presence of NO2 gas. However, both pristine SnO2 and MoS2 sensors revealed a low response at 100 °C due to limited sources of resistance modulation. All composite sensors exhibited a higher response to NO2 than the pristine sensors, which could be related to the presence of n-n heterojunctions in the composite sensors. Figure 7a shows side views of MoS2 NSs and the SM-20 composite on the substrate. In the composite sensor, it is expected that SnO2 NWs bridge among MoS2 NSs owing to the lower amount of SnO2 NWs relative to MoS2 NSs; hence, numerous n-n heterojunctions were created. Figure S7a presents the UPS spectra of the MoS2 NSs and SnO2 NWs. Based on energy-cut-off values and procedure reported in [68], the work functions of MoS2 and SnO2 were calculated to be 4.82 and 4.37 eV, respectively.
Accordingly, we constructed their energy band levels, as shown in Figure S7b. Owing to the difference between the work functions of SnO2 and MoS2, upon intimate contact, the electrons were moved from SnO2 to MoS2 to equate the Fermi levels on both sides of the contact. This led to band bending and the formation of n-n heterojunction barriers in the air. Furthermore, due to the flow of electrons to MoS2, which acts as the main sensing material, the thickness of the EDL on MoS2 was smaller than that of the pristine MoS2 sensor (Figure 7b). Accordingly, more electrons are available for extraction by NO2 gas; hence, higher resistance modulation is expected. In addition, when the composite sensors were exposed to NO2, more electrons were abstracted from the sensor surface, and the height of the heterojunction barriers further increased, which eventually led to an increase in resistance in the presence of NO2 gas, contributing to the sensing signal. Thus, the presence of numerous heterojunctions in composite gas sensors is beneficial for NO2 gas sensing. Therefore, the SM-20 composite exhibited a higher response than the SM-10 composite sensor.
However, a further increase in SnO2 content decreased the sensor response, which could be related to the agglomeration of SnO2 NWs, a decrease in the number of n-MoS2/n-SnO2 heterojunctions, and a simultaneous increase in the number of SnO2-SnO2 homojunctions. Additionally, as the amount of SnO2 is increased, the amount of MoS2 NSs that are better sensing materials at 100 °C is simultaneously decreased. In other words, the contribution of SnO2 NWs with interferer sensing response at 100 °C may be significant in the CM-30 nanocomposite sensor, resulting in a decrease in the overall performance. In addition to the formation of heterojunctions, the higher surface area of the composite gas sensors and the presence of voids between the SnO2 NWs and MoS2 NSs were beneficial for the diffusion and migration of NO2 gas molecules. Owing to the combination of 1D SnO2 NWs with 2D MoS2 NSs, some voids were created among them, which acted as channels for the high diffusion of NO2 gas into deeper parts of the sensor.
High selectivity to NO2 gas can be related to (i) the high electron affinity of NO2 gas (2.28 eV) compared to oxygen (0.43 eV), which can directly abstract electrons on the sensor surface, whereas other gases must react with adsorbed oxygen species to generate a sensing signal [69], (ii) the presence of N in NO2 gas with an unpaired electron, which can bond with the sensor surface [70], and (iii) the relatively low bond energy of O–NO (305.0 kJ/mol) in NO2, which improves the response to NO2 [71].
During the operation of the gas sensors in self-heating mode, electrons accelerate owing to the application of voltage, and on their pathways, they lose their high kinetic energies as heat after collision with other electrons, ions, and atoms in a process known as the Joule heating effect. Figure S7a manifests the induced temperatures of the MoS2 NSs, SnO2 NWs, and SM-20 composite gas sensor versus applied voltage. Among them, the temperature of the SM-20 composite sensor was higher at a fixed applied voltage, demonstrating the presence of more sources of heat generation inside the sensor owing to the contact areas between the MoS2 NSs and SnO2 NWs, which acted as powerful sources of Joule heating (Figure 7c). Figure S7b shows the induced temperature of the SM-20 composite as a function of applied voltage in the range of 1–3.5 V. Under 1, 1.5, 2, 2.5, 3, 3.1, 3.2, 3.3, 3.4, and 3.5 V applied voltage, the induced temperature values were 38, 55, 71, 88, 106, 110, 114, 118, 122, and 126 °C, respectively. Therefore, under the optimal applied voltage of 3.2 V, a sufficiently high temperature was induced inside the sensor, which was sufficient to activate the adsorption and reaction of NO2 gas on the sensor surface. Under optimal sensing temperature and voltage, the power consumption (V2/R) of MoS2 NSs (100 °C, 1 V), SnO2 NWs (300 °C, 1 V), and SM-20 nanocomposite (RT, 3.2 V) sensors were calculated to be = 23.6, 0.2, and 1.3 µW, respectively. Despite the low power consumption of the SnO2 NW gas sensor (0.2 µW), an increase in the temperature to 300 °C using external heating will result in significant power consumption, as an external heater is required to maintain this high temperature. For example, if an external heater uses 5 V to increase the sensor temperature to 300 °C, the power consumption will be 5.2 µW. Therefore, the SM-20 nanocomposite gas sensor showed the lowest power consumption in this study.

4. Conclusions

Briefly, we introduced self-heated NO2 gas sensors based on SnO2 NWs/MoS2 NSs composites. SnO2 NWs were synthesized via a VLS mechanism, and then 10, 20, and 30 wt.% SnO2 NWs were composited with MoS2 NSs. Different characterization techniques, such as SEM/TEM and EDS, demonstrated the formation of nanocomposites with desired compositions. Also, some voids were presented among NWs and NSs, which were beneficial for efficient gas diffusion. Different voltages were applied on the sensor electrodes in self-heating mode, and the SM-20 composite, with 20 wt% SnO2 NWs, showed the highest response of 13 to 0.1 ppm NO2 gas at 3.2 V applied voltage. Furthermore, the optimal sensor revealed selectivity, long-term stability, reproducibility, and repeatability. The improved sensing performance was attributed to the generation of n-SnO2/n-MoS2 heterojunctions, which acted as sources of resistance modulation, high surface area due to the NW and NS nature of SnO2 and MoS2 materials, respectively, along with the presence of voids in the SM-20 composite sensor. The present strategy, which combines the gas sensing properties of SnO2 and MoS2 with 1D and 2D morphologies, is a promising approach to boost the sensing features of the resultant gas sensor.

Supplementary Materials

The following supporting information can be downloaded at: https://www.mdpi.com/article/10.3390/chemosensors12060107/s1, Text S1: Calculation of limit of detection; Figure S1: (a,b) Digital images of fabricated sensor; Figure S2: SEM images of (a) SnO2 NW, (b) MoS2 NSs, and (c) SM-20 nanocomposite; Figure S3: (a) XPS survey of SM-20 composite. XPS core-level regions of (b) Mo 3d, (c) S 2p, (d) Sn 3d, and (e) O 1s; Figure S4: N2 adsorption–desorption isotherms of (a) MoS2 NSs, (b) SnO2 NWs, (c) SM-10, (d) SM-20, and (e) SM-30 nanocomposite; Figure S5: Dynamic resistance and dynamic response plots of pristine MoS2 NS gas sensor to 1 ppm NO2 at (a) 25 °C and (b) different temperature (50–150 °C) under 1 V applied voltage. (c) Corresponding NO2 gas response and baseline resistance versus operating temperature. Dynamic resistance plots of pristine SnO2 NW gas sensors to 1 ppm NO2 at (d) 25 °C and (e) different temperatures (50–350 °C) under 1 V applied voltage. (f) Corresponding NO2 gas response and baseline resistance versus operating temperature; Figure S6. Reproducibility tests of three SM-20 gas sensors prepared under the same conditions. Sensing performance of SM-20 gas sensor (a) number 1, (b) number 2, and (c) number 3 (a) to low concentrations of various gases at fixed 3.2 V. (d) Corresponding selectivity histograms of three gas sensors; Figure S7: (a) UPS spectra and energy cut-off values of MoS2 NSs and SnO2 NWs. (b) Energy band levels of MoS2 NSs and SnO2 NWs before and after intimate contact; Figure S8: (a) Sensor temperature versus applied voltage for different gas sensors. (b) Temperature of SM-20 gas sensor versus applied voltage in the range of 1 to 3.5 V.

Author Contributions

Investigation, data curation, writing—original draft preparation, writing—review and editing, J.-Y.K.; writing—original draft preparation, writing—review and editing, supervision, A.M.; conceptualization, validation, formal analysis, investigation, writing—original draft preparation, writing—review and editing, visualization, supervision, funding acquisition, J.-H.K. All authors have read and agreed to the published version of the manuscript.

Funding

This work was supported by INHA UNIVERSITY Research Grant.

Institutional Review Board Statement

Not applicable.

Informed Consent Statement

Not applicable.

Data Availability Statement

Data will be made available upon request.

Conflicts of Interest

The authors declare no conflicts of interest.

References

  1. Liu, F.; Zhang, L.; Zhang, C.; Chen, Z.; Li, J. Impact of NO2 Emissions from Household Heating Systems with Wall-Mounted Gas Stoves on Indoor and Ambient Air Quality in Chinese Urban Areas. Sci. Total Environ. 2024, 908, 168075. [Google Scholar] [CrossRef]
  2. Jion, M.M.M.F.; Jannat, J.N.; Mia, M.Y.; Ali, M.A.; Islam, M.S.; Ibrahim, S.M.; Pal, S.C.; Islam, A.; Sarker, A.; Malafaia, G.; et al. A Critical Review and Prospect of NO2 and SO2 Pollution over Asia: Hotspots, Trends, and Sources. Sci. Total Environ. 2023, 876, 162851. [Google Scholar] [CrossRef] [PubMed]
  3. Bai, H.; Feng, C.; Guo, H.; Li, X.; Liu, W.; Feng, Y.; Liu, K.; Chen, D.; Zheng, Y.; Guo, F. UV-Activated CuO Nanospheres Modified with rGO Nanosheets for Ppb-Level Detection of NO2 Gas at Room Temperature. Sens. Actuators B Chem. 2023, 393, 134195. [Google Scholar] [CrossRef]
  4. Peng, H.; Yang, J.; Lin, C.; Qi, L.; Li, L.; Shi, K. Gas-Sensitive Performance of Metal-Organic Framework-Derived CuO NPs/Ti3C2TX MXene Heterostructures for Efficient NO2 Detection at Room Temperature. J. Alloys Compd. 2024, 980, 173657. [Google Scholar] [CrossRef]
  5. Gao, J.; Yin, Y.; Guo, Y.; Jia, L.; Xia, F.; Liu, C.; Hou, M.; Wang, F. Synthesis of Ti3C2Tx Nanosheets / ZnO Nanowires Composite Material for NO2 Gas Sensing. Arab. J. Chem. 2024, 17, 105776. [Google Scholar] [CrossRef]
  6. Feng, Z.; Wang, H.; Zhang, Y.; Han, D.; Cheng, Y.; Jian, A.; Sang, S. ZnO/GaN n-n Heterojunction Porous Nanosheets for Ppb-Level NO2 Gas Sensors. Sens. Actuators B Chem. 2023, 396, 134629. [Google Scholar] [CrossRef]
  7. Brophy, R.E.; Junker, B.; Fakhri, E.A.; Árnason, H.Ö.; Svavarsson, H.G.; Weimar, U.; Bârsan, N.; Manolescu, A. Ultra Responsive NO2 Silicon Nanowires Gas Sensor. Sens. Actuators B Chem. 2024, 410, 135648. [Google Scholar] [CrossRef]
  8. Shin, K.Y.; Mirzaei, A.; Oum, W.; Kim, E.B.; Kim, H.M.; Moon, S.; Kim, S.S.; Kim, H.W. Enhanced NO2 Gas Response of ZnO–Ti3C2Tx MXene Nanocomposites by Microwave Irradiation. Sens. Actuators B Chem. 2024, 409, 135605. [Google Scholar] [CrossRef]
  9. Mokrushin, A.S.; Gorban, Y.M.; Averin, A.A.; Gorobtsov, P.Y.; Simonenko, N.P.; Lebedinskii, Y.Y.; Simonenko, E.P.; Kuznetsov, N.T. Obtaining of ZnO/Fe2O3 Thin Nanostructured Films by AACVD for Detection of Ppb-Concentrations of NO2 as a Biomarker of Lung Infections. Biosensors 2023, 13, 445. [Google Scholar] [CrossRef]
  10. Qin, H.; Xie, J.; Xu, H.; Li, Y.; Cao, Y. Green Solid-State Chemical Synthesis and Excellent Xylene-Detecting Behaviors of Y-Doped α-MoO3 Nanoarrays. Mater. Res. Bull. 2017, 93, 256–263. [Google Scholar] [CrossRef]
  11. Hussain, S.; Amu-Darko, J.N.O.; Wang, M.; Alothman, A.A.; Ouladsmane, M.; Aldossari, S.A.; Khan, M.S.; Qiao, G.; Liu, G. CuO-Decorated MOF Derived ZnO Polyhedral Nanostructures for Exceptional H2S Gas Detection. Chemosphere 2023, 317, 137827. [Google Scholar] [CrossRef] [PubMed]
  12. Joseph, S.; Mohan, J.; Lakshmy, S.; Thomas, S.; Chakraborty, B.; Thomas, S.; Kalarikkal, N. A Review of the Synthesis, Properties, and Applications of 2D Transition Metal Dichalcogenides and Their Heterostructures. Mater. Chem. Phys. 2023, 297, 127332. [Google Scholar] [CrossRef]
  13. Krishna, S.; Choi, S.H.; Kim, S.M.; Kim, K.K. Sapphire Substrates for Large-Area 2D Transition Metal Dichalcogenides Synthesis: A Brief Review. Curr. Appl. Phys. 2024, 59, 208–213. [Google Scholar] [CrossRef]
  14. Guan, L.; Chen, Z.; Liu, Y.; Wang, R.; Yan, K.; Xu, Z.; Li, J.; Liu, Z.; Li, J.; Liu, H. Engineering Sulfur-Rich MoS2 Adsorbent with Abundant Unsaturated Coordination Sulfur Sites for Gaseous Mercury Capture from High-Concentration SO2 Smelting Flue Gas. Chem. Eng. J. 2024, 483, 149122. [Google Scholar] [CrossRef]
  15. Yan, Y.; Zhang, K.; Qin, G.; Gao, B.; Zhang, T.; Huang, X.; Zhou, Y. Phase Engineering on MoS2 to Realize Dielectric Gene Engineering for Enhancing Microwave Absorbing Performance. Adv. Funct. Mater. 2024, 34, 2316338. [Google Scholar] [CrossRef]
  16. Yang, D.-H.; Kim, J.-H.; Mirzaei, A.; Kim, H.W.; Kim, S.S. Co-Decoration of WS2 Nanosheets with Both Au and In2O3-Nanoparticles for Attaining the CO Sensing in Self-Heating Mode. Appl. Surf. Sci. 2023, 635, 157790. [Google Scholar] [CrossRef]
  17. Wang, T.; Liu, G.; Zhang, D.; Wang, D.; Chen, F.; Guo, J. Fabrication and Properties of Room Temperature Ammonia Gas Sensor Based on SnO2 Modified WSe2 Nanosheets Heterojunctions. Appl. Surf. Sci. 2022, 597, 153564. [Google Scholar] [CrossRef]
  18. Pramanik, M.; Jana, B.; Ghatak, A.; Das, K. Improvement in Efficiency of MoS2 Nanoflower Based Ethylene Gas Sensor on Transition Metal Doping: An Experimental and Theoretical Investigation. Mater. Chem. Phys. 2024, 314, 128892. [Google Scholar] [CrossRef]
  19. Kodan, S.; Kumar, A.; Sanger, A.; Arora, A.; Malik, V.K.; Chandra, R. Vertically Aligned MoSe2-WS2 Nanoworms Heterojunction towards Room Temperature NO2 Gas Sensors. Sens. Actuators B Chem. 2024, 407, 135481. [Google Scholar] [CrossRef]
  20. Kumar, S.; Mirzaei, A.; Kumar, A.; Lee, M.H.; Ghahremani, Z.; Kim, T.-U.; Kim, J.-Y.; Kwoka, M.; Kumar, M.; Kim, S.S.; et al. Nanoparticles Anchored Strategy to Develop 2D MoS2 and MoSe2 Based Room Temperature Chemiresistive Gas Sensors. Coord. Chem. Rev. 2024, 503, 215657. [Google Scholar] [CrossRef]
  21. Chen, P.; Hu, J.; Yin, M.; Bai, W.; Chen, X.; Zhang, Y. MoS2 Nanoflowers Decorated with Au Nanoparticles for Visible-Light-Enhanced Gas Sensing. ACS Appl. Nano Mater. 2021, 4, 5981–5991. [Google Scholar] [CrossRef]
  22. Burman, D.; Raha, H.; Manna, B.; Pramanik, P.; Guha, P.K. Substitutional Doping of MoS2 for Superior Gas-Sensing Applications: A Proof of Concept. ACS Sens. 2021, 6, 3398–3408. [Google Scholar] [CrossRef] [PubMed]
  23. Le, V.T.; Vasseghian, Y.; Doan, V.D.; Nguyen, T.T.T.; Vo, T.-T.T.; Do, H.H.; Vu, K.B.; Vu, Q.H.; Lam, T.D.; Tran, V.A. Flexible and High-Sensitivity Sensor Based on Ti3C2–MoS2 MXene Composite for the Detection of Toxic Gases. Chemosphere 2022, 291, 133025. [Google Scholar] [CrossRef] [PubMed]
  24. Singh, S.; Sattigeri, R.M.; Kumar, S.; Jha, P.K.; Sharma, S. Superior Room-Temperature Ammonia Sensing Using a Hydrothermally Synthesized MoS2/SnO2 Composite. ACS Omega 2021, 6, 11602–11613. [Google Scholar] [CrossRef] [PubMed]
  25. Miller, D.R.; Akbar, S.A.; Morris, P.A. Nanoscale Metal Oxide-Based Heterojunctions for Gas Sensing: A Review. Sens. Actuators B Chem. 2014, 204, 250–272. [Google Scholar] [CrossRef]
  26. Hassun, H.K.; Hussein, B.H.; Salman, E.M.T.; Shaban, A.H. Photoelectric Properties of SnO2: Ag/P–Si Heterojunction Photodetector. Energy Rep. 2020, 6, 46–54. [Google Scholar] [CrossRef]
  27. Yamazoe, N.; Sakai, G.; Shimanoe, K. Oxide Semiconductor Gas Sensors. Catal. Surv. Asia 2003, 7, 63–75. [Google Scholar] [CrossRef]
  28. Kong, Y.; Li, Y.; Cui, X.; Su, L.; Ma, D.; Lai, T.; Yao, L.; Xiao, X.; Wang, Y. SnO2 Nanostructured Materials Used as Gas Sensors for the Detection of Hazardous and Flammable Gases: A Review. Nano Mater. Sci. 2022, 4, 339–350. [Google Scholar] [CrossRef]
  29. Meng, X.; Bi, M.; Xiao, Q.; Gao, W. Ultra-Fast Response and Highly Selectivity Hydrogen Gas Sensor Based on Pd/SnO2 Nanoparticles. Int. J. Hydrogen Energy 2022, 47, 3157–3169. [Google Scholar] [CrossRef]
  30. Lee, J.H.; Park, M.S.; Jung, H.; Choe, Y.-S.; Kim, W.; Song, Y.G.; Kang, C.-Y.; Lee, H.-S.; Lee, W. Selective C2H2 Detection with High Sensitivity Using SnO2 Nanorod Based Gas Sensors Integrated with a Gas Chromatography. Sens. Actuators B Chem. 2020, 307, 127598. [Google Scholar] [CrossRef]
  31. Tan, Y.; Zhang, J. Highly Sensitive Ethanol Gas Sensors Based on Co-Doped SnO2 Nanobelts and Pure SnO2 Nanobelts. Phys. E Low-Dimens. Syst. Nanostructures 2023, 147, 115604. [Google Scholar] [CrossRef]
  32. Su, P.; Li, W.; Zhang, J.; Xie, X. Chemiresistive Gas Sensor Based on Electrospun Hollow SnO2 Nanotubes for Detecting NO at the Ppb Level. Vacuum 2022, 199, 110961. [Google Scholar] [CrossRef]
  33. Phuoc, P.H.; Hung, C.M.; Toan, N.V.; Duy, N.V.; Hoa, N.D.; Hieu, N.V. One-Step Fabrication of SnO2 Porous Nanofiber Gas Sensors for Sub-Ppm H2S Detection. Sens. Actuators Phys. 2020, 303, 111722. [Google Scholar] [CrossRef]
  34. Domènech-Gil, G.; Samà, J.; Fàbrega, C.; Gràcia, I.; Cané, C.; Barth, S.; Romano-Rodríguez, A. Highly Sensitive SnO2 Nanowire Network Gas Sensors. Sens. Actuators B Chem. 2023, 383, 133545. [Google Scholar] [CrossRef]
  35. Zhang, Y.; Jiang, Y.; Yuan, Z.; Liu, B.; Zhao, Q.; Huang, Q.; Li, Z.; Zeng, W.; Duan, Z.; Tai, H. Synergistic Effect of Electron Scattering and Space Charge Transfer Enabled Unprecedented Room Temperature NO2 Sensing Response of SnO2. Small 2023, 19, 2303631. [Google Scholar] [CrossRef] [PubMed]
  36. Yang, Y.; Gong, W.; Li, X.; Liu, Y.; Liang, Y.; Chen, B.; Yang, Y.; Luo, X.; Xu, K.; Yuan, C. Light-Assisted Room Temperature Gas Sensing Performance and Mechanism of Direct Z-Scheme MoS2/SnO2 Crystal Faceted Heterojunctions. J. Hazard. Mater. 2022, 436, 129246. [Google Scholar] [CrossRef] [PubMed]
  37. Yan, H.; Song, P.; Zhang, S.; Yang, Z.; Wang, Q. Dispersed SnO2 Nanoparticles on MoS2 Nanosheets for Superior Gas-Sensing Performances to Ethanol. RSC Adv. 2015, 5, 79593–79599. [Google Scholar] [CrossRef]
  38. Wang, F.; Liu, H.; Hu, K.; Li, Y.; Zeng, W.; Zeng, L. Hierarchical Composites of MoS2 Nanoflower Anchored on SnO2 Nanofiber for Methane Sensing. Ceram. Int. 2019, 45, 22981–22986. [Google Scholar] [CrossRef]
  39. Bai, J.; Shen, Y.; Zhao, S.; Chen, Y.; Li, G.; Han, C.; Wei, D.; Yuan, Z.; Meng, F. Flower-like MoS2 Hierarchical Architectures Assembled by 2D Nanosheets Sensitized with SnO2 Quantum Dots for High-Performance NH3 Sensing at Room Temperature. Sens. Actuators B Chem. 2022, 353, 131191. [Google Scholar] [CrossRef]
  40. Bai, X.; Lv, H.; Liu, Z.; Chen, J.; Wang, J.; Sun, B.; Zhang, Y.; Wang, R.; Shi, K. Thin-Layered MoS2 Nanoflakes Vertically Grown on SnO2 Nanotubes as Highly Effective Room-Temperature NO2 Gas Sensor. J. Hazard. Mater. 2021, 416, 125830. [Google Scholar] [CrossRef]
  41. Liu, A.; Lv, S.; Jiang, L.; Liu, F.; Zhao, L.; Wang, J.; Hu, X.; Yang, Z.; He, J.; Wang, C.; et al. The Gas Sensor Utilizing Polyaniline/MoS2 Nanosheets/SnO2 Nanotubes for the Room Temperature Detection of Ammonia. Sens. Actuators B Chem. 2021, 332, 129444. [Google Scholar] [CrossRef]
  42. Wang, W.; Zhen, Y.; Zhang, J.; Li, Y.; Zhong, H.; Jia, Z.; Xiong, Y.; Xue, Q.; Yan, Y.; Alharbi, N.S.; et al. SnO2 Nanoparticles-Modified 3D-Multilayer MoS2 Nanosheets for Ammonia Gas Sensing at Room Temperature. Sens. Actuators B Chem. 2020, 321, 128471. [Google Scholar] [CrossRef]
  43. Viet, N.N.; Thong, L.V.; Dang, T.K.; Phuoc, P.H.; Chien, N.H.; Hung, C.M.; Hoa, N.D.; Duy, N.V.; Toan, N.V.; Son, N.T.; et al. MoS2 Nanosheets-Decorated SnO2 Nanofibers for Enhanced SO2 Gas Sensing Performance and Classification of CO, NH3 and H2 Gases. Anal. Chim. Acta 2021, 1167, 338576. [Google Scholar] [CrossRef] [PubMed]
  44. Xu, X.; Liu, W.; Chen, Y.; Wang, S.; Wang, X.; Jiang, H.; Ma, S.; Yuan, F.; Zhang, Q. N-n Heterogeneous MoS2/SnO2 Nanotubes and The Excellent Triethylamine (TEA) Sensing Performances. Mater. Lett. 2022, 311, 131522. [Google Scholar] [CrossRef]
  45. Han, Y.; Ma, Y.; Liu, Y.; Xu, S.; Chen, X.; Zeng, M.; Hu, N.; Su, Y.; Zhou, Z.; Yang, Z. Construction of MoS2/SnO2 Heterostructures for Sensitive NO2 Detection at Room Temperature. Appl. Surf. Sci. 2019, 493, 613–619. [Google Scholar] [CrossRef]
  46. Mirzaei, A.; Lee, M.H.; Pawar, K.K.; Bharath, S.P.; Kim, T.-U.; Kim, J.-Y.; Kim, S.S.; Kim, H.W. Metal Oxide Nanowires Grown by a Vapor–Liquid–Solid Growth Mechanism for Resistive Gas-Sensing Applications: An Overview. Materials 2023, 16, 6233. [Google Scholar] [CrossRef]
  47. Kim, J.-H.; Mirzaei, A.; Kim, S.S.; Park, C. Pt Nanoparticle Decoration on Femtosecond Laser-Irradiated SnO2 Nanowires for Enhancing C7H8 Gas Sensing. Sens. Actuators B Chem. 2023, 379, 133279. [Google Scholar] [CrossRef]
  48. Li, Y.; Zhang, B.; Li, J.; Duan, Z.; Yang, Y.; Yuan, Z.; Jiang, Y.; Tai, H. Pd-Decorated ZnO Hexagonal Microdiscs for NH3 Sensor. Chemosensors 2024, 12, 43. [Google Scholar] [CrossRef]
  49. Shi, L.; Xu, Y.; Li, Q. Controlled Fabrication of SnO2 Arrays of Well-Aligned Nanotubes and Nanowires. Nanoscale 2010, 2, 2104–2108. [Google Scholar] [CrossRef]
  50. Mao, H.; Fu, Y.; Yang, H.; Deng, Z.; Sun, Y.; Liu, D.; Wu, Q.; Ma, T.; Song, X.-M. Ultrathin 1T-MoS2 Nanoplates Induced by Quaternary Ammonium-Type Ionic Liquids on Polypyrrole/Graphene Oxide Nanosheets and Its Irreversible Crystal Phase Transition during Electrocatalytic Nitrogen Reduction. ACS Appl. Mater. Interfaces 2020, 12, 25189–25199. [Google Scholar] [CrossRef]
  51. Wang, X.X.; Li, Z.; Yang, Y.; Tang, T.; Cheng, Y.F.; Xu, K.; Xie, H.G.; Chen, Y.L.; Cheng, L.; Tao, X.W.; et al. 3D Substoichiometric MoO3−x/EGaln Framework for Room Temperature NH3 Gas Sensing. J. Alloys Compd. 2023, 939, 168690. [Google Scholar] [CrossRef]
  52. Hingangavkar, G.M.; Kadam, S.A.; Ma, Y.-R.; Bandgar, S.S.; Mulik, R.N.; Patil, V.B. MoS2-GO Hybrid Sensor: A Discerning Approach for Detecting Harmful H2S Gas at Room Temperature. Chem. Eng. J. 2023, 472, 144789. [Google Scholar] [CrossRef]
  53. Rodrigues, J.; Jain, S.; Shimpi, N.G. Performance of 1D Tin (Sn) Decorated Spherical Shape ZnO Nanostructures as an Acetone Gas Sensor for Room and High Temperature. Mater. Sci. Eng. B 2023, 288, 116199. [Google Scholar] [CrossRef]
  54. Kim, H.W.; Kwon, Y.J.; Mirzaei, A.; Kang, S.Y.; Choi, M.S.; Bang, J.H.; Kim, S.S. Synthesis of Zinc Oxide Semiconductors-Graphene Nanocomposites by Microwave Irradiation for Application to Gas Sensors. Sens. Actuators B Chem. 2017, 249, 590–601. [Google Scholar] [CrossRef]
  55. Ma, X.; Cai, X.; Yuan, M.; Qu, Y.; Tan, Y.; Chen, F. Self-Powered and Flexible Gas Sensor Using Defect-Engineered WS2/G Heterostructure. Sens. Actuators B Chem. 2022, 371, 132523. [Google Scholar] [CrossRef]
  56. Choi, S.Y.; Kim, Y.; Chung, H.-S.; Kim, A.R.; Kwon, J.-D.; Park, J.; Kim, Y.L.; Kwon, S.-H.; Hahm, M.G.; Cho, B. Effect of Nb Doping on Chemical Sensing Performance of Two-Dimensional Layered MoSe2. ACS Appl. Mater. Interfaces 2017, 9, 3817–3823. [Google Scholar] [CrossRef]
  57. Guo, R.; Han, Y.; Su, C.; Chen, X.; Zeng, M.; Hu, N.; Su, Y.; Zhou, Z.; Wei, H.; Yang, Z. Ultrasensitive Room Temperature NO2 Sensors Based on Liquid Phase Exfoliated WSe2 Nanosheets. Sens. Actuators B Chem. 2019, 300, 127013. [Google Scholar] [CrossRef]
  58. Wang, Z.; Zhang, T.; Zhao, C.; Han, T.; Fei, T.; Liu, S.; Lu, G. Rational Synthesis of Molybdenum Disulfide Nanoparticles Decorated Reduced Graphene Oxide Hybrids and Their Application for High-Performance NO2 Sensing. Sens. Actuators B Chem. 2018, 260, 508–518. [Google Scholar] [CrossRef]
  59. Ko, K.Y.; Park, K.; Lee, S.; Kim, Y.; Woo, W.J.; Kim, D.; Song, J.-G.; Park, J.; Kim, H. Recovery Improvement for Large-Area Tungsten Diselenide Gas Sensors. ACS Appl. Mater. Interfaces 2018, 10, 23910–23917. [Google Scholar] [CrossRef]
  60. Chen, Z.; Wang, J.; Umar, A.; Wang, Y.; Li, H.; Zhou, G. Three-Dimensional Crumpled Graphene-Based Nanosheets with Ultrahigh NO2 Gas Sensibility. ACS Appl. Mater. Interfaces 2017, 9, 11819–11827. [Google Scholar] [CrossRef]
  61. Zhang, H.; Feng, J.; Fei, T.; Liu, S.; Zhang, T. SnO2 Nanoparticles-Reduced Graphene Oxide Nanocomposites for NO2 Sensing at Low Operating Temperature. Sens. Actuators B Chem. 2014, 190, 472–478. [Google Scholar] [CrossRef]
  62. Liu, X.; Zhang, H.; Shen, T.; Sun, J. Flexible Resistive NO2 Gas Sensor of SnO2@Ti3C2Tx MXene for Room Temperature Application. Ceram. Int. 2024, 50, 2459–2466. [Google Scholar] [CrossRef]
  63. Liu, X.; Zhang, H.; Song, Y.; Shen, T.; Sun, J. Facile Solvothermal Synthesis of ZnO/Ti3C2Tx MXene Nanocomposites for NO2 Detection at Low Working Temperature. Sens. Actuators B Chem. 2022, 367, 132025. [Google Scholar] [CrossRef]
  64. Yan, H.; Chu, L.; Li, Z.; Sun, C.; Shi, Y.; Ma, J. 2H-MoS2/Ti3C2Tx MXene Composites for Enhanced NO2 Gas Sensing Properties at Room Temperature. Sens. Actuators Rep. 2022, 4, 100103. [Google Scholar] [CrossRef]
  65. Ta, Q.T.H.; Tri, N.N.; Noh, J.S. Improved NO2 Gas Sensing Performance of 2D MoS2/Ti3C2Tx MXene Nanocomposite. Appl. Surf. Sci. 2022, 604, 154624. [Google Scholar] [CrossRef]
  66. Guo, F.; Feng, C.; Zhang, Z.; Zhang, L.; Xu, C.; Zhang, C.; Lin, S.; Wu, H.; Zhang, B.; Tabusi, A.; et al. A Room-Temperature NO2 Sensor Based on Ti3C2TX MXene Modified with Sphere-Like CuO. Sens. Actuators B Chem. 2023, 375, 132885. [Google Scholar] [CrossRef]
  67. Premkumar, V.K.; Vishnuraj, R.; Sheena, T.S.; Yang, X.; Pullithadathil, B.; Zhang, C.; Wu, Z. Influence of ZnO Hexagonal Pyramid Nanostructures for Highly Sensitive and Selective NO2 Gas Sensor. J. Alloys Compd. 2024, 994, 174625. [Google Scholar] [CrossRef]
  68. Kim, J.-H.; Mirzaei, A.; Kim, H.W.; Kim, S.S. Low Power-Consumption CO Gas Sensors Based on Au-Functionalized SnO2-ZnO Core-Shell Nanowires. Sens. Actuators B Chem. 2018, 267, 597–607. [Google Scholar] [CrossRef]
  69. Babar, B.M.; Pisal, K.B.; Mujawar, S.H.; Patil, V.L.; Kadam, L.D.; Pawar, U.T.; Kadam, P.M.; Patil, P.S. Concentration Modulated Vanadium Oxide Nanostructures for NO2 Gas Sensing. Sens. Actuators B Chem. 2022, 351, 130947. [Google Scholar] [CrossRef]
  70. Sharma, A.; Tomar, M.; Gupta, V. A Low Temperature Operated NO2 Gas Sensor Based on TeO2/SnO2 p–n Heterointerface. Sens. Actuators B Chem. 2013, 176, 875–883. [Google Scholar] [CrossRef]
  71. Bang, J.H.; Choi, M.S.; Mirzaei, A.; Kwon, Y.J.; Kim, S.S.; Kim, T.W.; Kim, H.W. Selective NO2 Sensor Based on Bi2O3 Branched SnO2 Nanowires. Sens. Actuators B Chem. 2018, 274, 356–369. [Google Scholar] [CrossRef]
Figure 1. (a) Schematic of SnO2 NWs grown via VLS mechanism on the surface of substrate equipped with electrodes. (b) Scratching of SnO2 NWs for characterizations. (c) Preparation of SnO2/MoS2 composites. (d) Gas sensing measuring system.
Chemosensors 12 00107 g001
Figure 2. (ac) SEM images of SM-20 composite. EDS mapping analysis of SM-20 composite: (i) Mo, (ii) S, (iii) Sn, and (iv) O mapping. (v) Compositional analysis of SM-20 composite.
Chemosensors 12 00107 g002
Figure 3. Analysis of SM-20 nanocomposite (a,b) TEM images at two different magnifications. (c,d) HRTEM images. (e) TEM-EDS elemental mapping analysis displaying the distribution of (i) Sn, (ii) O, (iii) Mo, and (iv) S elements.
Chemosensors 12 00107 g003
Figure 4. (a) Sensing curves of different gas sensors to 1 ppm NO2 gas at 100 °C. (b) Comparison of response to 1 ppm NO2 gas at 100 °C and baseline resistance of different gas sensors.
Chemosensors 12 00107 g004
Figure 5. (a) Sensing curves of SM-20 gas sensor to 1 ppm NO2 gas at 25 °C under various applied voltages. (b) Corresponding response of 1 ppm NO2 gas at 25 °C versus applied voltage.
Chemosensors 12 00107 g005
Figure 6. Sensing performance of SM-20 gas sensor. (a) Sensing curves at low concentrations of various gases at fixed 3.2 V. (b) Corresponding selectivity histogram. (c) Calibration curve for low concentrations of NO2 gas. (d) Dynamic resistance curves (five cycles) in fresh state and after three months of 1 ppm NO2 gas at 3.2 V. (e) Comparison of the responses in fresh state and after three months. (f) Dynamic resistance curves for 1 ppm NO2 gas at 3.2 V under dry and humid (80% RH) conditions.
Chemosensors 12 00107 g006
Figure 7. (a) Side views of MoS2 NSs and SM-20 composite on the substrate. (b) Schematic of NO2 gas sensing mechanism of SM-20 composite gas sensor. (c) Self-heating effect of SM-20 gas sensor.
Chemosensors 12 00107 g007
Table 1. Comparison of the NO2 gas-sensing responses obtained in this study with those reported in other papers. The optimal sensor in this study has a higher performance in terms of high response, fast response, and recovery time relative to most of the listed sensors.
Sensing MaterialT (°C)Conc. (ppb)Response (Rg/Ra) or (Ra/Rg)τResRecRef.
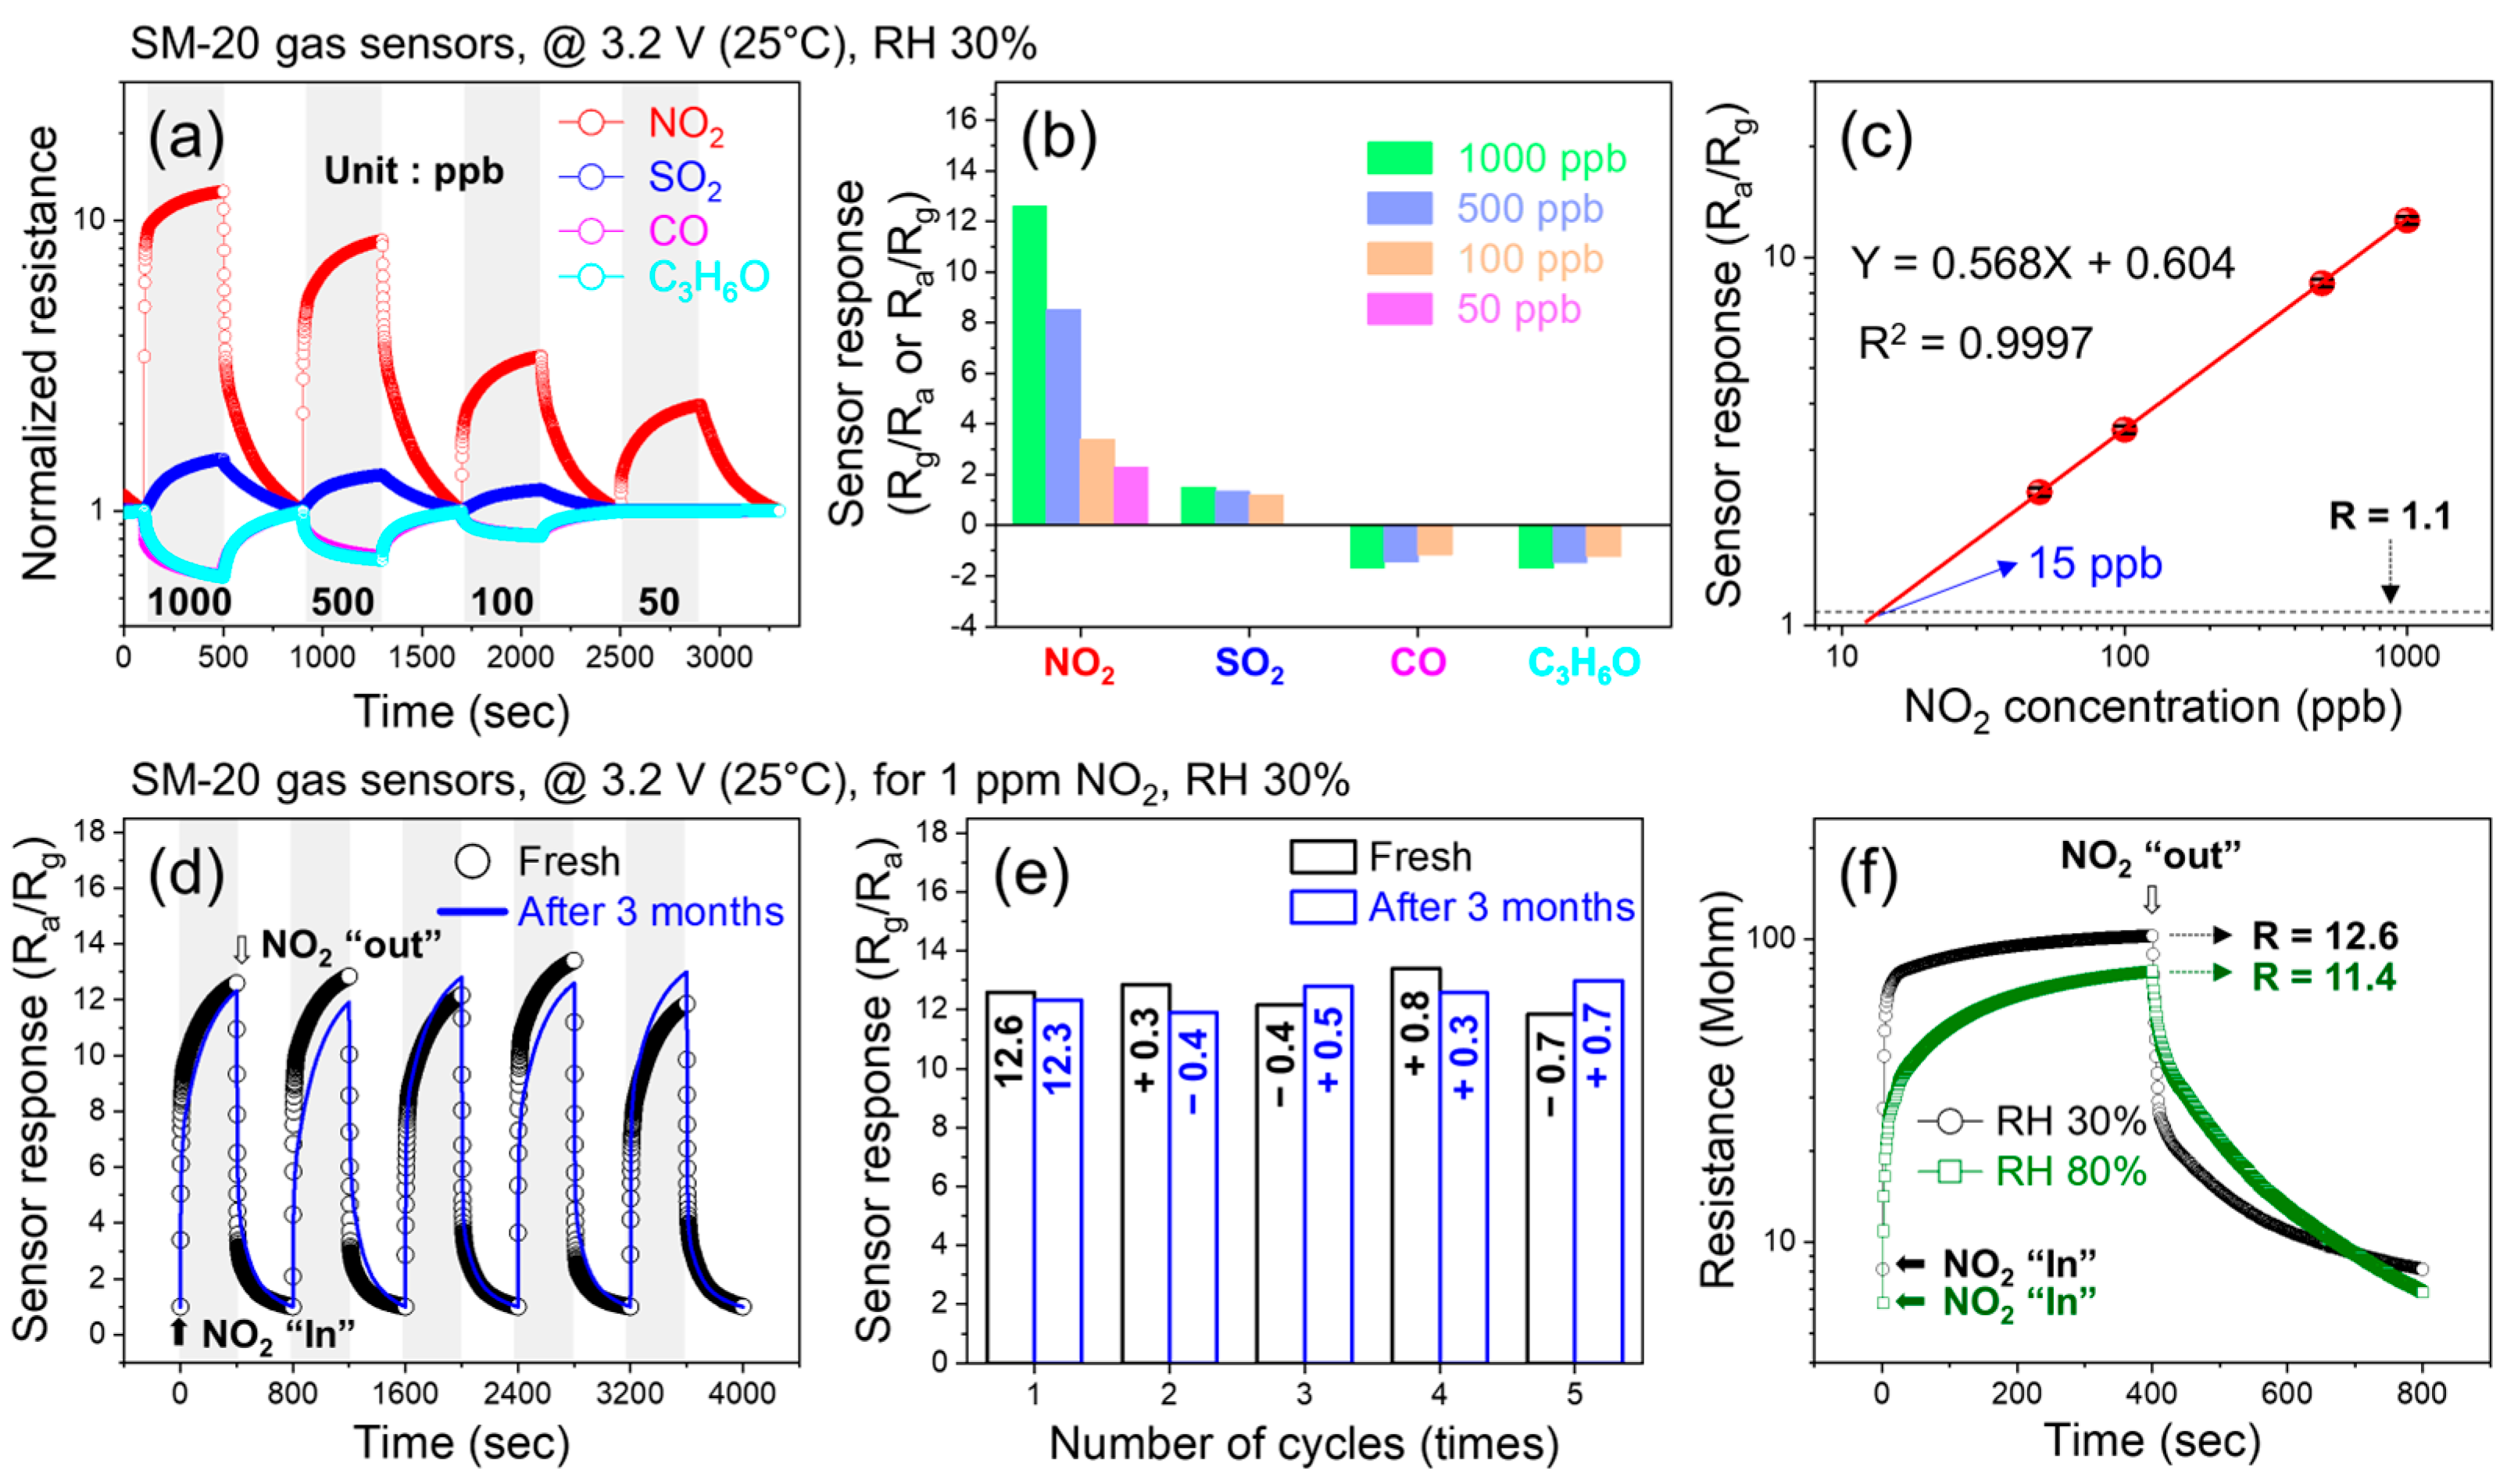
SnO2 NWs (20 wt%)-MoS2 NSs composite gas sensorRT, (3.2 V)100012.6268/63 sThis work
WS2/Graphene heterostructureRT506.0110/168 s[55]
Nb-MoSe215030008.030/30 min[56]
WSe2 nanosheetsRT10008.2150/1050 s[57]
MoS2-rGO heterojunction16030001.248/20 s[58]
Trilayer WSe2 filmRT10,0002.8960/600 s[59]
3D crumpled reduced graphene oxide nanosheetsRT10001.5500/3000 s[60]
SnO2-rGO nanocomposites505001.5400/300 s[61]
SnO2/Ti3C2Tx nanocompositeRT30078.2% [ΔR/Ra (%)]54/400 s[62]
ZnO/Ti3C2Tx nanocomposite16083.6254/~380[63]
MoS2/MXene nanocompositeRT10065.6% [ΔR/Ra (%)]~700/~900[64]
MoS2/Ti3C2Tx nanocompositeRT2065.6% [ΔR/Ra (%)]525/155[65]
Ti3C2Tx/CuO nanocompositeRT10059% [ΔR/Ra (%)]~100/~100[66]
Disclaimer/Publisher’s Note: The statements, opinions and data contained in all publications are solely those of the individual author(s) and contributor(s) and not of MDPI and/or the editor(s). MDPI and/or the editor(s) disclaim responsibility for any injury to people or property resulting from any ideas, methods, instructions or products referred to in the content.

