Article

Urea Biosensing through Integration of Urease to the PEDOT-Polyamine Conducting Channels of Organic Electrochemical Transistors: pH-Change-Based Mechanism and Urine Sensing

by
Jael R. Neyra Recky
,
Marjorie Montero-Jimenez
,
Juliana Scotto
,
Omar Azzaroni
and
Waldemar A. Marmisollé
*
Instituto de Investigaciones Fisicoquímicas Teóricas y Aplicadas (INIFTA), CONICET-Departamento de Química, Facultad de Ciencias Exactas, Universidad Nacional de La Plata, La Plata B1904DPI, Argentina
*
Author to whom correspondence should be addressed.
Chemosensors 2024, 12(7), 124; https://doi.org/10.3390/chemosensors12070124
Submission received: 14 May 2024 / Revised: 24 June 2024 / Accepted: 1 July 2024 / Published: 3 July 2024
(This article belongs to the Special Issue Electrochemical Biosensors: Advances and Prospects)

Abstract

:
We present the construction of an organic electrochemical transistor (OECT) based on poly(3,4-ethylendioxythiophene, PEDOT) and polyallylamine (PAH) and its evaluation as a bioelectronic platform for urease integration and urea sensing. The OECT channel was fabricated in a one-step procedure using chemical polymerization. Then, urease was immobilized on the surface by electrostatic interaction of the negatively charged enzyme at neutral pH with the positively charged surface of PEDOH-PAH channels. The real-time monitoring of the urease adsorption process was achieved by registering the changes on the drain–source current of the OECT upon continuous scan of the gate potential during enzyme deposition with high sensitivity. On the other hand, integrating urease enabled urea sensing through the transistor response changes resulting from local pH variation as a consequence of enzymatic catalysis. The response of direct enzyme adsorption is compared with layer-by-layer integration using polyethylenimine. Integrating a polyelectrolyte over the adsorbed enzyme resulted in a more stable response, allowing for the sensing of urine even from diluted urine samples. These results demonstrate the potential of integrating enzymes into the active channels of OECTs for the development of biosensors based on local pH changes.

Graphical Abstract

1. Introduction

The development of biosensors for various chemical and biochemical species is a topic of constant interest within the scientific community, driven by the continuous technological advancements pushing the boundaries of detection and diagnostic practices. In particular, electrochemical sensors offer several advantages, including low cost, ease of production, and implementation of information reading and analysis technologies. Among electrochemical sensors, organic electrochemical transistors (OECTs) have emerged as a rapidly growing field with promising advances and results [1,2,3,4,5,6]. Technologies based on OECTs are particularly suitable for the development of point-of-care sensing devices and for the continuous monitoring of species, even in implantable [7,8] or wearable devices [9,10,11], due to the ease of miniaturization and the possibility of constructing flexible sensors [12,13,14].
The functional response of OECTs arises from the combination of the dynamic response of the electronic and ionic conductance of thin films of conducting polymers, which prove to be highly sensitive to changes in their environment [15,16]. Among the materials for constructing OECT conducting channels, those based on PEDOT have been widely explored for their advantages such as electrochemical stability in aqueous media, ease of production, and compatibility with biological media and materials [17,18]. Particularly, PEDOT is a very good conductor, allowing for relatively high currents to be produced with low potential differences [19,20,21]. However, the possibilities for chemical derivatization are limited [17]. In this regard, we have recently developed a PEDOT composite with polyallylamine (PEDOT-PAH) that has shown good conductivity and electrochemical stability [22], while the presence of amino groups has enabled efficient post-functionalization using both physical integration methods (such as layer-by-layer assembly or direct electrostatic adsorption) [23,24,25] and chemical methods, using NH2 groups as sites for covalent attachment [24,26,27].
A particular type of biosensor constructed from OECTs relies on the integration of enzymes, which enable the detection and quantification of their corresponding substrates. In the majority of the approaches used, enzymes are coupled to the gate electrode so that the electroactive products of enzymatic activity (typically H2O2) directly affect the gate potential [28,29]. This approach has been widely employed, for example, in the development of glucose sensors based on the integration of glucose oxidase (GOx) [30,31,32,33], uric acid sensors using uricase [34], or lactate sensors employing lactate oxidase [10,35]. However, an alternative approach involves integrating enzymes into the material that constitutes the conducting channel of the OECT so that enzymatic activity promotes changes in its conductivity. In these cases, a phenomenon often used is the local pH change resulting from enzymolysis. On the one hand, this strategy requires that the conducting materials exhibit notable sensitivity to pH changes. However, on the other hand, it eliminates the necessity for enzymolysis products to be electrochemically active, thus opening the door to the development of other biomarkers using enzymes. Following this strategy, the integration of acetylcholinesterase into PEDOT-PAH channels has enabled the sensing of acetylcholine by a reduction in local pH as a consequence of the enzymatic activity [25,36]. The case of enzymes that promote a local increase in pH on the conducting channels of OECTs has been less extensively explored. Particularly, urease catalyzes urea decomposition to ammonia, which is able to locally induce a pH increase. Strategies using urease for urea sensing via a local pH increase have been developed with graphene-based FETs [37] and solid-state nanochannels [38]. Concerning the integration of urease to OECTs, a previous study by Berto and colleagues implied a modification of the entire transistor (both the conducting channel and gate electrode) with a hydrogel in which urease was immobilized [39]. This device was able to respond to the presence of urea in synthetic samples, although no quantitative results nor calibrations are presented. Moreover, the functionalization strategy makes it difficult to distinguish between the effect on the conducting channel and on the gate electrode as both were made of PEDOT:PSS, and the authors hypothetically ascribed the response to specific interactions of ammonium ions with the gelatin and channel material.
Urea has become a biomarker that needs to be monitored with cheap, portable sensor technologies that find applications in several fields [40,41]. Particularly, urea is a relevant biomarker in human health highly valuable for the diagnosis and control of a number of kidney and liver diseases, such as chronic kidney disease (CKD) [42]. Blood urea levels in CKD patients can reach values about ten times higher than those determined in healthy patients [41,43]. Urea normal level in human urine has great variations from about 0.1 to 1 M, drastically changing under pathological conditions, which provides key information of renal function and diagnosis of various kidney and liver disorders [44,45]. Therefore, the determination of urea in urine becomes critical to diagnose and monitor CKD. Several sensors have been developed for urea determination [46,47,48,49], including ones based on fluorimetric and colorimetric [50], plasmonic [51,52], ionovoltaic [53], amperometric [54], potentiometric [55,56], and voltammetric methods [57,58], among others. However, some of them are complicated, non-specific, require time-consuming sample pre-treatment, expensive instruments or laborious procedures or they cannot be used for on-line monitoring. In this regard, technology based on OECTs becomes suitable for the development of rapid, low cost, online monitoring of urea in aqueous samples including urine.
Here, we studied the integration of urease to OECTs by direct electrostatic assembly on the active conducting channels of PEDOT-PAH and evaluated their performance for urea sensing. We assessed various assembly configurations, including layer-by-layer deposition, and demonstrated that the response is due to an increase in pH in the vicinity of the urease-modified PEDOT-PAH channel caused by the enzyme activity in the presence of urea. Furthermore, we showed that this enzymatic biosensor is capable of sensing urea in diluted real urine samples through changes in the OECT response.

2. Materials and Methods

2.1. Reagents

Urease from Canavalia ensiformis (Jack Bean) was obtained from Calzyme (Tulelake, CA, USA) (200 KU). 3,4-ethylenedioxythiophene (EDOT), polyallylamine hydrochloride (PAH, Mw~58 kDa), polyethylenimine (10 kDa, PEI), urea (99%), ascorbic acid and creatinine were purchased from Sigma Aldrich (St. Louis, MO, USA). Pyridine (99%) was obtained from Biopack (Buenos Aires, Argentina) and Fe (III) p-toluenesulfonate (FeTos) (38–42% in n-butanol) was obtained from Heraeus (Hanau, Germany). KCl, KOH, HCl, glucose and n-butanol (99.4%) were purchased from Anedra (Los Troncos del Talar, Buenos Aires, Argentina).

2.2. PEDOT-PAH Films’ Preparation

Interdigitated electrodes (IDEs, Micrux ED-IDE1-Au (MicruX Technologies, Gijón, Asturias, Spain), 10/10 µm electrode/gap) were the substrates used to synthesize PEDOT-PAH films by chemical polymerization, following a methodology previously reported [23,24,25,36]. First, an oxidant solution was prepared (715 µL of Fe(III) Tosylate (FeTos), 220 µL of butanol and 16.5 µL of pyridine). Then, 200 µL of PAH solution (40 mg of PAH in 200 µL of Milli-Q water) and 12.5 µL of EDOT were added. The mixture was diluted 1:5 with butanol, filtered (0.2 µm) and dropped onto IDEs using a spin coater for 1 min at 1000 rpm rotation rate and the acceleration was 500 rpm s−1. Subsequently, the IDEs were heated at 70 °C for 20 min to polymerize the EDOT. Finally, IDEs were rinsed with distilled water and dried with air.

2.3. SPR Measurements

Surface Plasmon Resonance analysis was performed with a multi-parametric instrument SPR Navi 210 A (BioNavis Ltd., Tampere, Finland). PEDOT-PAH films were deposited onto Au substrates, with the same procedure used to modify IDEs [24]. Then, 10 mM KCl pH 7.4 was injected at 15 µL min−1 flow rate and angular scans were recorded using the laser of 785 nm. To verify the assembly, 1 mg mL−1 urease was injected, rinsed with 10 mM KCl and then 1.8 mg mL−1 PEI (polyethylenimine) was injected to build one bilayer. Three bilayers were built, and then 1 and 10 mM urea solutions were injected to confirm the stability of the assembly.

2.4. Electrochemical Measurements

All electrochemical measurements were performed using a TEQ bipotenciostat (NanoTeq, Buenos Aires, Argentina) [23,24,25]. To monitor the OECTs’ response, a Micrux Technologies (Gijón, Asturias, Spain) flow cell was used where the PEDOT-PAH-modified interdigitated electrodes were placed and the measurement solutions were injected using a 30 µL min−1 flow rate. As the gate electrode, a Ag/AgCl wire was employed. The drain–source current (IDS) vs. gate potential (VG) profiles were registered by applying a −50 mV fixed potential difference between the drain and source terminals and continuously sweeping the gate potential at 10 mV s−1 between the “off” and “on” limits, corresponding to the potentials in which the polymer is completely reduced and oxidized, respectively.

2.5. Urine Sample

Urine from a female volunteer with no history of renal disease collected over 24 h was used. To determine the amount of urea, part of the sample was analyzed in a clinical laboratory using a UV-Kinetic method. The remaining urine was filtered and refrigerated at 4 °C for use. A 10 mM KCl solution was used as a supporting electrolyte to prepare urine dilutions, which were measured with the urease-PEDOT-PAH OECTs. The real samples were collected from healthy volunteer patients with informed consent from the volunteers based on the Declaration of Helsinki.

3. Results and Discussions

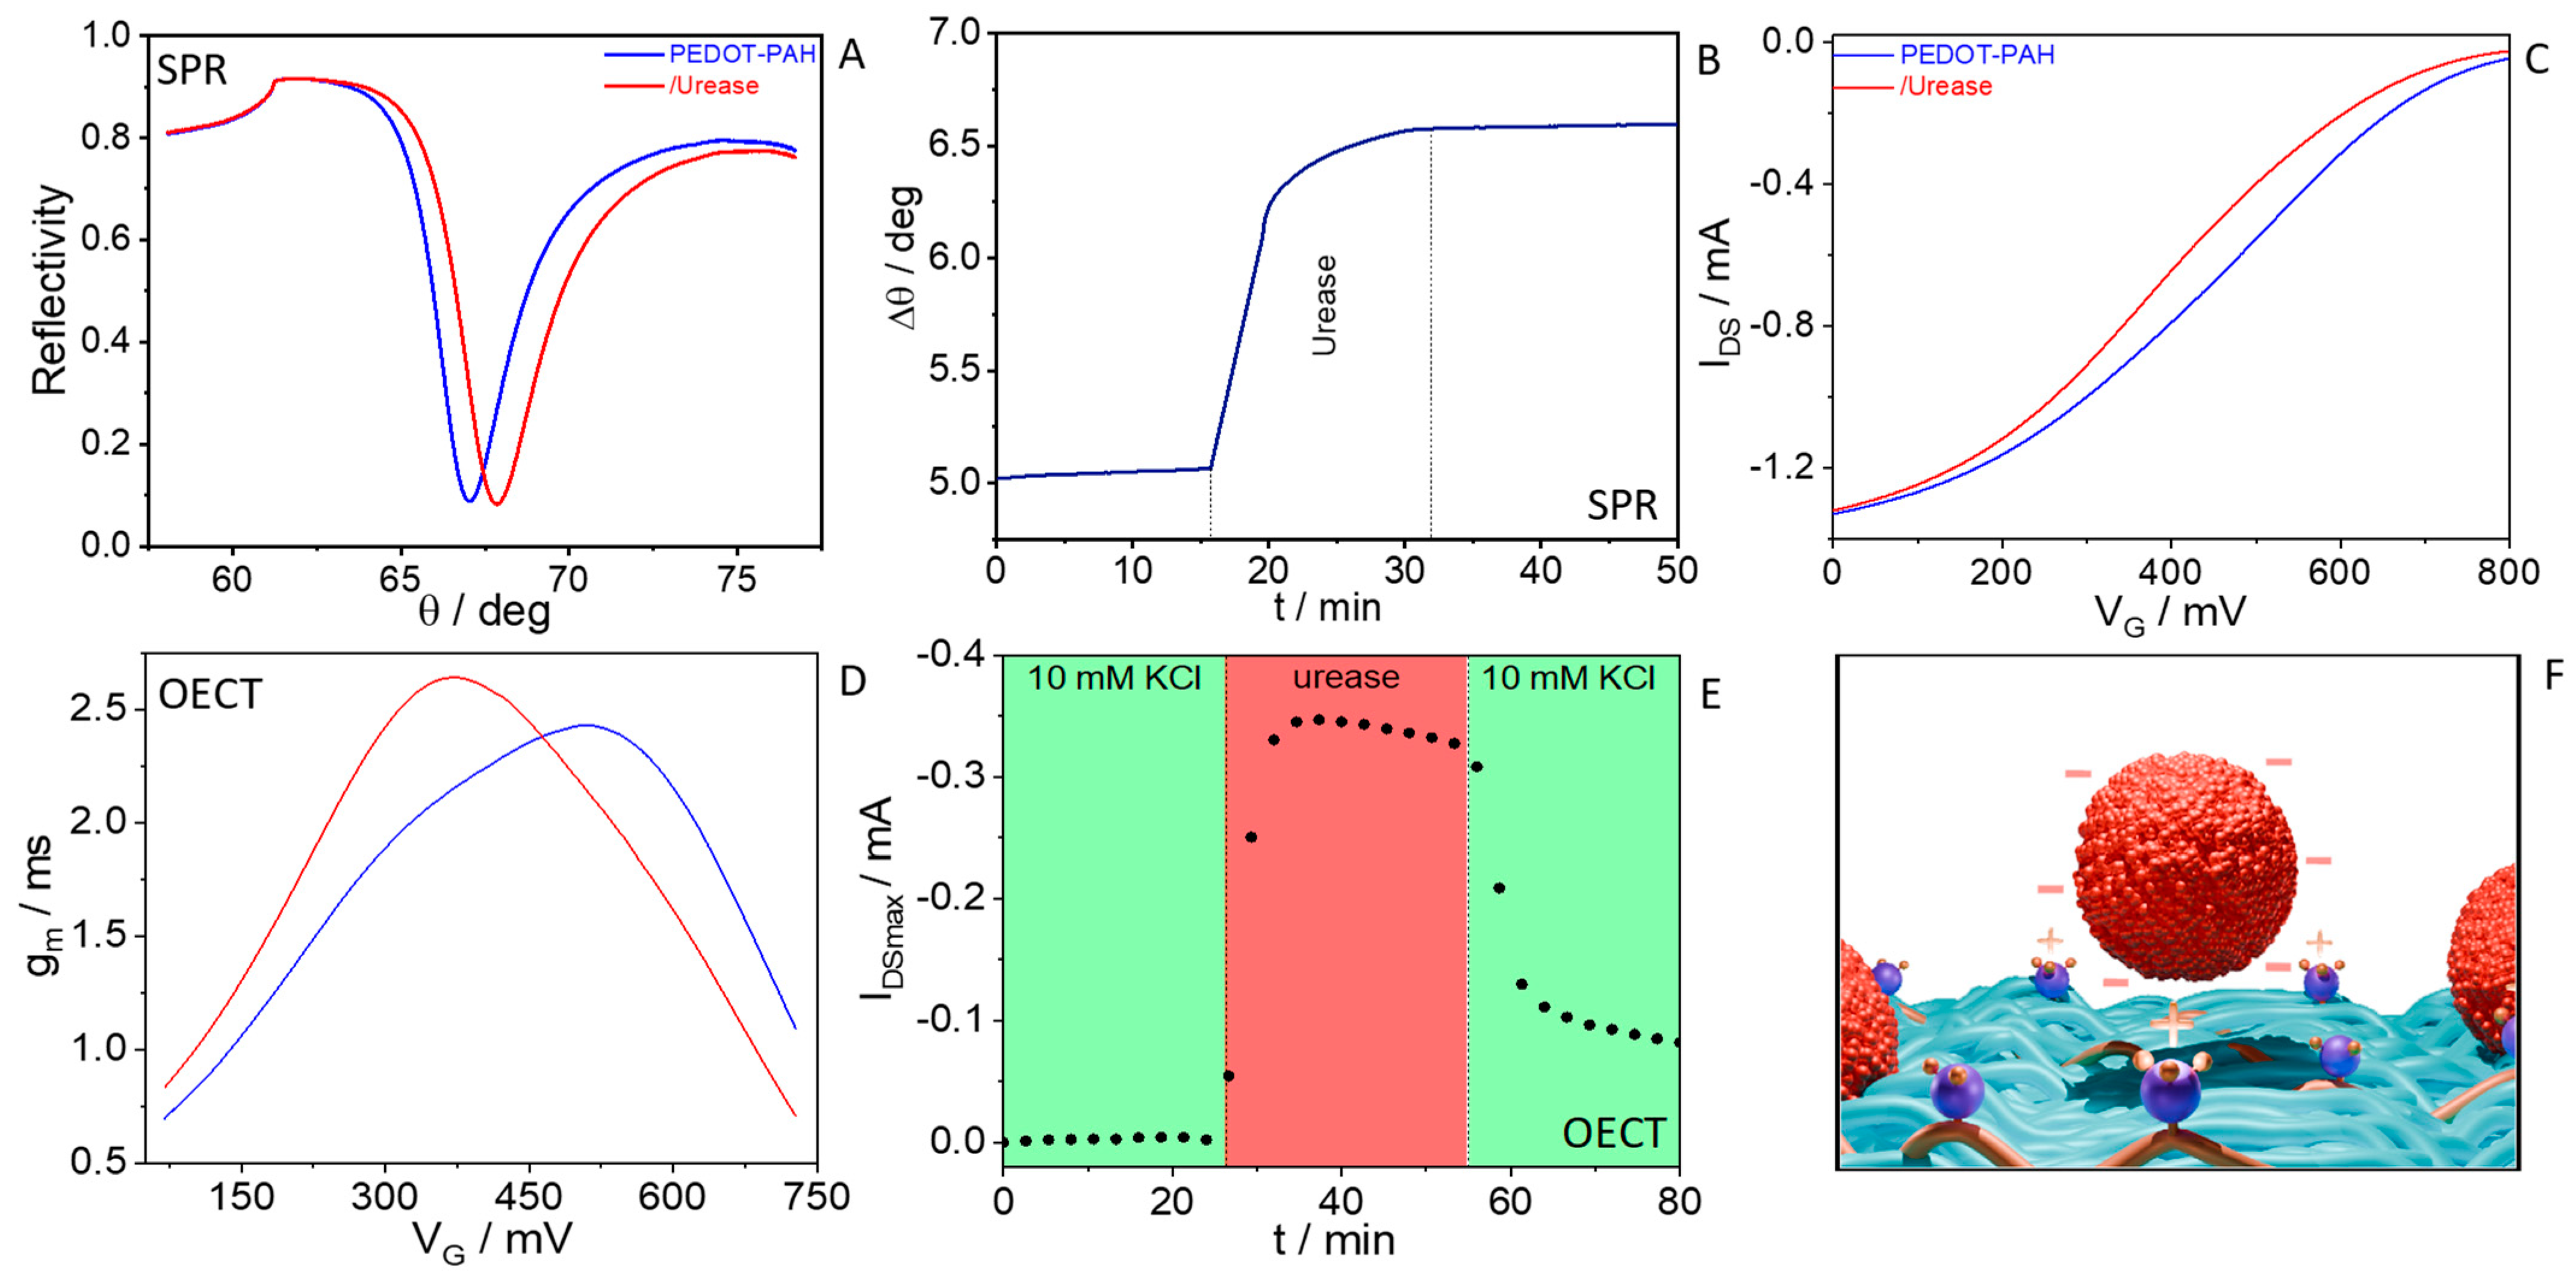
3.1. Urease Electrostatic Integration to PEDOT-PAH Films and Monitoring with OECTs

In order to study the electrostatic integration of urease in the polymeric channel, PEDOT-PAH films were synthesized on Au SPR substrates and interdigitated electrodes by chemical polymerization. To obtain the polymeric blend, a PAH in water solution was mixed with a FeTos oxidant solution in butanol, and then the monomer of the conducting polymer (EDOT) was added (Scheme 1). As shown elsewhere, this method allows for the integration of PAH into the PEDOT matrix, yielding a polymeric blend with high conductivity and low operational voltages [24]. Then, the adsorption of urease on the conducting film was studied by SPR, measuring the change in the minimum reflectance angle (θmin) during the injection of a 1 mg/mL of the enzyme in 10 mM KCl solution under continuous-flow conditions (Figure 1A). Figure 1B shows the sensorgram, computed as the change in the minimum reflectance angle, Δθ (Δθ = Δθmin − Δθtir, where θtir is the total internal reflection angle), as a function of time. A rapid increase in the signal can be observed after urease injection, and no decrease in the signal is observed after returning to the KCl solution, showing the high stability of the assembled enzyme on the substrate. The change in the SPR signal was employed to estimate the enzyme mass density (Γ) deposited on the PEDOT-PAH film by Freijter’s equation [24]:
Γ = Δ θ k d d n / d c
where kd is an instrument constant and dn/dc the dependency of the refraction index with the concentration. For the calculations, a dn/dc value of 0.177 cm3 g−1 was used for urease and a value of kd = 1.9 × 10⁻⁷ cm was employed for the 785 nm laser, obtaining a value of Γ = 1.33 µg cm−2.
Next, we deposited the PEDOT-PAH film on interdigitated electrodes to monitor enzyme adsorption by the OECT response. In Figure 1C, the transfer curves of a PEDOT-PAH-based OECTs in 10 mM KCl solution before and after urease deposition are shown. A shift in the transfer curves to lower gate potentials can be observed. This shift can also be appreciated as a decrease in the gate potential at which the maximum transconductance value, VGmax, is reached (Figure 1D), and it has been explained before as a consequence of the change in the impedance of the polymer/solution interface [24].
Moreover, real-time monitoring of the adsorption process was obtained by continuously scanning the potential during enzyme deposition under continuous-flow conditions. To this end, we analyzed the evolution of the drain–source current at fixed VG = VGmax (IDSmax) since it is the potential at which the sensitivity of the sensor is the highest. The procedure for obtaining these parameters from the transfer curves is detailed in SI (Section S1). In Figure 1E, IDSmax is shown as a function of time. As the enzyme is assembled on the PEDOT/PAH channel surface (Figure 1F), a marked decrease in the OECT current can be observed in the same time scale of that observed by SPR.

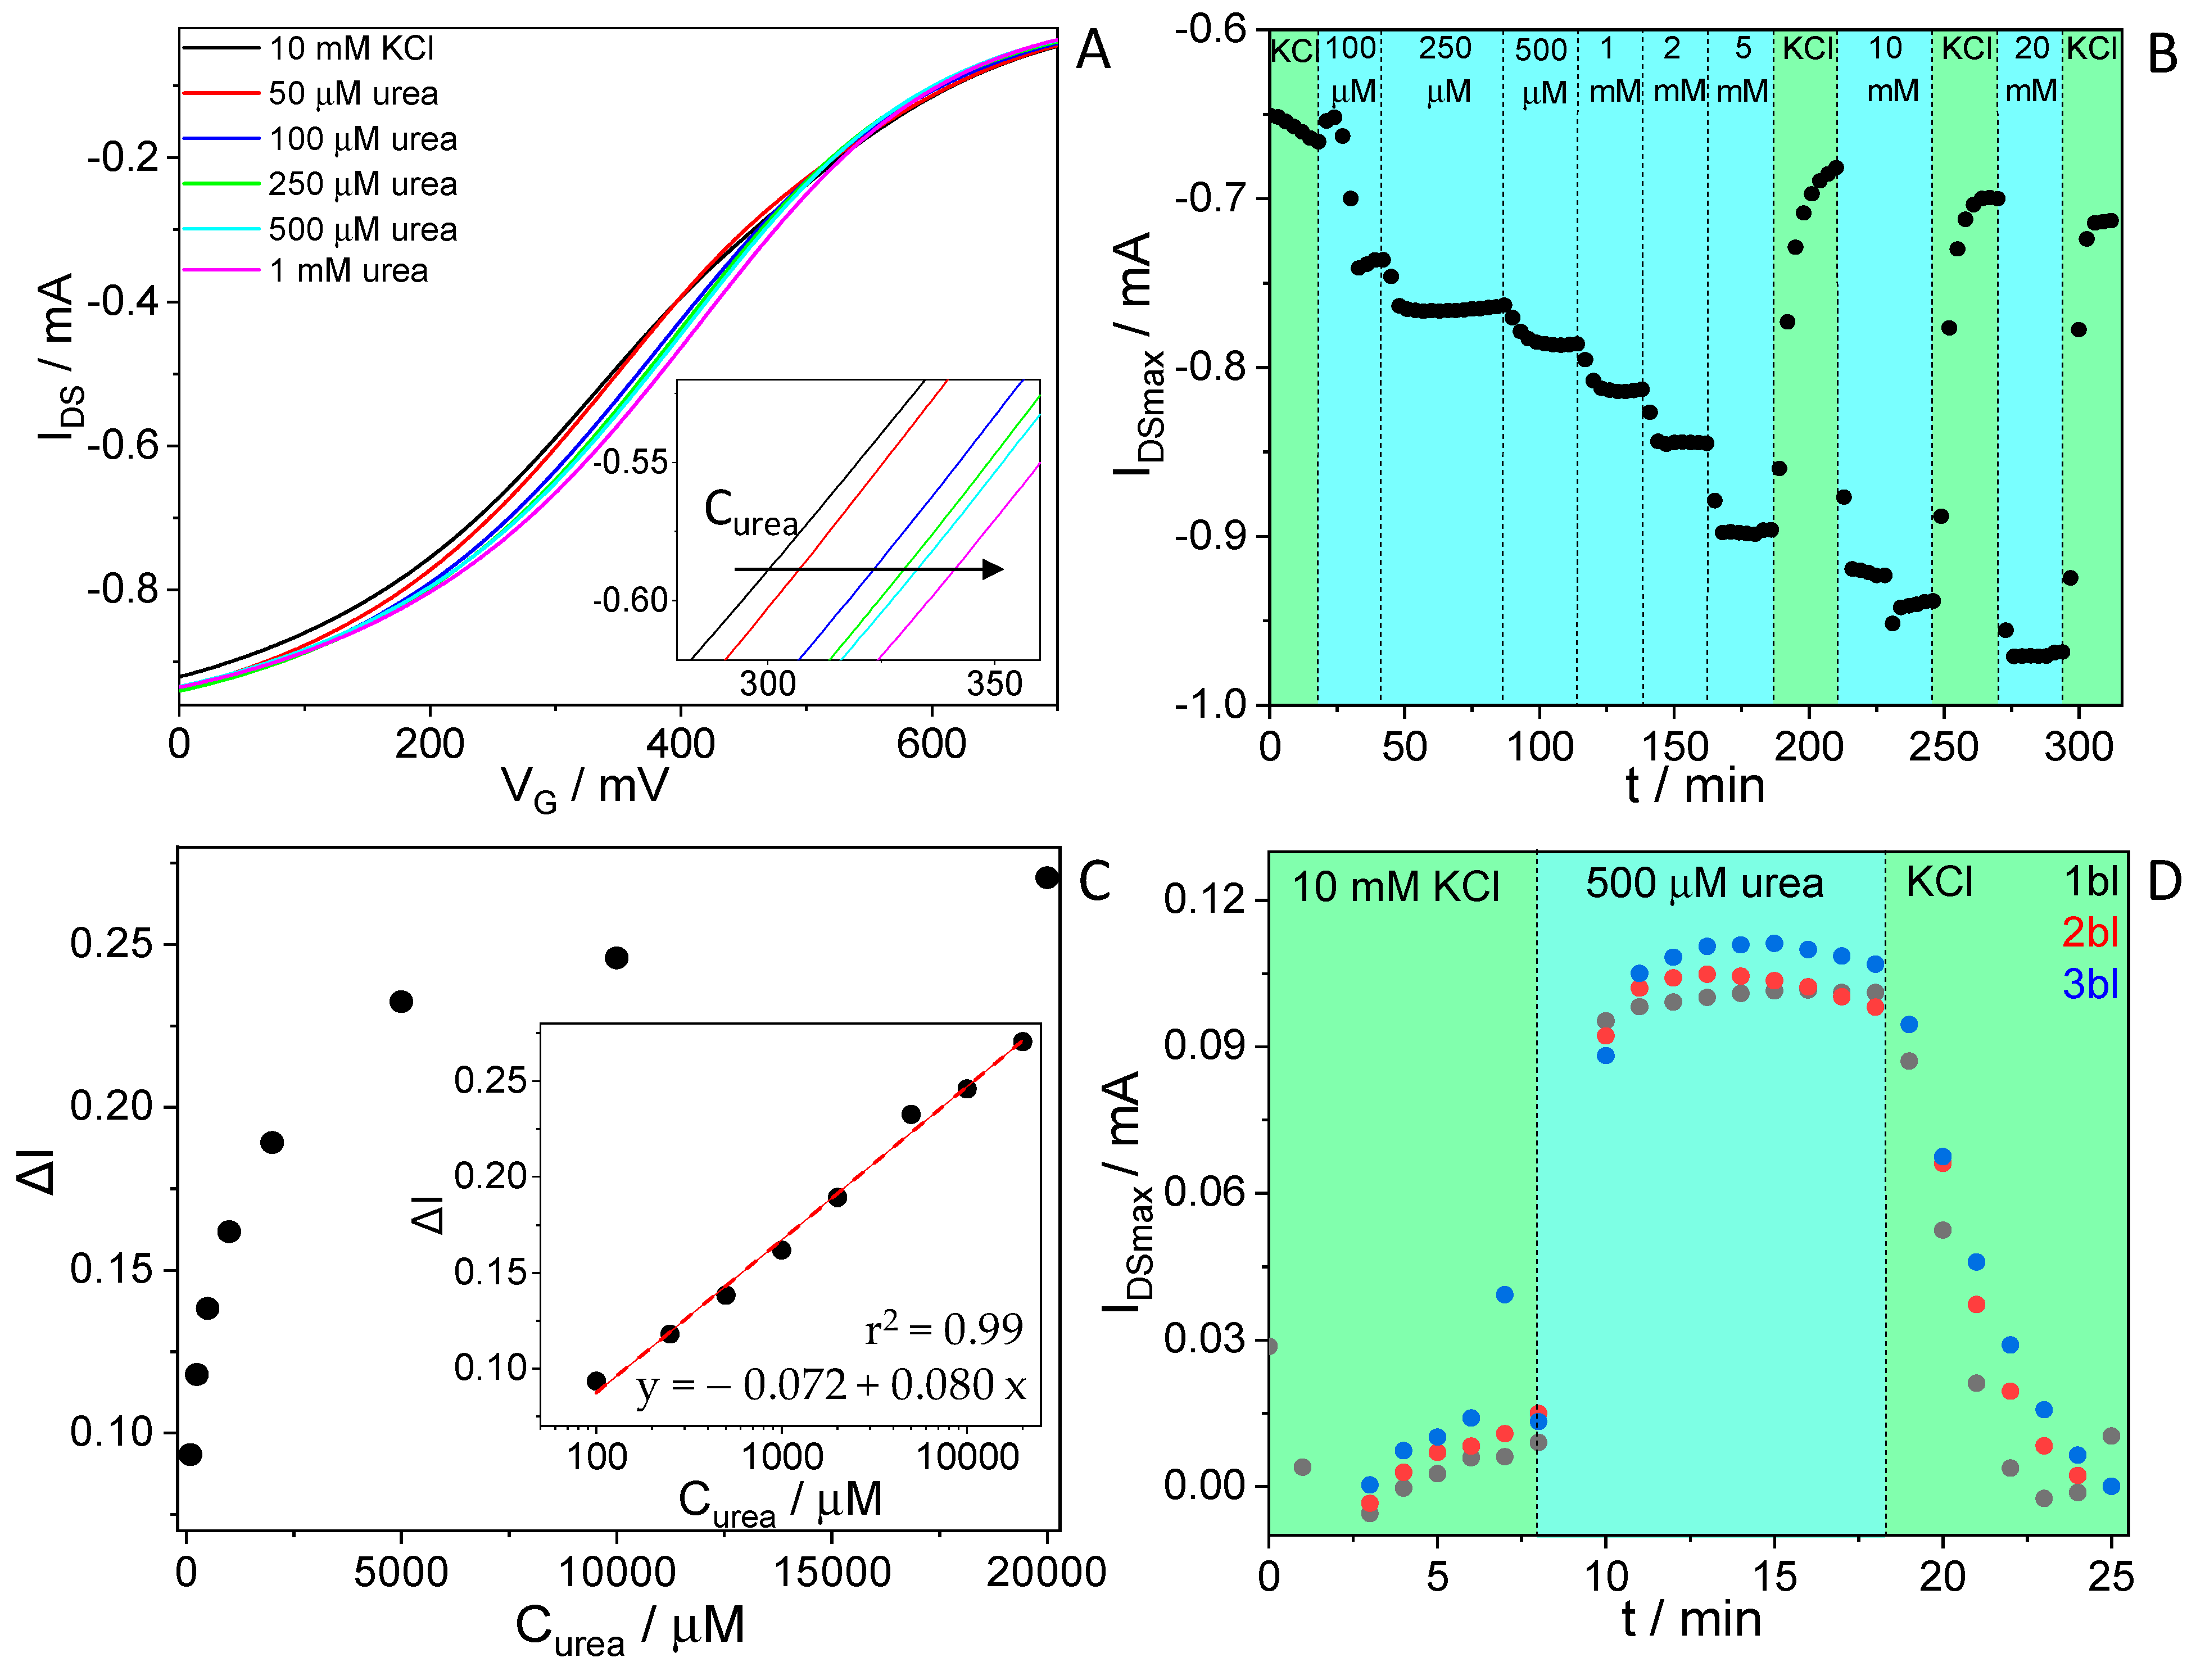
3.2. Urea Sensing with OECTs

Next, the performance of urease-modified PEDOT-PAH OECTs towards urea biosensing was evaluated. To this end, urea solutions of increasing concentrations between 100 µM and 1 mM in 10 mM KCl were injected in an electrochemical flow cell as the transfer curves of the transistor were continuously scanned. In Figure 2A, the transfer curves of the enzyme-modified OECT in the presence of different concentrations of urea are shown. A shift in the transfer curves to higher gate voltages is observed. This shift in the transfer curves can be better visualized by monitoring the evolution of the IDS at a constant gate potential from the successive transfer curves. Figure 2B shows the time response of the transistor current change at a constant gate potential as a function of time for three independent urease-modified OECTs. For comparison, the results were normalized by the initial current (ΔI = ΔIDSmax/IDSmax0, where IDSmax0 is the initial IDSmax before urea injection). Baseline corrections were applied to the signals corresponding to the different urea concentrations to account for the drift in the response of the films (Figure S1B). When analyzed at constant VG, the shift in the transfer curves yields chronoamperometry-like curves that allow for the monitoring of the time response of the biosensing platform while injecting solutions with different urea concentrations. As shown in Figure 2B, the baseline-corrected current increases with the concentration of the enzyme substrate. Moreover, after returning to the KCl solution, the current practically returns to its initial value (before urea injection), demonstrating the reversibility of the response (Figure 2B and Figure S2). Although with certain dispersion, the relative changes in the IDSmax current for three transistors have a clear dependence on urea concentration, which supports the capability of the urease-modified OECT for sensing urea (Figure 2C). We will explore some alternatives to improve the OECT response to urea by integrating a polyelectrolyte in the following sections. On the other hand, the unmodified PEDOT-PAH OECTs do not show a response to urea before urease adsorption, which corroborates the influence of the enzymatic activity on the sensor response (Figure S3).
In the case of urea biosensing, the enzymatic reaction in the presence of urease generates ammonia, yielding an increase in the local pH (Figure 2D). Then, to study this sensing mechanism, we monitored the changes in the PEDOT-PAH transfer curves upon the injection of ammonium hydroxide solutions of different concentrations. To this end, increasing concentrations of NH4OH were added to 10 mM KCl solutions to obtain pH values between 6 and 11. In Figure 2E, the registered IDS-VG profiles are shown, where a shift in the curves to higher potential values can be observed as the pH increases (the transfer curves are normalized by the maximum current value for a better appreciation of the shift). This shift in the transfer curves to higher gate potentials upon a pH increase can be explained as a consequence of the deprotonation of the amino groups of the PAH, which leads to the stabilization of the positive charge carriers of the PEDOT channel [25]. Such pH dependence of the transfer curves of PEDOT-PAH OECTs has been ascribed to the presence of the polyamine within the conducting film [25,36], as both PEDOT:tosylate and PEDOT:PSS have poor pH dependence [59,60]; however, it can be gained by the incorporation of amino moieties [61]. Furthermore, the results obtained here are in good agreement with those observed in a previous work with acetylcholinesterase-modified PEDOT-PAH OECTs for acetylcholine detection, in which the generation of acetic acid yielded a decrease in the local pH that was accompanied by a shift in the transfer curves to lower gate potentials [25]. Thus, the results of the urea sensing are consistent with the deprotonation of the amino groups of PAH caused by the generation of ammonium in the catalytic reaction.

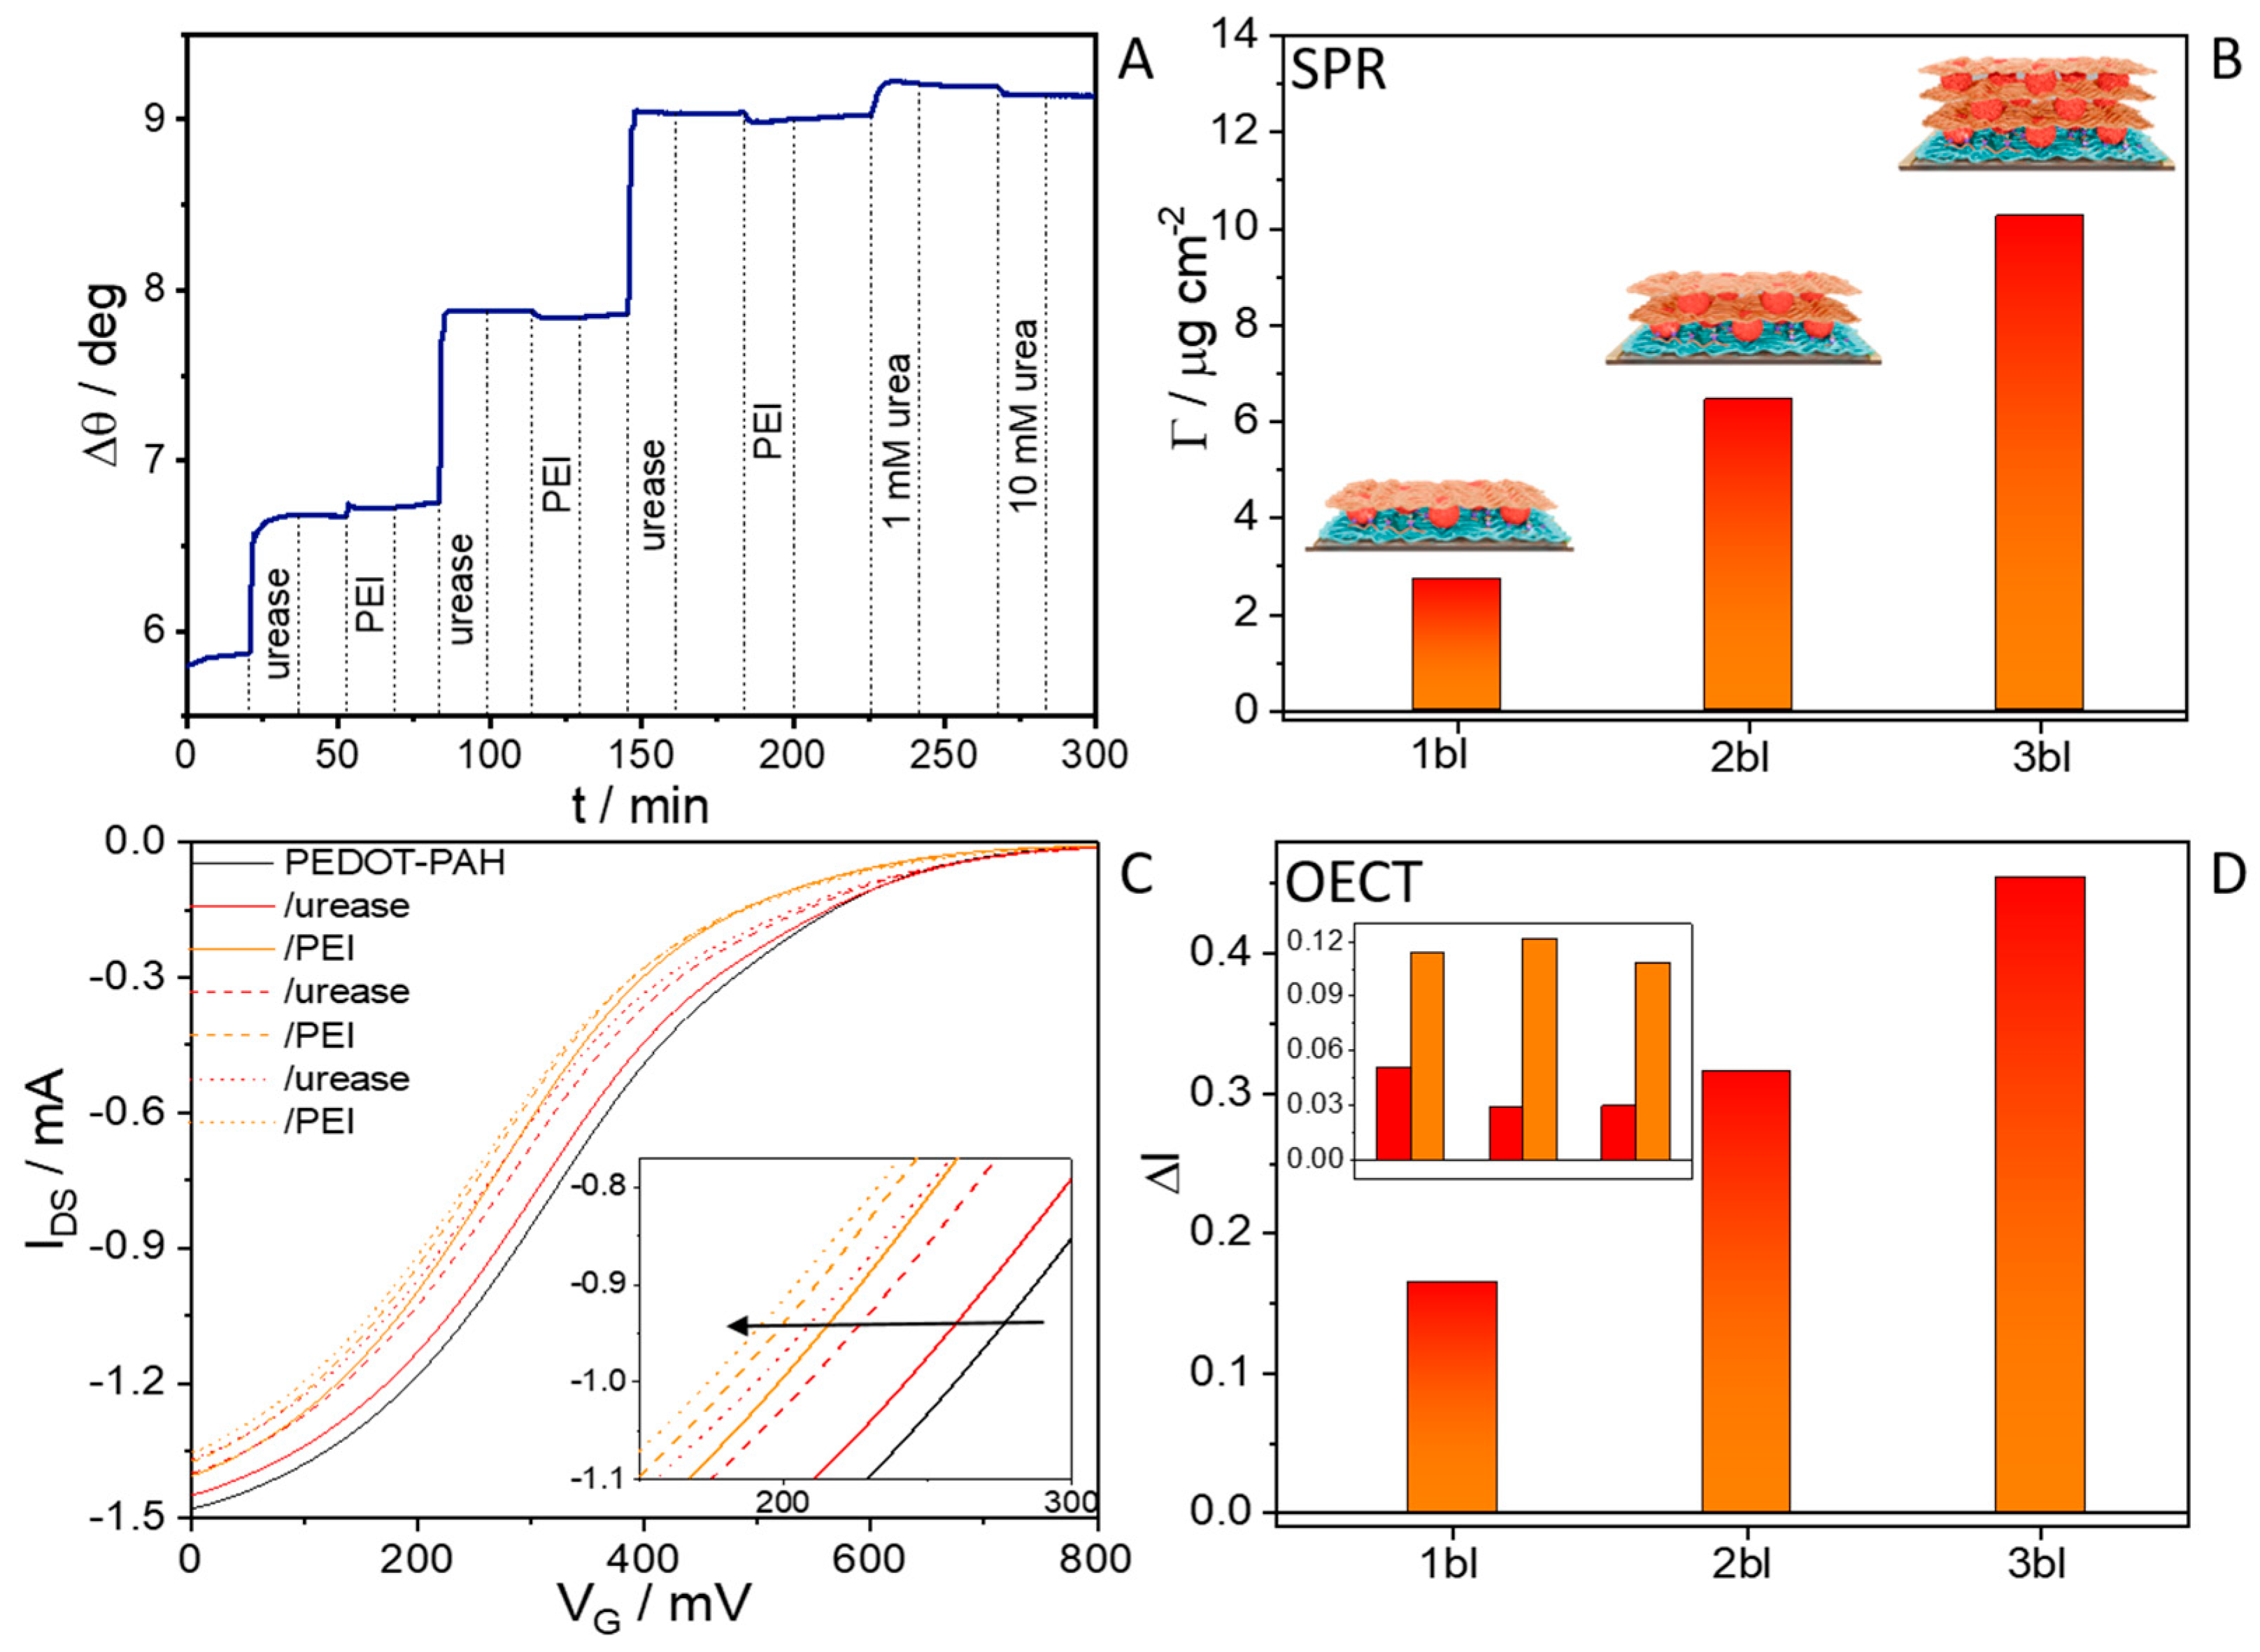
3.3. PEI Integration and Multilayer Assembly

After determining the capability of the urease-modified OECT for sensing urea, we proceeded to study the effect of the integration of a polyelectrolyte, polyethylenimine (PEI), to improve the sensor response since it is well known that the addition of polyelectrolytes covering protein layers improves the stability of the assemblies, avoiding the desorption of the active components [62,63]. Firstly, the subsequent deposition of urease and PEI was performed on a PEDOT-PAH gold substrate under a continuous flow while the SPR signal was registered. In Figure 3A, an increase in the SPR signal can be observed after PEI adsorption. Note that this increase is much smaller than that obtained for urease adsorption, which can be attributed to the high molecular weight of the enzyme compared to the polyelectrolyte. However, an effective incorporation of PEI into the biomolecular architecture was verified by the following integration of further urease/PEI layers. The continuous increase in the SPR signal shown in Figure 3A indicates the adsorption of the positively polyelectrolyte into the assembly, driven by electrostatic interactions with the negatively charged enzyme at neutral pH. Moreover, PEI deposition generates an overcompensation of the surface charge, which allows for the subsequent addition of urease layers for the construction of a multilayer using the layer-by-layer technique. Finally, we injected 1 and 10 mM urea and no marked change was observed, indicating that the catalytic reaction that increases the local pH does not lead to LbL disassembly. Moreover, the mass densities deposited for each layer were calculated using Freijter’s equation, as explained in Section 3.1, for urease and using a dn/dc value of 0.197 cm3 g−1 for PEI. The obtained values are shown in Figure 3B. Then, the assembly of the multilayer was also performed on the PEDOT-PAH interdigitated electrodes to study the OECT response during the adsorption processes. To this end, the macromolecules in 10 mM KCl solutions were injected under flow conditions, and the transfer curves were registered. In Figure 3C, the IDS-VG profiles are shown, where a shift to lower gate values can be observed after each layer deposition. Note that, in this case, the shift caused by PEI adsorption is much higher than the one generated by the deposition of the enzyme, opposite to the SPR behavior (see the inset in Figure 3D for the individual current change for each deposition step). This fact can be explained considering the de-doping effect of the highly positively charged polyelectrolyte on the PEDOT-PAH film due to the destabilization of the charge carriers of PEDOT. Moreover, the real-time monitoring of the macromolecules’ adsorption process was successfully achieved by computing the IDSmax as a function of time. In Figure 3D, the relative current changes after each bilayer deposition are shown, proving the device’s capability for monitoring the construction of the assembly.

3.4. Effect of PEI Integration on the Biosensor Stability and Effect of the Addition of Multiple Urease/PEI Bilayers on the Sensing Response

The effect of PEI on the response of the biosensor was studied by modifying a PEDOT-PAH OECT with a urease/PEI bilayer and then measuring the response of the transistor in solutions of increasing urea concentration under the same conditions as those in Section 3.2. In Figure 4A, a shift to lower values of the transfer curves as the urea concentration increases can be observed, qualitatively similar to the behavior observed in the absence of PEI. However, when analyzing the evolution of the current at constant VG, responses with less drift are obtained (Figure 4B), leading to more accurately pronounced jumps in the signal (see Figure S1B for contrast). In this regard, the real-time monitoring of urea sensing in terms of IDSmax vs. time in Figure 4B shows a very stable baseline and a well-defined increase in the signal is observed after each urea injection. Moreover, the magnitude of the increase is similar to that obtained with the urease-modified transistor, proving that the presence of PEI atop the surface does not hinder the path followed by the urea molecules to reach urease and react. Figure 4C shows the variations in normalized current as a function of urea concentration for the urease/PEI single-bilayer system. This plot exhibits a typical saturation behavior consistent with the enzymes’ response. Furthermore, the amplitude of the OECT response is linear with the logarithm of the analyte concentration, indicating the potential of the system for urea quantification. Figure S4 illustrates the response in terms of the relative current change in the range of 100–1000 µM for five different urease/PEI-modified OECTs. Although normalizing current changes using initial values allows for a direct comparison of the results across different sensors, and in all cases, the current response is linear with the logarithm of urea concentration, the dispersion using normalized current as an analytical parameter is relatively large, making it difficult to determine a universal calibration curve in these OECTs. However, the response of the transistors can be used for analytical purposes if a calibration curve is constructed with each specific transistor, as illustrated in the following section for the analysis of a urine sample.
The effect of successive enzyme layer incorporation was also studied from a functional standpoint. The magnitude of sensor response to increasing concentrations of urea does not change significantly when comparing a single bilayer system with two bilayers (Figure S5). In fact, the variation in response in the presence of 500 µM of urea for assemblies with one, two, and three bilayers (Figure 4D) indicates that the sensing response is independent of the amount of enzyme incorporated beyond the first bilayer. This is different from what was observed with gFETs, where it was found that the response increases with up to three bilayers [37]. Therefore, the architecture with one urease/PEI bilayer was chosen for the following studies in real biological samples, as this assembly is the simplest and provides the same response as the more complex ones. Moreover, the sensing response of this assembly becomes stable and quantitatively reproducible for a given urease/PEI-modified OECT (Figure S6). Nonetheless, it is interesting to note that the construction of the three-bilayer assembly did not increase or decrease the amplitude of the signal, meaning that the addition of large blocks of macromolecules on top of the sensing system does not hinder the sensing process. This could be relevant for the construction of sensing architectures that required the incorporation of large molecules or macromolecules with antifouling purposes.

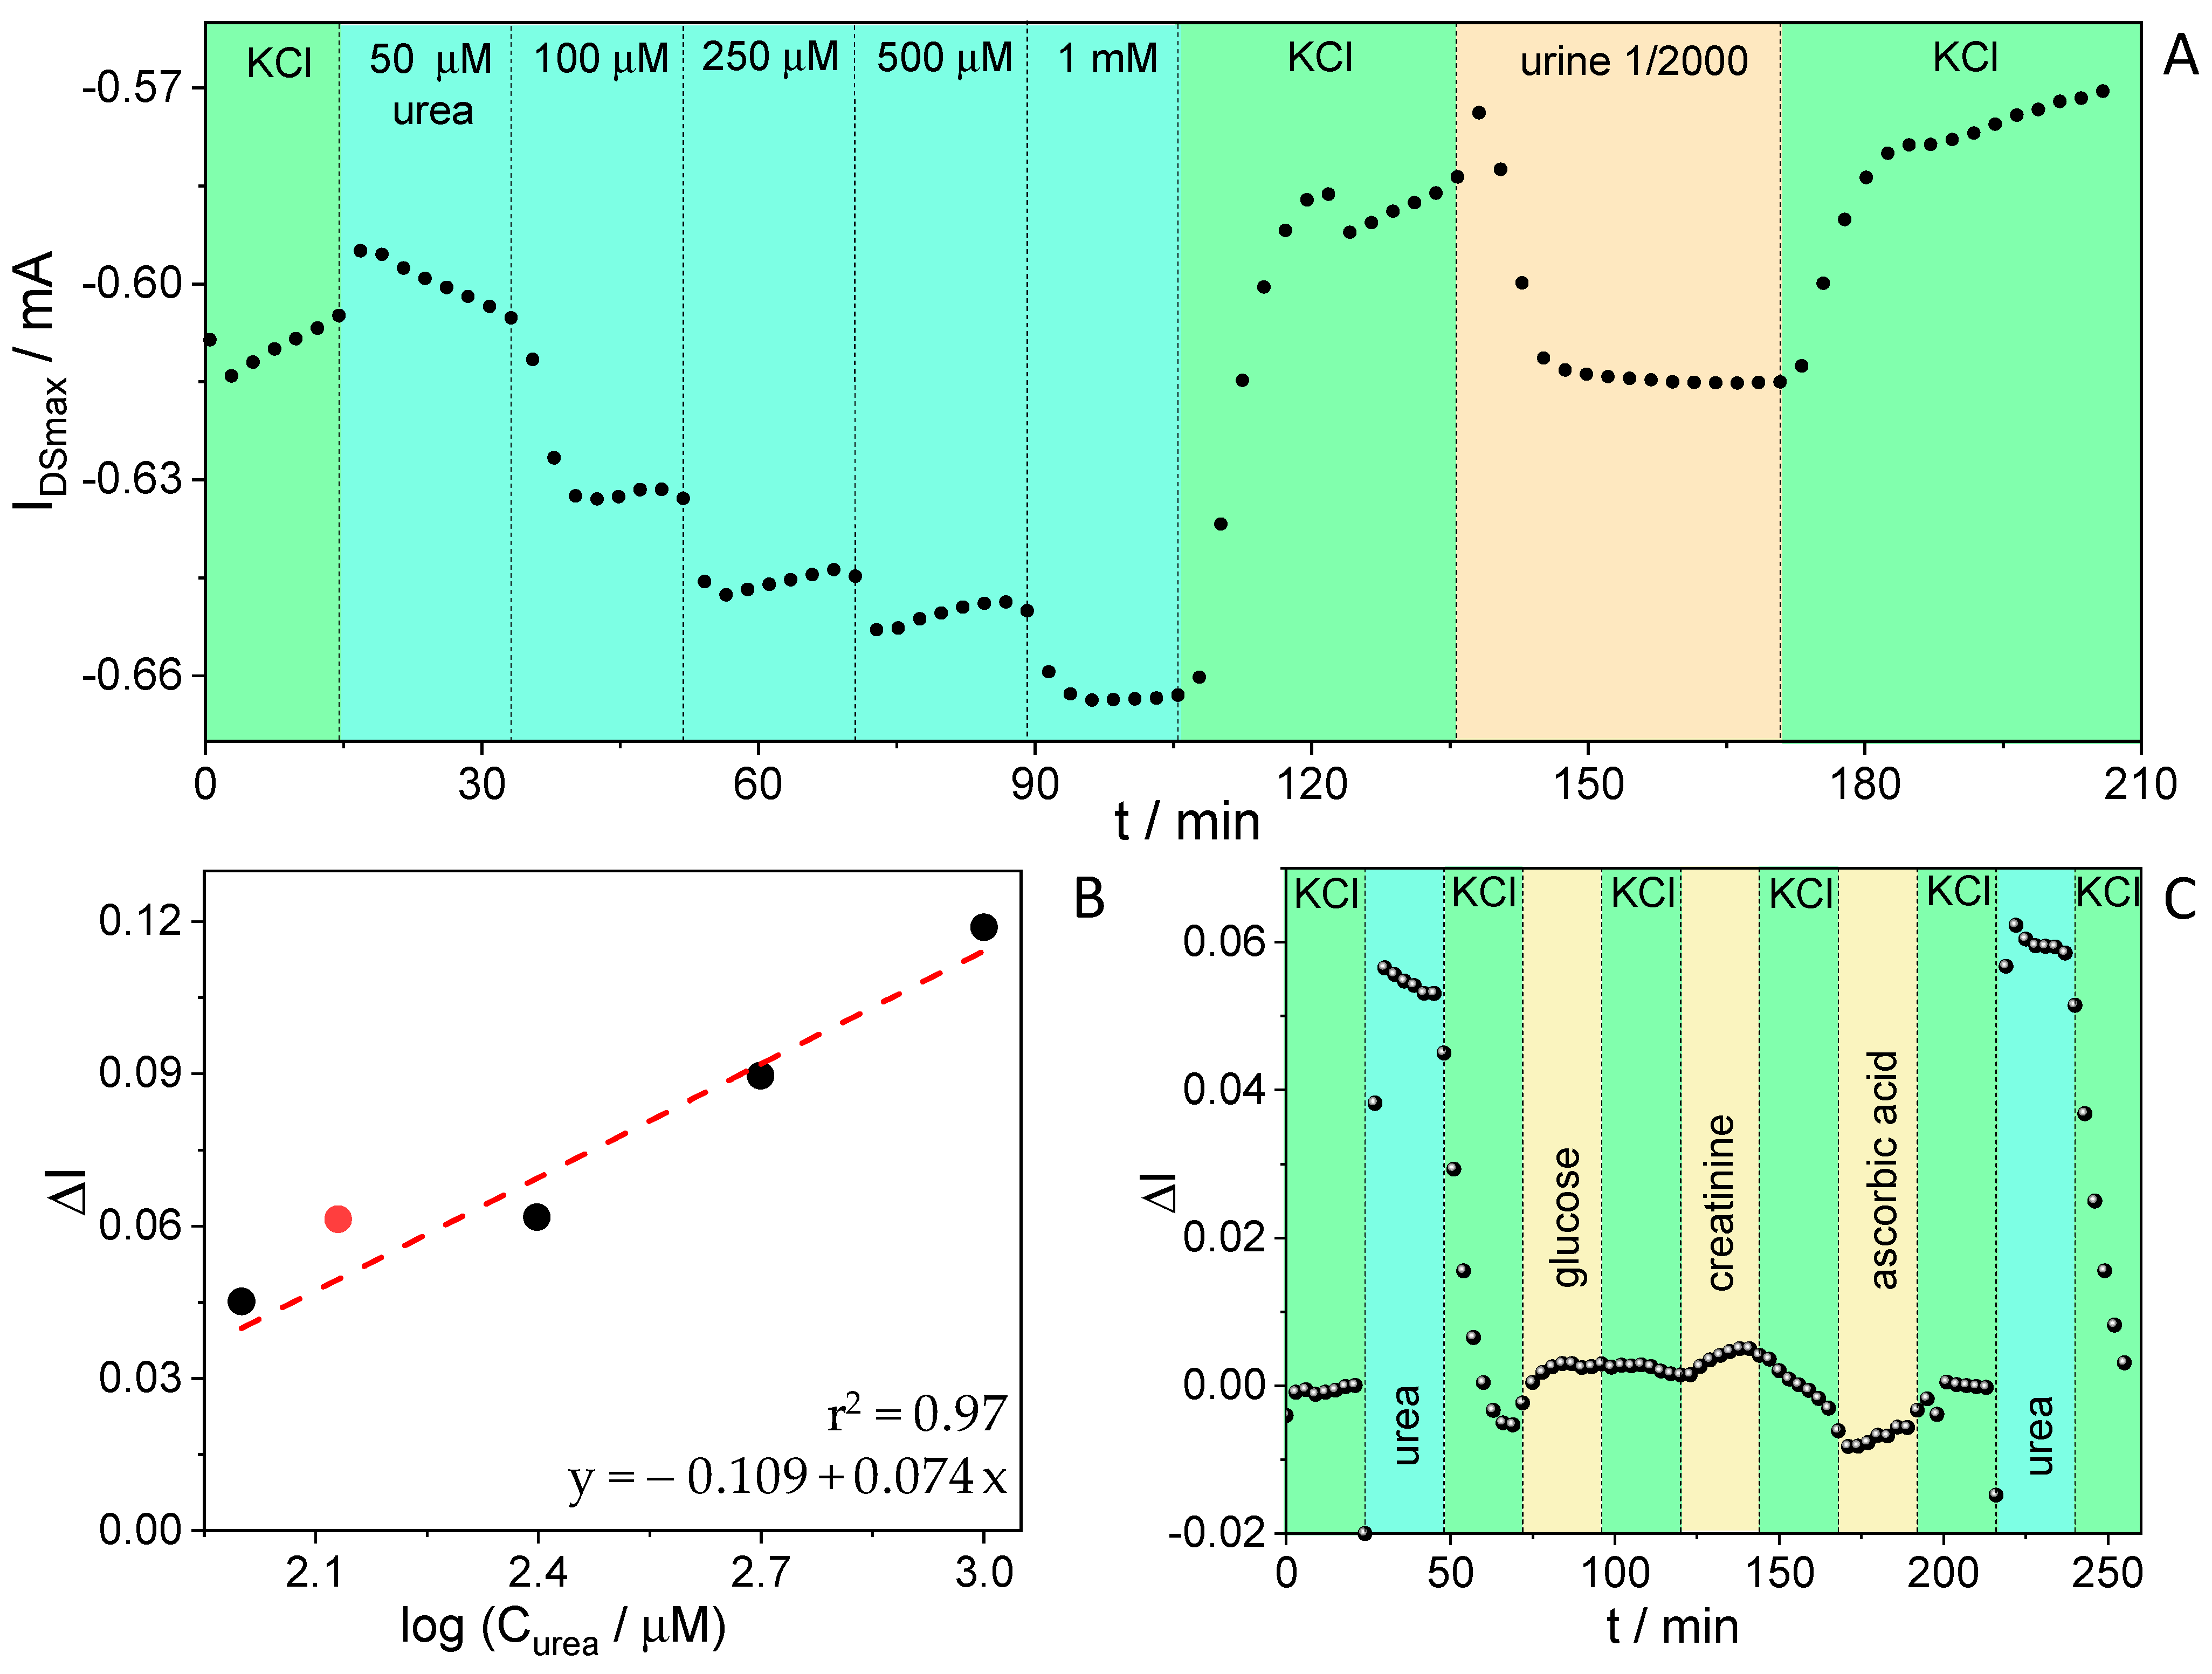
3.5. Urea Sensing from Real Urine Samples

The determination of urea levels in urine has great importance in clinical analysis since it allows for the evaluation of kidneys’ functionality through a non-invasive technique. Therefore, during the development of urea biosensors, testing the performance in real urine samples is necessary in order to determine the specificity of the devices and the possible interfering effects of other components present in biological samples. Thus, as a final step of this work, we evaluated the performance of PEDOT-PAH OECTs modified with urease/PEI for the sensing of urea in diluted urine.
For this study, a calibration curve was performed by injecting urea solutions of increasing concentrations between 100 and 1000 µM in 10 mM KCl under continuous-flow conditions while registering the transfer curves with the OECT. Then, the transistor was rinsed with KCl to recover the initial profile, and then 1:2000 dilution of urine in 10 mM KCl of pH = 7.4 was injected into the cell. The real-time response of the transistor is presented in Figure 5A, which shows the current change at a constant gate potential. Something important to notice is that the current returns to the same baseline after urine measurement, indicating that the OECT assembly is not damaged during the analysis. From the relative changes in the IDSmax corresponding to each addition, the curve presented in Figure 5B is obtained. As shown in this figure, the sample (red point) fits with the general trend using the initial concentration as determined from the standard clinical analysis after dilution (135 µM), showing the potential of the platform for urea determination from urine samples. Table 1 summarizes the performance of several field-effect-based sensor systems for urea reported recently, including the present results. The results from the table show that our system has a performance comparable to that of some recently reported sensors of this type, particularly with regard to the capability of measuring in real matrices.
Finally, the selectivity of the system was evaluated using possible interfering agents, such as glucose, ascorbic acid and creatinine [68,69]. Selectivity was studied by subsequently injecting solutions of urea, glucose, creatinine, ascorbic acid and urea in 10 mM KCl, and the biosensor was rinsed with KCl between each analyte. Figure 5C shows the response of the biosensor to the potential interferences mentioned above. It is possible to see that when the device is exposed to urea, a clear response in the current is observed (around 6% of the initial signal) but there are no appreciable changes with the interfering agents.

4. Conclusions

In this work, we studied the integration of urease onto the conducting channels of PEDOT-PAH-based OECTs through changes in the transistor response resulting from continuous cycling of the gate potential under flow conditions. The incorporation of the polyamine into the conducting channel does not limit its conductivity and allows for the electrostatic anchoring of the functional enzyme, yielding a highly stable assembly. The exposition of the urease-modified transistors to urea solutions leads to changes in the device current that can be explained as a consequence of the local pH change generated by of the enzymatic catalysis. Additionally, the response in terms of the change in the drain–source current at the maximum transconductance gate voltage becomes linear with the logarithm of urea concentration and selective towards urea over other potentially interfering substances, indicating the possibility of urea sensing through changes in transistor channel conductivity. Furthermore, the adsorption of a layer of PEI onto urease improves the response stability. Thus, the assembly of urease/PEI on the conducting channel allows for urea sensing even from diluted urine, demonstrating the potential of this strategy for building sensors based on enzyme integration that promote local pH changes directly on the conducting channels of OECTs.

Supplementary Materials

The following supporting information can be downloaded at: https://www.mdpi.com/article/10.3390/chemosensors12070124/s1, Figure S1: Determination of the OECT characteristic parameters from continuous scanning; Figure S2: Urea sensing reproducibility with urease/PEDOT-PAH based OECTs, Figure S3: Urease-free control experiment; Figure S4: Reproducibility of the performance of the urease/PEI-modified OECTs; Figure S5: Effect of the addition of two urease/PEI bilayers on the sensing response. Figure S6: stability of the sensing response of the urease/PEI-modified OECTs.

Author Contributions

Conceptualization, J.S., W.A.M.; methodology, J.R.N.R., M.M.-J. and J.S.; formal analysis, J.S.; investigation, J.R.N.R. and M.M.-J.; data curation, J.R.N.R., M.M.-J. and J.S.; writing—original draft preparation, J.R.N.R. and J.S.; writing—review and editing, O.A. and W.A.M.; visualization, J.R.N.R. and J.S.; supervision, J.S. and W.A.M.; project administration, O.A. and W.A.M.; funding acquisition, O.A. and W.A.M. All authors have read and agreed to the published version of the manuscript.

Funding

This research was funded by Universidad Nacional de La Plata (PID-X867), CONICET (PIP 11220210100209CO), and ANPCyT (PICT-2020-02468 and PICT-2021-GRFTI-00042).

Institutional Review Board Statement

Not applicable.

Informed Consent Statement

Informed consent was obtained from the person whose urine sample was analyzed, who is one of the authors.

Data Availability Statement

The original contributions presented in the study are included in the article and the supplementary material, further inquiries can be directed to the corresponding author.

Conflicts of Interest

The authors declare no conflict of interest.

References

  1. Rivnay, J.; Inal, S.; Salleo, A.; Owens, R.M.; Berggren, M.; Malliaras, G.G. Organic electrochemical transistors. Nat. Rev. Mater. 2018, 3, 17086. [Google Scholar] [CrossRef]
  2. Marks, A.; Griggs, S.; Gasparini, N.; Moser, M. Organic Electrochemical Transistors: An Emerging Technology for Biosensing. Adv. Mater. Interfaces 2022, 9, 2102039. [Google Scholar] [CrossRef]
  3. Wang, N.; Yang, A.; Fu, Y.; Li, Y.; Yan, F. Functionalized Organic Thin Film Transistors for Biosensing. Acc. Chem. Res. 2019, 52, 277–287. [Google Scholar] [CrossRef]
  4. Koklu, A.; Ohayon, D.; Wustoni, S.; Druet, V.; Saleh, A.; Inal, S. Organic Bioelectronic Devices for Metabolite Sensing. Chem. Rev. 2022, 122, 4581–4635. [Google Scholar] [CrossRef]
  5. Lin, P.; Yan, F. Organic Thin-Film Transistors for Chemical and Biological Sensing. Adv. Mater. 2012, 24, 34–51. [Google Scholar] [CrossRef]
  6. Bernards, D.A.; Malliaras, G.G. Steady-State and Transient Behavior of Organic Electrochemical Transistors. Adv. Funct. Mater. 2007, 17, 3538–3544. [Google Scholar] [CrossRef]
  7. Vurro, F.; Marchetti, E.; Bettelli, M.; Manfrini, L.; Finco, A.; Sportolaro, C.; Coppedè, N.; Palermo, N.; Tommasini, M.G.; Zappettini, A.; et al. Application of the OECT-Based In Vivo Biosensor Bioristor in Fruit Tree Monitoring to Improve Agricultural Sustainability. Chemosensors 2023, 11, 374. [Google Scholar] [CrossRef]
  8. Diacci, C.; Abedi, T.; Lee, J.W.; Gabrielsson, E.O.; Berggren, M.; Simon, D.T.; Niittylä, T.; Stavrinidou, E. Diurnal in vivo xylem sap glucose and sucrose monitoring using implantable organic electrochemical transistor sensors. iScience 2021, 24, 101966. [Google Scholar] [CrossRef]
  9. Tseng, H.; Chen, Y.; Zhang, P.; Hsiao, Y. Additive Blending Effects on PEDOT:PSS Composite Films for Wearable Organic Electrochemical Transistors. ACS Appl. Mater. Interfaces 2024, 16, 13384–13398. [Google Scholar] [CrossRef]
  10. Currano, L.J.; Sage, F.C.; Hagedon, M.; Hamilton, L.; Patrone, J.; Gerasopoulos, K. Wearable Sensor System for Detection of Lactate in Sweat. Sci. Rep. 2018, 8, 15890. [Google Scholar] [CrossRef] [PubMed]
  11. Qing, X.; Wang, Y.; Zhang, Y.; Ding, X.; Zhong, W.; Wang, D.; Wang, W.; Liu, Q.; Liu, K.; Li, M.; et al. Wearable Fiber-Based Organic Electrochemical Transistors as a Platform for Highly Sensitive Dopamine Monitoring. ACS Appl. Mater. Interfaces 2019, 11, 13105–13113. [Google Scholar] [CrossRef] [PubMed]
  12. Higgins, S.G.; Lo Fiego, A.; Patrick, I.; Creamer, A.; Stevens, M.M. Organic Bioelectronics: Using Highly Conjugated Polymers to Interface with Biomolecules, Cells, and Tissues in the Human Body. Adv. Mater. Technol. 2020, 5, 2000384. [Google Scholar] [CrossRef]
  13. Kim, C.-H.; Azimi, M.; Fan, J.; Nagarajan, H.; Wang, M.; Cicoira, F. All-printed and stretchable organic electrochemical transistors using a hydrogel electrolyte. Nanoscale 2023, 15, 3263–3272. [Google Scholar] [CrossRef]
  14. Wang, L.; Yue, X.; Sun, Q.; Zhang, L.; Ren, G.; Lu, G.; Yu, H.-D.; Huang, W. Flexible organic electrochemical transistors for chemical and biological sensing. Nano Res. 2022, 15, 2433–2464. [Google Scholar] [CrossRef]
  15. Paulsen, B.D.; Tybrandt, K.; Stavrinidou, E.; Rivnay, J. Organic mixed ionic–electronic conductors. Nat. Mater. 2020, 19, 13–26. [Google Scholar] [CrossRef]
  16. Kukhta, N.A.; Marks, A.; Luscombe, C.K. Molecular Design Strategies toward Improvement of Charge Injection and Ionic Conduction in Organic Mixed Ionic-Electronic Conductors for Organic Electrochemical Transistors. Chem. Rev. 2022, 122, 4325–4355. [Google Scholar] [CrossRef] [PubMed]
  17. Fenoy, G.E.; Azzaroni, O.; Knoll, W.; Marmisollé, W.A. Functionalization Strategies of PEDOT and PEDOT:PSS Films for Organic Bioelectronics Applications. Chemosensors 2021, 9, 212. [Google Scholar] [CrossRef]
  18. Fan, X.; Nie, W.; Tsai, H.; Wang, N.; Huang, H.; Cheng, Y.; Wen, R.; Ma, L.; Yan, F.; Xia, Y. PEDOT:PSS for Flexible and Stretchable Electronics: Modifications, Strategies, and Applications. Adv. Sci. 2019, 6, 1900813. [Google Scholar] [CrossRef] [PubMed]
  19. Bidinger, S.L.; Han, S.; Malliaras, G.G.; Hasan, T. Highly stable PEDOT:PSS electrochemical transistors. Appl. Phys. Lett. 2022, 120, 073302. [Google Scholar] [CrossRef]
  20. Carli, S.; Bianchi, M.; Di Lauro, M.; Prato, M.; Toma, A.; Leoncini, M.; De Salvo, A.; Murgia, M.; Fadiga, L.; Biscarini, F. Multifunctionally-doped PEDOT for organic electrochemical transistors. Front. Mater. 2022, 9, 1–15. [Google Scholar] [CrossRef]
  21. Colucci, R.; Feitosa, B.d.A.; Faria, G.C. Impact of Ionic Species on the Performance of Pedot:PSS-Based Organic Electrochemical Transistors. Adv. Electron. Mater. 2023, 10, 2300235. [Google Scholar] [CrossRef]
  22. Sappia, L.D.; Pascual, B.S.; Azzaroni, O.; Marmisollé, W. PEDOT-Based Stackable Paper Electrodes for Metal-Free Supercapacitors. ACS Appl. Energy Mater. 2021, 4, 9283–9293. [Google Scholar] [CrossRef]
  23. Fenoy, G.E.; Scotto, J.; Allegretto, J.A.; Piccinini, E.; Cantillo, A.L.; Knoll, W.; Azzaroni, O.; Marmisollé, W.A. Layer-by-Layer Assembly Monitored by PEDOT-Polyamine-Based Organic Electrochemical Transistors. ACS Appl. Electron. Mater. 2022, 4, 5953–5962. [Google Scholar] [CrossRef]
  24. Montero-Jimenez, M.; Amante, F.L.; Fenoy, G.E.; Scotto, J.; Azzaroni, O.; Marmisolle, W.A. PEDOT-Polyamine-Based Organic Electrochemical Transistors for Monitoring Protein Binding. Biosensors 2023, 13, 288. [Google Scholar] [CrossRef] [PubMed]
  25. Fenoy, G.E.; von Bilderling, C.; Knoll, W.; Azzaroni, O.; Marmisollé, W.A. PEDOT:Tosylate-Polyamine-Based Organic Electrochemical Transistors for High-Performance Bioelectronics. Adv. Electron. Mater. 2021, 7, 2100059. [Google Scholar] [CrossRef]
  26. Sappia, L.D.; Piccinini, E.; von Binderling, C.; Knoll, W.; Marmisollé, W.; Azzaroni, O. PEDOT-polyamine composite films for bioelectrochemical platforms—Flexible and easy to derivatize. Mater. Sci. Eng. C 2020, 109, 110575. [Google Scholar] [CrossRef] [PubMed]
  27. Sappia, L.D.; Piccinini, E.; Marmisollé, W.; Santilli, N.; Maza, E.; Moya, S.; Battaglini, F.; Madrid, R.E.; Azzaroni, O. Integration of Biorecognition Elements on PEDOT Platforms through Supramolecular Interactions. Adv. Mater. Interfaces 2017, 4, 1700502. [Google Scholar] [CrossRef]
  28. Liao, C.; Mak, C.; Zhang, M.; Chan, H.L.W.; Yan, F. Flexible Organic Electrochemical Transistors for Highly Selective Enzyme Biosensors and Used for Saliva Testing. Adv. Mater. 2015, 27, 676–681. [Google Scholar] [CrossRef] [PubMed]
  29. Fu, Y.; Wang, N.; Yang, A.; Law, H.K.; Li, L.; Yan, F. Highly Sensitive Detection of Protein Biomarkers with Organic Electrochemical Transistors. Adv. Mater. 2017, 29, 1703787. [Google Scholar] [CrossRef]
  30. Tang, H.; Yan, F.; Lin, P.; Xu, J.; Chan, H.L.W. Highly Sensitive Glucose Biosensors Based on Organic Electrochemical Transistors Using Platinum Gate Electrodes Modified with Enzyme and Nanomaterials. Adv. Funct. Mater. 2011, 21, 2264–2272. [Google Scholar] [CrossRef]
  31. Liao, C.; Zhang, M.; Niu, L.; Zheng, Z.; Yan, F. Highly selective and sensitive glucose sensors based on organic electrochemical transistors with graphene-modified gate electrodes. J. Mater. Chem. B 2013, 1, 3820. [Google Scholar] [CrossRef] [PubMed]
  32. Demuru, S.; Huang, C.-H.; Parvez, K.; Worsley, R.; Mattana, G.; Piro, B.; Noël, V.; Casiraghi, C.; Briand, D. All-Inkjet-Printed Graphene-Gated Organic Electrochemical Transistors on Polymeric Foil as Highly Sensitive Enzymatic Biosensors. ACS Appl. Nano Mater. 2022, 5, 1664–1673. [Google Scholar] [CrossRef]
  33. Diacci, C.; Lee, J.W.; Janson, P.; Dufil, G.; Méhes, G.; Berggren, M.; Simon, D.T.; Stavrinidou, E. Real-Time Monitoring of Glucose Export from Isolated Chloroplasts Using an Organic Electrochemical Transistor. Adv. Mater. Technol. 2020, 5, 1900262. [Google Scholar] [CrossRef]
  34. Galliani, M.; Diacci, C.; Berto, M.; Sensi, M.; Beni, V.; Berggren, M.; Borsari, M.; Simon, D.T.; Biscarini, F.; Bortolotti, C.A. Flexible Printed Organic Electrochemical Transistors for the Detection of Uric Acid in Artificial Wound Exudate. Adv. Mater. Interfaces 2020, 7, 2001218. [Google Scholar] [CrossRef]
  35. Braendlein, M.; Pappa, A.; Ferro, M.; Lopresti, A.; Acquaviva, C.; Mamessier, E.; Malliaras, G.G.; Owens, R.M. Lactate Detection in Tumor Cell Cultures Using Organic Transistor Circuits. Adv. Mater. 2017, 29, 1605744. [Google Scholar] [CrossRef]
  36. Montero-Jimenez, M.; Lugli-Arroyo, J.; Fenoy, G.E.; Piccinini, E.; Knoll, W.; Marmisollé, W.A.; Azzaroni, O. Transduction of Amine–Phosphate Supramolecular Interactions and Biosensing of Acetylcholine through PEDOT-Polyamine Organic Electrochemical Transistors. ACS Appl. Mater. Interfaces 2023. Epub ahead of print. [Google Scholar] [CrossRef]
  37. Piccinini, E.; Bliem, C.; Reiner-Rozman, C.; Battaglini, F.; Azzaroni, O.; Knoll, W. Enzyme-polyelectrolyte multilayer assemblies on reduced graphene oxide field-effect transistors for biosensing applications. Biosens. Bioelectron. 2017, 92, 661–667. [Google Scholar] [CrossRef]
  38. Pérez-Mitta, G.; Peinetti, A.S.; Cortez, M.L.; Toimil-Molares, M.E.; Trautmann, C.; Azzaroni, O. Highly Sensitive Biosensing with Solid-State Nanopores Displaying Enzymatically Reconfigurable Rectification Properties. Nano Lett. 2018, 18, 3303–3310. [Google Scholar] [CrossRef]
  39. Berto, M.; Diacci, C.; Theuer, L.; Di Lauro, M.; Simon, D.T.; Berggren, M.; Biscarini, F.; Beni, V.; Bortolotti, C.A. Label free urea biosensor based on organic electrochemical transistors. Flex. Print. Electron. 2018, 3, 024001. [Google Scholar] [CrossRef]
  40. Shalileh, F.; Sabahi, H.; Dadmehr, M.; Hosseini, M. Sensing approaches toward detection of urea adulteration in milk. Microchem. J. 2023, 193, 108990. [Google Scholar] [CrossRef]
  41. Dhawan, G.; Sumana, G.; Malhotra, B.D. Recent developments in urea biosensors. Biochem. Eng. J. 2009, 44, 42–52. [Google Scholar] [CrossRef]
  42. Berger, M.; Sehlmeyer, M.; Sellering, F.; Röhrich, H.; Perl, T.; Mansour, H.; Baasner, D.; Zimmermann, S. In-line monitoring of electrolytes and urea during continuous renal replacement therapy. J. Sens. Sens. Syst. 2020, 9, 251–262. [Google Scholar] [CrossRef]
  43. Derin, E.; Inci, F. Advances in Biosensor Technologies for Acute Kidney Injury. ACS Sens. 2022, 7, 358–385. [Google Scholar] [CrossRef]
  44. Liu, L.; Mo, H.; Wei, S.; Raftery, D. Quantitative analysis of urea in human urine and serum by 1H nuclear magnetic resonance. Analyst 2012, 137, 595–600. [Google Scholar] [CrossRef] [PubMed]
  45. Taylor, A.J.; Vadgama, P. Analytical Reviews in Clinical Biochemistry: The Estimation of Urea. Ann. Clin. Biochem. Int. J. Lab. Med. 1992, 29, 245–264. [Google Scholar] [CrossRef]
  46. SINGH, M.; VERMA, N.; GARG, A.; REDHU, N. Urea biosensors. Sens. Actuators B Chem. 2008, 134, 345–351. [Google Scholar] [CrossRef]
  47. Quadrini, L.; Laschi, S.; Ciccone, C.; Catelani, F.; Palchetti, I. Electrochemical methods for the determination of urea: Current trends and future perspective. TrAC Trends Anal. Chem. 2023, 168, 117345. [Google Scholar] [CrossRef]
  48. Botewad, S.N.; Gaikwad, D.K.; Girhe, N.B.; Thorat, H.N.; Pawar, P.P. Urea biosensors: A comprehensive review. Biotechnol. Appl. Biochem. 2023, 70, 485–501. [Google Scholar] [CrossRef] [PubMed]
  49. Pundir, C.S.; Jakhar, S.; Narwal, V. Determination of urea with special emphasis on biosensors: A review. Biosens. Bioelectron. 2019, 123, 36–50. [Google Scholar] [CrossRef] [PubMed]
  50. Elmasry, M.R.; Shaban, S.M.; Elbalaawy, A.Y.; Hafez, E.; Shin, J.; Cho, S.-Y.; Kim, D.-H. Fluorometric and Colorimetric Hybrid Carbon-Dot Nanosensors for Dual Monitoring of Urea. ACS Appl. Nano Mater. 2023, 6, 7992–8003. [Google Scholar] [CrossRef]
  51. Sharma, S.; Mishra, S.K. Exploiting the Advantages of Ag/ITO/Enzyme Trapped Gel Layers to Develop a Highly Sensitive and Selective Fiber Optic Plasmonic Urea Sensor. Chemosensors 2023, 11, 421. [Google Scholar] [CrossRef]
  52. Cheng, L.; Zheng, W.; Zhang, Y.-N.; Li, X.; Zhao, Y. Highly Sensitive Fiber-Optic SPR Urea Sensor Based on ZIF-8/Urease. IEEE Trans. Instrum. Meas. 2023, 72, 7002807. [Google Scholar] [CrossRef]
  53. Yang, Y.; Yoon, S.G.; Shin, C.; Jin, H.; Lee, W.H.; Park, J.; Kim, Y.S. Ionovoltaic urea sensor. Nano Energy 2019, 57, 195–201. [Google Scholar] [CrossRef]
  54. Ortega Vega, M.R.; Luo, Y.; Werheid, M.; Weidinger, I.; Senkovska, I.; Grothe, J.; Kaskel, S. Ni-based metal-organic framework sensor material for urea detection: Mechanistic insights and performance. Electrochim. Acta 2024, 477, 143748. [Google Scholar] [CrossRef]
  55. Jaworska, E.; Maksymiuk, K.; Michalska, A. Carbon Nanotubes-Based Potentiometric Bio-Sensors for Determination of Urea. Chemosensors 2015, 3, 200–210. [Google Scholar] [CrossRef]
  56. Ibáñez-Redín, G.; Rosso Cagnani, G.; Gomes, N.O.; Raymundo-Pereira, P.A.; Machado, S.A.S.; Gutierrez, M.A.; Krieger, J.E.; Oliveira, O.N. Wearable potentiometric biosensor for analysis of urea in sweat. Biosens. Bioelectron. 2023, 223, 114994. [Google Scholar] [CrossRef] [PubMed]
  57. Khataee, S.; Dehghan, G.; Shaghaghi, Z.; Khataee, A. An enzyme-free sensor based on La-doped CoFe-layered double hydroxide decorated on reduced graphene oxide for sensitive electrochemical detection of urea. Microchim. Acta 2024, 191, 152. [Google Scholar] [CrossRef] [PubMed]
  58. Sanko, V.; Şenocak, A.; Tümay, S.O.; Demirbas, E. A novel comparative study for electrochemical urea biosensor design: Effect of different ferrite nanoparticles (MFe2O4, M: Cu, Co, Ni, Zn) in urease immobilized composite system. Bioelectrochemistry 2023, 149, 108324. [Google Scholar] [CrossRef] [PubMed]
  59. Khan, Z.U.; Bubnova, O.; Jafari, M.J.; Brooke, R.; Liu, X.; Gabrielsson, R.; Ederth, T.; Evans, D.R.; Andreasen, J.W.; Fahlman, M.; et al. Acido-basic control of the thermoelectric properties of poly(3,4-ethylenedioxythiophene)tosylate (PEDOT-Tos) thin films. J. Mater. Chem. C 2015, 3, 10616–10623. [Google Scholar] [CrossRef] [PubMed]
  60. Mitraka, E.; Kergoat, L.; Khan, Z.U.; Fabiano, S.; Douhéret, O.; Leclère, P.; Nilsson, M.; Andersson Ersman, P.; Gustafsson, G.; Lazzaroni, R.; et al. Solution processed liquid metal-conducting polymer hybrid thin films as electrochemical pH-threshold indicators. J. Mater. Chem. C 2015, 3, 7604–7611. [Google Scholar] [CrossRef]
  61. Buth, F.; Donner, A.; Sachsenhauser, M.; Stutzmann, M.; Garrido, J.A. Biofunctional Electrolyte-Gated Organic Field-Effect Transistors. Adv. Mater. 2012, 24, 4511–4517. [Google Scholar] [CrossRef]
  62. Song, J.; Jańczewski, D.; Ma, Y.; Hempenius, M.; Xu, J.; Vancso, G.J. Disassembly of redox responsive poly(ferrocenylsilane) multilayers: The effect of blocking layers, supporting electrolyte and polyion molar mass. J. Colloid Interface Sci. 2013, 405, 256–261. [Google Scholar] [CrossRef] [PubMed]
  63. Diforti, J.F.; Piccinini, E.; Allegretto, J.A.; von Bilderling, C.; Marmisollé, W.A.; Azzaroni, O. Empowering Bioelectronics with Supramolecular Nanoarchitectonics: PEDOT-Based Organic Electrochemical Transistors with Tunable Electronic Properties. ACS Appl. Electron. Mater. 2024, 6, 1211–1222. [Google Scholar] [CrossRef]
  64. Wang, Y.; Zhang, Y.; Wang, Y.; Zhu, R.; Chen, Y.; Liu, X.; Xu, J.; Li, M.; Wang, D. Urea Detection of Electrochemical Transistor Sensors based on Polyanline (PANI)/MWCNT/Cotton Yarns. Electroanalysis 2021, 33, 2406–2416. [Google Scholar] [CrossRef]
  65. Werkmeister, F.X.; Koide, T.; Nickel, B.A. Ammonia sensing for enzymatic urea detection using organic field effect transistors and a semipermeable membrane. J. Mater. Chem. B 2016, 4, 162–168. [Google Scholar] [CrossRef] [PubMed]
  66. Sant, W.; Temple-Boyer, P.; Chanié, E.; Launay, J.; Martinez, A. On-line monitoring of urea using enzymatic field effect transistors. Sens. Actuators B Chem. 2011, 160, 59–64. [Google Scholar] [CrossRef]
  67. Marchenko, S.V.; Kucherenko, I.S.; Hereshko, A.N.; Panasiuk, I.V.; Soldatkin, O.O.; El’skaya, A.V.; Soldatkin, A.P. Application of potentiometric biosensor based on recombinant urease for urea determination in blood serum and hemodialyzate. Sens. Actuators B Chem. 2015, 207, 981–986. [Google Scholar] [CrossRef]
  68. Öndeş, B.; Akpınar, F.; Uygun, M.; Muti, M.; Aktaş Uygun, D. High stability potentiometric urea biosensor based on enzyme attached nanoparticles. Microchem. J. 2021, 160, 105667. [Google Scholar] [CrossRef]
  69. Mitchell, K.M. Acetylcholine and Choline Amperometric Enzyme Sensors Characterized In Vitro and In Vivo. Anal. Chem. 2004, 76, 1098–1106. [Google Scholar] [CrossRef]
Scheme 1. Scheme of the polymer blend deposited on Au substrates and interdigitated electrodes and the SPR and OECT setup for urease adsorption monitoring.
Chemosensors 12 00124 sch001
Figure 1. SPR reflectivity curves for the PEDOT-PAH-modified Au sensors before (blue) and after urease adsorption (red) (A). Change in the minimum reflectivity angle, Δθ, as function of time during the injection of urease and KCl solution (B) IDS-VG curves (C) and transconductance (D) for the electrostatic adsorption of urease on a PEDOT-PAH channel. Time evolution of the IDSmax during urease adsorption (VG = 590 mV) (E). Scheme depicting the electrostatic adsorption of urease on the PEDOT-PAH surface (F).
Chemosensors 12 00124 g001
Figure 2. (A). Relative change in IDSmax as a function of urea concentration is shown for the three devices (VG = 350 mV (blue and green), VG = 300 mV (black)) (B). Relative change in the IDSmax current as a function of urea concentration. Error bars correspond to the SD of three different OECTs (n = 3) (C). Scheme of the urease reaction catalyzed by urease (D). IDS-VG curves of a PEDOT-PAH OECT in NH4OH solutions in 10 mM KCl (E).
Chemosensors 12 00124 g002
Figure 3. SPR sensorgram (change in the minimum reflectivity angle, Δθ, as function of time) during the construction of three urease/PEI bilayers and after the injection of KCl and urea (A) and the accumulated mass densities obtained after each bilayer deposition (B). IDS-VG transfer curves after different steps of adsorption (C) and total relative change in the IDSmax current corresponding to each bilayer construction (D). The inset shows the relative current change in each individual deposition step.
Chemosensors 12 00124 g003
Figure 4. Urease/PEI-modified OECT response to increasing urea concentrations in 10 mM KCl pH 7.4 (A). Time evolution of the IDSmax during successive injections of increasing concentrations of urea (VG = 300 mV) (B). Relative change in the IDSmax current as a function of urea concentration. The inset corresponds to logarithmic scale. Parameters of the linear regression are shown in the plot (C). Real-time urea sensing with a PEI/Urease LbL assembly for one single injection of 500 µM urea in 10 mM KCl pH 7.4 (VG = 250 mV) (D).
Chemosensors 12 00124 g004
Figure 5. Time evolution of the IDS during successive injections of increasing concentrations of urea and 1/2000 diluted urine sample (VG = 300 mV) (A). Calibration curve for urea from synthetic solutions 100, 250, 500 and 1000 µM (black points). The red point corresponds to the diluted urine sample (135 µM) Parameters of the linear regression are shown in the plot (B). Time evolution of the relative current change (ΔI) during successive injections of possible interfering agents: urea (250 µM), glucose (250 µM), creatinine (250 µM), ascorbic acid (25 µM), and urea (250 µM) in 10 mM KCl (VG = 300 mV) (C).
Chemosensors 12 00124 g005
Table 1. Comparison of different field-effect transistor-based systems for urea detection.
SystemLODOperational RangeSampleReference
PANI/MWCNT FECT1 nm1 nM–1 mMSalivaWang et al. (2021) [64]
PEDOT:PSS OECT1 μM1 μM–1 mMAqueous solutionsBerto et al. (2018) [39]
Graphene FET1 μM1–1000 μMAqueous solutionsPiccinini et al. (2017) [37]
OFETs-0.75–7.5 mMAqueous solutionsWerkmeister et al. (2016) [65]
pH-sensitive chemical FET-0.5–30 mMDialysate solutionsSant et al. (2011) [66]
pH-sensitive FET100 μM0.5–40 mMHemodialysate and blood serumMarchenko et al. (2015) [67]
pH-sensitive urease-OECT100 μΜ0.1–20 mMAqueous solutionsThis work
pH-sensitive urease-OECT100 μM0.1–1 mMDiluted urineThis work
Disclaimer/Publisher’s Note: The statements, opinions and data contained in all publications are solely those of the individual author(s) and contributor(s) and not of MDPI and/or the editor(s). MDPI and/or the editor(s) disclaim responsibility for any injury to people or property resulting from any ideas, methods, instructions or products referred to in the content.

