Article

Research on the Evaluation of Baijiu Flavor Quality Based on Intelligent Sensory Technology Combined with Machine Learning

1
Department of Food Science & Technology, School of Agriculture & Biology, Shanghai Jiao Tong University, Shanghai 200240, China
2
Suqian Product Quality Supervision and Testing Institute, Suqian 223800, China
3
Instrumental Analysis Center, Shanghai Jiao Tong University, Shanghai 200240, China
4
China Food Flavor and Nutrition Health Innovation Center, Beijing Technology and Business University, Beijing 102401, China
5
School of Food Science and Engineering, Ningxia University, Yinchuan 750021, China
*
Authors to whom correspondence should be addressed.
Chemosensors 2024, 12(7), 125; https://doi.org/10.3390/chemosensors12070125
Submission received: 4 June 2024 / Revised: 30 June 2024 / Accepted: 1 July 2024 / Published: 3 July 2024
(This article belongs to the Special Issue Electrochemical Sensor Array for Food Detection and Human Perception)

Abstract

:
Baijiu, one of the world’s six major distilled spirits, has an extremely rich flavor profile, which increases the complexity of its flavor quality evaluation. This study employed an electronic nose (E-nose) and electronic tongue (E-tongue) to detect 42 types of strong-aroma Baijiu. Linear discriminant analysis (LDA) was performed based on the different production origins, alcohol content, and grades. Twelve trained Baijiu evaluators participated in the quantitative descriptive analysis (QDA) of the Baijiu samples. By integrating characteristic values from the intelligent sensory detection data and combining them with the human sensory evaluation results, machine learning was used to establish a multi-submodel-based flavor quality prediction model and classification model for Baijiu. The results showed that different Baijiu samples could be well distinguished, with a prediction model R2 of 0.9994 and classification model accuracy of 100%. This study provides support for the establishment of a flavor quality evaluation system for Baijiu.

1. Introduction

Baijiu is one of the world’s six major distilled alcohols, and, compared to other distilled alcohols, its processing is more complex, involving fermentation, distillation, aging, and blending [1]. Due to various factors, such as the different raw materials, fermentation agents, brewing techniques, and ecological environments, Baijiu has a very rich flavor. This characteristic makes Baijiu products widely popular worldwide, but it also increases the complexity associated with evaluating Baijiu’s flavor quality [2].
The evaluation of Baijiu’s flavor quality includes flavor chemistry research and sensory evaluation, which is further divided into human sensory evaluation and intelligent sensory detection [3]. Human sensory evaluation refers to the method in which consumers or professionally trained personnel directly evaluate the sensory attributes of a product, which can be classified into static sensory evaluation and dynamic sensory evaluation [4]. Among the static sensory evaluation methods, quantitative descriptive analysis (QDA) is one of the typical methods. This method can describe the sensory attributes of a product and quantify the intensity of each attribute, thus distinguishing different products [5]. For example, QDA has been used to differentiate Baijiu products of different grades [6], aroma types [7], and vintages [8]. However, human sensory evaluation is always highly subjective, and individual differences among evaluators can lead to unstable results.
Intelligent sensory technology uses sensors to simulate human organs to perceive food and comprehensively analyze sensory signals [9]. Currently, there are commercial intelligent sensory detection devices such as electronic noses and electronic tongues, as well as customized sensor devices for the targeted detection of specific substances [10]. An electronic nose (E-nose) is a biomimetic olfactory device that uses gas sensors to non-specifically bind volatile compounds and generate responses to identify odors. Sensor types include metal oxides and conductive polymers [11]. Among them, metal oxide semiconductor (MOS) sensors are the most commonly used commercial sensors for aroma detection. They have unique advantages, such as high sensitivity and good stability, making them suitable for liquor samples with high alcohol content [12]. An electronic tongue (E-tongue) simulates the human tongue and uses electrochemical and enzyme-based sensors to identify chemical substances in liquid samples. It consists of a series of sensors, signal processing systems, and pattern recognition systems [13]. Compared to human sensory evaluation, the greatest advantage of intelligent sensory detection technology is that it is not influenced by subjectivity. It is also simple to operate and highly efficient in detection. Intelligent sensory detection technology has been applied in various types of food. Zhang et al. used an E-nose combined with an attention convolutional neural network (CA-CNN) to achieve the rapid determination of the authenticity of liquor and the stable and accurate classification of liquor quality [14]. Besides Baijiu, a method based on machine learning and E-nose detection technology can also distinguish wines of different quality through wine aroma detection data [15], as well as differentiating wine products corresponding to different grape varieties [16]. Moreover, coffee produced from coffee beans grown at different altitudes, processed in different ways, or roasted by different methods can also be sensitively recognized and distinguished by E-nose sensors based on their aromas [17]. In addition, many independently developed E-tongue sensors can more specifically and effectively distinguish different beverages, such as wines [18], beers [19], and teas [20]. Nowadays, more comprehensive and scientific evaluations of product sensory quality are achieved by combining human sensory evaluation with intelligent sensory technology. For example, their combination has been applied in tracing the origin of Baijiu [21], distinguishing quality grades [22], and exploring the factors affecting its quality [14].
Due to the large amount of data obtained from intelligent sensory detection, data processing methods are crucial. This technology’s analysis typically involves statistical methods (i.e., principal component analysis, discriminant analysis, etc.) for sample identification and differentiation. It also integrates multi-dimensional sensory detection data with machine learning to more comprehensively reflect the sensory quality of the product [23]. Methods for the integration of multi-dimensional intelligent sensory detection data include raw data fusion, feature value fusion, and model fusion after establishing individual models [24]. Compared to traditional statistical methods, machine learning has greater advantages in handling large and high-dimensional complex data. Its application in Baijiu flavor quality evaluation highlights its efficiency, objectivity, and cost-effectiveness [25].
In this study, 42 types of strong-aroma Baijiu were detected using an electronic nose and electronic tongue. Linear discriminant analysis (LDA) was used to differentiate Baijiu with different origins, with varying alcohol content and grades. Twelve trained Baijiu sensory panel members participated in the QDA of the Baijiu samples. By integrating the intelligent sensory detection data with the human sensory evaluation results, machine learning was used to establish a multi-submodel-based prediction and classification model for Baijiu flavor quality evaluation. The overall experimental process framework is shown in Figure 1. This study aims to provide an effective reference method for the standardization of liquor quality inspection and to offer scientific methods for the improvement of the Baijiu quality evaluation system.

2. Materials and Methods

2.1. Baijiu Samples

In this study, 42 strong-aroma Baijiu samples were collected from different locations in Jiangsu Province, China (Latitude: 30°45′ to 35°08′ N, Longitude: 116°21′ to 121°56′ E); detailed information on the samples can be found in Table 1. All samples were stored in a constant-temperature, light-protected, and dry environment.

2.2. E-Nose and Experimental Procedure

The electronic nose (Shanghai Bosun Industrial Co., Ltd., Shanghai, China) used a portable device that contained 14 metal oxide semiconductor sensors, each responding primarily to different substances—for example, S1 (propane), S2 (alcohol, isobutane, formaldehyde), S3 (ozone), S4 (hydrogen sulfide), S5 (ammonia), S6 (toluene, acetone, ethanol), S7 (methane), S8 (liquefied gas), S9 (toluene, formaldehyde, acetone), S10 (hydrogen), S11 (alkanes), S12 (methane), S13 (methane), and S14 (combustible gases). Each sensor had an independent, uniformly distributed gas chamber. The detection accuracy could reach ppb levels, and the sensor response time was less than one second. Before detection, the samples were diluted 100 times, with 1 mL of each sample placed in a 50 mL headspace vial, sealed, and left to stand at room temperature for 30 min. The electronic nose was preheated for 30 min and then cleaned for 120 s before detection. During detection, the airflow rate was 1 L/min, and the sampling time was 60 s. The sensor signals were recorded at 60 s. Each sample underwent 30 parallel tests, with system cleaning between each test until the signal peak returned to baseline.

2.3. E-Tongue and Experimental Procedure

The electronic tongue (Shanghai Bosun Industrial Co., Ltd., Shanghai, China) used a portable device based on an array of stable sensors composed of inert metal electrodes. It acquired overall information on the measurement objects through cross-interaction sensing and analysis technology. Before detection, the electronic tongue was preheated for 30 min, adjusted, and calibrated, with the amplification set to 300 times, placing the signal range at [−2.0, 2.0]. To ensure the stability and accuracy of the sensor signals, the electronic tongue system was first cleaned. After cleaning, the detection began at room temperature. For detection, 30 mL of each sample was placed in the test cup, and the detection lasted for 120 s. The sensor response data at the 120 s mark were recorded. Each sample underwent 30 parallel tests, with manual cleaning between samples.

2.4. QDA

2.4.1. Panel and Training

A questionnaire was used to recruit 40 people (all meeting the requirements of having a certain level of sensory sensitivity, no history of food allergies, and no known taste and smell defects). Based on 100% accuracy in basic taste tests and over 80% accuracy in identifying taste and smell intensities, 23 individuals were further selected for Baijiu sensory evaluation training. The training included basic knowledge of Baijiu evaluation, scale usage, descriptive abilities, and communication skills. During the basic training, standard 50 mL Baijiu tasting glasses were used, and the participants were informed of the basic process of Baijiu evaluation. During the scale usage training, the participants were introduced to the concepts of levels, categories, intervals, and proportions of scales. They were then provided with five different concentrations of sucrose solutions (1.00, 1.20, 1.40, 1.60, 1.80 g/100 mL) and benzaldehyde solutions (0.20, 0.40, 0.60, 0.80, 1.00 mg/100 mL) placed randomly. The participants were asked to use a nine-point scale to rate the intensity of the taste of the sucrose solutions and the smell of the benzaldehyde solutions. This training was repeated three times. For the descriptive ability and communication skills training, 4 characteristic aromatic substances of strong-aroma Baijiu were selected. The 4 substances were diluted to appropriate concentrations as different olfactory stimuli and presented to the participants, who were asked to describe and record their perceptions. This training was repeated three times. Finally, based on the overall training results, 12 participants (6 males and 6 females) with good stability, consistency, and repeatability were selected as sensory evaluators using the Panel Check software. All evaluators signed an informed consent agreement before starting the sensory experiments.

2.4.2. Development of Descriptive Words

Descriptive words for Baijiu were determined through discussion. Baijiu samples were randomly presented to evaluators, who were then asked to write down as many sensory descriptors as possible for each sample in terms of color, aroma, taste, mouthfeel, and style, followed by a discussion. The sensory descriptors from each evaluator were collected and organized, with synonyms, antonyms, hedonistic descriptions, and quantitative terms removed. Ultimately, 16 descriptive words with a high perception frequency that accurately described the characteristics and differences of various strong-aroma Baijiu samples were selected, as detailed in Table 2.

2.4.3. Sample Evaluation

Twelve evaluators evaluated 42 strong-aroma Baijiu samples. During the evaluation, 20 mL of each sample was placed in a tasting glass, blind-coded with a three-digit number, and then randomly presented to the evaluators. The evaluators used a nine-point scale to quantitatively describe the 16 sensory descriptors for Baijiu. Each sample was tested three times, and the evaluators were required not to eat within one hour of the experiment. They rinsed their mouths and rested sufficiently between different samples to minimize the influence of previous samples on subsequent evaluations. The entire experiment was conducted in a standard sensory room with a temperature of 22–25 °C, 50% humidity, good lighting, and ventilation.

2.5. Machine Learning

2.5.1. Data Preprocessing and Feature Extraction

Data preprocessing first involves calculating the mean of non-missing values and using this mean to fill in the corresponding missing values. Then, the interquartile range (IQR) is calculated, and the IQR is used to define the boundaries of outliers. Any detected outliers are replaced with the median of the respective data range. Data fusion involves selecting feature value fusion, where the maximum value and smoothed value are chosen as the respective feature values for the E-nose and E-tongue data. After data fusion, standardized features, polynomial features, and interaction matrix features are used for feature construction. Data transformation is performed using quantile transformation based on the data type, followed by feature selection using a random forest model. Finally, principal component analysis (PCA) is used for dimensionality reduction, and data augmentation is achieved by injecting random noise. The extracted feature values are randomly split, with 80% of the data used as the training set for modeling and 20% used as the test set for model validation.

2.5.2. Model Construction

The Baijiu prediction model consists of at least three different predictive submodels, with algorithms including logistic regression, decision tree, random forest, gradient boosting tree, support vector regression, and k-nearest neighbors. The Baijiu classification model consists of at least three classification submodels, with algorithms including logistic regression, support vector machine, naive Bayes, k-nearest neighbors, and decision tree. The training set data are input to train each predictive and classification submodel, resulting in the Baijiu prediction model and Baijiu classification model.

2.5.3. Model Validation

The test set data are input into the constructed Baijiu prediction model. Each predictive submodel within the Baijiu prediction model independently calculates the input feature values, computing each submodel’s R-squared (R2) and prediction bias. The R2, also known as the coefficient of determination, measures the proportion of the variance in the dependent variable that is predictable from the independent variables, with a value of 1 indicating perfect prediction and a value of 0 indicating no explanatory power. The prediction bias measures the average difference between the predicted and actual values. A bias value of 0 indicates an unbiased model, with positive bias showing overestimation and negative bias showing underestimation. The three submodels with the best predictive performance are selected, and the average of their prediction results is taken as the Baijiu prediction model’s result. The test set data are also input into the Baijiu classification model, where each classification submodel independently calculates the input feature values, computing each submodel’s classification accuracy, precision, and recall. Accuracy is the ratio of correctly predicted instances to the total instances, providing an overall measure of model performance. Precision is the ratio of correctly predicted positive observations to the total predicted positives, indicating the accuracy of positive predictions. High precision means that there are very few false positives. Recall, also known as sensitivity or the true positive rate, is the ratio of correctly predicted positive observations to all observations in the actual class. High recall means that there are very few false negatives. Together, these metrics offer a comprehensive evaluation of the model performance. The result with the highest output frequency among the three best-performing submodels is selected as the Baijiu classification model’s result.

2.6. Statistical Analysis

The final data were presented as the mean ± standard deviation and illustrated using Excel and Origin 2021. LDA was performed using IBM SPSS Statistics 27. Data cleaning, feature selection, and machine learning model construction were performed using MATLAB R2023a.

3. Results and Discussion

3.1. Results of LDA Analysis of E-Nose Data

Although volatile compounds in Baijiu are present in small amounts, they have a significant impact on its flavor. The 42 types of strong-aroma Baijiu samples were grouped according to their different production origins, alcohol content, and grades. The maximum values of the raw data from the E-nose detection were extracted as feature values, and then LDA was performed on the samples from different groups.
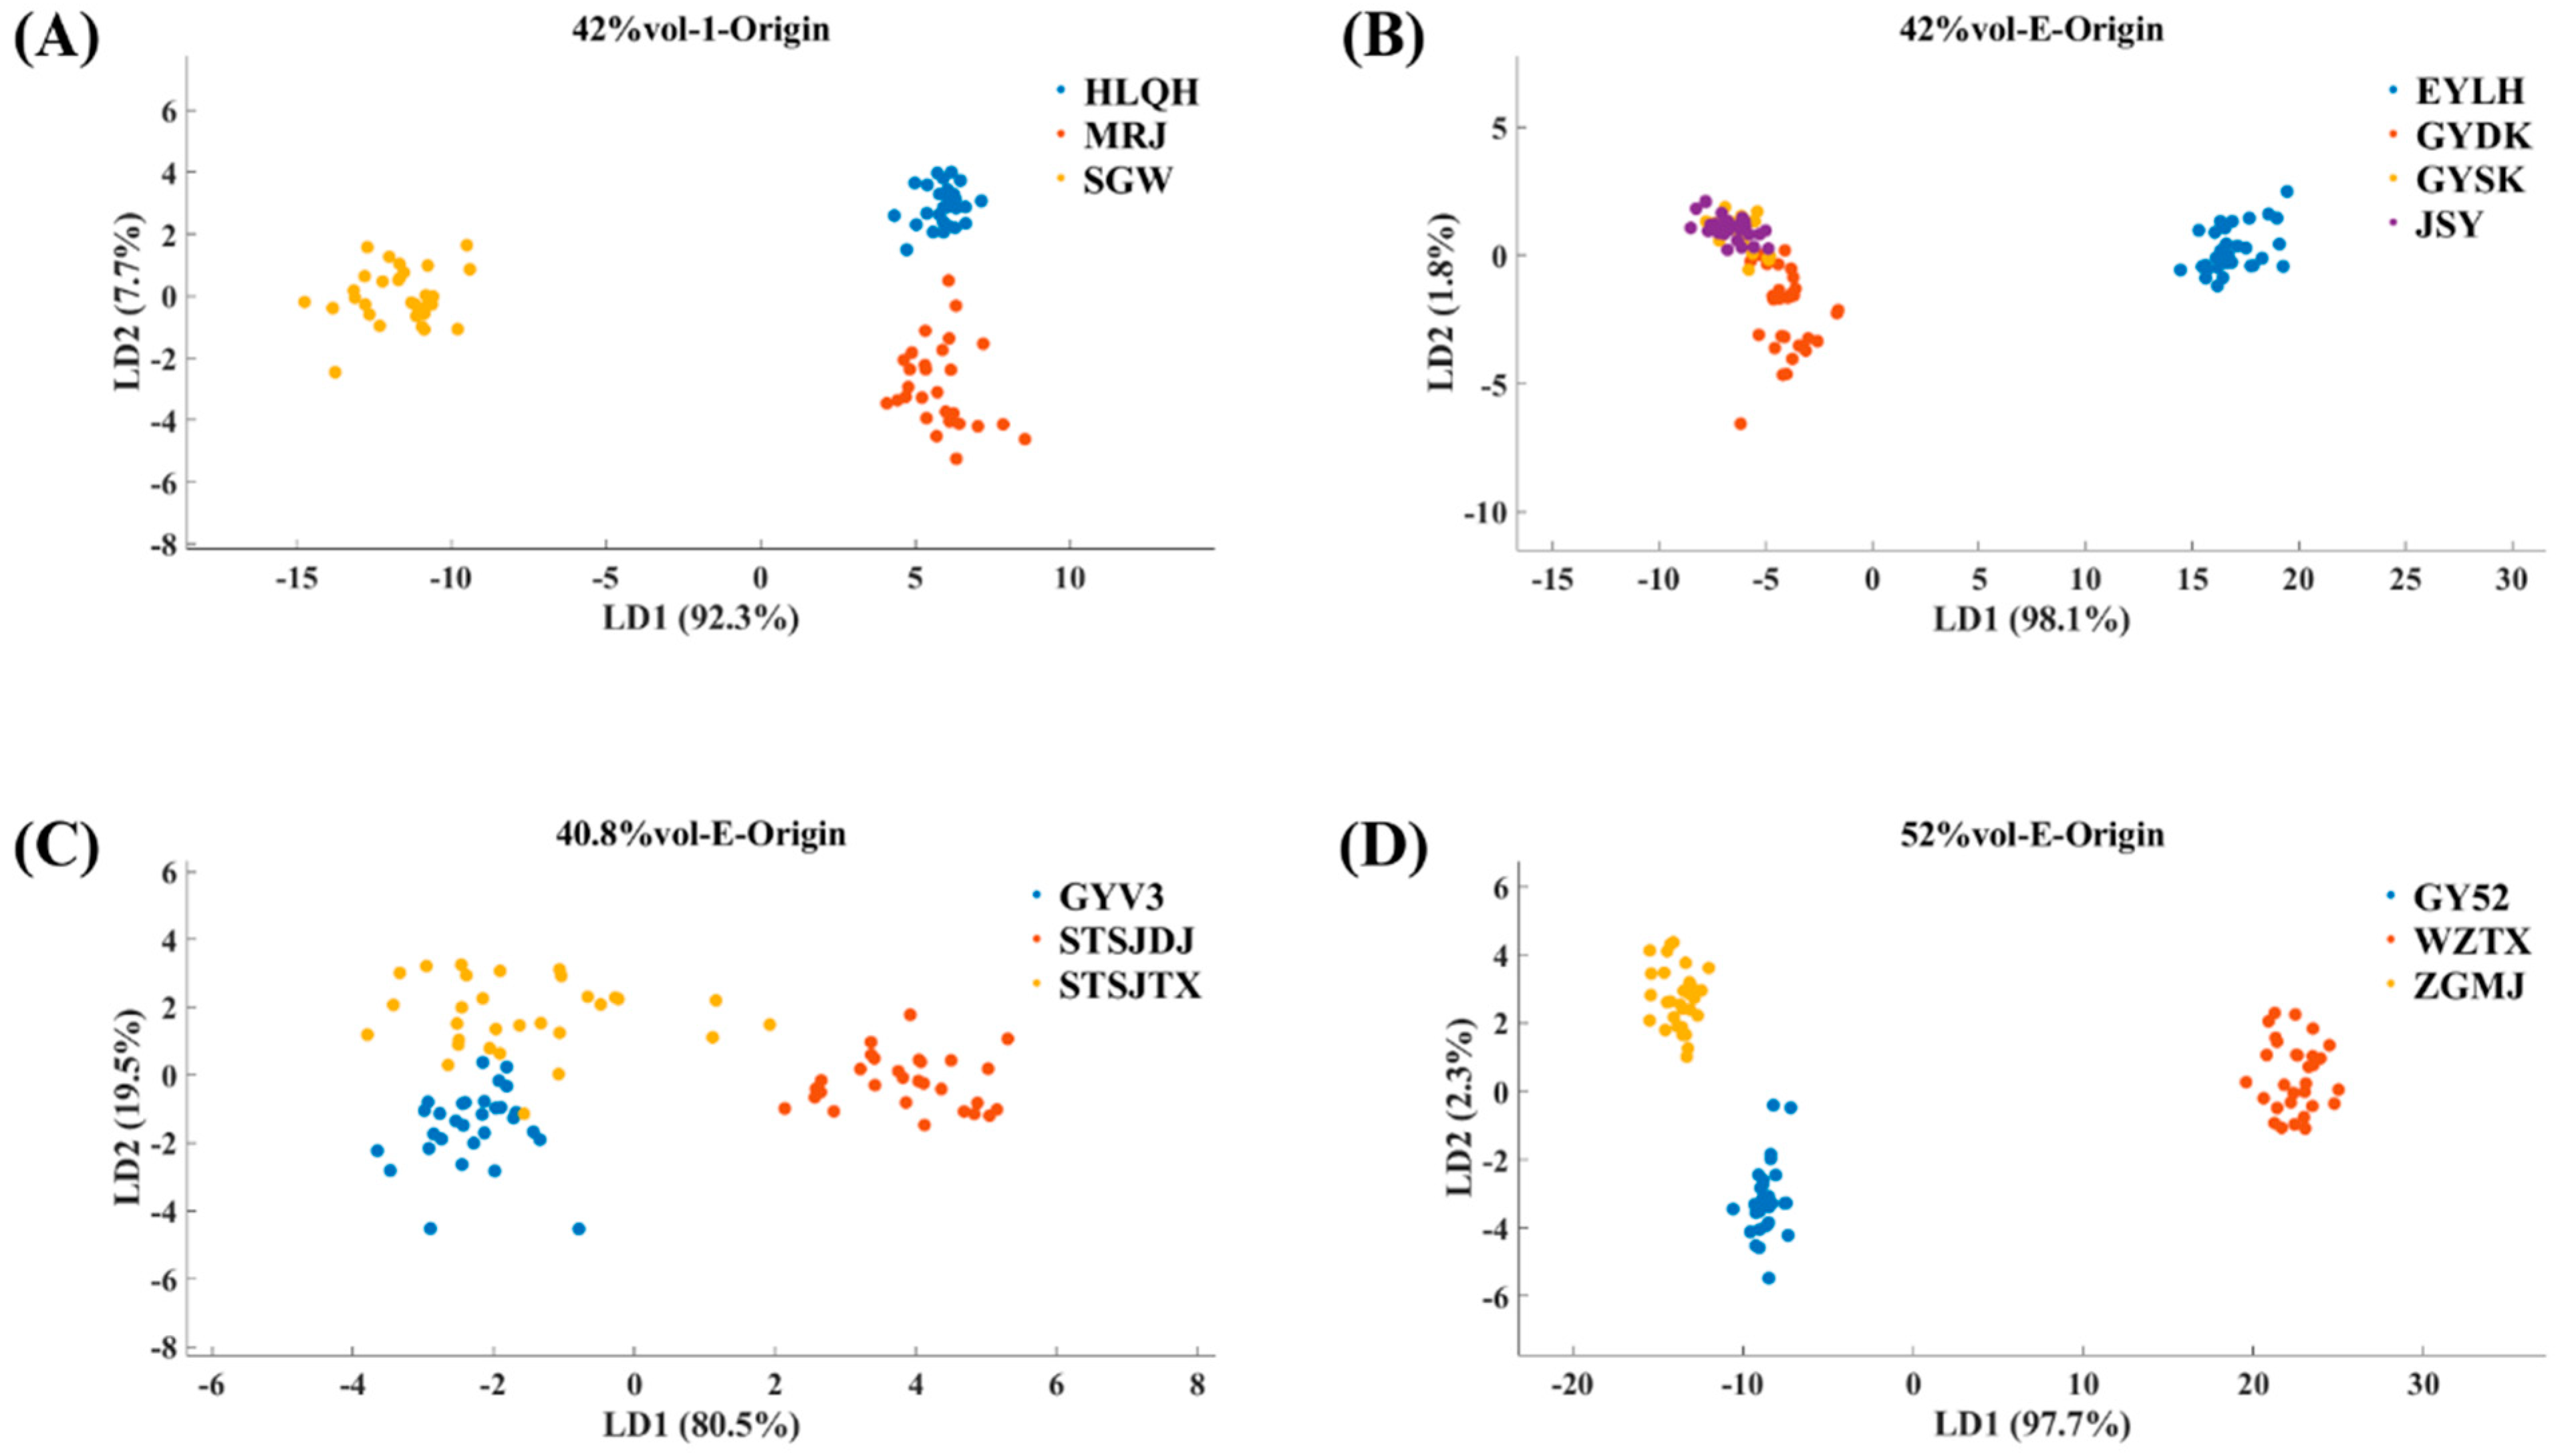
LDA is a supervised data dimensionality reduction method where the input data samples have clear classification labels. The analysis results show that samples of the same category are distributed close to each other, while samples of different categories are distributed farther apart [26]. The LDA results for the strong-aroma Baijiu samples with different origins are shown in Figure 2. Figure 2A shows the LDA classification results of three types of Baijiu with different origins, with alcohol content of 42%vol and a grade of first-class. It can be seen that the three samples are clearly distinguished, with HLQH and MRJ being relatively close to each other, which is consistent with their geographically close origins. Figure 2B shows the distribution of different regional Baijiu samples with alcohol content of 42%vol and an excellent grade. EYLH, which is farther away, is located in Suqian, while GYDK, GYSK, and JSY are all from Huaian, which are also closely clustered together in the figure. Figure 2C,D show Baijiu samples with alcohol content of 40.8%vol and 52%vol and excellent grades with different origins. A comparative analysis reveals that, despite their different origins, some sample points are still distributed closely, possibly due to the shared water sources or similar raw materials in some origins. The ecological environment also plays a crucial role in influencing the flavor of Baijiu, leading to certain similarities in the volatile components of the samples [27].
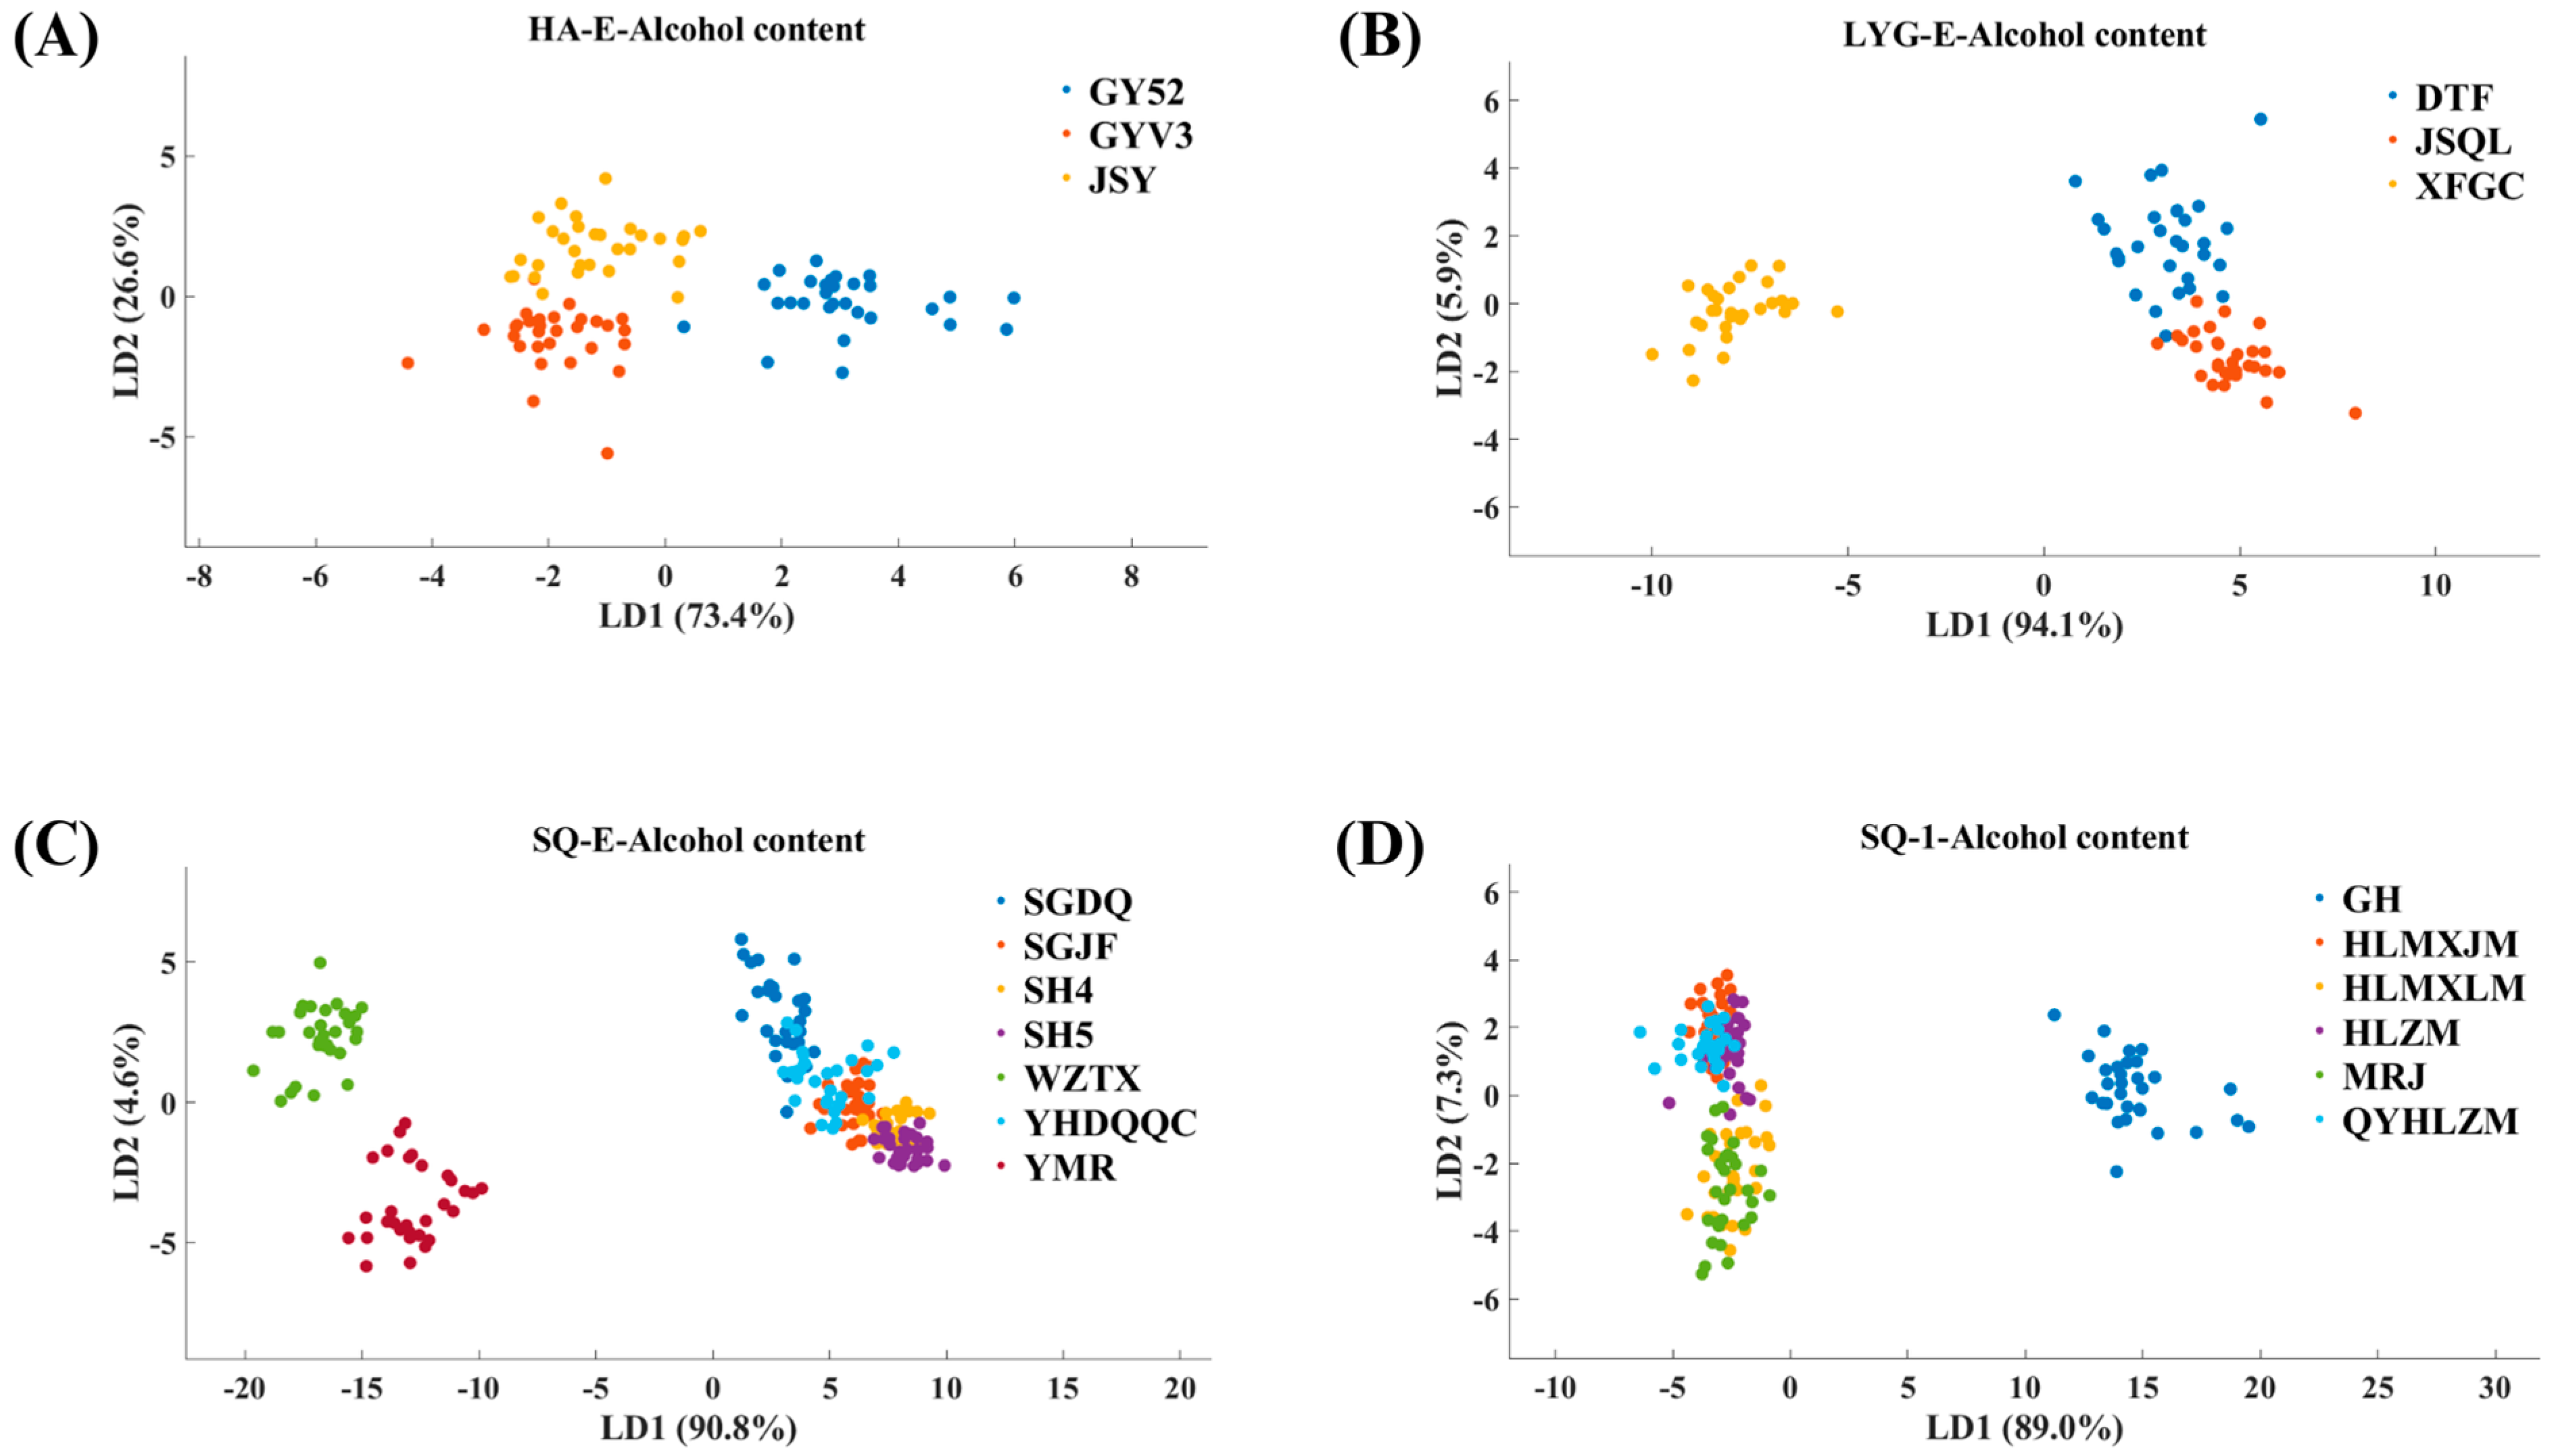
The LDA results of the E-nose detection data for Baijiu with different alcohol content are shown in Figure 3. In Figure 3A, the alcohol content of the three samples is as follows: GY52 (52%vol), GYV3 (40.9%vol), and JSY (42%vol). It can be seen that GYV3 and JSY, which have similar alcohol content, are closer in distribution. Figure 3B shows that JSQL (53%vol) and DTF (42%vol) are closer in distribution, while XFGC (53%vol), which has the same alcohol content, is farther apart. This indicates that the alcohol content affects the volatile compounds but is also influenced by other factors, which may weaken the effect of the alcohol content. Additionally, studies have shown that sensors composed of metal oxide semiconductor materials are easily affected by high levels of ethanol and water, resulting in slower baseline recovery and reduced detection efficiency [21]. Figure 3C,D show premium and first-class Baijiu samples from Suqian. In Figure 3C, the two samples that are separately clustered are WATX (52%vol) and YMR (35.8%vol), while other samples with alcohol content ranging from 40%vol to 46%vol are clustered together. In Figure 3D, the separately clustered sample is GH (52%vol), but two other samples with the same alcohol content, HZLM and HLMXLM, are mixed with other samples with alcohol content of 42%vol. This phenomenon may occur because premium Baijiu contains more unique volatile components, while first-class Baijiu has smaller quality differences. Other studies have found that increased alcohol content can affect the differentiation of quality grade classification models, which is somewhat in line with the results of this study [28].
The differentiation results for Baijiu of different grades are shown in Figure 4. In Figure 4A,B, Baijiu samples of different grades are distinguished, but the first-class and premium Baijiu samples are still distributed closely. This is mainly because premium Baijiu typically has a stronger aroma and higher concentration than first-class Baijiu. The E-nose distinguishes samples based on the different responses to various volatile compounds. Therefore, differences in concentration do not significantly aid the E-nose in distinguishing samples [29].
Baijiu contains about 2% trace components, with volatile compounds accounting for a large proportion. These compounds have a direct or indirect impact on the aroma, taste, and mouthfeel of Baijiu [30]. Based on the principle of the detection of volatile compounds, E-nose technology is gradually being applied to distinguish different Baijiu products. For example, an E-nose with MOS sensors combined with PCA has been used to differentiate Baijiu of different vintages [31], while gas chromatography combined with an E-nose has been used to distinguish different aroma types of Baijiu [32]. Additionally, an E-nose with quartz crystal microbalance (QCM) sensors combined with PCA has been used to differentiate various Baijiu brands [33]. According to the results of this study, electronic nose detection combined with LDA can efficiently distinguish strong-aroma Baijiu from different regions, with different alcohol content, and of different grades. Compared to PCA, LDA demonstrates a better discrimination effect for samples with higher similarity.

3.2. Results of LDA Analysis of E-Tongue Data

An electronic tongue (E-tongue) also detects substances using sensors, and the sensitivity of these sensors can be affected by high alcohol content. However, many studies have proven that sensors based on inert metal electrodes can better adapt to high-alcohol environments and perform accurate detection [34]. The E-tongue equipment used in this study was based on inert metal sensors. The smoothed values of the raw data from E-tongue detection were extracted as feature values, and LDA was performed on the samples from different groups.
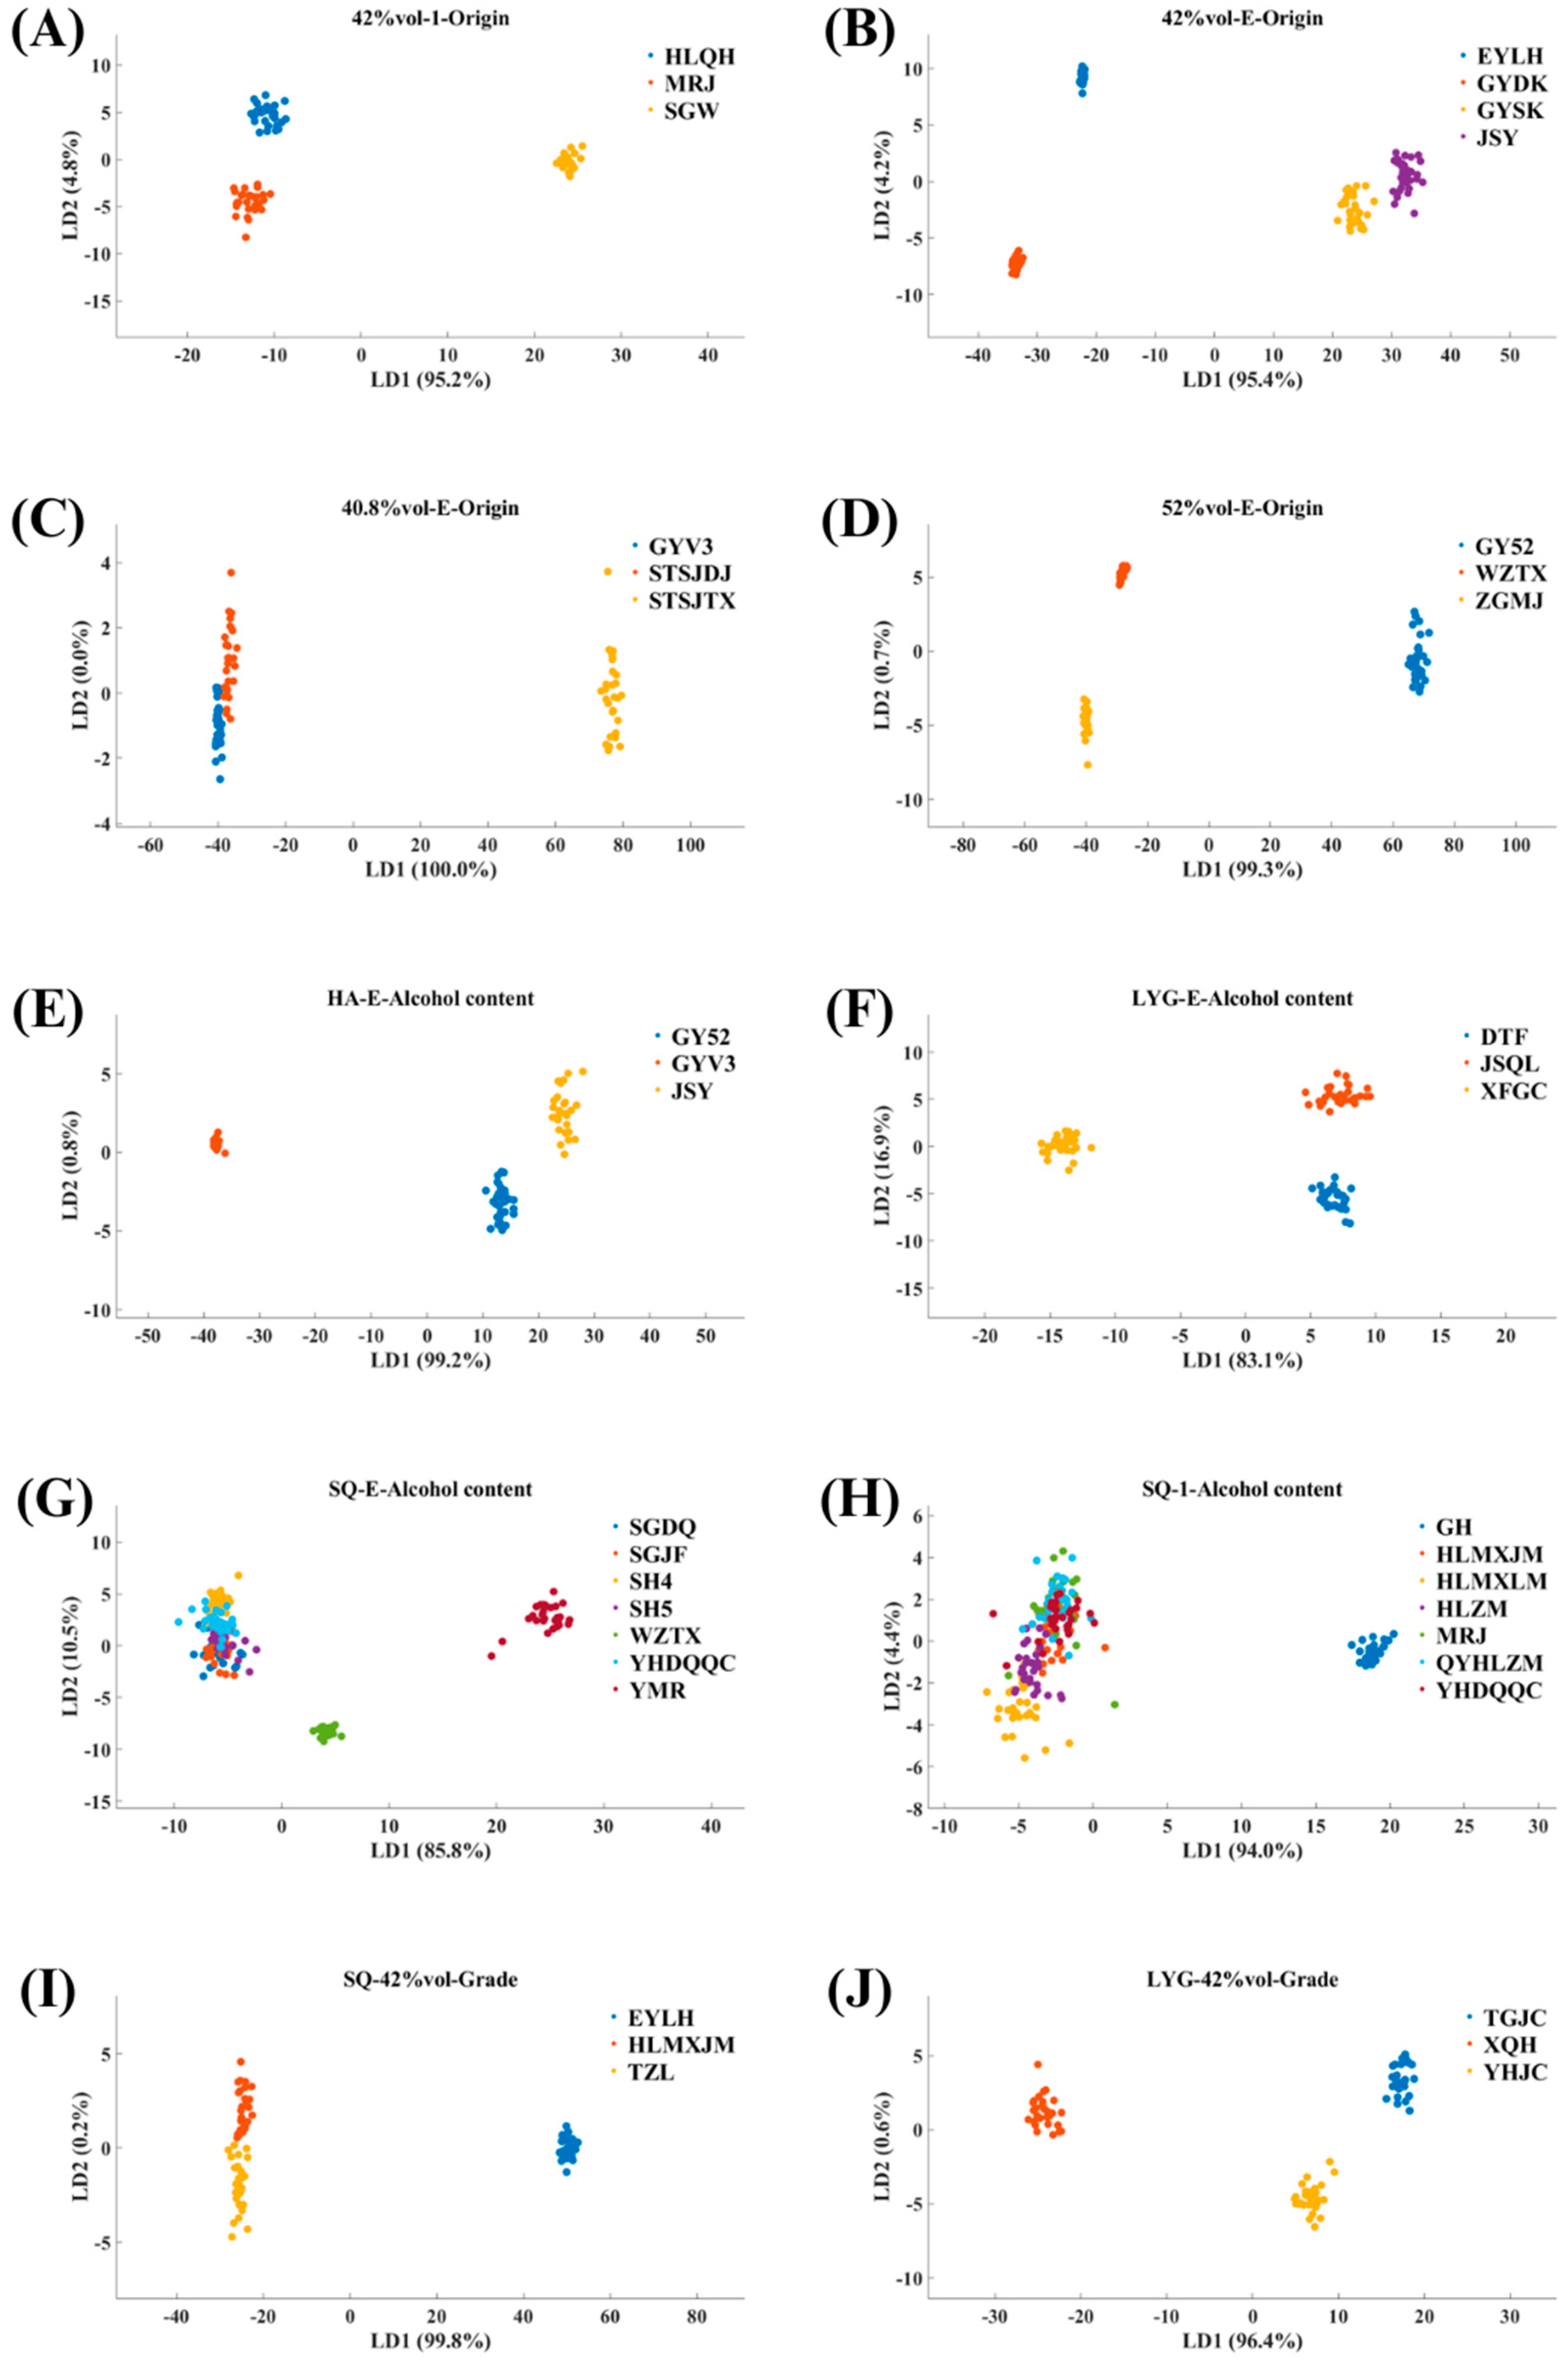
The LDA results of the E-tongue detection data for strong-aroma Baijiu with different origins, with varying alcohol content and different grades, are shown in Figure 5. In Figure 5B, the three samples GYDK, GYSK, and JSY are from the same region, but the E-tongue results indicate differences among them, whereas the E-nose results show them clustered together. This suggests that these three samples have high similarity in terms of volatile compounds. When considering taste substances, the differences among the three samples become apparent. A similar phenomenon is observed among the three samples in Figure 5J.
Overall, the differentiation of the samples by the E-tongue is consistent with the E-nose results, but the differentiation effect is significantly better than that of the E-nose. This indicates that the volatile compounds in Baijiu play a dominant role in distinguishing Baijiu based on its flavor substances. The E-nose can differentiate different samples, while the E-tongue can detect substances in Baijiu other than volatile compounds, which helps to further enhance the differentiation effect on different Baijiu samples.

3.3. QDA Results

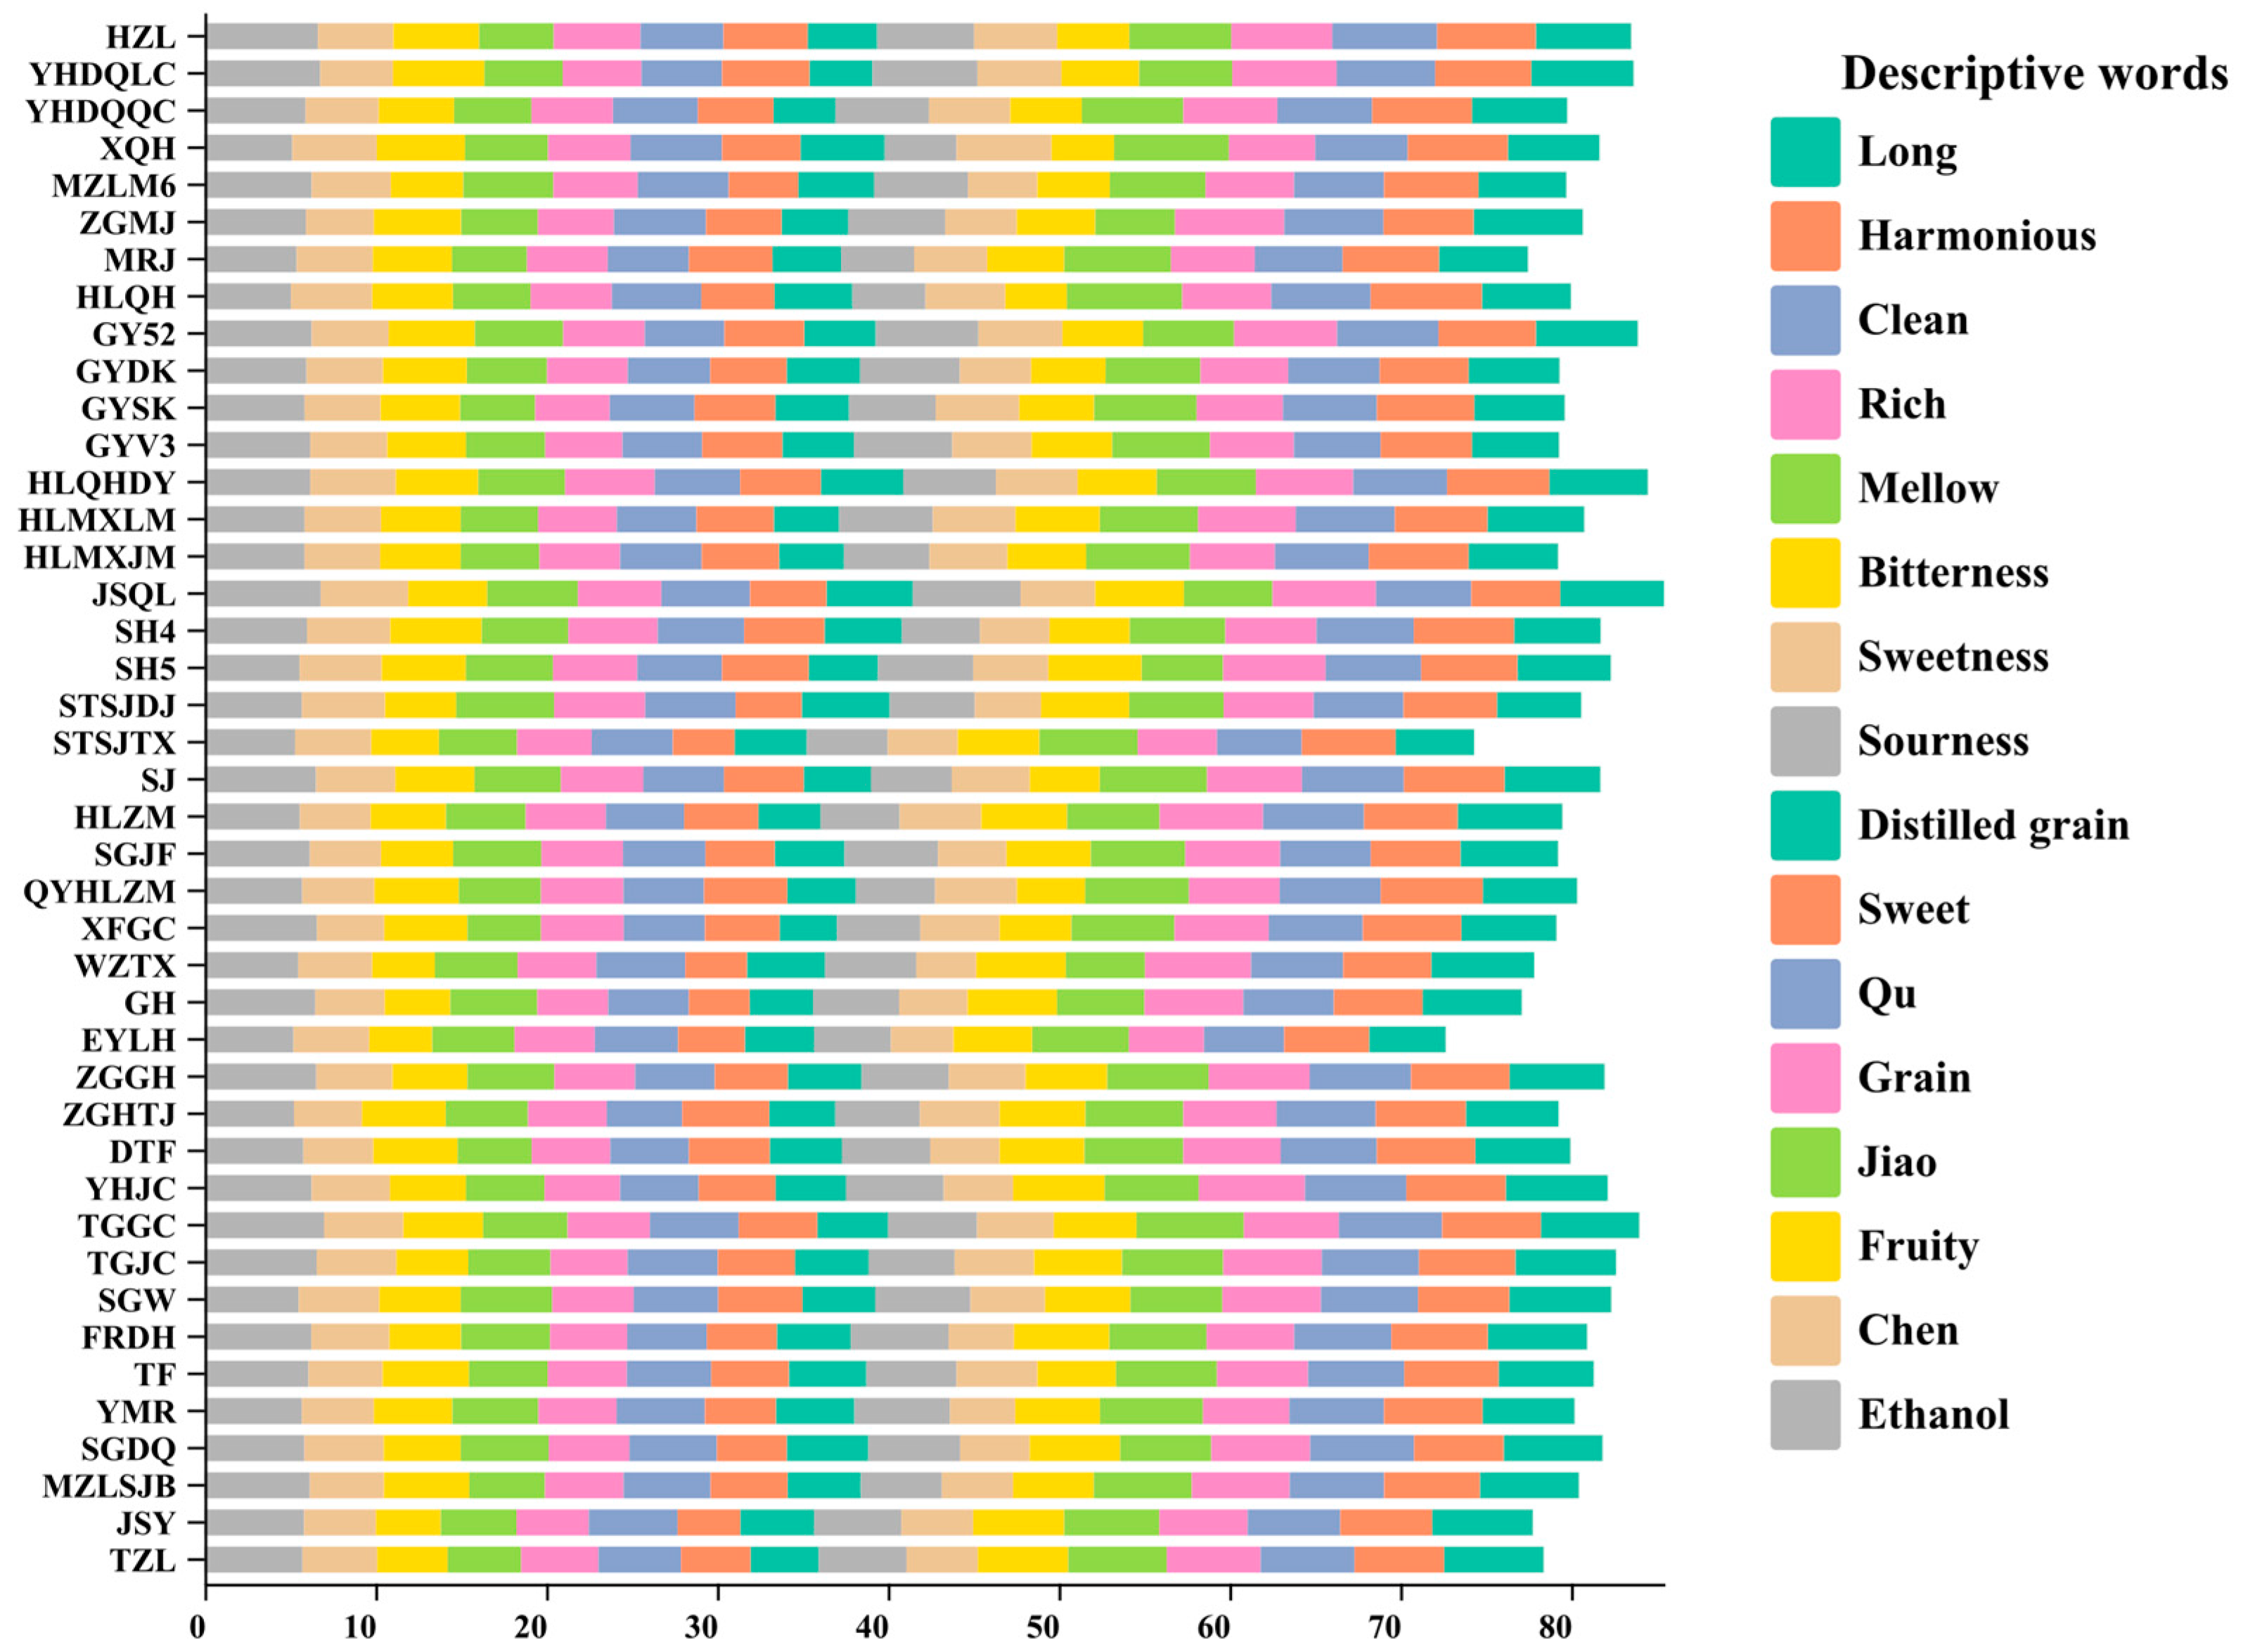
The QDA results for the 42 strong-aroma Baijiu samples are shown in Figure 6. Overall, the comprehensive QDA scores for most samples are similar, with some samples scoring lower, such as STSJTX and EYLH. Among all samples, the highest aroma attribute score is for JSQL, while the lowest is for STSJTX. The highest taste attribute score is also for JSQL, and the lowest is for HLQH. In terms of mouthfeel, the highest score is for HLQH, and the lowest is for EYLH.
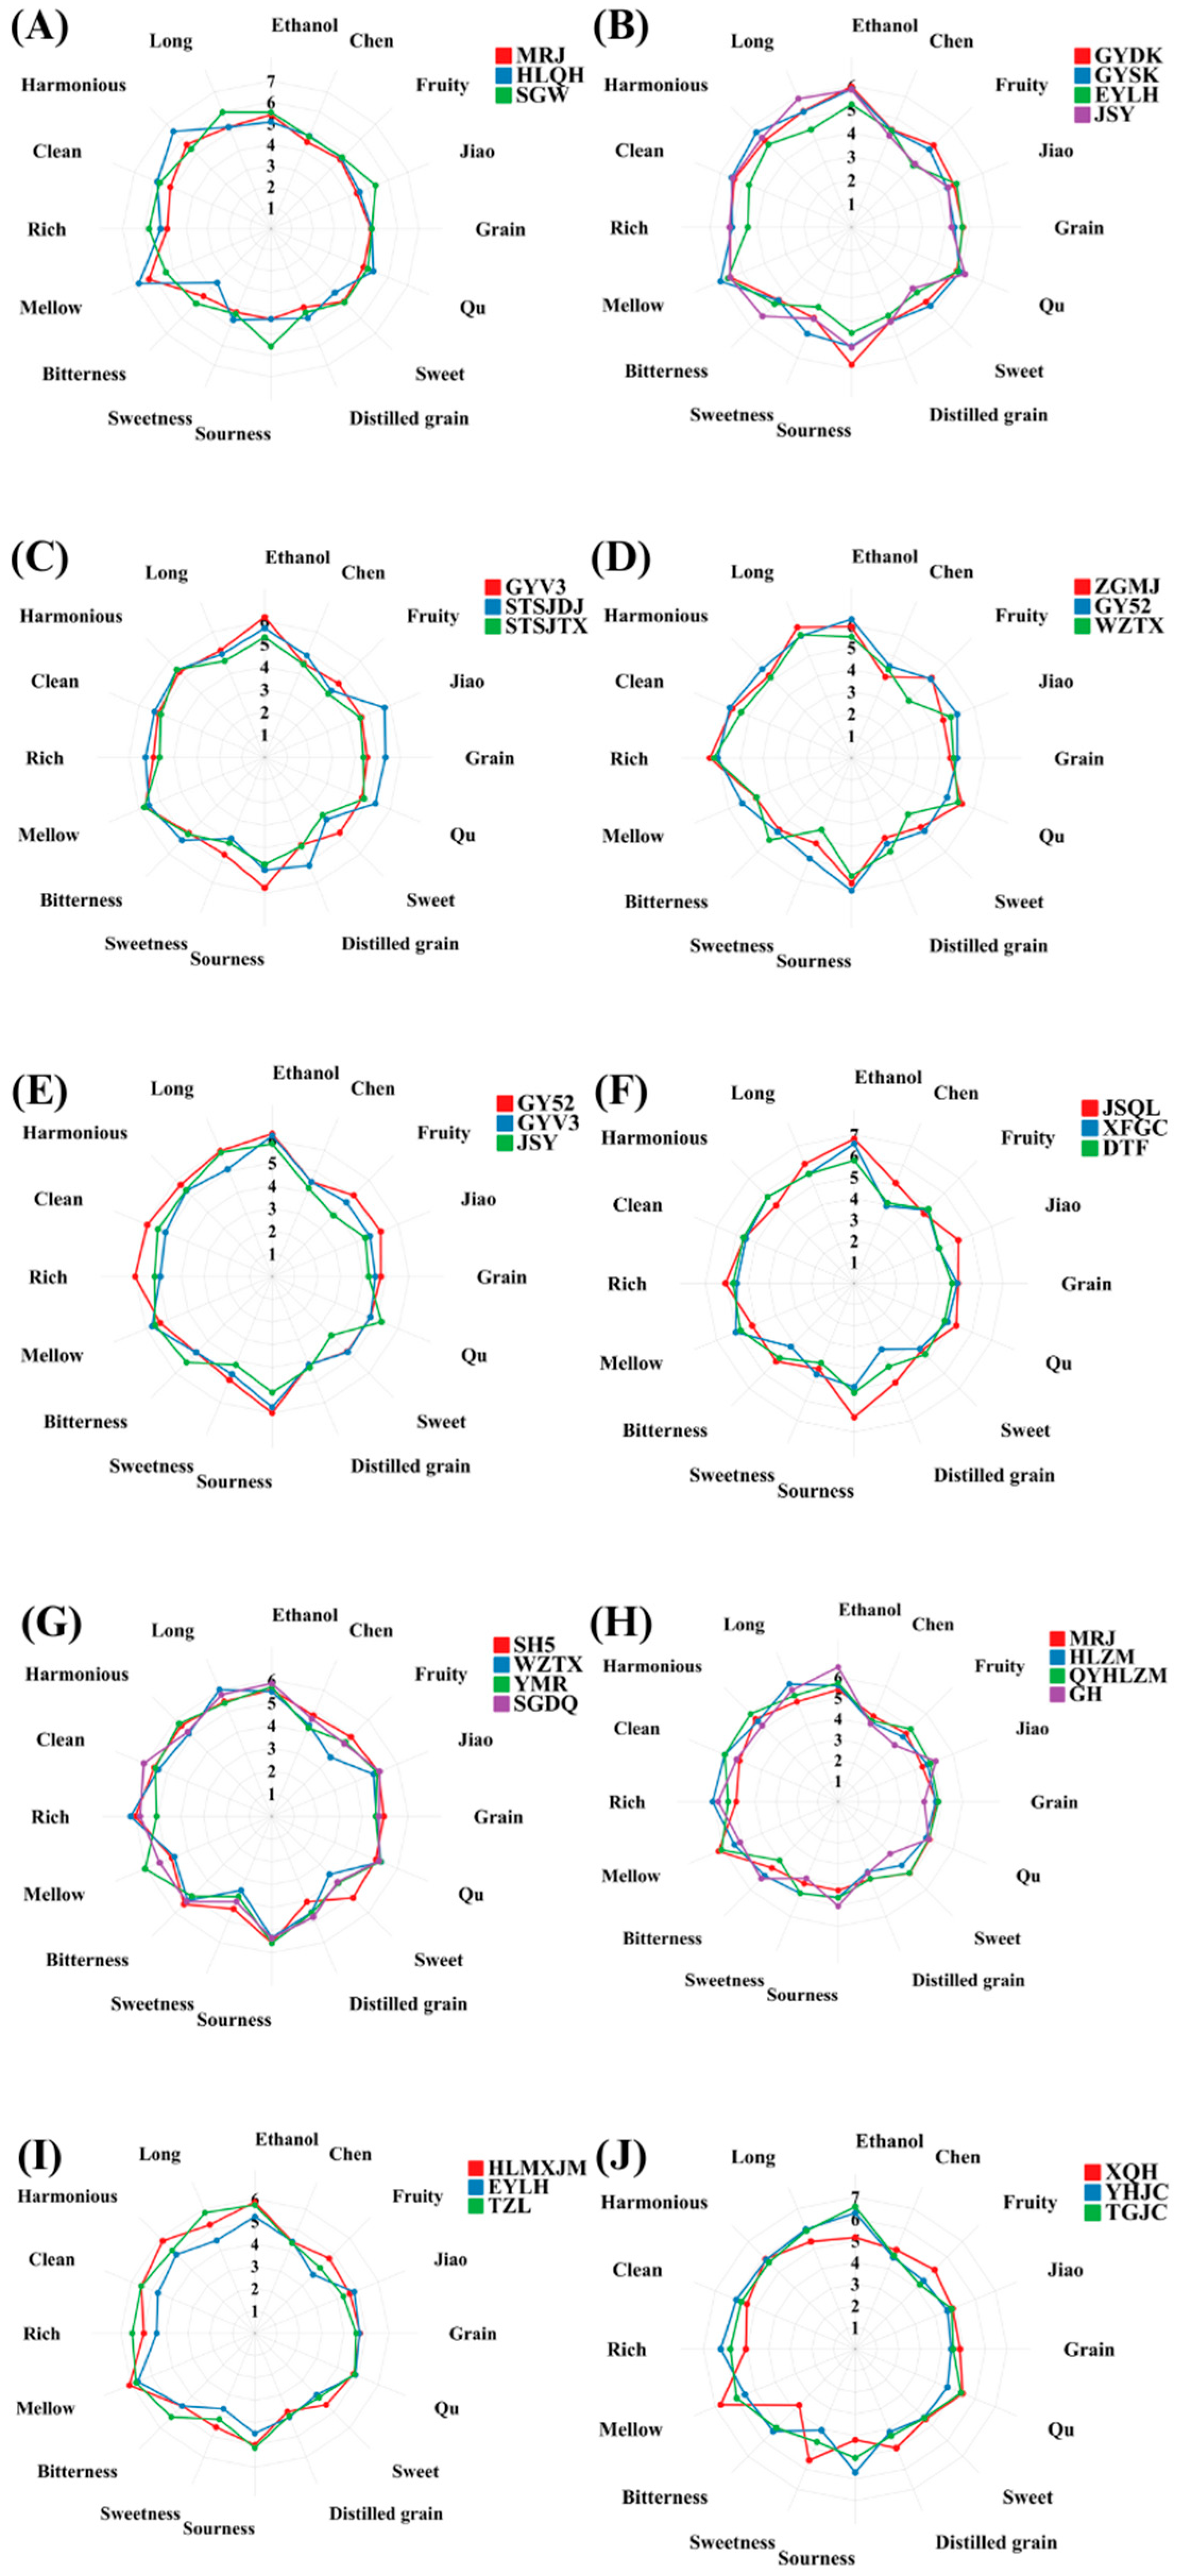
Further grouping the samples for intelligent sensory analysis and plotting the corresponding sensory attribute radar charts, as shown in Figure 7, reveals that samples with a close distribution in the E-nose and E-tongue LDA analysis results also have similar profiles in the radar charts. For example, in Figure 7A, HLQH and MRJ have similar sensory profiles, while SGW, compared to these two samples, has prominent sourness and a cellar aroma. Regarding premium Baijiu samples from Suqian with different alcohol content, YMR and WZTX, which are distinctly separated in the intelligent sensory analysis results, also show differences in Figure 7G. Compared to the other samples, WZTX has weaker sweet and fruity aromas, as well as relatively weaker sweetness and sourness, but a longer mouthfeel. YMR, on the other hand, has prominent softness and weaker richness. Studies have shown that the acidic substances in Baijiu not only directly affect the taste of Baijiu but also interact with the alcohols to influence the mouthfeel. When the ratio of the two is appropriate, it can give Baijiu a more lasting mouthfeel [35]. Regarding the first-class Baijiu from Suqian with different alcohol content, GH stands out the most in the intelligent sensory results. Figure 7H shows that, compared to lower-alcohol-content samples, GH has more prominent alcohol aroma, cellar aroma, and sourness. The strong alcohol aroma is partly due to the higher alcohol content, but the main sensory attributes distinguishing it from other 52%vol samples are the fruity aroma, sweetness, and sourness. The primary contributors to the fruity aroma in Baijiu are certain esters, which help to enhance the perception of sweetness [36]. GH’s weaker fruity aroma and sweetness perception align with the current research findings.

3.4. Baijiu Prediction and Classification Models

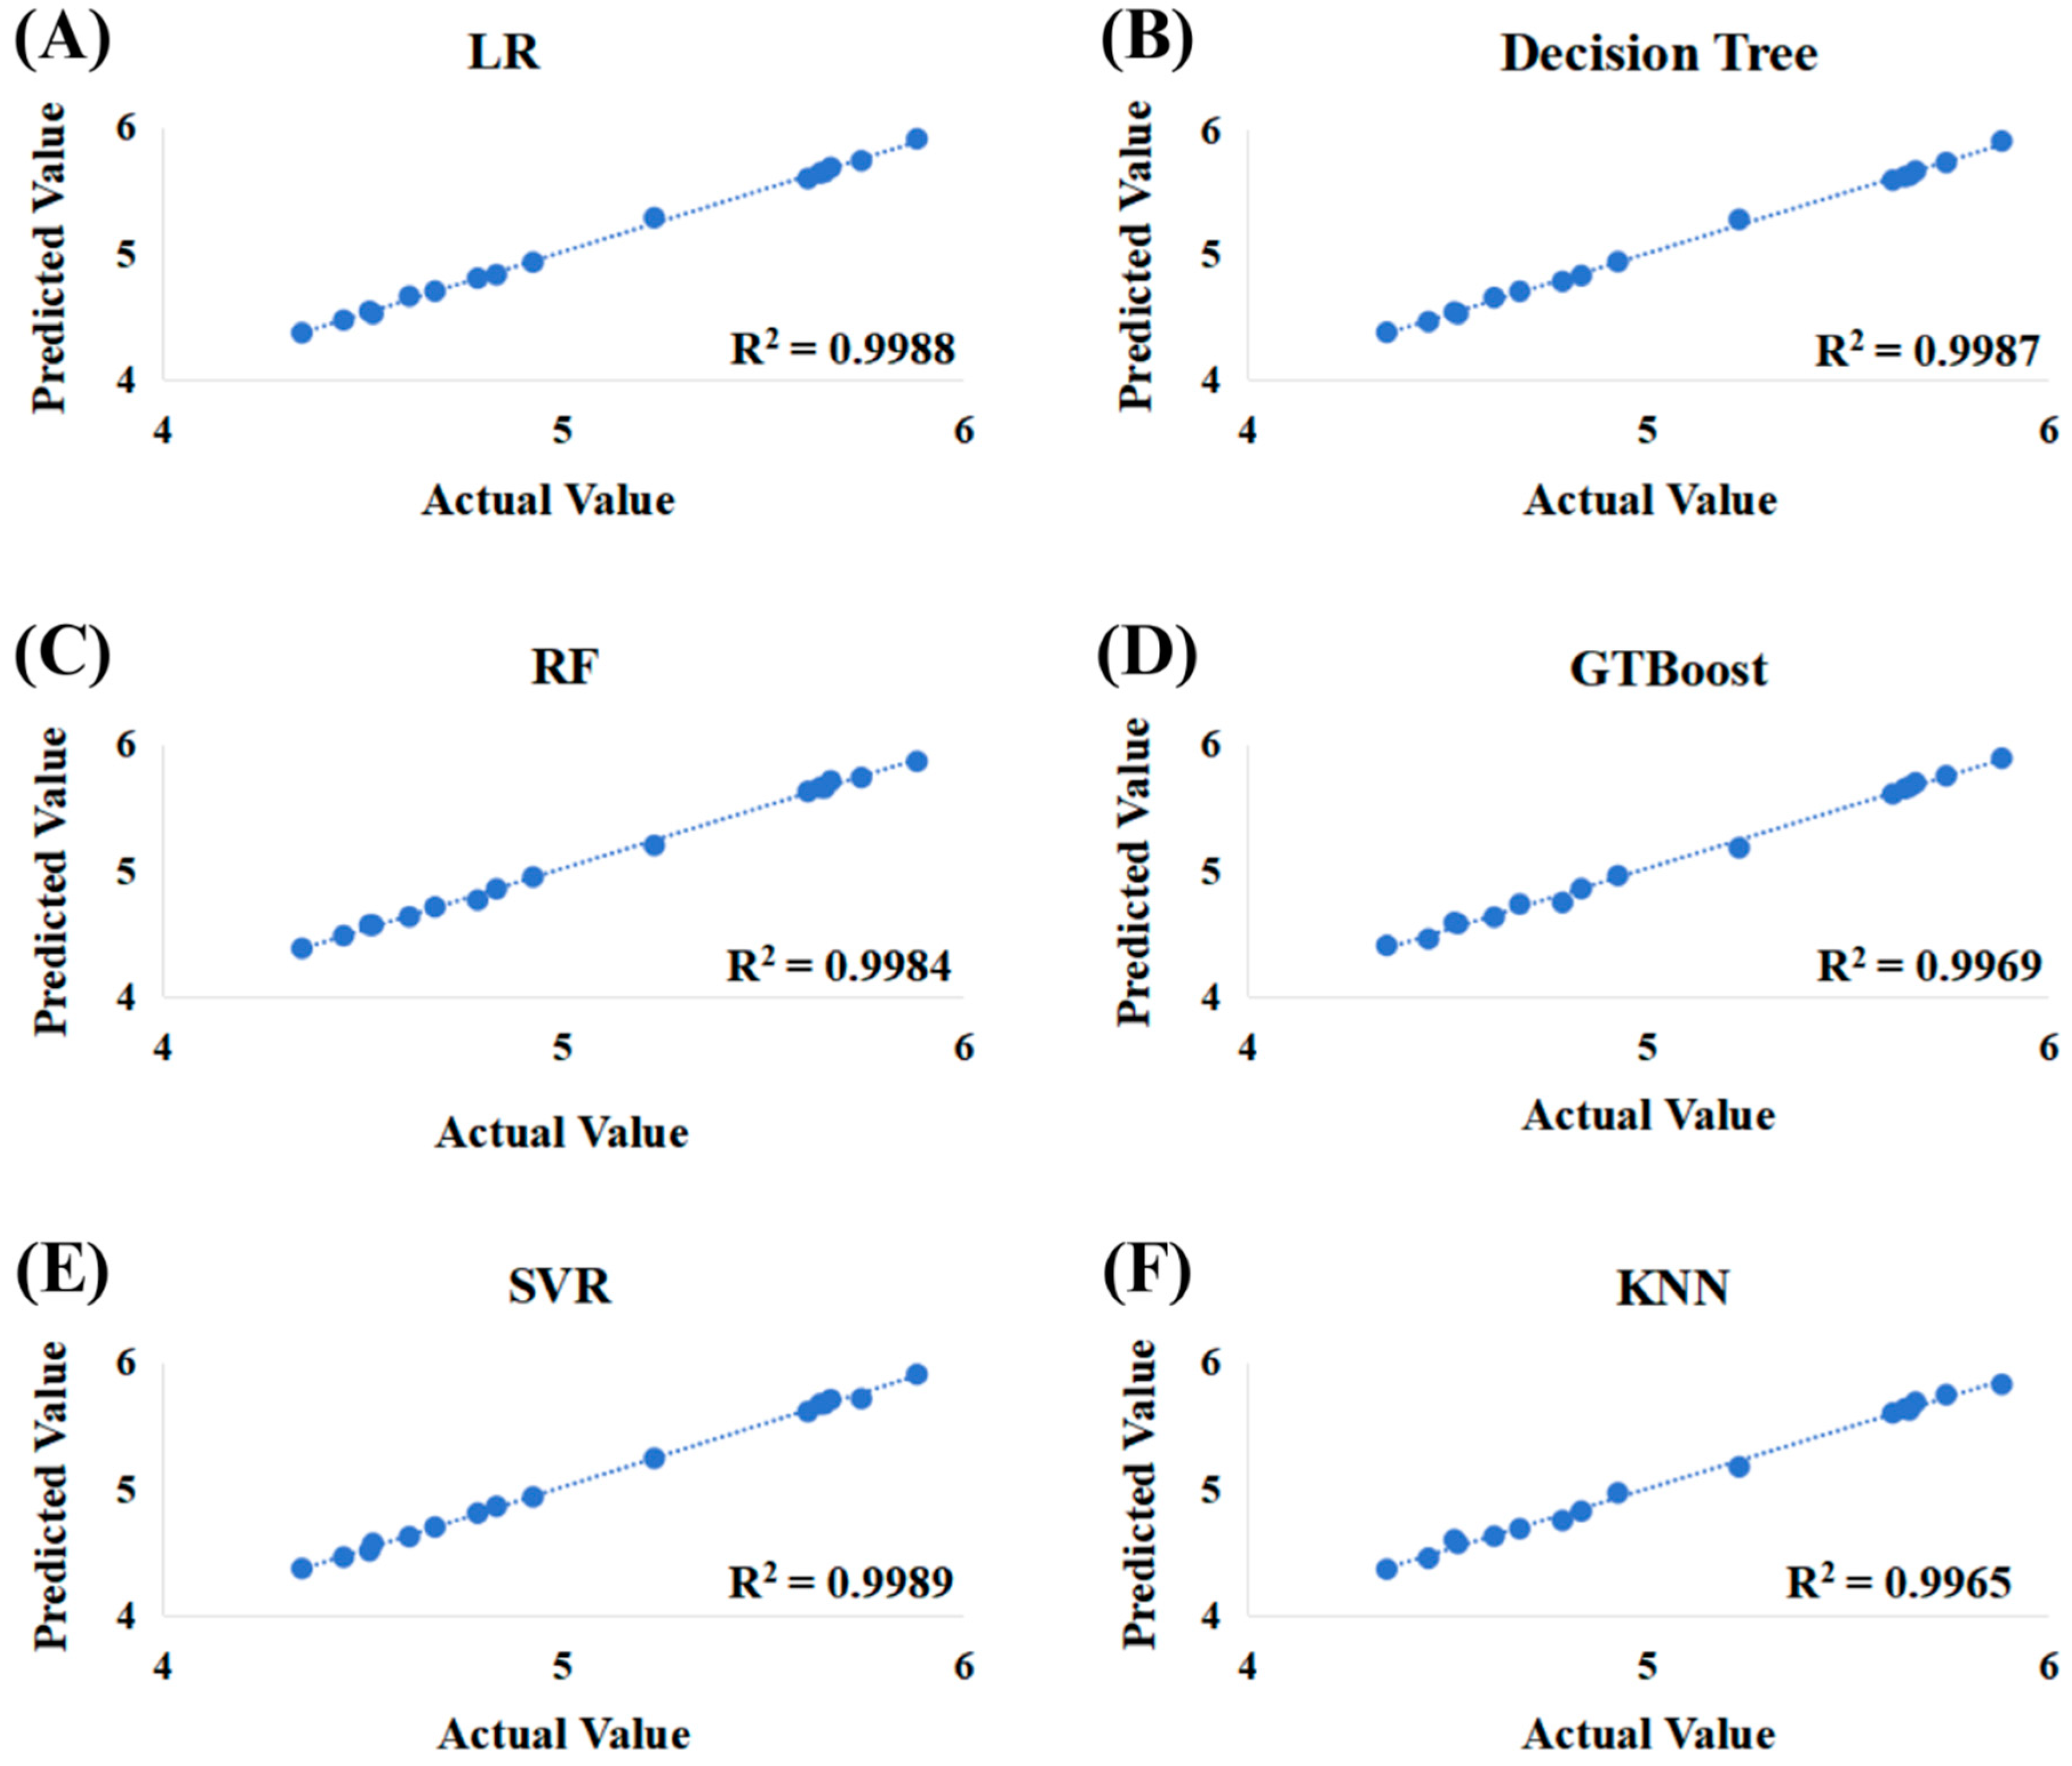
This study uses the combined data of the E-nose and E-tongue as input values and the QDA scoring results as output values. The selected submodels include logistic regression, decision tree, random forest, gradient boosting tree, support vector regression, and k-nearest neighbors. Based on the LDA discrimination and QDA scoring results, 16 samples with representative sensory attributes were further selected from the 42 samples. The test set data corresponding to these 16 samples were input into each submodel for prediction, and the average predicted value of all samples under each descriptor was calculated. Then, a linear fit was performed between the predicted average value and the actual QDA value for each descriptor. The prediction effect was evaluated using the R2 and prediction deviation, as shown in Figure 8, where each point represents 16 sensory descriptors. It can be seen that the R2 of each method is greater than 0.99, and the absolute value of the prediction deviation is less than 0.001. The average predicted values of the three submodels—logistic regression, decision tree, and support vector regression—were selected as the final prediction results of the Baijiu prediction model. The combined R2 of the Baijiu prediction model was 0.9994, with an absolute prediction deviation of less than 0.001.
This study established a Baijiu classification model to differentiate between 32 strong-aroma Baijiu samples with different origins and 24 strong-aroma Baijiu samples of different grades. The input values were the fused data from the E-nose and E-tongue. The selected submodels included logistic regression, support vector machine, naive Bayes, k-nearest neighbors, and decision tree. The test set data were input into each model, and the classification performance was evaluated based on the accuracy, precision, and recall, as shown in the Table 3 below.
With the exception of naive Bayes, the accuracy, precision, and recall of the classification submodels established by the algorithms all reached the highest values. The most frequent results among the logistic regression, support vector machine, and decision tree classifications were chosen as the classification results of the Baijiu classification model. From the perspective of model prediction and classification effects, the integration of E-nose and E-tongue data with human sensory evaluation results can be used to more comprehensively and efficiently evaluate Baijiu’s flavor quality. Combining at least three submodels as the final Baijiu prediction and classification models can improve the accuracy in prediction and classification.

4. Conclusions

This study used an E-nose and E-tongue to detect 42 types of strong-aroma Baijiu and performed LDA. In the QDA experiment, 16 sensory descriptors were formed for the 42 types of strong-aroma Baijiu. Combining intelligent sensory technology and human sensory evaluation, strong-aroma Baijiu with different origins, with varying alcohol content and different grades, could be well distinguished. By integrating feature values from the E-nose and E-tongue detection data, a Baijiu prediction model and classification model based on a combination of three submodels were established, achieving good prediction and classification results. This study combined intelligent sensory technology, human sensory evaluation, and machine learning to achieve a relatively comprehensive and scientific evaluation of Baijiu’s flavor quality, providing support for the establishment of Baijiu flavor quality evaluation methods. This study also provides an effective reference method for the standardization of Baijiu quality inspection.

Author Contributions

Conceptualization, Y.C., S.J. and Y.L.; Methodology, A., S.J., D.Z.; Software, A.; Validation, A., S.L. and D.Z.; Formal Analysis, A. and S.J.; Investigation, J.S. and Y.L.; Resources, Y.C., S.L.; Data Curation, A.; Writing—Original Draft Preparation, A.; Writing—Review & Editing, S.J., J.S. and Y.L.; Visualization, A., D.Z. and S.L.; Supervision, S.J., Y.C. and Y.L.; Project Administration, S.L., S.J. and J.S.; Funding Acquisition, Y.C., J.S. and S.J. All authors have read and agreed to the published version of the manuscript.

Funding

This work was supported by the Suqian Sci & Tech Program (Grant No. L202205 and No. L202305) and the Open Project of the China Food Flavor and Nutrition Health Innovation Center (CFC2023B-007).

Institutional Review Board Statement

Ethical review and approval were waived for this study due to that evaluators involved in this study do not reject alcoholic beverages, and were only asked to taste Baijiu with a low amount.

Informed Consent Statement

Informed consent was obtained from all subjects involved in the study.

Data Availability Statement

The raw data supporting the conclusions of this article will be made available by the authors on request.

Conflicts of Interest

The authors declare that they have no known competing financial interests or personal relationships that could have appeared to influence the work reported in this paper.

References

  1. Xu, Y.Q.; Zhao, J.R.; Liu, X.; Zhang, C.S.; Zhao, Z.G.; Li, X.T.; Sun, B.G. Flavor mystery of Chinese traditional fermented baijiu: The great contribution of ester compounds. Food Chem. 2022, 369, 130920. [Google Scholar] [CrossRef]
  2. Wang, G.N.; Jing, S.; Wang, X.L.; Zheng, F.P.; Li, H.H.; Sun, B.G.; Li, Z.X. Evaluation of the Perceptual Interaction among Ester Odorants and Nonvolatile Organic Acids in Baijiu by GC-MS, GC-O, Odor Threshold, and Sensory Analysis. J. Agric. Food Chem. 2022, 70, 13987–13995. [Google Scholar] [CrossRef] [PubMed]
  3. Wang, J.S.; Chen, H.; Wu, Y.S.; Zhao, D.R. Uncover the flavor code of strong-aroma baijiu: Research progress on the revelation of aroma compounds in strong-aroma baijiu by means of modern separation technology and molecular sensory evaluation. J. Food Compos. Anal. 2022, 109, 104499. [Google Scholar] [CrossRef]
  4. He, Y.X.; Chen, S.; Tang, K.; Qian, M.; Yu, X.W.; Xu, Y. Sensory characterization of Baijiu pungency by combined time-intensity (TI) and temporal dominance of sensations (TDS). Food Res. Int. 2021, 147, 110493. [Google Scholar] [CrossRef]
  5. Qin, D.; Duan, J.W.; Li, H.H.; Zheng, F.P.; Cheng, H.; Ye, X.Q.; Sun, B.G. Characterization and comparison of the aroma-active compounds on different grades of sesame-flavor Baijiu by headspace solid-phase microextraction and gas chromatography-olfactometry-mass spectrometry. Food Sci. Hum. Well 2023, 12, 79–88. [Google Scholar] [CrossRef]
  6. Li, H.H.; Zhang, X.; Gao, X.J.; Shi, X.X.; Chen, S.; Xu, Y.; Tang, K. Comparison of the Aroma-Active Compounds and Sensory Characteristics of Different Grades of Light-Flavor Baijiu. Foods 2023, 12, 1238. [Google Scholar] [CrossRef] [PubMed]
  7. Wu, F.; Fan, S.H.; He, G.L.; Liang, S.Y.; Xu, Y.; Tang, K. Comparison of Aroma Compounds and Sensory Characteristics between Two Different Types of Rice-Based Baijiu. Foods 2024, 13, 681. [Google Scholar] [CrossRef]
  8. Wu, Y.S.; Chen, H.; Sun, Y.; Huang, H.; Chen, Y.Y.; Hong, J.X.; Liu, X.X.; Wei, H.Y.; Tian, W.J.; Zhao, D.R.; et al. Integration of Chemometrics and Sensory Metabolomics to Validate Quality Factors of Aged Baijiu (Nianfen Baijiu) with Emphasis on Long-Chain Fatty Acid Ethyl Esters. Foods 2023, 12, 3087. [Google Scholar] [CrossRef] [PubMed]
  9. Wang, A.L.; Zhu, Y.Y.; Zou, L.; Zhu, H.; Cao, R.G.; Zhao, G. Combination of machine learning and intelligent sensors in real-time quality control of alcoholic beverages. Food Sci. Tech. 2022, 42, e54622. [Google Scholar] [CrossRef]
  10. Wang, A.; Stancik, C.M.; Yin, Y.; Wu, J.; Duncan, S.E. Performance of cost-effective PET packaging with light protective additives to limit photo-oxidation in UHT milk under refrigerated LED-lighted storage condition. Food Packag. Shelf 2022, 31, 100773. [Google Scholar] [CrossRef]
  11. Robbiani, S.; Lotesoriere, B.J.; Dellacà, R.L.; Capelli, L. Physical Confounding Factors Affecting Gas Sensors Response: A Review on Effects and Compensation Strategies for Electronic Nose Applications. Chemosensors 2023, 11, 514. [Google Scholar] [CrossRef]
  12. Hou, Q.C.; Wang, Y.R.; Qu, D.W.; Zhao, H.J.; Tian, L.X.; Zhou, J.P.; Liu, J.Z.; Guo, Z. Microbial communities, functional, and flavor differences among three different-colored high-temperature Daqu: A comprehensive metagenomic, physicochemical, and electronic sensory analysis. Food Res. Int. 2024, 184, 114257. [Google Scholar] [CrossRef] [PubMed]
  13. Carrillo, J.K.; Durán, C.M.; Cáceres, J.M.; Cuastumal, C.A.; Ferreira, J.; Ramos, J.; Bahder, B.; Oates M and Ruiz, A. Assessment of E-Senses Performance through Machine Learning Models for Colombian Herbal Teas Classification. Chemosensors 2023, 11, 354. [Google Scholar] [CrossRef]
  14. Zhang, S.S.; Cheng, Y.; Luo, D.H.; He, J.F.; Wong, A.K.Y.; Hung, K. Channel Attention Convolutional Neural Network for Chinese Baijiu Detection With E-Nose. IEEE Sens. J. 2021, 21, 16170–16182. [Google Scholar] [CrossRef]
  15. Muñoz-Castells, R.; Modesti, M.; Moreno-García, J.; Rodríguez-Moreno, M.; Catini, A.; Capuano, R.; Di Natale, C.; Bellincontro, A.; Moreno, J. Differentiation through E-nose and GC-FID data modeling of rosé sparkling wines elaborated via traditional and Charmat methods. J. Sci. Food Agric. 2024, 1, 2–6. [Google Scholar] [CrossRef] [PubMed]
  16. Celdran, A.C.; Oates, M.J.; Cabrera, C.M.; Pangua, C.; Tardaguila, J.; Ruiz-Canales, A. Low-Cost Electronic Nose for Wine Variety Identification through Machine Learning Algorithms. Agronomy 2022, 12, 2627. [Google Scholar] [CrossRef]
  17. Aunsa-Ard, W.; Kerdcharoen, T. Electronic Nose for Analysis of Coffee Beans Obtained from Different Altitudes and Origin. In Proceedings of the 14th International Conference on Knowledge and Smart Technology (KST), Chon buri, Thailand, 26–29 January 2022; pp. 147–151. [Google Scholar]
  18. Jung, H.H.; Yea, J.; Lee, H.; Jung, H.N.; Jekal, J.; Lee, H.; Ha, J.; Oh, S.; Song, S.; Son, J.; et al. Taste Bud-Inspired Single-Drop Multitaste Sensing for Comprehensive Flavor Analysis with Deep Learning Algorithms. ACS Appl. Mater. Inter. 2023, 15, 46041–46053. [Google Scholar] [CrossRef] [PubMed]
  19. Zheng, W.B.; Shi, Y.; Xia, X.X.; Ying, Y.X.; Men, H. A data processing method for electronic tongue based on computational model of taste pathways and convolutional neural network. Measurement 2022, 205, 112150. [Google Scholar] [CrossRef]
  20. Zhang, L.; Wang, X.H.; Huang, G.B.; Liu, T.; Tan, X.H. Taste Recognition in E-Tongue Using Local Discriminant Preservation Projection. IEEE Trans. Cybern. 2019, 49, 947–960. [Google Scholar] [CrossRef]
  21. He, X.; Huang, Y.M.; Górska-Horczyczak, E.; Wierzbicka, A.; Jelen, H.H. Rapid analysis of Baijiu volatile compounds fingerprint for their aroma and regional origin authenticity assessment. Food Chem. 2021, 337, 128002. [Google Scholar] [CrossRef]
  22. Wu, J.H.; Chen, R.Y.; Li, X.B.; Fu, Z.Y.; Xian, C.; Zhao, W.W.; Zhao, C.; Wu, X.Y. Comprehensive identification of key compounds in different quality grades of soy sauce-aroma type baijiu by HS-SPME-GC-MS coupled with electronic nose. Front. Nutr. 2023, 10, 1132527. [Google Scholar] [CrossRef] [PubMed]
  23. Abi-Rizk, H.; Bouveresse, D.J.R.; Chamberland, J.; Cordella, C.B.Y. Recent developments of e-sensing devices coupled to data processing techniques in food quality evaluation: A critical review. Anal. Methods 2023, 15, 5410–5440. [Google Scholar] [CrossRef] [PubMed]
  24. Tian, X.J.; Wang, J.; Ma, Z.R.; Li, M.S.; Wei, Z.B. Combination of an E-Nose and an E-Tongue for Adulteration Detection of Minced Mutton Mixed with Pork. J. Food Qual. 2019, 1, 4342509. [Google Scholar] [CrossRef]
  25. Ji, H.Z.; Pu, D.D.; Yan, W.J.; Zhang, Q.C.; Zuo, M.; Zhang, Y.Y. Recent advances and application of machine learning in food flavor prediction and regulation. Trends Food Sci. Technol. 2023, 138, 738–751. [Google Scholar] [CrossRef]
  26. Al-Hooti, H.S.; Al-Bulushi, I.M.; Al-Attabi, Z.H.; Rahman, M.S.; Al-Subhi, L.K.; Al-Habsi, N.A. Efficiency of Electronic Nose in Detecting the Microbial Spoilage of Fresh Sardines. Foods 2024, 13, 428. [Google Scholar] [CrossRef] [PubMed]
  27. Li, T.; Wang, J.; Xu, B.Z.; Sun, H.B.; Liu, H.Q.; Wang, D.Q.; Shen, Y.; Wu, J.H.; Zhang, J.L.; Huang, M.Q.; et al. Comparative analysis of the differences among Langya flavor Baijiu and strong and soy sauce flavor Baijiu by targeted flavor analysis. J. Food Compos. Anal. 2023, 122, 105479. [Google Scholar] [CrossRef]
  28. Huang, Y.; Luo, M.; Wang, W.; Cen, H.Y.; Xie, Y.Q. Study on grading of Xiaoqu Baijiu based on untargeted detection of electrochemical measurements. Int. J. Food Prop. 2022, 25, 885–893. [Google Scholar] [CrossRef]
  29. Song, X.B.; Zhu, L.; Jing, S.; Li, Q.; Ji, J.; Zheng, F.P.; Zhao, Q.Z.; Sun, J.Y.; Chen, F.; Zhao, M.M.; et al. Insights into the Role of 2-Methyl-3-furanthiol and 2-Furfurylthiol as Markers for the Differentiation of Chinese Light, Strong, and Soy Sauce Aroma Types of Baijiu. J. Agric. Food Chem. 2020, 68, 7946–7954. [Google Scholar] [CrossRef]
  30. Liang, E.R.; Zhang, C.N.; Lang, Y.; Li, X.T.; Hu, S.L.; Xu, Y.Q.; Li, W.W.; Sun, B.G. Changes in Microbial Communities and Volatile Compounds during the Seventh Round of Sauce-Flavor baijiu Fermentation in Beijing Region. J. Am. Soc. Brew. Chem. 2023, 10, 1–10. [Google Scholar] [CrossRef]
  31. Wang, J.; Ming, Y.Z.; Li, Y.M.; Huang, M.Q.; Luo, S.Q.; Li, H.F.; Li, H.H.; Wu, J.H.; Sun, X.T.; Luo, X.L. Characterization and comparative study of the key odorants in Caoyuanwang mild-flavor style Baijiu using gas chromatography-olfactometry and sensory approaches. Food Chem. 2021, 347, 129028. [Google Scholar] [CrossRef]
  32. Xu, M.L.; Zhu, S.M.; Yu, Y. Quality assessment of Chinese liquor with different ages and prediction analysis based on gas chromatography and electronic nose. Sci. Rep. 2017, 7, 6541. [Google Scholar] [CrossRef] [PubMed]
  33. Li, Q.; Gu Y and Jia, J. Classification of Multiple Chinese Liquors by Means of a QCM-based E-Nose and MDS-SVM Classifier. Sensors 2017, 17, 272. [Google Scholar] [CrossRef] [PubMed]
  34. Geana, E.I.; Ciucure, C.T.; Apetrei, C. Electrochemical Sensors Coupled with Multivariate Statistical Analysis as Screening Tools for Wine Authentication Issues: A Review. Chemosensors 2020, 8, 59. [Google Scholar] [CrossRef]
  35. Hong, J.X.; Wang, J.S.; Zhang, C.S.; Zhao, Z.G.; Tian, W.J.; Wu, Y.S.; Chen, H.; Zhao, D.R.; Sun, J.Y. Unraveling variation on the profile aroma compounds of strong aroma type of Baijiu in different regions by molecular matrix analysis and olfactory analysis. RSC Adv. 2021, 11, 34262. [Google Scholar] [CrossRef]
  36. Sun, Y.L.; Ma, Y.; Chen, S.; Xu, Y.; Tang, K. Exploring the Mystery of the Sweetness of Baijiu by Sensory Evaluation, Compositional Analysis and Multivariate Data Analysis. Foods 2021, 10, 2843. [Google Scholar] [CrossRef]
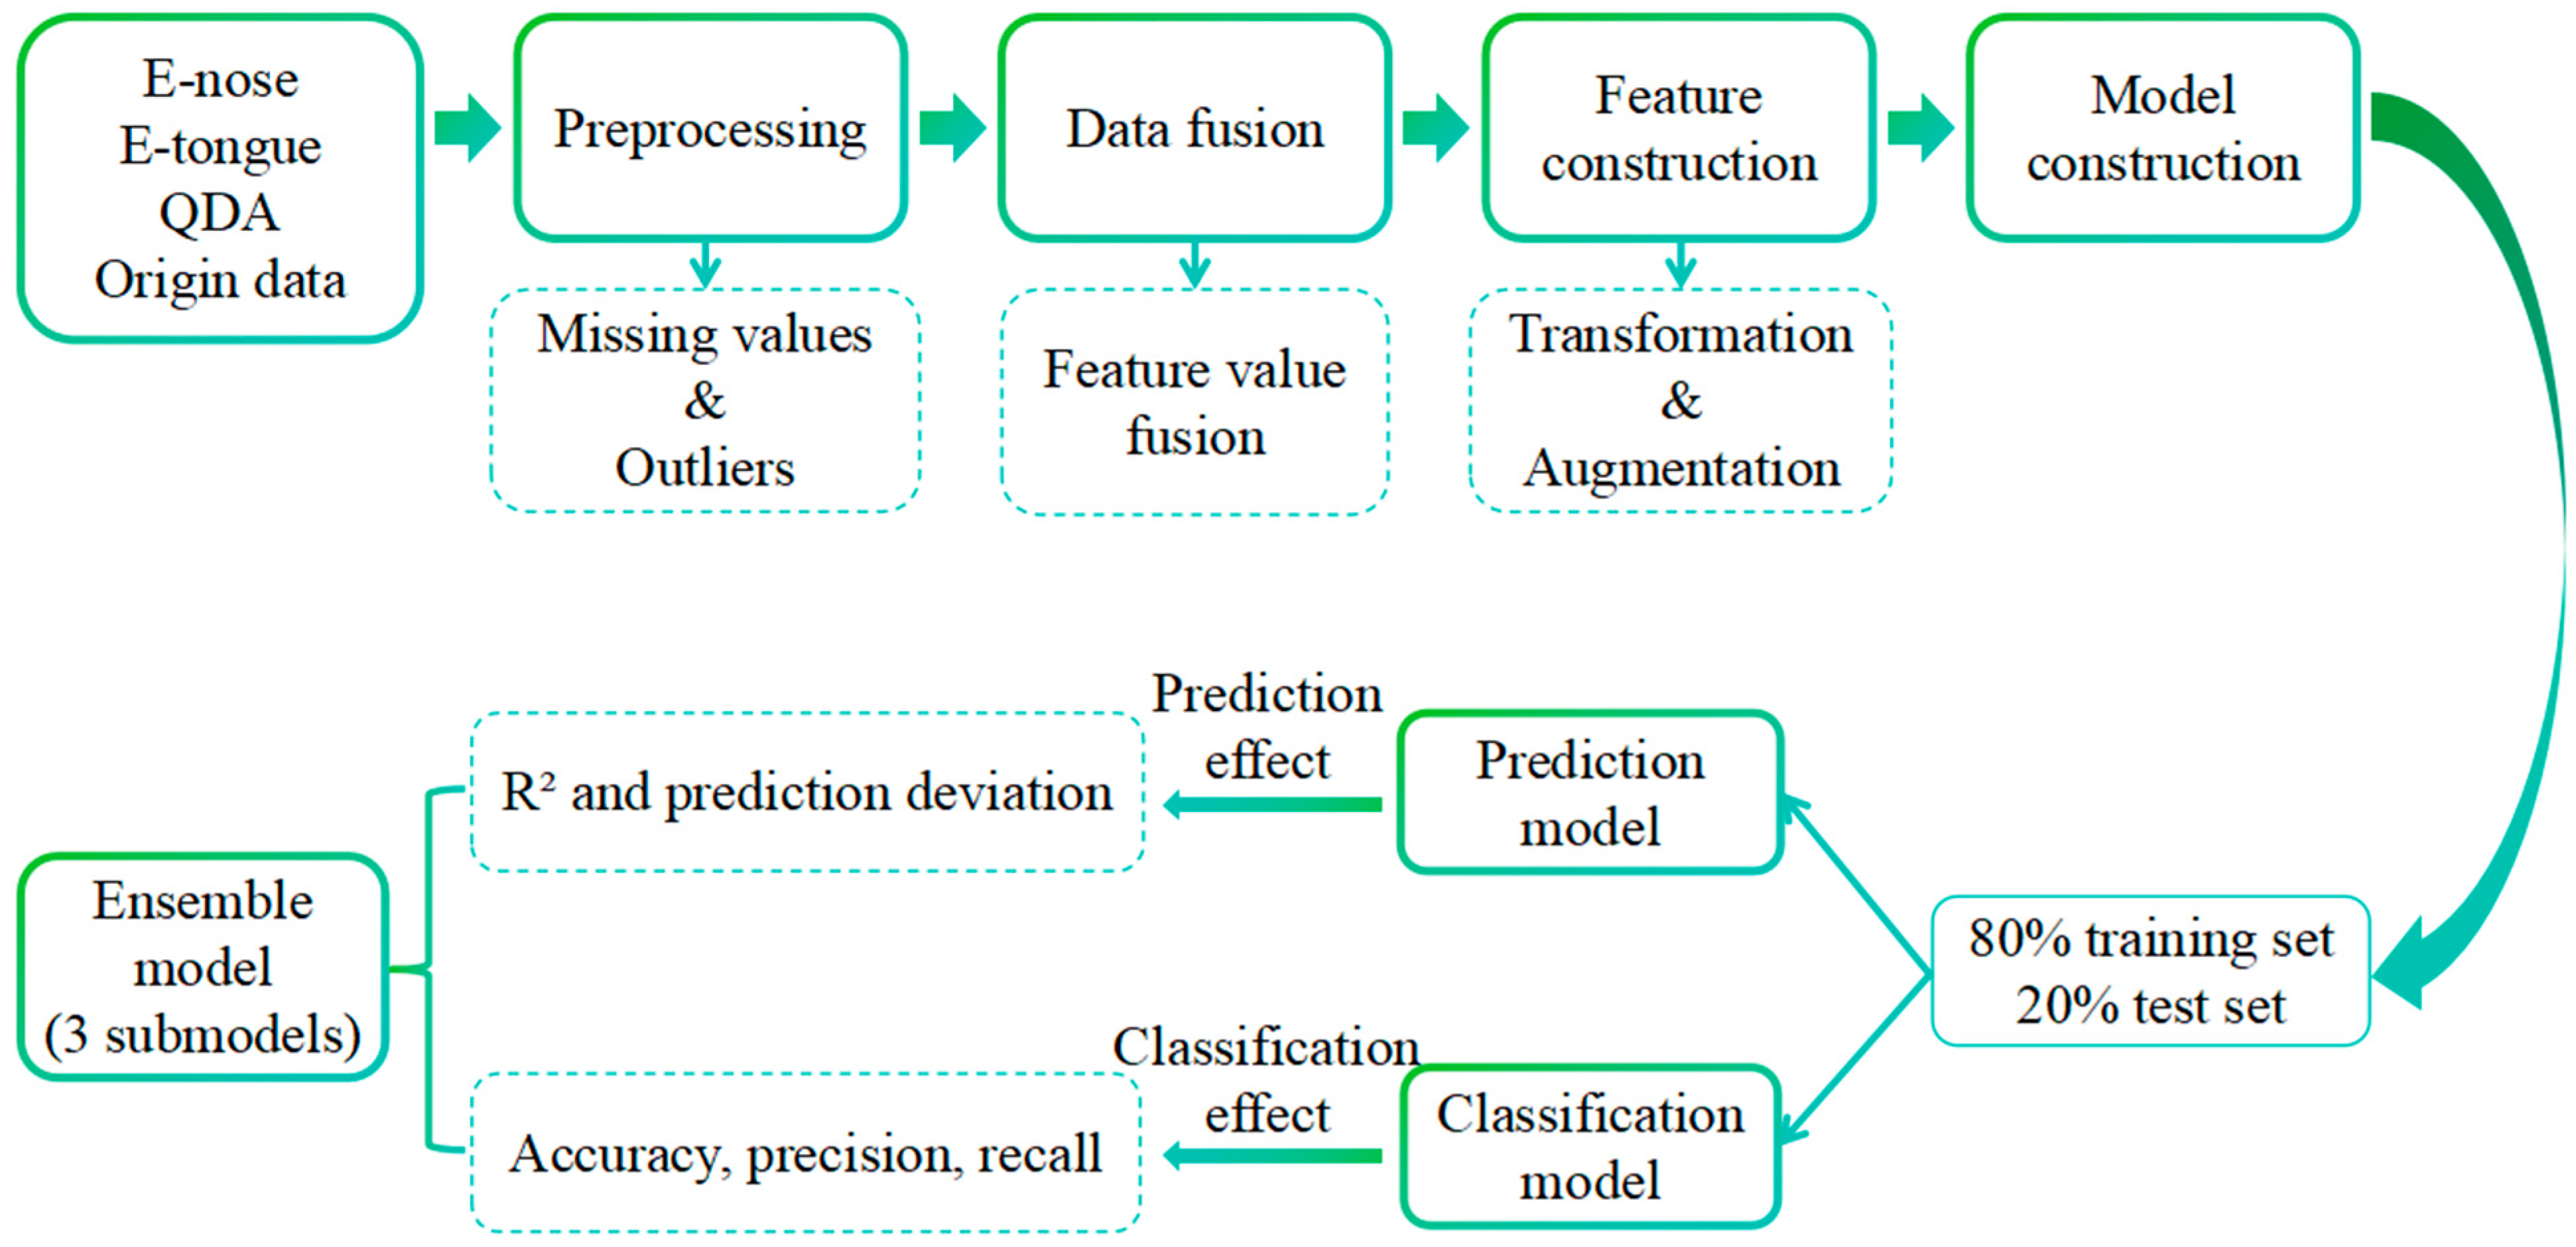
Figure 1. The flowchart of the overall experimental process.
Chemosensors 12 00125 g001
Figure 2. LDA results of E-nose detection data for strong-aroma Baijiu with different origins. (A) Baijiu with 42%vol alcohol content and first-class grade with different origins, (B) Baijiu with 42%vol alcohol content and excellent grade with different origins, (C) Baijiu with 40.8%vol alcohol content and excellent grade with different origins, (D) Baijiu with 52%vol alcohol content and excellent grade with different origins.
Chemosensors 12 00125 g002
Figure 3. LDA results of E-nose detection data for strong-aroma Baijiu with different alcohol content. (A) Baijiu with excellent grade from Huaian, (B) Baijiu with excellent grade from Lianyungang, (C) Baijiu with excellent grade from Suqian, (D) Baijiu with first-class grade from Suqian.
Chemosensors 12 00125 g003
Figure 4. LDA results of E-nose detection data for strong-aroma Baijiu of different grades. (A) Baijiu with 42%vol alcohol content from Suqian with different grades, (B) Baijiu with 42%vol alcohol content from Lianyungang with different grades.
Chemosensors 12 00125 g004
Figure 5. LDA results of E-tongue detection data for strong-aroma Baijiu with different origins, with varying alcohol content and different grades. (A) Baijiu with 42%vol alcohol content and first-class grade with different origins, (B) Baijiu with 42%vol alcohol content and excellent grade with different origins, (C) Baijiu with 40.8%vol alcohol content and excellent grade with different origins, (D) Baijiu with 52%vol alcohol content and excellent grade with different origins, (E) Baijiu with excellent grade from Huaian, (F) Baijiu with excellent grade from Lianyungang, (G) Baijiu with excellent grade from Suqian, (H) Baijiu with first-class grade from Suqian, (I) Baijiu with 42%vol alcohol content and different grades from Suqian, (J) Baijiu with 42%vol alcohol content and different grades from Lianyungang.
Chemosensors 12 00125 g005
Figure 6. QDA results for 42 types of strong-aroma Baijiu.
Chemosensors 12 00125 g006
Figure 7. Sensory attribute radar charts. (AJ) Grouping is the same as in Figure 4.
Chemosensors 12 00125 g007
Figure 8. Submodel prediction of QDA score results and corresponding R2 values for 16 samples. (A) Logistic regression, (B) decision tree, (C) random forest, (D) gradient boosting tree, (E) support vector regression, (F) k-nearest neighbors.
Chemosensors 12 00125 g008
Table 1. Information on the 42 Baijiu samples.
No.NameAlcohol Content
(%vol)
GradeOriginNo.NameAlcohol Content
(%vol)
GradeOrigin
1QYHLZM421 aYanghe, Suqian22GYV340.8ELianshui, Huaian
2MRJ421Yanghe, Suqian23SGJF40.8ESihong, Suqian
3HLMXJM421Yanghe, Suqian24STSJTX40.8ESihong, Suqian
4HLQH421Yanghe, Suqian25STSJDJ40.8ESihong, Suqian
5YHJC421Guannan, Lianyungang26MZLSJB40.8EYanghe, Suqian
6SGW421Guannan, Lianyungang27MZLM640.8EYanghe, Suqian
7GYDK42E bLianshui, Huaian28GH521Sucheng, Suqian
8GYSK42ELianshui, Huaian29HLQHDY521Yanghe, Suqian
9JSY42ELianshui, Huaian30HLZM521Yanghe, Suqian
10FRDH42EDonghai, Lianyungang31HLMXLM521Yanghe, Suqian
11ZGHTJ42EGuannan, Lianyungang32GY5252ELianshui, Huaian
12DTF42EGuannan, Lianyungang33WZTX52ESucheng, Suqian
13TGGC42EGuannan, Lianyungang34ZGMJ52EYanghe, Suqian
14TGJC42EGuannan, Lianyungang35XQH421Yanghe, Suqian
15SJ42ESihong, Suqian36SH440.8EYanghe, Suqian
16EYLH42ESucheng, Suqian37SH550.8EYanghe, Suqian
17ZGGH42ESucheng, Suqian38YMR35.8EMuyang, Suqian
18YHDQLC42EYanghe, Suqian39SGDQ46EYanghe, Suqian
19YHDQQC42EYanghe, Suqian40XFGC53EGanyu, Lianyungang
20HZL42EYanghe, Suqian41JSQL53EYanghe, Suqian
21TZL42EYanghe, Suqian42TF40.81Guannan, Lianyungang
a 1: First grade. b E: Excellent grade.
Table 2. Sensory descriptors and reference samples used in QDA.
Descriptive WordDefinitionReference Sample
AromaEthanolAroma of alcohol and ester substances40–50% food-grade ethanol
ChenA woody and honey aroma produced by long-term aging20–30% honey
FruityA fruit-like aroma10–20% apple or pear juice
JiaoAn earthy and musty aroma10–20 g/L Pu’er tea leaves
GrainAroma of cooked sorghum or corn100 g/L sorghum
QuAroma of Aspergillus oryzae fermentation100 g/L Aspergillus oryzae fermentation
SweetAroma of vanilla extract0.1–0.2% vanilla extract
Distilled grainAroma of distillers’ grains produced during fermentation100 g/L distillers’ grains
TasteSournessSour taste similar to acetic acid0.1–0.2% acetic acid
SweetnessSweet taste similar to sucrose solution10–20 g/L sucrose
BitternessBitter taste similar to quinine sulfate solution0.002% quinine sulfate solution
MouthfeelMellowA comfortable and smooth feeling in the mouth, without significant irritation50–100 mL/L soybean milk
RichAroma and taste linger in the mouth for a long time10–20 g/L peanut butter
CleanA refreshing and non-greasy mouthfeel5–10 leaves/L fresh mint leaves
HarmoniousUniform distribution of various aromas and tastesEqually proportioned mixed fruit juice
LongAroma and taste linger in the mouth for a long time1–2 g/L black tea leaves
Table 3. Classification accuracy, precision, and recall of logistic regression, support vector machine, naive Bayes, k-nearest neighbors, and decision tree models for strong-aroma Baijiu with 32 different origins and 24 different grades.
Model32 Different Origins24 Different Grades
AccuracyPrecisionRecallAccuracyPrecisionRecall
Logistic Regression100%1.001.00100%1.001.00
Support Vector Machine100%1.001.00100%1.001.00
Naive Bayes98.57%0.991.0093.75%0.940.89
k-Nearest Neighbors100%1.001.00100%1.001.00
Decision Tree100%1.001.00100%1.001.00
Disclaimer/Publisher’s Note: The statements, opinions and data contained in all publications are solely those of the individual author(s) and contributor(s) and not of MDPI and/or the editor(s). MDPI and/or the editor(s) disclaim responsibility for any injury to people or property resulting from any ideas, methods, instructions or products referred to in the content.