Abstract
In this study, a MOF-199/Ag@Au SERS sensing structure was successfully synthesized by combining metal–organic frameworks (MOFs) with surface-enhanced Raman scattering (SERS) technology for the efficient detection of dopamine (DA), a biomarker for neurological diseases, in serum. Using electrochemical methods, a copper-based MOF (MOF-199) was synthesized in situ on copper substrates and further deposited with silver nanoparticles (AgNPs). Subsequently, gold nanoshells were encapsulated around these silver cores by in situ chemical deposition. This preparation process is simple, controllable, and inexpensive. Furthermore, a novel Azo reaction-based DA SERS method was proposed to detect 1 pM DA, which represents an improvement in sensitivity by two orders of magnitude compared to previous unlabeled SERS detection methods and by four orders of magnitude compared to another SERS approach proposed in this work. There was an excellent linear relationship (R2 = 0.976) between the SERS signal at 1140 cm−1 and the DA concentration (0.001 M~1 pM). The results indicate that the MOF-199/Ag@Au sensor structure can successfully achieve both the qualitative and quantitative detection of DA in serum, thus providing a robust technical basis for the application of SERS technology in the field of clinical neurological disease screening.
1. Introduction
Neurotransmitters are a series of messenger molecules in the body that transmit information and maintain the balance of physiological functions []. They play important roles in emotion regulation and behavior, learning and cognitive activities, homeostasis in the body, and individual motor control and coordination [,,]. Dopamine (DA) is one of the most common of these neurotransmitters, regulating physiological processes in the nervous, hormonal, and cardiovascular systems []. The deficiency of DA leads to clinical symptoms such as Parkinson’s disease, depression, and schizophrenia [,,,,].
Clinically, the main methods of DA detection include fluorescence, colorimetric, and electrochemical methods [,,,]. Fluorescence and colorimetric methods require complex sample pretreatment and are not highly sensitive [,]; electrochemical methods, although sensitive, are difficult to accurately quantify DA in complex biological samples such as serum and urine due to the similarity of the electrode potentials of ascorbic acid, uric acid and DA [,]. Therefore, a rapid and simple analytical method with good specificity and high sensitivity for DA is urgently needed [].
Surface-enhanced Raman scattering (SERS), as a powerful surface-sensitive analytical tool, shows great potential for highly specific and sensitive analyses in the fields of food safety, environmental protection, and biological research [,,,,]. Gold and silver nanoparticles (Au and Ag NPs) are widely used as SERS substrates due to their remarkable SERS enhancement [,]. Efficient SERS substrates need to satisfy two basic requirements: excellent adsorption properties to adsorb molecules onto the surface of metal nanoparticles and the formation of abundant Raman hotspots between neighboring nanoparticles [,,]. By preparing hybrid materials such as silicon nanowire-coated silver (SiNWs@Ag), cerium oxide-coated titanium dioxide (CeO2@TiO2) [], and silver nanoparticles modified graphene oxide (AgNPs@GO) [], these SERS substrates exhibit enhanced performance due to their increased surface area and superior adsorption properties, facilitating efficient target molecule capture. Additionally, the synergistic interactions at the interfaces of different materials enhance the local electromagnetic fields, resulting in increased Raman signal enhancement and the formation of abundant hotspots, thereby improving the sensitivity and efficacy of SERS applications.
Wang et al. [] reported a study on the selective label-free SERS detection of DA using graphene–gold nanopyramidal heterostructures, further expanding the potential of SERS technology in the analytical field. Although the method performed well in terms of a detection limit of about 10−10 M, it was not suitable for the specific detection of DA. Next, Jin’s group [] proposed a surface acoustic wave-based SERS active sensing technique for silver nanoparticle clustering to achieve the rapid, label-free detection of DA; however, its sensitivity to the operating power may lead to nanoparticle sintering and nanogap loss, thus limiting the reproducibility and reliability of the method []. Jiang et al. [] employed silver nanoparticles incorporated into a metal–organic framework Material of Institute Lavoisier-101 (MIL-101) for the SERS detection of DA. This composite structure demonstrated excellent sensitivity and selectivity toward DA. However, the complex synthesis process and the instability of the nanosilver colloids used in the preparation present challenges to the method’s simplicity and stability.
The selective detection of low concentrations of DA in complex biological samples is challenging, and utilizing probe molecules that can selectively recognize DA [] offers a feasible solution []. Zhang et al. [] captured DA by adsorption of 3,3′-dithiodipropionic acid di(N-hydroxysuccinimide ester) (DSP) on a gold thin film and introduced 3-mercapto phenylboronic acid (3-MPBA) and functionalized AgNPs to form a plasma ‘hotspots’ to enhance the SERS signals, but the sparse hotspots limited the detection of low concentrations of DA. To solve this problem, Lu et al. [] used mercaptopropionic acid (MPA) functionalized nanoporous silver film (AgNF) and modified silver nanocubes (AgNCs) with 4-mercapto phenylboronic acid (4-MPBA) as a Raman reporter, which enhances the SERS signal through specific response and improves the detection sensitivity. However, this method is susceptible to complex interferences such as glucose in real serum samples, and it still has specific detection difficulties.
In conclusion, this paper addresses the challenges encountered in the SERS detection of serum DA by emphasizing the innovative design and optimization of SERS sensing structures. The design and efficient fabrication of a copper-based MOF (MOF-199)/silver–gold (Ag@Au) composite SERS sensing structure, enables the integration of the high porosity, excellent adsorption properties, and large specific surface area of MOF-199 with the potent SERS enhancement effect of Ag@Au NPs. This integration not only enhances the capture efficiency of DA molecules but also intensifies the SERS signal strength, thereby achieving a dual improvement in detection sensitivity and stability. On this foundation, this paper further introduces a method for the detection of DA by SERS, which is based on the Azo reaction. The Azo reaction entails the coupling of aromatic amines with nitrite ions under alkaline conditions, resulting in the formation of Azo compounds. These compounds exhibit strong and distinctive Raman signals due to their large Raman scattering cross-sections. This reaction specifically labels DA molecules, enhancing their detection by providing robust and characteristic Raman-active sites, thereby significantly increasing both the sensitivity and specificity of SERS. The improved sensing performance is attributed to the efficient amplification of the SERS signal and the reduction in interference from non-target molecules, which is crucial for detecting DA in complex biological samples. Consequently, this research not only possesses significant scientific value but also offers novel technical support for the diagnosis and treatment of DA-related diseases.
2. Materials and Methods
2.1. Materials and Apparatus
Anhydrous ethanol (C2H6O, 99.7%) was purchased from Shanghai Titan Technology company (Shanghai, China). Homotrimellitic acid (C9H6O6), ammonium perchlorate (NH4CIO4), and silver nitrate (AgNO3, 99.7%) were obtained from Aladdin (Shanghai, China).Sodium hydroxide (NaOH) and ammonia (NH3·H2O, 25%) were purchased from Chongqing Chemical Reagent company (Chongqing, China). Sodium nitrite (NaNO2), sodium carbonate (NaCO3), 4-aminothiophenol (PATP), p-aminothiophenol (C6H7NS), cystine (C6HN2O4S2), cysteine (C3H7NO2S), alanine (C3H7NO2), ascorbic acid (C6H8O6), lysine (C6H14N2O2), uric acid ( C5H4N4O3), aspartic acid (C4H4NO4), glucose (C6H12O6), chlortetracycline (AuCI3·HCI·4H2O), were purchased from Shanghai Titan Technology company (Shanghai, China). Copper flakes (Cu) was purchased from Hefei Shushan District, special nuclear metal materials merchant company (Hefei, China). All aqueous solutions were prepared using ultrapure water (18.2 MQ-cm) extracted from a Milli-Q water purification system.
The deposition of AgNPs on the surface of a copper sheet was conducted via the chronoamperometric method, employing a CHI600E electrochemical workstation (CHI600E CH Shanghai, China). Raman detection was conducted using an ATR8300 micro-Raman spectrometer (ATR8300 Optosky Xiamen, China). The excitation laser was 785 nm. Morphological and compositional analyses were conducted using a field-emission scanning electron microscope with an energy-dispersive spectroscopy (EDS) system (FE-SEM/EDS, JEOL JSM-7800F, Akishima, Japan).
2.2. Preparation of MOF-199
The electrochemical preparation of MOF-199 was successfully carried out in accordance with the existing literature []. The solvent was composed of 40 mL of deionized water and 120 mL of anhydrous ethanol, and the electrolyte was formulated by dissolving 840.6 mg of homobenzoic acid and 2735.2 mg of ammonium perchlorate. The cleaned copper sheet was employed as the anode of the electrochemical workstation, the saturated calomel electrode (SCE) was utilized as the reference electrode, and the platinum sheet was utilized as the auxiliary electrode to construct a three-electrode system and introduce the electrolyte. The electrochemical deposition was conducted via cyclic voltammetry, with the scanning voltage set between +1 V and −1 V, a scanning speed of 0.08 V/s, a resting time of 100 s, and a sensitivity of 0.01 A/V. This process yielded the desired MOF-199 product.
2.3. Preparation of MOF-199/Ag
Subsequently, MOF-199/Ag was successfully prepared via a two-step timed-current method. A solution of 170 mg of silver nitrate in 10 mL of deionized water was prepared, yielding a concentration of 0.010 M. Subsequently, 0.001% ammonia was added until the resulting brown precipitate was no longer visible, thereby producing the silver–ammonia electrolyte. The chronoamperometric method was initiated, the nucleation time was set to 9 s, the nucleation voltage was set to −1.6 volts, the growth time was set to 360 s, the growth voltage was set to −0.9 volts, and the sensitivity was set to 0.01 amperes per volt to ultimately yield MOF-199/Ag.
2.4. Preparation of MOF-199/Ag@Au
The MOF-199/Ag@Au was prepared by chemical deposition, and the MOF-199/Ag substrate was immersed in a 0.2 mM chloroauric acid solution for a period of 6 min in order to prepare the MOF-199/Ag composite substrate. Once the reaction was complete, the resulting MOF-199/Ag@Au was rinsed with deionized water, blown dry, and set aside for the final preparation of MOF-199/Ag@Au. The aforementioned reaction involves immersing the MOF-199/Ag substrate in a 0.2 mM chloroauric acid solution (HAuCl4) for 6 min. This process is a chemical deposition reaction, whereby gold ions (Au3+) in the chloroauric acid solution are reduced and deposited onto the surface of the MOF-199/Ag composite. This process was performed to create a core–shell structure, whereby a thin layer of Au was deposited on the surface of the Ag NPs. The deposition of Au onto Ag is crucial because it enhances the stability of the silver nanoparticles by protecting them from oxidation and corrosion. Furthermore, the gold coating enhances the overall performance of the SERS sensing structure. This is due to the excellent plasmonic properties of gold, which contribute to stronger electromagnetic fields at the surface, thereby improving the Raman signals. The combination of silver’s high enhancement factor and gold’s stability resulted in an optimized composite material, MOF-199/Ag@Au, which exhibited both high sensitivity and improved durability for detecting molecules such as DA in complex biological samples.
2.5. Testing of MOF-199/Ag@Au NPs
The unspiked and DA-spiked serum samples were combined with a specific volume (1:4) of methanol and then subjected to centrifugation at 6000 rpm for 15 min. Subsequently, 1 mL of the supernatant was removed and placed in an ice water bath. To the supernatant, 100 μL of NaNO2 solution (50 g/L), 100 μL of PATP solution (1.00 mmol/L), and 100 μL of Na2CO3 solution (100 g/L) were added, and the derivatization was carried out for 5 min to obtain the derivatized product, Azo. The MOF-199/Ag@Au substrate, prepared as previously described, was then placed on a confocal Raman spectrometer under a 20× objective lens at 785 nm. The SERS patterns of the obtained Azo compound and the reactant DA were acquired under the following conditions: 785 nm excitation light, 300 mW excitation light power, 5 s integration time, and 1 accumulation number under the objective lens.
3. Results
3.1. Design of Composite SERS Sensing Structure
This paper presents an innovative proposal for the combination of MOF-199 with core–shell structured Ag@Au NPs to construct a MOF-199/Ag@Au composite SERS sensing structure. The objective is to construct an efficient, sensitive, and specific detection structure for DA in serum. The proposal is based on the integration of materials science, nanotechnology, and chemical analysis methods. This design employs the three-dimensional porous structure of MOF-199, which exhibits high porosity and a large specific surface area, to provide abundant adsorption sites for DA molecules and facilitate their effective enrichment at the sensing interface []. Moreover, it functions as a carrier to support a greater number of Ag@Au NPs, thereby forming denser SERS-active hotspots. Concurrently, as the principal functional unit, the core–shell configuration of Ag@Au NPs not only preserves the elevated SERS enhancement capacity of silver but also markedly enhances the structural durability and antioxidant attributes through the gold coating. The electromagnetic coupling effect between Ag and Au serves to amplify the SERS signal of DA, as evidenced by the comparative analysis of SERS spectra measured before and after gold deposition. As illustrated in Figure 1, the experimental outcomes substantiate a considerable augmentation in the SERS signal subsequent to gold deposition, thereby corroborating the pivotal role of Au in enhancing the detection sensitivity. The combination of electromagnetic and chemical enhancement effects ensures high sensitivity in detection. Furthermore, this paper introduces the Azo reaction as a specific recognition method, which precisely and efficiently identifies DA molecules through its specific labeling and the large Raman scattering cross-section of the reaction product. This effectively addresses the issues of non-specific adsorption and signal interference that may exist in traditional SERS detection.
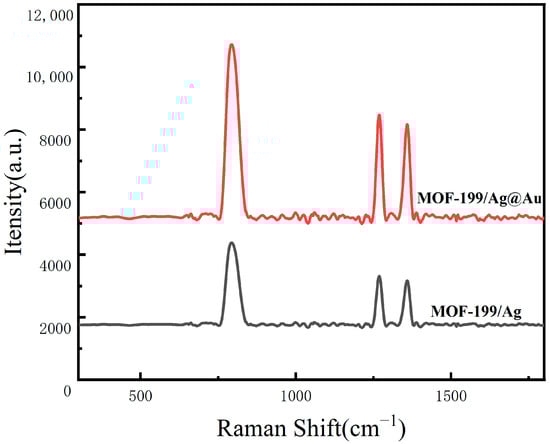
Figure 1.
SERS spectra of 10−3 M DA measured on the surfaces of MOF-199/Ag@AuNPs, MOF-199/Ag.
3.2. Characterization Results and Analysis of Composite SERS Sensing Structure
In order to investigate the influence of the surface morphology, size, and material type of the composite sensing structure on the sensing effect, the surface morphology and size of the electrochemically prepared MOF-199 were first characterized by SEM, and the results are shown in Figure 2a. It can be observed that the prepared MOF-199 has an ellipsoidal distribution with an average size of 1~2 μm. To ensure the accuracy of the particle size statistics, only nanoparticles facing the lens were selected for measurement for our analyses in Figure 2b,c, while those particles with obvious tilts or incomplete displays were excluded from the statistics. This selection minimizes the effect of viewing angle bias on the particle size measurement results, thus ensuring that the obtained particle size data are more reliable and representative. Thus, the particle size analysis of the MOF-199/Ag composites in Figure 2b shows that the average particle size of Ag nanoparticles is 208 nm, whereas in Figure 2c, the average particle size of MOF-199/Ag@Au nanoparticles increases to 233 nm after Au deposition. This increase in size confirms the successful deposition of gold shells on Ag nanoparticles, which not only improves the structural stability of the composites and the oxidation resistance but also enhances its SERS activity. The formation of dendritic structures is a result of the combination of electrodeposition conditions and crystal growth kinetics [,,,].
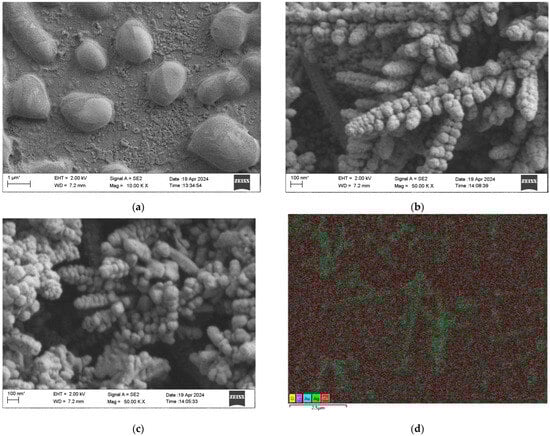
Figure 2.
(a) SEM characterization of MOF-199; (b) SEM characterization of MOF-199/Ag; (c) SEM characterization of MOF-199/Ag@Au; (d) EDS elemental mapping of MOF-199/Ag@Au.The asterisk (*) on the scale bar in the SEM image is a standard notation of the SEM system and does not typically affect the accuracy of the measurements.
The dendritic structure resembles sequoia branches with a length of about 1.5 μml the diameters of the main trunk and the branches are about 500 nm; and the growth angle of the side branches relative to the main trunk is 60 degrees, which suggests that the silver dendritic crystals have a tendency to grow preferentially in specific directions []. The decrease in surface free energy drives the directional attachment, which promotes the transition from polycrystalline to single-crystalline structures [,]. In addition, the growth time significantly affects the crystallinity of the crystals, with a shorter growth time leading to an imperfect polycrystalline structure at the tip, while a longer growth time contributes to further growth and improved crystallinity [,,]. Taken together, specific electrodeposition conditions and thermodynamic driving forces contributed to the formation of dendritic silver nanostructures. The dendritic structure has a significant role in enhancing the surface plasmon resonance [,,]. Figure 2d shows the EDS elemental mapping of the composite nanostructure, revealing the coexistence of elements such as Cu, O, Ag, and Au, which indicates the successful preparation of the MOF-199/Ag@Au composite nanostructure.
3.3. Improvement in and Analysis of DA SERS Detection Efficiency by MOF-199
Conventional noble metal SERS sensing structures have been observed to exhibit deficiencies in sensitivity, signal attenuation, and selectivity for DA SERS detection []. MOF-199 has been demonstrated to effectively address these shortcomings due to its large specific surface area, excellent pore structure, and strong optical enhancement properties. To substantiate the beneficial impact of MOF-199 in DA SERS detection, Ag@Au and MOF-199/Ag@Au were selected as sensing structures in this study. The SERS test was conducted using a consistent DA concentration as the test samples under identical test conditions, and the outcomes are illustrated in Figure 3a. Significant enhancement of the SERS signals was observed, with the appearance of Raman peaks at 780 cm−1, 1265 cm−1, 1330 cm−1, and so forth. These peaks corresponded to the benzene ring skeleton vibration (780 cm−1), the C-O bending vibration (1265 cm−1) [], and the C-OH vibration (1330 cm−1) of DA, respectively []. The composite nanostructures integrated with MOF-199 are more effective in enhancing the SERS signals of DA, which can be attributed to the high specific surface area of MOF-199, which provides more active sites and allows for the loading of more noble metal nanoparticles []. The combined effects of electromagnetic and chemical enhancement enable the detection of DA by SERS with superior efficacy.
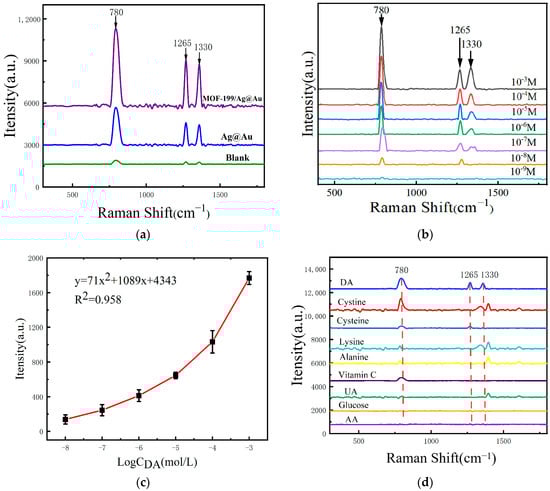
Figure 3.
(a) SERS spectra of 10−3 M DA measured on the surfaces of MOF-199/Ag@AuNPs, Ag@AuNPs, and glass slides without any enhancement material; (b) SERS spectra of DA solutions at different concentrations measured on the surface of MOF-199/Ag@AuNPs; (c) the relationship curve between the intensity of the Raman peak at 1330 cm−1 and the concentration of DA; (d) the SERS spectra measured by adsorbing nine sample solutions of the same concentration on the surface of MOF-199/Ag@Au nanocomposites.
3.4. Evaluation of Composite SERS Sensing Structures for the Label-Free SERS Detection of DA
Label-free detection has the advantages of not needing to introduce additional markers, easy operation, simplified sample processing, etc. Detection sensitivity, specificity, and assay reproducibility are three commonly used SERS assay evaluation indexes. In order to further evaluate the sensitivity of the composite SERS sensing structures designed and prepared in this study for the label-free SERS detection of DA, several composite SERS sensing structures were prepared under the same optimization conditions, and the same volume of DA solutions with concentrations from 10−3 mol/L to 10−9 mol/L were added onto the surfaces. The SERS signals obtained under the same test conditions are shown in Figure 3b. It can be seen that the SERS signal intensity gradually decreased with the decrease in the DA concentration, and the detection limit was 10−8 mol/L. Figure 3c demonstrates the fitting curve between the SERS signal intensity and the logarithm of the DA concentration at 1330 cm−1, with a correlation coefficient of R2 of 0.958, which indicates that the composite SERS sensing structure designed and prepared in this study can perform the label-free SERS detection, but the detection sensitivity is low and the linearity is poor.
To further demonstrate the specificity of the composite sensing structure for DA SERS detection, several substances commonly found in serum, such as cystine, cysteine, lysine, alanine, ascorbic acid, uric acid, glucose, and aspartic acid, were selected and subjected to SERS testing. The results are shown in Figure 3d. It can be observed that some Raman characteristic peaks of these substances exhibit Raman shifts that are extremely close to those of DA. When actual serum samples were tested, it was difficult to identify the specific signals of DA from the composite SERS signals. This indicates that the unlabeled SERS detection method for DA suffers from poor detection specificity.
3.5. Principles and Effect Evaluation of DA SERS Detection Based on the Azo Reaction
The previous results found that the DA-unlabeled SERS assay suffers from low detection sensitivity, as well as poor linear correlation and specificity. In order to solve this problem, this study proposes an Azo reaction-based SERS method for the detection of DA in serum, which is schematically shown in Figure 4.
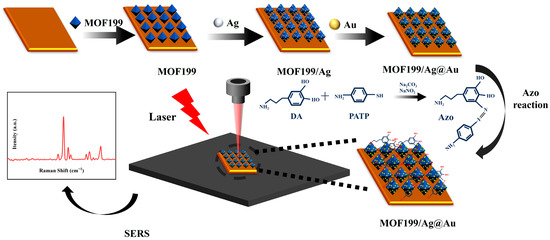
Figure 4.
The schematic diagram of DA SERS detection based on the Azo reaction.
The principle of the Azo reaction is through the process of aromatic amines reacting with nitrite under alkaline conditions to produce Azo compounds. Specifically, 100 μL of NaNO2 solution (50 g/L) and 100 μL of PATP solution (1.00 mmol/L) were added to 100 μL of DA solution in the presence of 100 μL of a Na2CO3 solution (100 g/L). In this study, NaNO2 reacts with the amino group (-NH2) in PATP to produce a diazonium salt intermediate (-N2+). Subsequently, this diazonium salt intermediate reacts with the phenolic hydroxyl group (-OH) on the benzene ring of the DA molecule via a nucleophilic coupling reaction of its diazonium group (-N2+) to form a C-N bond and produce the Azo compound Azo (-N=N-), a product that contains an Azo group directly linked to the DA benzene ring in the molecular structure. Through the analysis of SERS signals of Azo reaction products, DA was indirectly identified qualitatively and quantitatively. Additionally, due to the large Raman scattering cross-section of Azo reaction products, DA was identified with higher sensitivity. To further evaluate the detection effect of the Azo reaction-based SERS assay for DA, the feasibility of the method for DA SERS detection was first verified. Under the same testing conditions, using the same SERS sensing structure, SERS tests were performed on the same concentration of DA, NaNO2, Na2CO3, and PATP involved in the Azo reaction, as well as the reaction’s product Azo, and the results are shown in Figure 5a. It was found that the Azo reaction product had the same Raman characteristic peak as DA at the Raman shift of 1265 cm−1. In addition, new Raman peaks appeared at the Raman shifts of 1140 cm−1, 1385 cm−1, and 1434 cm−1, respectively. This indicates that SERS detection based on the Azo reaction can be used to identify the presence of DA.
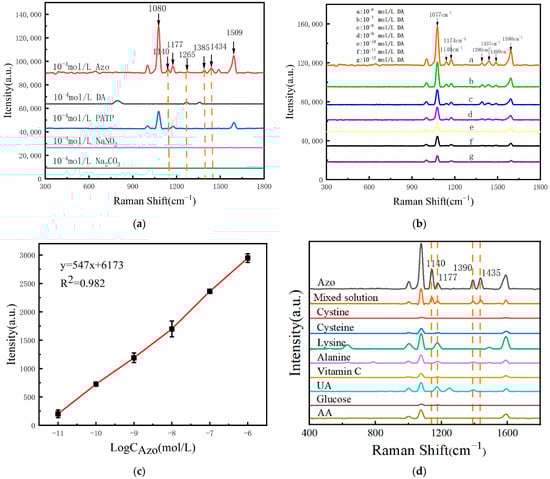
Figure 5.
(a) SERS spectra of Azo compounds, DA, PATP based on MOF-199/Ag@Au; (b) the SERS spectra of the individual products resulting from the Azo reactions between different concentrations of DA and the same reactant; (c) the relationship curve between the intensity of the Raman peak at 1140 cm−1 and the concentration of DA; (d) The SERS spectra measured by adsorbing nine sample solutions of the same concentration and their mixtures on the surface of MOF-199/Ag@Au nanocomposites.
In this study, equal volumes of DA at varying concentrations were reacted with PATP, NaNO2, and Na2CO3 for the same duration.The reaction products were then tested for SERS, and the results are presented in Figure 5b. It was observed that the intensity of the SERS signal of the Azo reaction products decreased with the decrease in the DA concentration. Furthermore, the detection limit of DA could be as low as 10−13 mol/L, which was five orders of magnitude higher than that of the unlabeled detection method. Furthermore, the relationship curve between the intensity of the Raman peak at 1140 cm−1 Raman shift and the logarithm of the DA concentration was plotted (Figure 5c), with a linear correlation coefficient of R2 = 0.982, indicating a strong linear correlation between the two variables. Furthermore, the specificity of the Azo reaction-based SERS assay for DA must be evaluated.
The control substances cystine, cysteine, lysine, alanine, ascorbic acid, uric acid, glucose, and aspartic acid were selected and reacted with PATP, NaNO2, and Na2CO3 under identical conditions. The resulting reaction products were then subjected to SERS testing, and the results are presented in Figure 5d. In contrast to the results observed with DA, the products generated from the reaction of these control substances with PATP, NaNO2, and Na2CO3 did not demonstrate notable changes or an enhancement of the characteristic peaks in the SERS spectra. In contrast, the Azo compounds generated by the reaction of DA with PATP exhibited distinctive Raman peaks at 1140 cm−1, 1177 cm−1, 1390 cm−1, and 1435 cm−1. In comparison to the reaction products of the other eight interfering substances, the characteristic peaks of the DA reaction products exhibited a notable distinction, indicating that this SERS detection method based on the Azo reaction has high specificity for DA and can effectively distinguish DA from other interfering substances.
3.6. Performance Evaluation of Azo Reaction-Based DA SERS Detection in Serum
To verify the practicality of the composite sensing structure and the Azo reaction-based DA SERS detection method in serum, we chose fetal bovine serum as the solvent, configured a 10−3 M~10−13 M DA serum solution, carried out the Azo reaction under the same conditions, and performed the SERS test on their reaction products. The results are shown in Figure 6a, which shows that the detection limit for DA can be as low as 10−12 mol/L. The SERS signal intensity of the Azo reaction products decreased with the decrease in the DA concentration in serum.
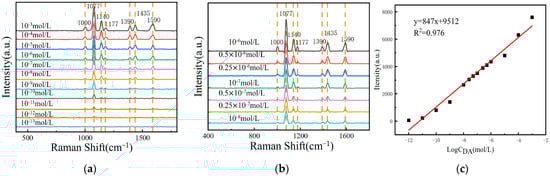
Figure 6.
(a) The SERS spectra of Azo reaction products of DA serum solutions at concentrations ranging from 10−3 M to 10−13 M were measured on the surface of MOF-199/Ag@Au composite structure; (b) the SERS spectra of Azo reaction products of DA serum solutions at concentrations ranging from 10−6 M to 10−8 M were measured on the surface of MOF-199/Ag@Au composite structure; (c) the relationship curve between Raman signal intensity at 1140 cm−1 and the logarithm of the DA concentration.
In actual serum, the concentration range of DA in normal human serum is typically 10−6 M~10−7 M, while the DA content in patients with neurological disorders is usually 10−7 M~10−8 M []. To further evaluate the practical quantitative detection performance, fetal bovine serum was also selected as the solvent, and DA solutions with concentrations of 10−6 M, 0.5 × 10⁻⁶ M, 0.25 × 10⁻⁶ M, 10−7 M, 0.5 × 10⁻⁷ M, 0.25 × 10⁻⁷ M, and 10−8 M were prepared. The Azo reactions were carried out under the same conditions, and the SERS signals of their Azo reaction products were tested. The results are shown in Figure 6b. It was found that the SERS signal intensity of the Azo reaction products decreased with the decrease in the DA concentration in serum.
As illustrated in Figure 6c, the SERS signal intensities at 1140 cm−1 of DA serum solutions in the concentration ranges of 10−3 M~10−12 M and 10−6 M~10−8 M were plotted against the corresponding logarithms of the concentrations on the same standard curve. The results demonstrate a strong positive correlation between the SERS signal intensity and the DA concentration in both the high concentration range of 10−3 M~10−12 M and the practical application concentration range of 10−6 M~10−8 M, with R2 = 0.976. This indicates that the composite SERS sensing membrane and the Azo reaction-based SERS DA detection method proposed in this paper have excellent linear response over a wide range of concentrations, thereby demonstrating the potential of this method for quantitative detection in practical applications and highlighting the reliability of serum as a screening tool for neurological diseases.
A comprehensive comparison of the MOF-199/Ag@Au-based SERS assay for DA with the methodologies previously documented in the literature is presented in Table 1. It is evident that the MOF-199/Ag@Au-based SERS method exhibits a superior linear range and a low LOD for DA. This is attributed to the porous MOF-199, which facilitates physical adsorption, thereby trapping a greater quantity of DA and MOFs and increasing the number of available SPR hotspots.

Table 1.
Comparison of MOF-199/Ag@Au-based SERS assay for DA with other methods.
4. Conclusions
In this paper, a novel MOF-199/Ag@Au composite SERS sensing structure was proposed, and its controllable preparation was conveniently realized using a combination of electrochemical and chemical reduction methods. The results demonstrate that the material exhibits excellent SERS enhancement capabilities. In comparison to previous unlabeled SERS methods, the detection limit is enhanced by two orders of magnitude []. Moreover, the novel approach exhibits an enhancement of 4–5 orders of magnitude in comparison to another SERS approach developed in this study. Moreover, the SERS detection of DA was conducted in conjunction with the Azo reaction analysis method. In comparison to the unlabeled method, the detection limit is enhanced by five orders of magnitude, and both the linear correlation (R2 = 0.982) and specificity exhibit notable improvement. When performing the SERS detection of DA in serum, the detection limit can be as low as 10−12 M, and there is also a good linear correlation (R2 = 0.976) between the possible concentrations of DA in actual serum and the SERS signals. The combination of the MOF-199/Ag@Au composite sensing structure with the Azo reaction analysis method resulted in the efficient, highly sensitive, and specific quantitative detection of DA, thereby demonstrating promising prospective applications in the early screening of clinical DA-related diseases.
Author Contributions
Conceptualization, Y.P. and C.W.; methodology, Y.P.; software, Y.P.; validation, Y.P., C.W., G.L. and J.C.; formal analysis, Y.P. and G.L.; investigation, Y.P. and J.C.; resources, C.W.; data curation, Y.P. and J.C.; writing—original draft preparation, Y.P.; writing—review and editing, Y.P., Z.W. and G.L.; visualization, Y.P. and X.Z.; supervision, C.W.; project administration, C.W.; funding acquisition, C.W. and Y.J.; technical support, X.L.; discussion and interpretation of results, G.L., Z.W. and Y.J.; chart preparation, X.Z. All authors have read and agreed to the published version of the manuscript.
Funding
This work was supported by the Chongqing University of Technology Research and Innovation Team Cultivation Program (No. 2023TDZ012), the Horizontal Project of Chongqing University of Technology (No. 2022Q535, 2023Q645), and the Natural Science Foundation of Chongqing (No. 2024NSCQ-MSX1731), and the Special funding project of Army Medical University under Grant (No. 2022XJS07X).
Institutional Review Board Statement
Not applicable.
Informed Consent Statement
Not applicable.
Data Availability Statement
The data that support the findings of this study are available from the corresponding author upon reasonable request. The data are not publicly available due to privacy.
Conflicts of Interest
The authors declare no conflicts of interest.
References
- Teleanu, R.I.; Niculescu, A.G.; Roza, E.; Vladâcenco, O.; Grumezescu, A.M.; Teleanu, D.M. Neurotransmitters—key factors in neurological and neurodegenerative disorders of the central nervous system. Int. J. Mol. Sci. 2022, 23, 5954. [Google Scholar] [CrossRef]
- Reis, H.J.; Guatimosim, C.; Paquet, M.; Santos, M.; Ribeiro, F.M.; Kummer, A.; Schenatto, G.; Salgado, J.V.; Vieira, L.B.; Teixeira, A.L.; et al. Neuro-transmitters in the central nervous system & their implication in learning and memory processes. Curr. Med. Chem. 2009, 16, 796–840. [Google Scholar]
- Nimgampalle, M.; Chakravarthy, H.; Sharma, S.; Shree, S.; Bhat, A.R.; Pradeepkiran, J.A.; Devanathan, V. Neurotransmitter systems in the etiology of major neurological disorders: Emerging insights and therapeutic implications. Ageing Res. Rev. 2023, 89, 101994. [Google Scholar] [CrossRef]
- Hodo, T.W.; De Aquino, M.T.P.; Shimamoto, A.; Shanker, A. Critical neurotransmitters in the neuroimmune network. Front. Immunol. 2020, 11, 1869. [Google Scholar] [CrossRef]
- Klein, M.O.; Battagello, D.S.; Cardoso, A.R.; Hauser, D.N.; Bittencourt, J.C.; Correa, R.G. Dopamine: Functions, signaling, and association with neurological diseases. Cell. Mol. Neurobiol. 2019, 39, 31–59. [Google Scholar] [CrossRef]
- Mehler-Wex, C.; Riederer, P.; Gerlach, M. Dopaminergic dysbalance in distinct basal ganglia neurocircuits: Implications for the pathophysiology of Parkinson’s disease, schizophrenia and attention deficit hyperactivity disorder. Neurotox. Res. 2006, 10, 167–179. [Google Scholar] [CrossRef]
- Swerdlow, N.R.; Koob, G.F. Dopamine, schizophrenia, mania, and depression: Toward a unified hypothesis of cortico-striatopallido-thalamic function. Behav. Brain. Sci. 1987, 10, 197–208. [Google Scholar] [CrossRef]
- Connolly, B.; Fox, S.H. Treatment of cognitive, psychiatric, and affective disorders associated with Parkinson’s disease. Neurotherapeutics 2014, 11, 78–91. [Google Scholar] [CrossRef]
- Van Praag, H.M.; Korf, J.; Lakke, J.; Lakke, J.P.W.F.; Schut, T. Dopamine metabolism in depressions, psychoses, and Parkinson’s disease: The problem of the specificity of biological variables in behaviour disorders. Psychol. Med. 1975, 5, 138–146. [Google Scholar] [CrossRef] [PubMed]
- Dallé, E.; Mabandla, M.V. Early life stress, depression and Parkinson’s disease: A new approach. Mol. Brain. 2018, 11, 1–13. [Google Scholar] [CrossRef] [PubMed]
- Wei, X.; Zhang, Z.; Wang, Z.A. simple dopamine detection method based on fluorescence analysis and dopamine polymerization. Microchem. J. 2019, 145, 55–58. [Google Scholar] [CrossRef]
- Liu, C.; Gomez, F.A.; Miao, Y.; Cui, P.; Lee, W. A colorimetric assay system for dopamine using microfluidic paper-based analytical devices. Talanta 2019, 194, 171–176. [Google Scholar] [CrossRef] [PubMed]
- Kamal Eddin, F.B.; Wing Fen, Y. Recent advances in electrochemical and optical sensing of dopamine. Sensors. 2020, 20, 1039. [Google Scholar] [CrossRef]
- Wang, H.B.; Zhang, H.D.; Chen, Y.; Huang, K.J.; Liu, Y.M. A label-free and ultrasensitive fluorescent sensor for dopamine detection based on double-stranded DNA templated copper nanoparticles. Sens. Actuators, B 2015, 220, 146–153. [Google Scholar] [CrossRef]
- Wang, J.; Hu, Y.; Zhou, Q.; Hu, L.; Fu, W.; Wang, Y. Peroxidase-like activity of metal–organic framework [Cu (PDA)(DMF)] and its application for colorimetric detection of dopamine. ACS. Appl. Mater. Interfaces 2019, 11, 43799–44932. [Google Scholar] [CrossRef]
- Zhang, X.; Yin, J.; Yoon, J. Recent advances in development of chiral fluorescent and colorimetric sensors. Chem. Rev. 2014, 114, 4918–4959. [Google Scholar] [CrossRef]
- Lakard, S.; Pavel, I.A.; Lakard, B. Electrochemical Biosensing of Dopamine Neurotransmitter: A Review. Biosensors 2021, 11, 179. [Google Scholar] [CrossRef]
- Tukimin, N.; Abdullah, J.; Sulaiman, Y. Electrochemical detection of uric acid, dopamine and ascorbic acid. J. Electrochem. Soc. 2018, 165, B258. [Google Scholar] [CrossRef]
- Abrantes Dias, A.S.; Amaral Pinto, J.C.; Magalhães, M.; Mendes, V.M.; Manadas, B. Analytical methods to monitor dopamine metabolism in plasma: Moving forward with improved diagnosis and treatment of neurological disorders. J. Pharmaceut. Biomed. 2020, 187, 113323. [Google Scholar] [CrossRef] [PubMed]
- Wu, L.; Tang, X.; Wu, T.; Zeng, W.; Zhu, X.; Hu, B.; Zhang, S. A review on current progress of Raman-based techniques in food safety: From normal Raman spectroscopy to SESORS. Food Res. Int. 2023, 169, 112944. [Google Scholar] [CrossRef]
- Hassan, M.M.; Zareef, M.; Xu, Y.; Li, H.; Chen, Q. SERS based sensor for mycotoxins detection: Challenges and improvements. Food Chem. 2021, 344, 128652. [Google Scholar] [CrossRef] [PubMed]
- Logan, N.; Cao, C.; Freitag, S.; Haughey, S.A.; Krska, R.; Elliott, C.T. Advancing Mycotoxin Detection in Food and Feed: Novel Insights from Surface-Enhanced Raman Spectroscopy (SERS). Adv. Mater. 2024, 36, 2309625. [Google Scholar] [CrossRef]
- Huang, Z.; Peng, J.; Xu, L.; Liu, P. Development and Application of Surface-Enhanced Raman Scattering (SERS). Nanomaterials 2024, 14, 1417. [Google Scholar] [CrossRef]
- Bernat, A.; Samiwala, M.; Albo, J.; Jiang, X.; Rao, Q. Challenges in SERS-based pesticide detection and plausible solutions. J. Agric. Food. Chem. 2019, 67, 12341–12347. [Google Scholar] [CrossRef]
- Herrera, G.M.; Padilla, A.C.; Hernandez-Rivera, S.P. Surface enhanced Raman scattering (SERS) studies of gold and silver nanoparticles prepared by laser ablation. Nanomaterials 2013, 3, 158–172. [Google Scholar] [CrossRef]
- Mosier-Boss, P.A. Review of SERS substrates for chemical sensing. Nanomaterials 2017, 7, 142. [Google Scholar] [CrossRef]
- Cao, Y.; Zhang, J.; Yang, Y.; Huang, Z.; Long, N.V.; Fu, C. Engineering of SERS substrates based on noble metal nanomaterials for chemical and biomedical applications. Appl. Spectrosc. Rev. 2015, 50, 499–525. [Google Scholar] [CrossRef]
- Lai, H.; Xu, F.; Zhang, Y.; Wang, L. Recent progress on graphene-based substrates for surface-enhanced Raman scattering applications. J. Mater. Chem. 2018, 6, 4008–4028. [Google Scholar] [CrossRef]
- Xu, K.; Zhou, R.; Takei, K.; Hong, M. Toward flexible surface-enhanced Raman scattering (SERS) sensors for point-of-care diagnostics. Adv. Sci. Lett. 2019, 6, 1900925. [Google Scholar] [CrossRef]
- Gwon, Y.; Kim, J.-H.; Lee, S.-W. Quantification of Plasma Dopamine in Depressed Patients Using Silver-Enriched Silicon Nanowires as SERS-Active Substrates. ACS Sens. 2024, 9, 870–882. [Google Scholar] [CrossRef]
- Kayalık, A.; Saçmacı, Ş. A novel dopamine platform based on CeO2@ TiO2 nanocomposite modified AuNPs/AgNPs nanoparticle and SERS application. J. Mol. Struct. 2024, 1304, 137644. [Google Scholar] [CrossRef]
- Wang, P.; Xia, M.; Liang, O.; Sun, K.; Cipriano, A.F.; Schroeder, T.; Liu, H.; Xie, Y.H. Label-free SERS selective detection of dopamine and serotonin using graphene-Au nanopyramid heterostructure. Anal. Chem. 2015, 87, 10255–10261. [Google Scholar] [CrossRef]
- Park, J.O.; Choi, Y.; Ahn, H.M.; Lee, C.K.; Chun, H.; Park, Y.M.; Kim, K.B. Aggregation of Ag nanoparticle based on surface acoustic wave for surface-enhanced Raman spectroscopy detection of dopamine. Anal. Chim. Acta 2024, 1285, 342036. [Google Scholar] [CrossRef]
- Sibug-Torres, S.M.; Grys, D.B.; Kang, G.; Niihori, M.; Wyatt, E.; Spiesshofer, N.; Ruane, A.; de Nijs, B.; Baumberg, J.J. In situ electrochemical regeneration of nanogap hotspots for continuously reusable ultrathin SERS sensors. Nat. Commun. 2024, 15, 2022. [Google Scholar] [CrossRef]
- Jiang, Z.; Gao, P.; Yang, L.; Huang, C.; Li, Y. Facile in situ synthesis of silver nanoparticles on the surface of metal–organic framework for ultrasensitive surface-enhanced Raman scattering detection of dopamine. Anal. Chem. 2015, 87, 12177–12182. [Google Scholar] [CrossRef]
- Yang, Y.; Li, M.; Zhu, Z. A novel electrochemical sensor based on carbon nanotubes array for selective detection of dopamine or uric acid. Talanta 2019, 201, 295–300. [Google Scholar] [CrossRef]
- Zhang, K.; Liu, Y.; Wang, Y.; Zhang, R.; Liu, J.; Wei, J.; Qian, H.; Qian, K.; Chen, R.; Liu, B. Quantitative SERS detection of dopamine in cerebrospinal fluid by dual-recognition-induced hot spot generation. ACS Appl. Mater. Interfaces 2018, 10, 15388–15394. [Google Scholar] [CrossRef]
- Lu, D.; Fan, M.; Cai, R.; Huang, Z.; You, R.; Huang, L.; Feng, S.; Lu, Y. Silver nanocube coupling with a nanoporous silver film for dual-molecule recognition based ultrasensitive SERS detection of dopamine. Analyst 2020, 145, 3009–3016. [Google Scholar] [CrossRef]
- Dokhan, S.; di Caprio, D.; Taleb, A.; Reis, F.D.A.A. Effects of Adsorbate Diffusion and Edges in a Transition from Particle to Dendritic Morphology during Silver Electrodeposition. ACS Appl. Mater. Interfaces 2022, 14, 49362–49374. [Google Scholar] [CrossRef] [PubMed]
- Li, L.; Chen, Y.; Yang, L.; Wang, Z.; Liu, H. Recent advances in applications of metal–organic frameworks for sample preparation in pharmaceutical analysis. Coord. Chem. Rev. 2020, 411, 213235. [Google Scholar] [CrossRef]
- Nazemi, M.; Soule, L.; Liu, M.; El-Sayed, M.A. Ambient ammonia electrosynthesis from nitrogen and water by incorporating palladium in bimetallic gold–silver nanocages. J. Electrochem. Soc. 2020, 167, 054511. [Google Scholar] [CrossRef]
- Rezaei, B.; Damiri, S. Electrodeposited silver nanodendrites electrode with strongly enhanced electrocatalytic activity. Talanta 2010, 83, 197–204. [Google Scholar] [CrossRef] [PubMed]
- Bahadori, S.R.; Mei, L.; Athavale, A.; Chiu, Y.J.; Pickering, C.S.; Hao, Y. New insight into single-crystal silver dendrite formation and growth mechanisms. Cryst. Growth Des. 2020, 20, 7291–7299. [Google Scholar] [CrossRef]
- Li, S.; Wang, Z.; Shao, Y.; Zhang, K.; Mei, L.; Wang, J. In situ detection of fluid media based on a three-dimensional dendritic silver surface-enhanced Raman scattering substrate. New J. Chem. 2022, 46, 1785–1790. [Google Scholar] [CrossRef]
- Zhang, G.; Sun, S.; Banis, M.N.; Li, R.; Cai, M.; Sun, X. Morphology-Controlled Green Synthesis of Single Crystalline Silver Dendrites, Dendritic Flowers, and Rods, and Their Growth Mechanism. Cryst. Growth Des. 2011, 11, 2493–2499. [Google Scholar] [CrossRef]
- Ha, M.; Kim, J.H.; You, M.; Li, Q.; Fan, C.; Nam, J.M. Multicomponent plasmonic nanoparticles: From heterostructured nanoparticles to colloidal composite nanostructures. New J. Chem. 2019, 119, 12208–12278. [Google Scholar] [CrossRef]
- Ko, J.; Berger, R.; Lee, H.; Yoon, H.; Cho, J.; Char, K. Electronic effects of nano-confinement in functional organic and inorganic materials for optoelectronics. Chem. Soc. Rev. 2021, 50, 3585–3628. [Google Scholar] [CrossRef]
- Zhang, J.; Lin, L.; Jia, K.; Sun, L.; Peng, H.; Liu, Z. Controlled growth of single-crystal graphene films. Adv. Mater. 2020, 32, 1903266. [Google Scholar] [CrossRef]
- Shtukenberg, A.G.; Punin, Y.O.; Gujral, A.; Kahr, B. Growth actuated bending and twisting of single crystals. Angew. Chem. Int. Ed. 2014, 53, 672–699. [Google Scholar] [CrossRef]
- Gao, Y.; Peng, X. Crystal structure control of CdSe nanocrystals in growth and nucleation: Dominating effects of surface versus interior structure. J. Am. Chem. Soc. 2014, 136, 6724–6732. [Google Scholar] [CrossRef]
- Ceballos, M.; Arizmendi-Morquecho, A.; Sánchez-Domínguez, M.; López, I. Electrochemical growth of silver nanodendrites on aluminum and their application as surface-enhanced Raman spectroscopy (SERS) substrates. Mater. Chem. Phys. 2020, 240, 122225. [Google Scholar] [CrossRef]
- Cai, W.F.; Pu, K.B.; Ma, Q.; Wang, Y.H. Insight into the fabrication and perspective of dendritic Ag nanostructures. J. Exp. Nanosci. 2017, 12, 319–337. [Google Scholar] [CrossRef]
- Xu, H.; Song, P.; Fernandez, C.; Wang, J.; Shiraishi, Y.; Wang, C.; Du, Y. Surface plasmon enhanced ethylene glycol electrooxidation based on hollow platinum-silver nanodendrites structures. J. Taiwan Inst. Chem. Eng. 2018, 91, 316–322. [Google Scholar] [CrossRef]
- Niihori, M.; Földes, T.; Readman, C.A.; Arul, R.; Grys, D.B.; Nijs, B.; Rosta, E.; Baumberg, J.J. SERS sensing of dopamine with Fe (III)-sensitized nanogaps in recleanable AuNP monolayer films. Small 2023, 19, 2302531. [Google Scholar] [CrossRef]
- Figueiredo, M.L.; Martin, C.S.; Furini, L.N.; Rubira, R.J.; Batagin-Neto, A.; Alessio, P.; Constantino, C.J. Surface-enhanced Raman scattering for dopamine in Ag colloid: Adsorption mechanism and detection in the presence of interfering species. Appl. Surf. Sci. 2020, 522, 146466. [Google Scholar] [CrossRef]
- Nam, W.; Kim, W.; Zhou, W.; You, E.A. A digital SERS sensing platform using 3D nanolaminate plasmonic crystals coupled with Au nanoparticles for accurate quantitative detection of dopamine. Nanoscale 2021, 13, 17340–17349. [Google Scholar] [CrossRef]
- Meng, X.; Dai, Z.; Jia, C.Q.; Yang, L.; Jiang, W.; Yao, L.; Zhou, Q.; Xu, B. Hierarchical Porous MOF-199 and Zeolite Composites with High Adsorption Performance for Both Toluene and Acetone. Ind. Eng. Chem. Res. 2023, 62, 19702–19714. [Google Scholar] [CrossRef]
- Shi, J.; Li, J.; Liang, A.; Jiang, Z. Highly catalysis MOFCe supported Ag nanoclusters coupled with specific aptamer for SERS quantitative assay of trace dopamine. Talanta 2022, 245, 123468. [Google Scholar] [CrossRef]
- Huang, H.N.; Wang, S.Y.; Chiang, W.H. Microplasma-engineered Ag/GONR-based nanocomposites for selective and label-free SERS-sensitive detection of dopamine. ACS Appl. Nano Mater. 2021, 4, 10360–10369. [Google Scholar] [CrossRef]
- Tang, Z.; Jiang, K.; Sun, S.; Qian, S.; Wang, Y.; Lin, H. A conjugated carbon-dot–tyrosinase bioprobe for highly selective and sensitive detection of dopamine. Analyst 2019, 144, 468–473. [Google Scholar] [CrossRef]
- Shukla, R.P.; Aroosh, M.; Matzafi, A.; Ben-Yoav, H. Partially functional electrode modifications for rapid detection of dopamine in urine. Adv. Funct. Mater. 2021, 31, 2004146. [Google Scholar] [CrossRef]
- Wei, M.X.; Wei, N.; Pang, L.F.; Guo, X.F.; Wang, H. Determination of dopamine in human serum based on green-emitting fluorescence carbon dots. Opt. Mater. 2021, 118, 111257. [Google Scholar] [CrossRef]
- Ansah, I.B.; Lee, W.; Mun, C.; Rha, J.; Jung, H.S.; Kang, M.; Park, S.; Kim, D. In situ electrochemical surface modification of Au electrodes for simultaneous label-free SERS detection of ascorbic acid, dopamine and uric acid. Sens. Actuators B 2022, 353, 131196. [Google Scholar] [CrossRef]
Disclaimer/Publisher’s Note: The statements, opinions and data contained in all publications are solely those of the individual author(s) and contributor(s) and not of MDPI and/or the editor(s). MDPI and/or the editor(s) disclaim responsibility for any injury to people or property resulting from any ideas, methods, instructions or products referred to in the content. |
© 2024 by the authors. Licensee MDPI, Basel, Switzerland. This article is an open access article distributed under the terms and conditions of the Creative Commons Attribution (CC BY) license (https://creativecommons.org/licenses/by/4.0/).