Abstract
In this study, an excitation–emission–pH multi-way fluorescence technique coupled with a third-order calibration method based on an alternating quadrilinear decomposition (AQLD) algorithm was proposed for the simultaneous determination of thiabendazole (TBZ) and carbaryl (CAR) in apples. AQLD can be considered a “mathematical separation” technique that extracts the pure signal of the target analyte from complex mixed signals, thereby effectively addressing fluorescence peak overlap and unknown interference. The average spiked recoveries of the target analytes ranged from 98.4% to 101.9%, and the relative standard deviation was less than 5.6%. To evaluate the performance of the method, a number of parameters were calculated, including sensitivity (SEN), selectivity (SEL), limit of detection (LOD), limit of quantification (LOQ), and intra-day and inter-day precision. The results of the third-order calibration method were compared with those of the second-order calibration method (based on excitation–emission matrix fluorescence). These results showed that the former was superior. In short, the proposed strategy is simple, cost-effective, and anti-interference, providing a valuable reference for accurate quantification of TBZ and CAR in complex food matrices with uncalibrated interferences.
1. Introduction
As an important component of a balanced diet in people’s daily lives, fruits are rich in a variety of vitamins, dietary fiber, minerals, and antioxidants. In modern agricultural production, in order to ensure the yield of fruits, fruit farmers usually use pesticide spraying to protect fruits from pests and diseases. However, the widespread use of pesticides has also led to the highly anticipated social issue of pesticide residues. During the fruit cultivation period, high-dose application of pesticides will not only pollute the ecological environment but also lead to increased levels of pesticide residues in fruits, posing a threat to consumer health. If pesticide residues accumulate in the human body for a long time, they can lead to chronic poisoning and may induce a variety of diseases. In life, many people often ignore asking whether pesticides have been used when buying fruits, thinking that the impact is minimal, but they do not know that this has huge hidden dangers. Long-term intake of fruits containing pesticide residues will cause pesticides to gradually accumulate in the body and reach the connection between nerves and muscles through blood circulation, causing serious damage to neurons. In severe cases, it may lead to damage to the central nervous system, thereby weakening the immune function of organs throughout the body [1,2]. Thiabendazole (TBZ) is a highly effective, long-acting, broad-spectrum systemic fungicide that can be used to prevent and control various diseases of crops caused by fungi. It is used for post-harvest treatment of fruits and vegetables to prevent and control certain diseases that occur during storage and is now widely used [3,4,5]. As a carbamate insecticide, carbaryl (CAR) has the advantages of high efficiency and a strong control effect on pests [6,7,8,9]. Chemical structures of TBZ and CAR are shown in Figure 1. However, the problem of pesticide residues is becoming increasingly serious. Residues exceed national safety standards in some areas and threaten the environment and human health. This problem has caused widespread concern. Pesticide residues contain trace amounts of pesticides and toxic metabolites that are very harmful [10,11,12,13]. TBZ is a benzo heterocyclic compound containing two nitrogen atoms. This special structure can form hydrogen bonds with enzymes and receptors in organisms, coordinate with metal ions, and undergo hydrophobic-hydrophobic and π-π interactions. CAR can remain in soil, fruit, grain, and other media for a long time and can easily enter the human body through the respiratory tract and skin contact, causing serious harm to the human body. Therefore, the rapid and accurate detection of TBZ and CAR residue levels is crucial for food regulation and safeguarding consumer health.
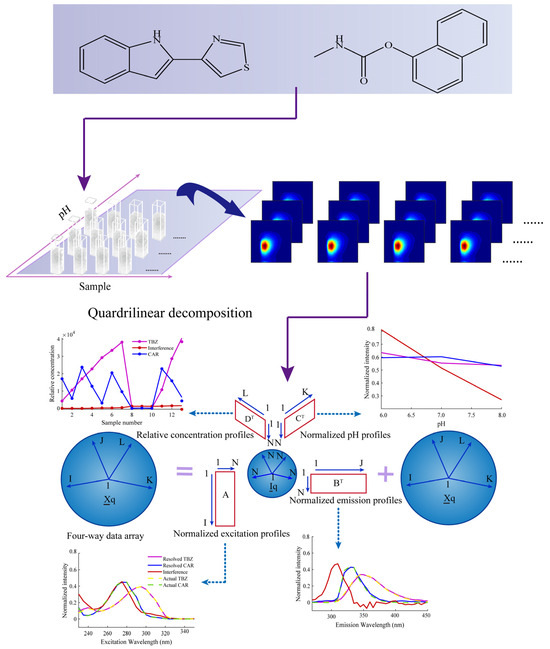
Figure 1.
A complete idea of AQLD combined with fluorescence for quantifying TBZ and CAR in apples.
Many countries and regions have formulated control standards for pesticide residues in fruits. In the European Union, the maximum residue limits (MRLs) for TBZ and CAR are 0.1 mg kg−1 and 0.05 mg kg−1, respectively [14]. Both the Food and Agriculture Organization of the United Nations (FAO) and the World Health Organization (WHO) have listed TBZ and CAR as compounds that must be regularly evaluated. Excessive use of pesticides will lead to an increase in their residues in fruit samples, which can exceed the maximum residue limit allowed, thus posing a threat to consumer health. Therefore, it is particularly important to develop a rapid, sensitive, and accurate detection and quantification method for monitoring pesticide residues in fruit samples. There are many analytical methods for the detection of TBZ and CAR residues [15], such as high-performance liquid chromatography (HPLC) [16], liquid chromatography-mass spectrometry (LC-MS) [17], ultra-high-performance liquid chromatography-MS/MS (UHPLC-MS/MS) [18], gas chromatography (GC) [19], gas chromatography-mass spectrometry (GC-MS) [20], fluorescence spectrophotometry [21,22], surface-enhanced Raman spectroscopy (SERS) [23], electrochemical method [24], and immunoassay [25]. Although some of these detection methods have high sensitivity and accuracy, they often require complex sample pretreatment and long analysis time, and it is difficult to meet the requirements of fast and simple operation [3]. In comparison, luminescence techniques such as fluorescence spectroscopy are used as a green strategy due to their ease of operation and relatively low cost. This method can not only rapidly determine pesticide residues in fruits but also has a low detection limit and high sensitivity. Therefore, fluorescence spectroscopy provides an attractive alternative for the detection of pesticide residues in complex matrices.
The apple is a relatively complex matrix, rich in various amino acids, phenolic compounds, vitamin E, etc. [26,27]. Conventional fluorescence spectrophotometry faces some challenges in quantitative analysis, especially when dealing with multi-component mixtures. The problems of spectral overlap and unknown interferences in complex matrices are particularly pronounced [28,29]. Complex pretreatment operations prior to spectral analysis may lead to significant loss of target analytes, thereby compromising the accuracy of the analytical results.
Excitation–emission matrix fluorescence (EEM) spectroscopy generates a data matrix for each sample that contains rich spectral information. A key advantage of three-way calibration is the “second-order advantage”. This feature allows accurate quantification of target analytes even in the presence of unknown spectral interferences. By constructing an excitation–emission–sample three-way data array, it is possible to analyze two pesticides in a complex matrix. Further, by introducing pH as the fourth mode, we can construct a four-way data array of excitation–emission–pH–sample. Four-way calibration-based four-way data not only provide higher sensitivity but also offers superior resolving power, quantitative analysis capabilities, and additional information [30,31,32].
In this work, an excitation–emission–pH multi-way fluorescence technique coupled with a third-order calibration method based on an alternating quadrilinear decomposition (AQLD) algorithm was proposed for the simultaneous determination of thiabendazole (TBZ) and carbaryl (CAR) in apples. The experimental scheme is shown in Figure 1. The analytical figures of merit (FOM), as well as the intra-day and inter-day precision, were calculated to evaluate the effectiveness of the method.
2. Materials and Methods
2.1. Chemicals and Reagents
Thiabendazole (>98%) was purchased from Aladdin (Shanghai, China), carbaryl (>98%) from Shanghai Xianding Biotechnology (Shanghai, China), and HPLC-grade methanol (≥99.9%) from Sigma (Shanghai, China). Ultrapure water was prepared by the Milli-Q water purification system (Millipore Ltd., Bedford, MA, USA). Due to the low solubility of TBZ and CAR in water, stock solutions (0.20 mg mL−1) were prepared in methanol. They were stored in brown volumetric flasks and kept in a refrigerator at 4 °C. All working solutions were prepared by appropriately diluting the stock solutions with ultrapure water (10.00 μg mL−1). All glassware was soaked in methanol before use and then washed with distilled water. Other chemicals were of analytical reagent grade. Appropriate amounts of Na2HPO4 and NaH2PO4 were mixed in ultrapure water to prepare three buffer solutions with pH values of 6.0, 7.0, and 8.0, respectively.
Apples were purchased from a local fruit store (Changsha, China). First, the apples were cut into pieces with a knife, and the samples were crushed with a blender. Then, 1.00 g of an apple puree sample was extracted with 10.00 mL of methanol by ultrasonic extraction at room temperature for 30 min. After sonication, the volume of the methanol extract was readjusted to 10.00 mL with fresh methanol to compensate for potential solvent loss during the process. The mixture was then centrifuged at 4000 rpm for 15 min. The supernatant was collected and stored in a refrigerator at 4 °C.
2.2. Instruments and Software
The experiment was performed, and the fluorescence spectra were obtained on an F-7000 fluorescence spectrometer (HITACHI, Tokyo, Japan), using a 10.00 mm quartz cell; excitation wavelength range: 230–350 nm; emission wavelength range: 270–450 nm; slit width: 5 nm; step size: 5 nm; voltage: 650 V; scan speed: 30,000 nm min−1.
The liquid chromatography analysis was performed on an LC-20AT system (Shimadzu, Kyoto, Japan) integrated with an RF-10Axl fluorescence detector (Shimadzu, Kyoto, Japan) and LC-solution software (ver. 1.20) for automated control and data acquisition. Separation was achieved using a reversed-phase WondaSil™ C18 column (5 μm, 200 mm × 4.6 mm, Shimadzu) coupled with a Gemini™ C18 guard column (Phenomenex, Torrance, CA, USA). The operating conditions were as follows: a flow rate of 1.00 mL/min, a column temperature of 40 °C, an injection volume of 20 μL, an excitation wavelength of 280 nm, and an emission wavelength of 340 nm. The mobile phase was methanol and water, and isocratic elution was used, with a ratio of methanol to water of 45:55 (v/v).
The operation and calculation of the algorithm were completed in the MATLAB (version 2009b) environment. The codes for the relevant algorithms can be obtained by contacting the corresponding authors, based on a reasonable request.
2.3. Sample Preparation
The calibration set consisted of seven samples, in which the concentrations of TBZ and CAR were uniformly designed using U7*(72). The preparation steps were as follows: the appropriate amount of TBZ and CAR reserve solutions was quantitatively transferred to a volumetric flask and added with 1.00 mL of the specific buffer and then ultrapure water to 10.00 mL. The prediction set consisted of three samples of real apples spiked with the following preparation steps: 100 μL of apple solution was pipetted into a 10.00 mL volumetric flask and added with 1.00 mL of specific buffer (Na2HPO4-NaH2PO4 were mixed with ultrapure water to prepare three buffer solutions with pH values of 6.0, 7.0, and 8.0), add the corresponding volume of TBZ and CAR solution according to Table S1, and finally fixed with added water to 10.00 mL. The three blank sample preparation steps were as follows: 100 μL of apple solution, 1.00 mL of specific buffer, and finally diluted with water to 10.00 mL. Details on the concentration design of the calibration and validation sets are provided in Table S1. Details on the concentration design of the calibration and validation sets are provided in Table S1.
2.4. Acquisition of Four-Way Data Array
In the four-way data array analysis, the above 13 samples were prepared into three groups and fixed to volume with Na2HPO4-NaH2PO4 buffer solutions of pH 6.0, 7.0, and 8.0, respectively. Then, for each sample, three fluorescence excitation–emission matrix data of size 25 × 37 will be measured and collected as a function of pH. Therefore, the measurement data of each sample can be composed into a fluorescence excitation–emission–pH (Ex-Em-pH) third-order tensor data of size 25 × 37 × 3. The third-order tensor data of these samples were arranged in sequence along the sample dimension to construct an Ex-Em-pH-sample four-way data array of size 25 × 37 × 3 × 13.
2.5. Theory
2.5.1. Quadrilinear Component Model
When the fluorescence intensity values of each sample are determined at the excitation wavelengths I, emission wavelengths J, and pH values K, each sample generates a third-order excitation–emission–pH tensor data XI×J×K. The third-order tensor data measured for all samples in the calibration set and the prediction set can be arranged to form an Ex–Em–pH–sample four-way data array XqI×J×K×L. I represents the number of excitation wavelengths, J represents the number of emission wavelengths, K represents the number of pH values, and L represents the number of samples. Each element xijkl in the four-way data array XqI×J×K×L can be expressed as follows [33]:
Among them, ain, bjn, ckn, and dln correspond to the excitation spectra matrix AI×N, the emission spectra matrix BJ×N, the pH profile matrix CK×N, and the relative concentration matrix DL×N, respectively; N is the number of components with signal response in the model; and eijkl is the element in the four-way residual array EqI×J×K×L.
2.5.2. Alternating Quadrilinear Decomposition (AQLD) Algorithm
The alternating quadrilinear decomposition (AQLD) algorithm is an extension of the ATLD algorithm for four-way calibration. This algorithm has the “third-order advantage”, which means it not only has the good properties of ATLD in terms of fast convergence and insensitivity to excess factors but also shows significant advantages in enhancing the ability of resolution and quantitative analysis. The AQLD algorithm obtains matrices A, B, C, and D by alternately minimizing the following four objective functions [33]:
Here, a(i), b(j), c(k), and d(l) represent the i-th row of A, the j-th row of B, the k-th row of C, and the l-th row of D, respectively; diag(a(i)), diag(b(j)), diag(c(k)), and diag(d(l)) denote diagonal matrices with elements equal to the elements of a(i), b(j), c(k), and d(l). The Khatri-Rao product is denoted by “⊙”.
2.5.3. Alternating Normalization Weighted Error (ANWE) Algorithm
The ANWE algorithm, introduced by Xia et al. in 2008 [34], is a representative trilinear algorithm. This method, based on the trilinear component model, constructs the following three equations by alternately minimizing the objective functions using least squares:
where
Here, DAA+, DBB+, and DCC+ can be regarded as normalized weighting factors. According to the objective function, the ANWE residual is minimized in an alternating manner.
2.5.4. Method Evaluation
The figures of merit (FOMs) are a set of important analytical parameters, including sensitivity (SEN), selectivity (SEL), limit of detection (LOD), and limit of quantification (LOQ), and are often considered an important indicator for evaluating and validating the accuracy of new methods [35,36,37]. SEN refers to the degree of change in response to a change in unit concentration or unit amount of the substance being tested, while SEL represents the ability of the method to accurately determine a particular analyte in a mixture without interference from other components. SEN and SEL can be calculated using the concept of net analyte signal, as shown in the following formula [38,39]:
The term “in” refers to the total signal generated by the target analyte at a concentration unit. The index “nn” refers to the (n, n) diagonal elements in the matrix. The parameters A, B, and C represent the normalized excitation matrix, emission matrix, and relative concentration matrix, respectively, which are obtained by decomposing the quadrilinear data using the AQLD algorithm. The subscript “exp” stands for the expected component, while “unx” represents the unexpected component. The symbol “+” stands for the generalized inverse of the matrix. The symbol “*” stands for the Hadamard product operation, that is, the multiplication of the corresponding elements of the matrix. I stands for the unit matrix of the corresponding dimension, that is, the square matrix with 1 on the main diagonal and 0 on the other elements.
LOD and LOQ are two other important performance indicators that can be calculated using the following methods [38]:
In the above formulas, h0 represents the leverage value of the blank sample; sc represents the standard deviation of the calibration concentration; and sx refers to the noise level of the instrument. The design of Formulas (14) and (15) takes into account the influence and propagation of various possible error sources on the predicted concentration error.
The root-mean-square error of prediction (RMSEP) is used to evaluate the performance criterion of different quantitative methods and is calculated as follows:
where P represents the number of predicted samples and yp and are the actual concentration of the target component in the pth sample and the corresponding estimated value, respectively. For the detailed mathematical theory and the derivation of the figures of merit (FOM), please refer to the previously published literature [40], which provides a more comprehensive and in-depth explanation.
3. Results and Discussion
3.1. Estimating the Number of Components
Whether the prediction results are accurate and reliable depends on the performance of the calibration model and the selection of the component number N. When processing three-way data arrays, we used the core consistency diagnostic (CORCONDIA) algorithm proposed by Bro and Kiers to determine the optimal number of components for unknown samples [41]. By observing the changes in core consistency (see Figure S3), when the number of groups used was less than three, the core consistency value obtained was close to 100%; however, when the number of groups exceeded three, the core consistency value quickly decreased to zero. Among the three factors, two factors can be attributed to the target analytes TBZ and CAR; the remaining factor is likely to represent matrix interference. Therefore, three was finally selected as the optimal number of components.
3.2. Spectral Characteristics
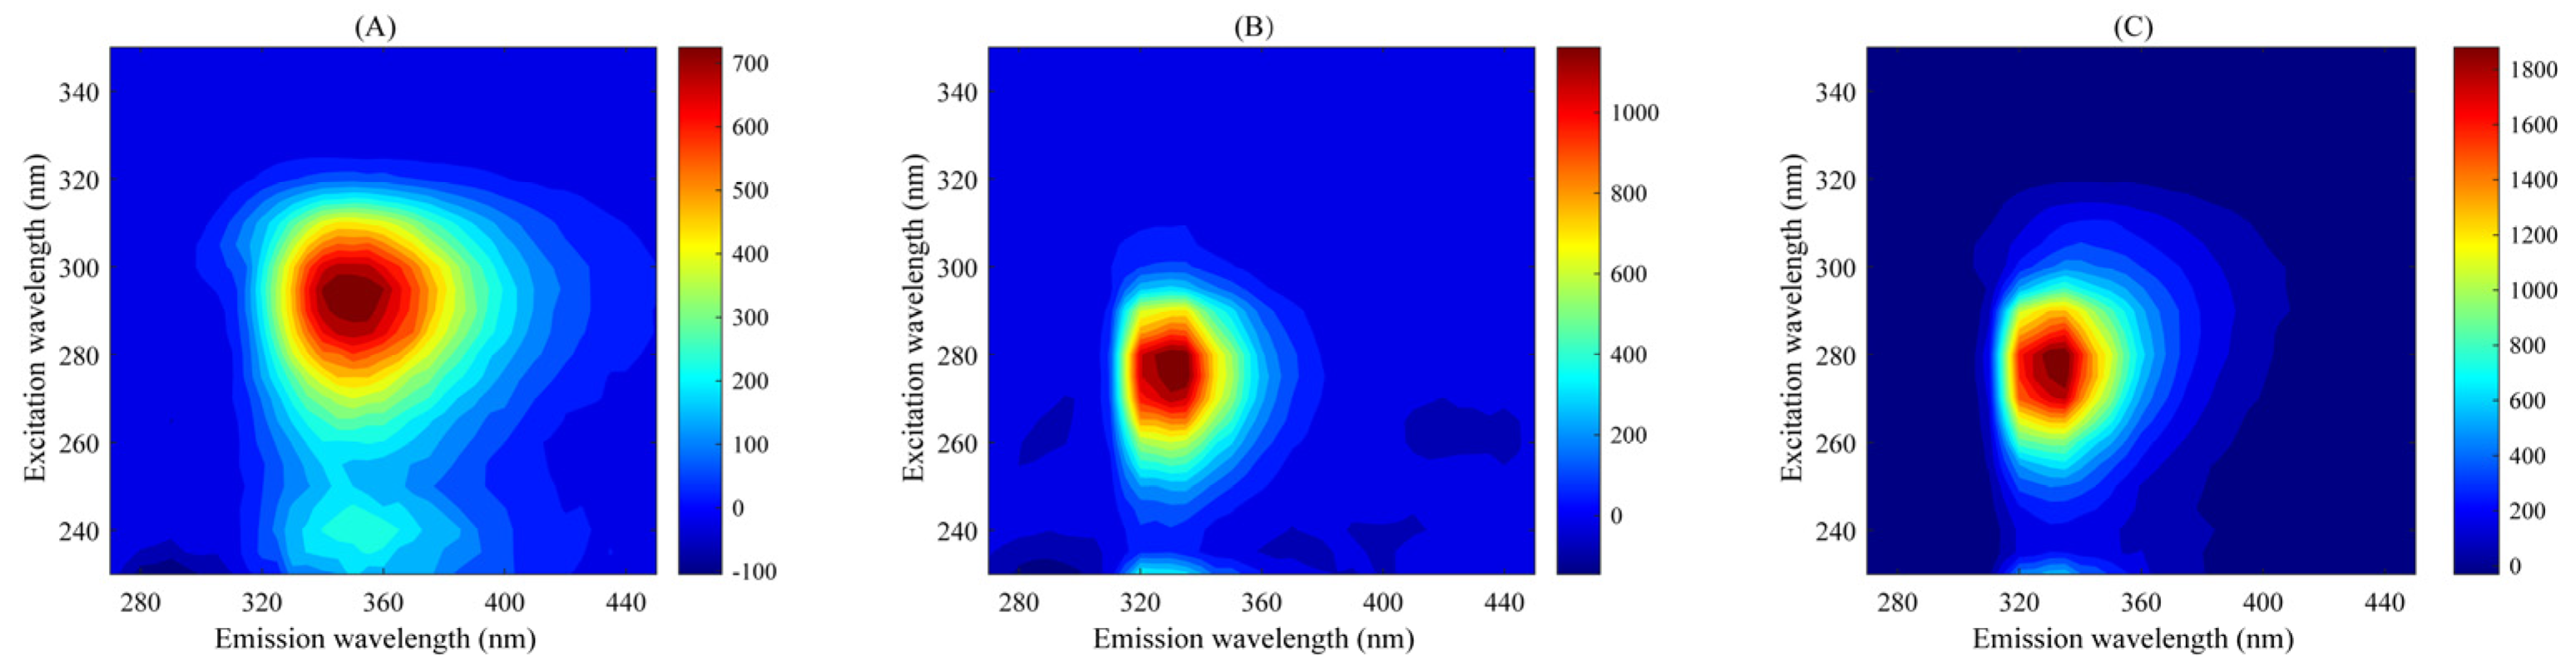
Figure S1 shows the Rayleigh scattering subtraction and fitting process of calibration sample C01 at pH 6.0. All sample fluorescence data are seriously affected by scattering effects (mainly Raman scattering and Rayleigh scattering); scattering must be subtracted before establishing the calibration model to ensure that the three-way data array has a strict trilinear structure. By measuring the blank solvent three times, the Raman scattering in the data can be subtracted, while the Rayleigh scattering is selected to be deducted and fitted by an interpolation method [42]. Figure 2 shows the EEM fluorescence spectra of TBZ, CAR, and the calibration sample C01 at pH 6.0. It can be seen that the excitation wavelength of the characteristic fluorescence peak of TBZ is 295 nm and the emission wavelength is 350 nm; the excitation wavelength of the characteristic fluorescence peak of CAR is 275 nm and the emission wavelength is 330 nm; the fluorescence peaks of the two analytes partially overlap. In the calibration sample at pH = 6.0, there is only one peak, EX/EM = 280/330. Due to the complexity of apples, there are usually many unknown response fluorescence components. In this case, it is difficult for traditional fluorescence analysis to directly achieve accurate quantification of TBZ and CAR in apples. Separating the target analyte and its background interference through pretreatment will face problems such as time-consuming, labor-intensive, and complex condition optimization processes. The fluorescence intensity of TBZ and CAR is influenced by pH, enabling the introduction of pH as an additional mode to construct a four-way EEM-pH-sample data array for four-way calibration, aiming to achieve better decomposition results and better analytical FOMs.
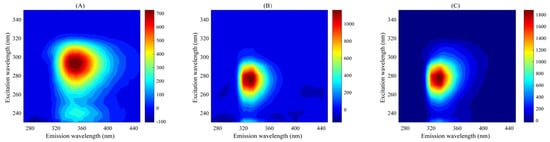
Figure 2.
Excitation–emission fluorescence spectra: (A) Thiabendazole (TBZ); (B) Carbaryl (CAR); (C) calibration sample C01 at pH 6.
3.3. Simultaneous Quantitative Analysis of TBZ and CAR in Apple
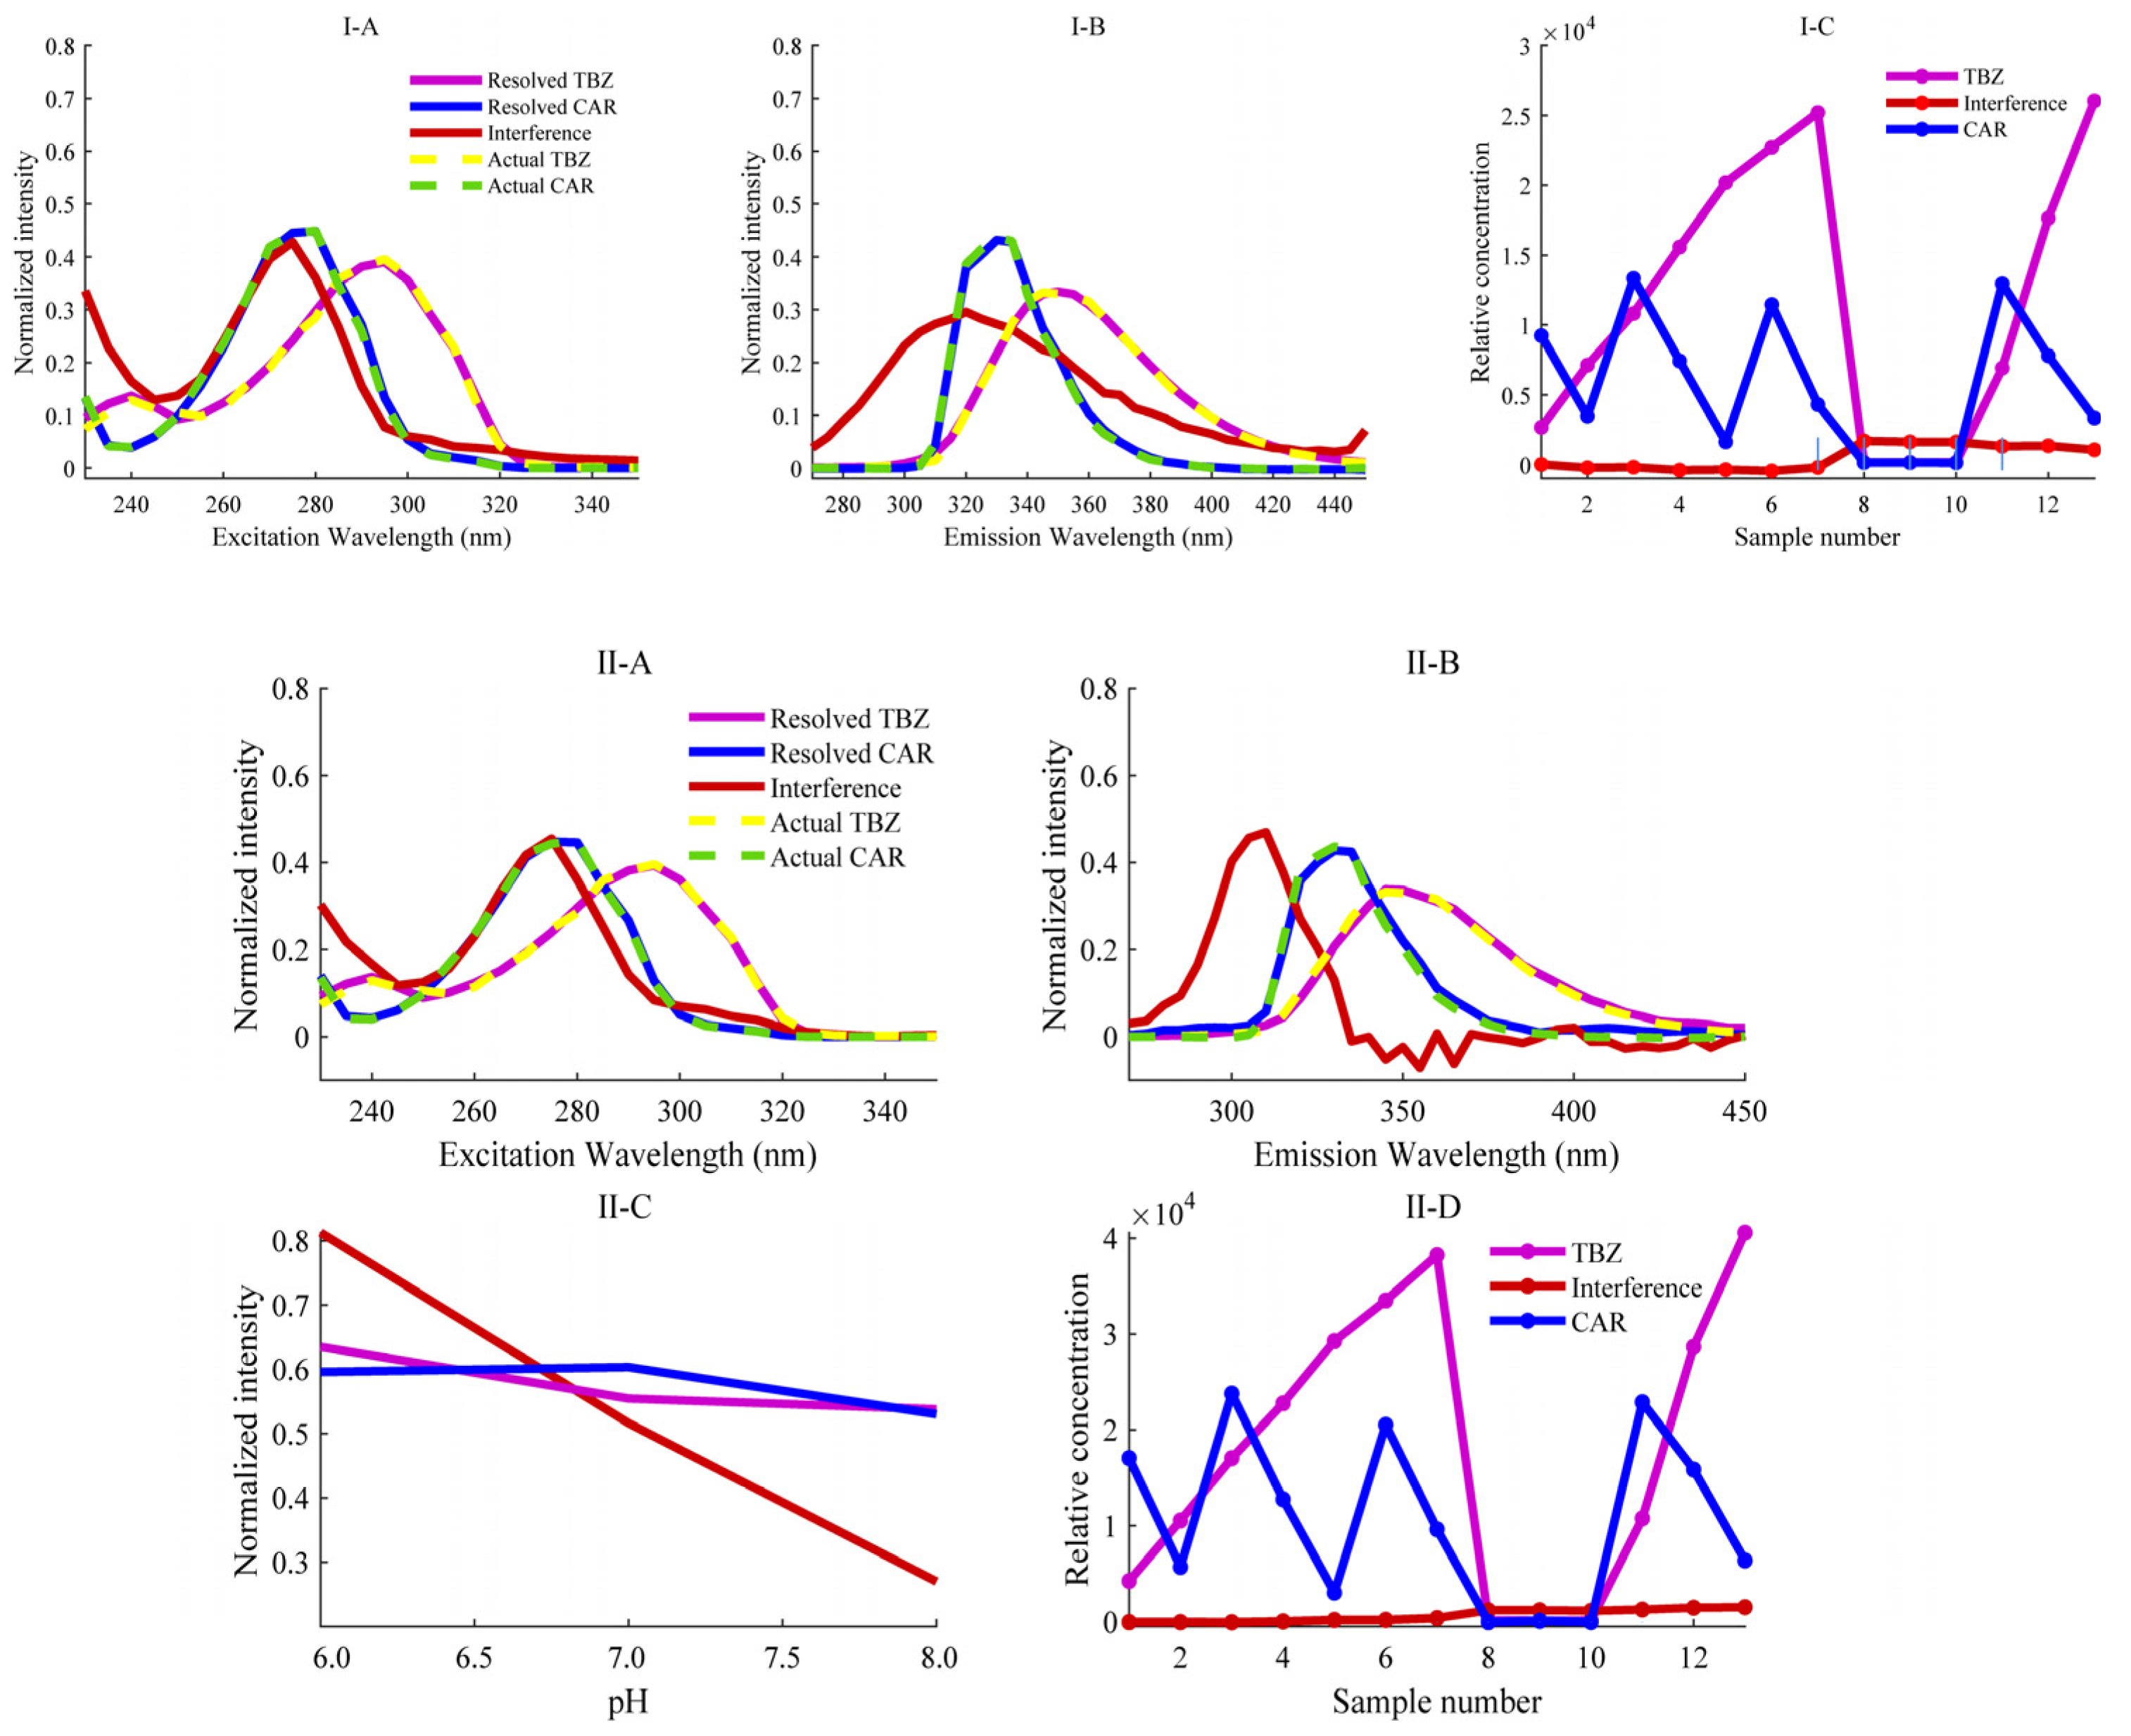
Through EEM fluorescence analysis, a set of samples including calibration samples, 3 real samples and 3 spiked predicted samples can be obtained as 13 (number of samples L) data matrices with a matrix size of 25 × 37 (excitation wavelength point number I × emission wavelength point number J). Each of the above samples is prepared in three groups, in which Na2HPO4-NaH2PO4 buffer solutions with pH values of 6.0, 7.0, and 8.0 were used in that order. Then, for each sample, three matrices of size 25 × 37 will be measured and collected as a function of pH. Therefore, each sample has a third-order EEM-pH data with the size of 25 × 37 × 3. Stacking these third-order tensor data along the sample mode can obtain a four-way EEM-pH-sample data array with the size of 25 × 37 × 3 × 13. The AQLD algorithm was then used to decompose the quadrilinear model when N = 3, and the decomposition results are shown in Figure 3(II). The excitation, emission, and pH profiles of each analyte obtained after decomposition are highly consistent with the true profiles of the pure analyte standards directly measured. Although the fluorescence spectra of TBZ and CAR are severely overlapped and coexisted with interference components fitted by the third component, the AQLD algorithm successfully extracts pure signal of each target analyte. The relative concentration of the third component in Figure 3(II-D) is essentially zero in the calibration sample but is higher in the prediction samples than in the calibration samples, indicating that this component represents the background interference component in apples. It is worth noting that the fluorescence excitation and emission spectra of the decomposed target analyte are smoother than the true curves of the pure analyte standards directly measured, indicating that the AQLD algorithm is robust to noise.
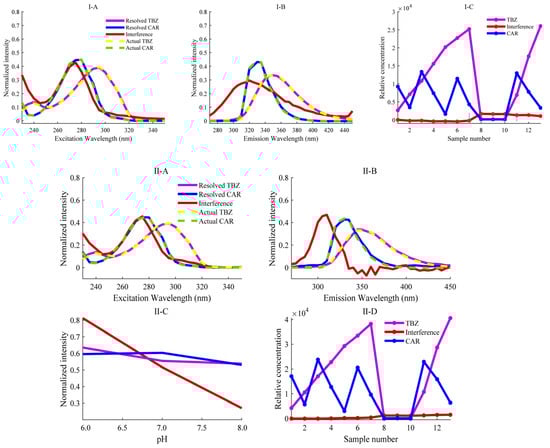
Figure 3.
Actual profiles (dotted lines) in each mode and resolved profiles obtained by the (I) ANWE and (II) AQLD algorithms. (I-A) normalized excitation profiles; (I-B) normalized emission profiles; (I-C) relative concentration profiles. (II-A) normalized excitation profiles, (II-B) normalized emission profiles, (II-C) normalized pH profiles and (II-D) relative concentration profiles.
The performance parameters of AQLD in seven calibration sets are shown in Table S2. The average spiked recoveries (mean ± standard deviation) of the calibration set were 97.9% ± 8.3% for TBZ and 101.7% ± 8.7% for CAR. The RRMSECs were 4.1% and 2.7% for TBZ and CAR, respectively, indicating that both substances showed satisfactory linear relationships. The predicted concentrations of the calibration samples were regressed against the actual concentrations, and the correlation coefficients (r) of TBZ and CAR were 0.9997 and 0.9991, respectively. Considering the complexity of the apple matrix, the quantitative results obtained, indicating a good linear relationship between TBZ and CAR in apple samples, are acceptable and can fully meet daily analysis needs. The results for spiked and predicted concentrations of TBZ and CAR, as well as their average spike recoveries in the prediction set, are shown in Table 1. The average spiked recoveries of TBZ and CAR in the three actual apple samples were 101.9% ± 1.4% and 98.4% ± 5.6%, respectively. Better spiking recoveries were achieved by the AQLD algorithm, which means it has great potential in the analysis of complex matrices. In summary, the proposed method can quantify the target analytes of interest in complex matrices.

Table 1.
Results of the spike concentrations, predicted concentrations, and average spike recoveries of two pesticides in apple samples determined using the AQLD- and ANWE-assisted EEM methods.
3.4. Analytical Figures of Merit
To evaluate the performance of the analytical method, a series of figures of merit, including SEN, SEL, LOD, and LOQ, were used [35,39]. The specific calculation results of these parameters are summarized in Table 2. When evaluating these results, the complexity of the sample matrix and the spectral overlap between the targets need to be taken into account. The complex background increases the difficulty of analysis, while the overlapping of peaks may lead to interferences, but the AQLD method still shows good performance. It proves its potential for application in complex systems. These results not only verify the reliability of the method but also provide an important reference for future applications in similar complex samples. The LOD of TBZ and CAR in the three actual samples are lower than 0.2 ng mL−1, and the LOD of CAR and TBZ in the proposed method are 0.1 mg kg−1 and 0.2 mg kg−1, respectively. In addition, the repeatability and reproducibility of the method were evaluated using intra-day and inter-day precision (expressed as RSD values). The final intra-day and inter-day precision results are listed in Table 2, where all RSD values were less than 4.57%, and the intra-day RSD values were typically smaller than the inter-day RSD values. The results are satisfactory, which shows that the AQLD-assisted EEM method has good repeatability and reproducibility.
Table 2.
Analytical figures of merit of TBZ and CAR using the AQLD and ANWE algorithms.
3.5. Comparison of Three-Way and Four-Way Calibration Methods
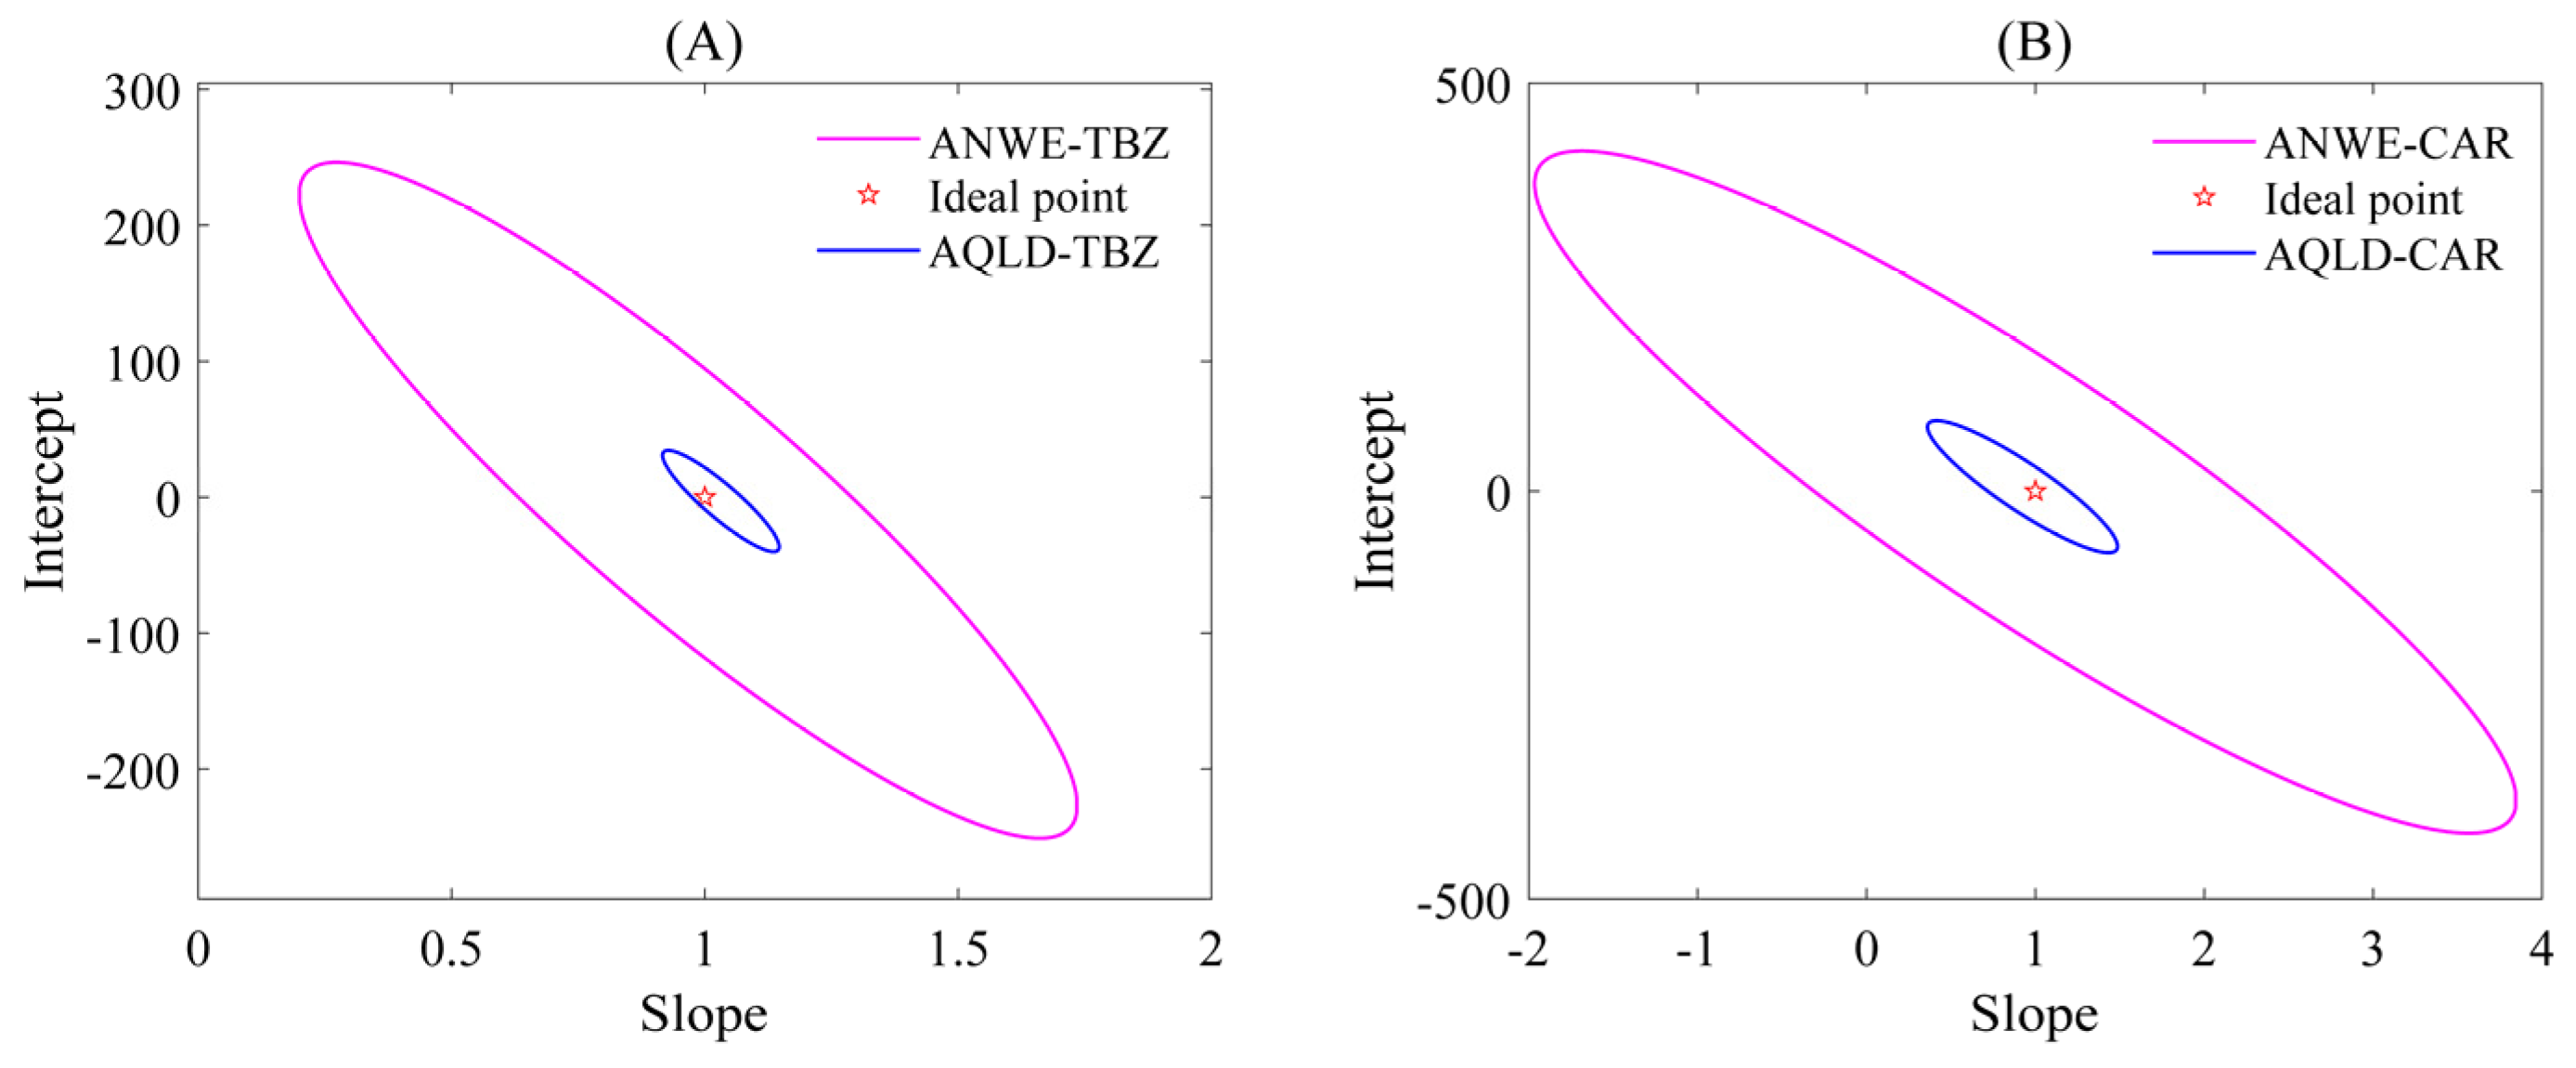
Two different chemometric methods, ANWE and AQLD, were used to analyze the fluorescence data arrays of TBZ and CAR, and the analysis results are shown in Figure 3 (the resolution results using ANWE at pH = 7.0 and 8.0 are shown in Table S2), respectively. The fluorescence spectra of the two analytes exhibited partial spectral overlap. However, both methods’ resolved profiles (solid lines) aligned closely with the true spectra of pure targets (dashed lines), confirming robust qualitative identification. To obtain the calibration curve, a linear regression was performed between the relative concentrations of the calibration set and the actual spiked concentrations. The response values of the predicted spiked samples were then used to calculate their true concentrations based on the calibration curve. The accuracy of the predicted concentrations was further assessed through statistical testing using the elliptical joint confidence region (EJCR). As shown in Figure 4, the pink ellipses represent the elliptical confidence region of ANWE for TBZ and CAR, respectively; the blue ellipses represent the elliptical confidence region of AQLD for TBZ and CAR, respectively. Under the 95% confidence region condition, (0,1) is the ideal point within the elliptical confidence region; that is, the slopes of the two methods approach 1 and the intercepts approach 0. In addition, the magnitude of the EJCR can be used to indicate the accuracy of the method. When the ideal point is contained within the ellipse, the smaller the ellipse is, the more accurate and reliable the method is. As can be seen from Figure 4, the ellipse range of AQLD-EEMs is slightly smaller than that of ANWE-EEMs and is closer to the ideal point. The quantitative results of ANWE and AQLD are summarized in Table 2. It can be seen that the spiked recoveries of TBZ and CAR obtained by AQLD were closer to 100%. Then, the FOMs of three actual samples were compared with ANWE and AQLD, and the results are shown in Table 2. It can be seen from the results that the SEN of AQLD is higher than that of ANWE. In actual samples, when there are other complex interfering matrices and the concentration of the target analyte is low, the AQLD method may be more conducive to obtaining accurate quantitative results.
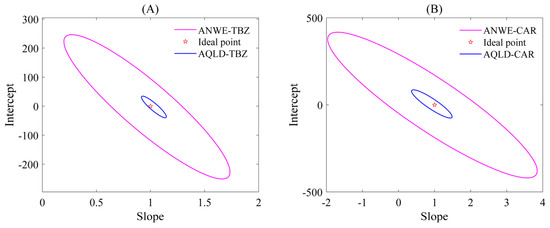
Figure 4.
EJCR plots of TBZ and CAR in the predicted samples using ANWE-EEMs and AQLD-EEMs for apple spiking. (A) EJCR plots of TBZ in the predicted samples; (B) EJCR plots of CAR in the predicted samples.
In addition, Table S3 summarizes various analytical methodologies for the quantification of TBZ and CAR across diverse matrices. In comparison to conventional techniques, the method developed in this study demonstrates distinct advantages, including significantly lower LOD, simplified sample preparation procedures, and user-friendly instrumentation. These features make the method effective and practical for accurately measuring TBZ and CAR, especially in complex samples like fruits.
3.6. HPLC-DAD Method for Confirmation
To ensure the reliability and accuracy of this method, we used the HPLC-FLD method to measure the same batch of samples. The specific chromatographic conditions are detailed in Section 2.2. Under specific elution conditions, CAR and TBZ can be completely and accurately separated. By comparing the TBZ and CAR contents measured by this method with those by the HPLC-FLD method, it was found that the results of the two methods were highly consistent. At the 95% confidence level, the t calculated values were all lower than 4.30 (Table S4), indicating that there was no significant difference in the determination results of the two methods, further verifying the reliability of this method and its applicability to the quantitative analysis of TBZ and CAR in apples. However, in order to achieve complete separation of TBZ, CAR, and background substances, the HPLC-FLD method requires a complex gradient elution procedure and a large amount of organic reagents, which to some extent limits its application. In contrast, the EEM method based on the AQLD method has more advantages in terms of condition optimization and ease of operation. Compared with the method proposed in this paper, the quantitative results of the two methods are similar, and the recoveries are both within an acceptable range.
4. Conclusions
This work proposes an alternating quadrilinear decomposition algorithm (AQLD) combined with a multi-way fluorescence technique for the simultaneous quantitative determination of TBZ and CAR in apples. The strategy accurately obtains qualitative and quantitative information from the analytes even in the presence of peak overlap and unknown interferences. A comparison of the results from the AQLD and ANWE algorithms reveals that AQLD exhibits a “third-order advantage”. Beyond its “second-order advantage”, AQLD also overcomes matrix effects, enhances the algorithm’s capability to resolve severely collinear data, and improves the sensitivity and selectivity of the method. The proposed strategy does not require complicated pre-processing steps, which is not only simple, fast, and time-saving but also provides satisfactory qualitative and quantitative analysis results and is expected to be used for the simultaneous determination of pesticides in a variety of fruits.
Supplementary Materials
The following supporting information can be downloaded at: https://www.mdpi.com/article/10.3390/chemosensors13030107/s1, Figure S1: Interpolation method to eliminate Rayleigh scattering in pH 6 for calibration sample C01: (A) original 2D fluorescence spectrum; (B) 2D fluorescence spectrogram after subtracting Rayleigh scattering; (C) 2D fluorescence spectrogram after using interpolation method; Figure S2: The resolved results using ANWE at pH (I) 7.0, (II) 8.0. (A) normalized excitation profiles; (B) normalized emission profiles; (C) relative concentration profiles; Figure S3: The number of components of the CORCONDIA algorithm; Figure S4: Excitation–emission matrix fluorescence spectrogram of calibration set C01 at different pH values. (A) pH = 6.0; (B) pH = 7.0; (C) pH = 8.0; Table S1: Concentration designs of TBZ and CAR for the calibration set and the validation set; Table S2: Quantitative analysis results of the prediction of TBZ and CAR calibration set in apples using the AQLD algorithm; Table S3: Comparison of the present work with other methods for the determination of TBZ and CAR in different matrices; Table S4: The concentration ranges of regression equations, coefficient of determination (R2) related, and t-tests to the AQLD-EEMs method and HPLC-FLD method, respectively; Table S5: Quantitative results of spiked prediction apple samples using the HPLC-FLD method. References [17,18,19,20,21,22,23,24,25,26,27] are cited in the Supplementary Materials.
Author Contributions
Conceptualization, methodology, data curation, writing—original draft, writing—review and editing: H.C.; conceptualization, methodology, funding acquisition: H.W.; methodology, writing—review and editing, validation, funding acquisition: T.W.; validation, investigation: X.W.; methodology, supervision, resources: R.Y. All authors have read and agreed to the published version of the manuscript.
Funding
This research was funded by the National Natural Science Foundation of China (No. 22174036) through Hailong Wu and (No. 22204049) through Tong Wang, and the key scientific research project of Hunan Provincial Department of Education (23A0028) through Tong Wang.
Institutional Review Board Statement
Not applicable.
Informed Consent Statement
Not applicable.
Data Availability Statement
Data are contained within the article and Supplementary Materials.
Conflicts of Interest
The authors declare no conflicts of interest.
References
- Goh, M.S.; Lam, S.D.; Yang, Y.; Naqiuddin, M.; Addis, S.N.K.; Yong, W.T.L.; Luang-In, V.; Sonne, C.; Ma, N.L. Omics technologies used in pesticide residue detection and mitigation in crop. J. Hazard. Mater. 2021, 420, 126624. [Google Scholar] [CrossRef] [PubMed]
- Rejman, K.; Górska-Warsewicz, H.; Kaczorowska, J.; Laskowski, W. Nutritional Significance of Fruit and Fruit Products in the Average Polish Diet. Nutrients 2021, 13, 2079. [Google Scholar] [CrossRef] [PubMed]
- Budetić, M.; Kopf, D.; Dandić, A.; Samardžić, M. Review of Characteristics and Analytical Methods for Determination of Thiabendazole. Molecules 2023, 28, 3926. [Google Scholar] [CrossRef] [PubMed]
- European Food Safety Authority. Revision of the review of the existing maximum residue levels for thiabendazole. EFSA J. 2016, 14, e04516. [Google Scholar] [CrossRef]
- Choi, S.-I.; Han, X.; Lee, S.-J.; Men, X.; Oh, G.; Lee, D.-S.; Lee, O.-H. Validation of an Analytical Method for the Determination of Thiabendazole in Various Food Matrices. Separations 2022, 9, 135. [Google Scholar] [CrossRef]
- Saquib, Q.; Siddiqui, M.A.; Ansari, S.M.; Alwathnani, H.A.; Musarrat, J.; Al-Khedhairy, A.A. Cytotoxicity and genotoxicity of methomyl, carbaryl, metalaxyl, and pendimethalin in human umbilical vein endothelial cells. J. Appl. Toxicol. JAT 2021, 41, 832–846. [Google Scholar] [CrossRef]
- Lerman, Y.; Hirshberg, A.; Shteger, Z. Organophosphate and carbamate pesticide poisoning: The usefulness of a computerized clinical information system. Am. J. Ind. Med. 1984, 6, 17–26. [Google Scholar] [CrossRef]
- Chen, Y.; Wu, H.-L.; Wang, T.; Sun, X.-D.; Liu, B.-B.; Chang, Y.-Y.; Chen, J.-C.; Ding, Y.-J.; Yu, R.-Q. Quantitative analysis of carbaryl and thiabendazole in complex matrices using excitation-emission fluorescence matrices with second-order calibration methods. Spectrochim. Acta Part A Mol. Biomol. Spectrosc. 2022, 264, 120267. [Google Scholar] [CrossRef]
- Ke, Z.; Zhu, Q.; Jiang, W.; Zhou, Y.; Zhang, M.; Jiang, M.; Hong, Q. Heterologous expression and exploration of the enzymatic properties of the carbaryl hydrolase CarH from a newly isolated carbaryl-degrading strain. Ecotoxicol. Environ. Saf. 2021, 224, 112666. [Google Scholar] [CrossRef]
- Khan, N.; Yaqub, G.; Hafeez, T.; Tariq, M. Assessment of Health Risk due to Pesticide Residues in Fruits, Vegetables, Soil, and Water. J. Chem. 2020, 2020, 5497952. [Google Scholar] [CrossRef]
- Kaczyński, P.; Rutkowska, E.; Jankowska, M.; Hrynko, I. Evaluation of pesticide residues in fruit from Poland and health risk assessment. Agric. Sci. 2013, 4, 106. [Google Scholar]
- Kowalska, G.; Kowalski, R. Pestycydy-zakres i ryzyko stosowania, korzyści i zagrożenia. Praca przeglądowa. Ann. Hortic. 2019, 29, 5–25. [Google Scholar] [CrossRef]
- Bempah, C.; Buah-Kwofie, A.; Denutsui, D.; Asomaning, J.; Asamoah, A. Monitoring of Pesticide Residues in Fruits and Vegetables and Related Health Risk Assessment in Kumasi Metropolis, Ghana. Res. J. Environ. Earth Sci. 2011, 3, 761–771. [Google Scholar]
- Narenderan, S.T.; Meyyanathan, S.N.; Babu, B. Review of pesticide residue analysis in fruits and vegetables. Pre-treatment, extraction and detection techniques. Food Res. Int. 2020, 133, 109141. [Google Scholar] [CrossRef]
- Xu, X.; Long, N.; Lv, J.; Wang, L.; Zhang, M.; Qi, X.; Zhang, L. Functionalized Multiwalled Carbon Nanotube as Dispersive Solid-Phase Extraction Materials Combined with High-Performance Liquid Chromatography for Thiabendazole Analysis in Environmental and Food Samples. Food Anal. Methods 2015, 9, 30–37. [Google Scholar] [CrossRef]
- Ferreira, J.A.; Ferreira, J.M.S.; Talamini, V.; Facco, J.d.F.; Rizzetti, T.M.; Prestes, O.D.; Adaime, M.B.; Zanella, R.; Bottoli, C.B.G. Determination of pesticides in coconut (Cocos nucifera Linn.) water and pulp using modified QuEChERS and LC–MS/MS. Food Chem. 2016, 213, 616–624. [Google Scholar] [CrossRef]
- Tomai, P.; Gentili, A.; Fanali, S.; Picó, Y. Multi-residue determination of organic micro-pollutants in river sediment by stir-disc solid phase extraction based on oxidized buckypaper. J. Chromatogr. A 2020, 1621, 461080. [Google Scholar] [CrossRef]
- Tanaka, A.; Fujimoto, Y. Gas chromatographic determination of thiabendazole in fruits as its methyl derivative. J. Chromatogr. A 1976, 117, 149–160. [Google Scholar] [CrossRef]
- Gionfriddo, E.; Gruszecka, D.; Li, X.; Pawliszyn, J. Direct-immersion SPME in soy milk for pesticide analysis at trace levels by means of a matrix-compatible coating. Talanta 2020, 211, 120746. [Google Scholar] [CrossRef]
- Alamgir Zaman Chowdhury, M.; Fakhruddin, A.N.M.; Nazrul Islam, M.; Moniruzzaman, M.; Gan, S.H.; Khorshed Alam, M. Detection of the residues of nineteen pesticides in fresh vegetable samples using gas chromatography–mass spectrometry. Food Control 2013, 34, 457–465. [Google Scholar] [CrossRef]
- Peng, X.-X.; Bao, G.-M.; Zhong, Y.-F.; Zhang, L.; Zeng, K.-B.; He, J.-X.; Xiao, W.; Xia, Y.-F.; Fan, Q.; Yuan, H.-Q. Highly sensitive and rapid detection of thiabendazole residues in oranges based on a luminescent Tb3+-functionalized MOF. Food Chem. 2021, 343, 128504. [Google Scholar] [CrossRef]
- Fan, L.; Tong, C.; Cao, Y.; Long, R.; Wei, Q.; Wang, F.; Tong, X.; Shi, S.; Guo, Y. Highly specific esterase activated AIE plus ESIPT probe for sensitive ratiometric detection of carbaryl. Talanta 2022, 246, 123517. [Google Scholar] [CrossRef] [PubMed]
- Li, H.; Mehedi Hassan, M.; Wang, J.; Wei, W.; Zou, M.; Ouyang, Q.; Chen, Q. Investigation of nonlinear relationship of surface enhanced Raman scattering signal for robust prediction of thiabendazole in apple. Food Chem. 2021, 339, 127843. [Google Scholar] [CrossRef] [PubMed]
- Cheng, F.; Liao, X.; Huang, Z.; Xu, L.; Zhou, Y.; Zhang, X. Highly Sensitive Detection of Thiabendazole Residues in Food Samples Based on Multiwall Carbon Nanotubes Decorated Two-Dimensional Layered Molybdenum Disulfide. Food Anal. Methods 2020, 13, 811–822. [Google Scholar] [CrossRef]
- Dorozhko, E.V.; Gashevskay, A.S.; Korotkova, E.I.; Barek, J.; Vyskocil, V.; Eremin, S.A.; Galunin, E.V.; Saqib, M. A copper nanoparticle-based electrochemical immunosensor for carbaryl detection. Talanta 2021, 228, 122174. [Google Scholar] [CrossRef]
- Zhu, D.; Ren, X.; Wei, L.; Cao, X.; Ge, Y.; Liu, H.; Li, J. Collaborative analysis on difference of apple fruits flavour using electronic nose and electronic tongue. Sci. Hortic. 2020, 260, 108879. [Google Scholar] [CrossRef]
- Slavin, J.L.; Lloyd, B. Health benefits of fruits and vegetables. Adv. Nutr. 2012, 3, 506–516. [Google Scholar] [CrossRef]
- Muroski, A.R.; Booksh, K.S.; Myrick, M.J.A.C. Single-measurement excitation/emission matrix spectrofluorometer for determination of hydrocarbons in ocean water. 1. Instrumentation and background correction. Anal. Chem. 1996, 68, 3534–3538. [Google Scholar] [CrossRef]
- Booksh, K.S.; Muroski, A.R.; Myrick, M.J.A.C. Single-measurement excitation/emission matrix spectrofluorometer for determination of hydrocarbons in ocean water. 2. Calibration and quantitation of naphthalene and styrene. Anal. Chem. 1996, 68, 3539–3544. [Google Scholar] [CrossRef]
- Olivieri, A.C. Analytical Advantages of Multivariate Data Processing. One, Two, Three, Infinity? Anal. Chem. 2008, 80, 5713–5720. [Google Scholar] [CrossRef]
- Wu, H.-L.; Kang, C.; Li, Y.; Yu, R.-Q. Chapter 4—Practical Analytical Applications of Multiway Calibration Methods Based on Alternating Multilinear Decomposition. In Data Handling in Science and Technology; de la Peña, A.M., Goicoechea, H.C., Escandar, G.M., Olivieri, A.C., Eds.; Elsevier: Amsterdam, The Netherlands, 2015; Volume 29, pp. 167–246. [Google Scholar]
- Kang, C.; Wu, H.-L.; Yu, Y.-J.; Liu, Y.-J.; Zhang, S.-R.; Zhang, X.-H.; Yu, R.-Q. An alternative quadrilinear decomposition algorithm for four-way calibration with application to analysis of four-way fluorescence excitation–emission–pH data array. Anal. Chim. Acta 2013, 758, 45–57. [Google Scholar] [CrossRef] [PubMed]
- Qing, X.-D.; Wu, H.-L.; Yan, X.-F.; Li, Y.; Ouyang, L.-Q.; Nie, C.-C.; Yu, R.-Q. Development of a novel alternating quadrilinear decomposition algorithm for the kinetic analysis of four-way room-temperature phosphorescence data. Chemom. Intell. Lab. Syst. 2014, 132, 8–17. [Google Scholar] [CrossRef]
- Xia, A.L.; Wu, H.-L.; Zhu, S.-H.; Han, Q.-J.; Zhang, Y.; Yu, R.-Q. Determination of Psoralen in Human Plasma Using Excitation-Emission Matrix Fluorescence Coupled to Second-Order Calibration. Anal. Sci. 2008, 24, 1171–1176. [Google Scholar] [CrossRef]
- Olivieri, A.C.; Faber, N.M. Standard error of prediction in parallel factor analysis of three-way data. Chemom. Intell. Lab. Syst. 2004, 70, 75–82. [Google Scholar] [CrossRef]
- Olivieri, A.C. Computing Sensitivity and Selectivity in Parallel Factor Analysis and Related Multiway Techniques: The Need for Further Developments in Net Analyte Signal Theory. Anal. Chem. 2005, 77, 4936–4946. [Google Scholar] [CrossRef]
- Olivieri, A.C.; Faber, N.M. A closed-form expression for computing the sensitivity in second-order bilinear calibration. J. Chemom. 2005, 19, 583–592. [Google Scholar] [CrossRef]
- Olivieri, A.C.; Faber, K. New Developments for the Sensitivity Estimation in Four-Way Calibration with the Quadrilinear Parallel Factor Model. Anal. Chem. 2012, 84, 186–193. [Google Scholar] [CrossRef]
- Messick, N.J.; Kalivas, J.H.; Lang, P.M. Selectivity and Related Measures for nth-Order Data. Anal. Chem. 1996, 68, 1572–1579. [Google Scholar] [CrossRef]
- Olivieri, A.C. Analytical Figures of Merit: From Univariate to Multiway Calibration. Chem. Rev. 2014, 114, 5358–5378. [Google Scholar] [CrossRef]
- Bro, R.; Kiers, H.A.L. A new efficient method for determining the number of components in PARAFAC models. J. Chemom. 2003, 17, 274–286. [Google Scholar] [CrossRef]
- Bahram, M.; Bro, R.; Stedmon, C.; Afkhami, A. Handling of Rayleigh and Raman scatter for PARAFAC modeling of fluorescence data using interpolation. J. Chemom. 2006, 20, 99–105. [Google Scholar] [CrossRef]

Disclaimer/Publisher’s Note: The statements, opinions and data contained in all publications are solely those of the individual author(s) and contributor(s) and not of MDPI and/or the editor(s). MDPI and/or the editor(s) disclaim responsibility for any injury to people or property resulting from any ideas, methods, instructions or products referred to in the content. |
© 2025 by the authors. Licensee MDPI, Basel, Switzerland. This article is an open access article distributed under the terms and conditions of the Creative Commons Attribution (CC BY) license (https://creativecommons.org/licenses/by/4.0/).