Abstract
This study aimed to quantify the bitter–astringent interactive perceived intensity (BAIPI) of green tea based on the Weber–Fechner law by two-alternative forced choice test. Caffeine, (-)-epigallocatechin-3-gallate (EGCG), and Quercetin-3-o-rutinoside (Que-rut) were identified as the key bitter–astringent compounds. Then, BAIPI values were assessed based on the concentration ratios and ranges of caffeine, EGCG, and Que-rut in green tea according to the Weber–Fechner law. The BAIPI values were further fitted to a logarithmic curve: . The constant terms ,, and were derived from the ratio of caffeine to EGCG, as the slope and X-intercept of the curves correlated exponentially with this ratio. The initial BAIPI value (IV) was calculated as: . Validation showed a standard error of 1.5865 between estimated and actual BAIPI values. This method enables the estimation of bitter–astringent intensity in green tea by analyzing the concentrations of caffeine, EGCG, and Que-rut.
1. Introduction
Tea, as the most widely consumed beverage globally following water, has unique flavor profiles [1]. Tea’s distinct flavor arises from secondary metabolites—flavonoids, phenolic acids, and alkaloids—in tender leaves, which also contribute to bitterness and astringency [2,3]. Green tea, as a non-fermented tea, retains the highest concentration of these secondary metabolites due to manufacturing process, thereby preserving more significant bitterness and astringency, which are the key to affect the choice of consumers [2,4,5].
Bitterness is a basic taste produced by the activation of taste receptors encoded by the TAS2Rs gene when the bitter tastants in tea entering the oral cavity [2,6]. The compounds responsible for bitterness in green tea are mainly caffeine and catechins [2], which can enhance the umami taste of green tea caused by theanine [7] and relieve the sweetness of desserts when drinking green tea [4,8]. Astringency refers to a characteristic drying, rough, or puckery sensation in the oral cavity that arises from two distinct mechanisms: (1) the physicochemical interaction between polyphenols and salivary proteins/mucosal pellicle proteins, leading to precipitation and reduced oral lubrication [2,5,9]; or (2) a trigeminal nerve-mediated sensation triggered when astringents activate G protein-coupled receptor signaling pathways in trigeminal ganglion cells [10]. This complex sensory phenomenon involves both physical protein–tannin interactions and neural sensory transduction pathways. Astringency enhances the sweet aftertaste (Huigan) of tea [5] and influences retronasal aroma perception [11]. Additionally, the bitter and astringent perception of consumers varied due to genetic differences in taste receptors and receptor expression [6]. Therefore, it is urgent to develop a standardized quantitative scale for the intensity of bitterness and astringency in green tea to help consumers choose products that suit their taste preferences.
Previous studies have employed two primary approaches to measure bitterness and astringency in green tea: conventional and intelligent sensory evaluation. Conventional sensory evaluation is to assess the level of bitterness and astringency through subjects rating samples using standardized taste solutions as references [8,12,13,14]. However, variability in reference solution concentrations across studies prevents unified intensity standards. Intelligent sensory evaluation is mainly to quantify bitter and astringent intensity through electrochemical [15], optical [16], mass [5], and biological [17] sensing techniques based on the reaction of taste compounds with the corresponding receptors or saliva in the oral cavity. However, it fails to directly link instrumental signals to human perceptual experience [18,19].
The Weber–Fechner law is central to the field of psychophysics in quantifying the internal perceptual intensity of external stimuli, specifically that the psychological perceptual intensity of a stimulus is proportional to the logarithm of the physical intensity by experimental verification [20]. At present, there were many studies to assess the internal psychological perception of taste stimuli based on the Weber–Fechner law. The sweetness index [14] and sourness index [21] of five sugars and acids were determined by converting absolute thresholds and difference thresholds obtained through triangle tests and paired comparisons based on the Weber–Fechner law. The sweetness of sucrose under different citric acid backgrounds and the sourness of citric acid under different sucrose backgrounds were calculated by fitting absolute threshold and weber fraction equations, respectively [22]. A quantitative equation for overall umami strength in foods and condiments was also defined by sensory evaluation based on the Weber–Fechner law [23]. Therefore, the perceived intensity of taste stimuli could be deduced according to the content of taste compounds. The content range and ratio of bitter and astringent compounds in green tea is defined. If the relationship between the content of bitter and astringent compounds in green tea and the perceived intensity of taste is derived based on the Weber–Fechner law, the perceived intensity of bitterness and astringency in green tea can be quantified under uniform criteria.
Additionally, the bitter and astringent perception of green tea is often inseparable for consumers [17]. Catechins have both bitterness and astringency, and caffeine and (-)-epigallocatechin-3-gallate (EGCG; the most abundant catechin in green tea) can strengthen each other’s bitterness and astringency [7]. Flavonol glycosides contributed astringency to green tea and can also increase the bitterness of caffeine [24]. Moreover, a subregion within the insular cortex of the cerebral cortex exhibited responsiveness to both astringent and bitter stimuli, indicating that these inputs underwent neural information integration in the human brain to promote people to produce bitter–astringent interactive perception [25]. Therefore, the overall perceived intensity of bitterness and astringency produced by people after drinking green tea was defined as bitter–astringent interactive perceived intensity (BAIPI) in this study. To establish a universal quantification scale for BAIPI, this study is (1) to determine the concentration of bitter and astringent compounds in green tea; and then, (2) to quantify the BAIPI values of green tea and fit curves based on the Weber–Fechner law according to the concentration; and next, (3) to verify the applicability of the BAIPI quantification curve by green tea samples in the market.
2. Materials and Methods
2.1. Chemicals
The standards (alkaloids, gallic acid (GA), catechins, flavonol glycosides, and organic acids) for bitter and astringent compounds analysis, other taste indicators analysis, and sensory panel test of green tea were purchased from GlpBio Co., Ltd. (Montclair, NJ, USA). The mobile phase components for high performance liquid chromatography (HPLC) analysis consisted of formic acid (Macklin, Shanghai, China) and acetonitrile (Aladdin, Shanghai, China). Ultrapure water used in the experiments was produced by an AWL-6000-M purification system (Aquapro, FL, USA). For analysis of other taste indicators in green tea, we used a Total Carbohydrate Assay Kit (Solarbio, Beijing, China) and Amino Acid Assay Kit (Ninhydrin colorimetry method, Yuanye, Shanghai, China).
2.2. Green Tea Collection and Sample Preparation
Green tea samples were purchased from different tea factories, and the specific information is shown in Table 1. From the complete collection, we selected 11 representative green tea samples as model-samples (encompassing all fixation methods; indicated in bold italic font), while the remaining 32 samples served as the validation set. The tea leaves were crushed into particles (0.83 mm < the particle size of tea leaves ≤ 1 mm). Precisely 1 g of processed tea particles was combined with 100 mL of ultrapure water (maintained at 95 ± 1 °C) in a standardized 440 mL tea bowl. The mixture was homogenized using a DF-101S magnetic stirring system (Lichen Instrument, Shanghai, China) at a constant 300 rpm for exactly 3 min to produce the tea infusion.

Table 1.
Data on the green tea samples used.
2.3. Bitter and Astringent Compounds Analysis of Green Tea
The bitter and astringent compounds of green tea were determined by HPLC (Waters 1525; Milford, MA, USA) equipped with a 250 × 4.6 mm, 5 μm, Agilent 5 TC-C18 (2) column (CA, USA). All samples were filtered through 0.45 µm filters (mixed cellulose, Navigator, Tianjin, China) prior to analysis by HPLC. The determination method of alkaloids, GA, and catechins was adapted from Huang et al. [26] with modifications. A gradient elution with 0.1% formic acid as mobile phase A and acetonitrile as mobile phase B at a flow rate of 1 mL/min was performed. The gradient was carried out as follows: initial 5% B for 2 min, linear change to 13% B for 6 min, linear change to 28% B for 14 min, linear change to 95% B for 3 min, and finally linear change to 5% B for 5 min. Detection was performed at 278 nm using a Waters 2489 UV-Visible detector (Milford, MA, USA).
Flavonol glycosides were determined according to a modified method from Liu et al. [27], utilizing the following mobile phases: 0.15% formic acid in 3% acetonitrile/water (mobile phase A) and 0.15% formic acid in 30% acetonitrile/water (mobile phase B). The gradient elution (1 mL/min) was carried out as follows: 0% B, 0–20 min; 0–50% B, 20–28 min; 50–100% B, 28–47 min; 100% B, 47–55 min; 0–100% B, 55–58 min. Detection wavelength was set at 360 nm. The specific detection parameters for all target compounds are shown in Table 2.
Table 2.
The detection parameters of bitter and astringent compounds.
2.4. Matrix Composition Analysis of Green Tea
In addition to bitterness and astringency, the basic taste profile of green tea comprises sweetness, umami, and sourness. Accordingly, the matrix composition of the bitter–astringent simulation solution was designed to reflect the concentrations of sweet, umami, and sour compounds typically found in green tea. Total carbohydrate (TC) and total free amino acid (TFAA) were measured using commercial assay kits (UV-Vis spectrophotometry, WFJ 7200; Unico, Shanghai, China) at absorbance wavelengths of 540 nm and 570 nm, respectively. These metrics represent the collective sweetness (TC) and umami (TFAA) contributions in green tea. Organic acids, representing sourness, were quantified via HPLC following the method of Yu et al. [28]. Sample pretreatment and HPLC conditions aligned with Section 2.3. Detailed analytical parameters are provided in Table 3. Sucrose, theanine, and citric acid were selected as the primary matrix components for the simulation solution, as they are the most abundant sugar, amino acid, and organic acid in green tea, respectively [26,29]. Their concentrations corresponding to the levels of TC, TFAA, and total organic acids in green tea (shown in Table 4).
Table 3.
The detection parameters of other taste indicators.
Table 4.
The concentration of the other taste indicators in all green tea samples.
2.5. Sensory Panel
A total of 20 experienced subjects (9 males and 11 females, from 18 to 28 years old) passed the screening and training about the test rules following an explanation of the study’s purpose. Subjects were initially recruited based on surveys of health (i.e., food allergies), interest, expressiveness, availability, attitudes toward green tea, and frequency of green tea consumption [30]. All subjects exhibited favorable attitudes toward green tea consumption and had a minimum of three years’ experience in regular tea tasting, with specific expertise in green tea sensory evaluation protocols. Subsequently, screening tests to assess their sensory acuity were carried out [31]. The triangle test and ranking test of caffeine and EGCG solutions were employed to assess subjects’ discrimination ability for bitter and astringent sensations, with a required accuracy rate >80%. The above test was conducted in two sessions, each lasting about two hours. Following the screening process, a two-week training program was subsequently conducted. Subjects underwent daily training consisting of three sets of 2-AFC tests with caffeine and EGCG solutions at concentration ratios of 0.5, 0.75, and 1 (targeting identification of the more astringent and bitter solution). The caffeine concentration range was 150–310 mg/L with a gradient interval of 120%, 115%, 110%, 105%, and 100%. All subjects ultimately achieved >80% correct identification rates. All subjects were instructed not to have cold symptoms, smoke, or eat for at least a half hour prior to the test.
2.6. Composition Determination of Simulation Solution
The composition of simulation solutions 1–7 is described in Section 3.1.3 in detail, and the concentration of compounds in simulation solution were consistent with those in the corresponding model-samples. A total of 7 groups of simulation solutions containing different bitter and astringent compounds were tested with 11 types of green tea based on the two-alternative forced choice (2-AFC) test. The entire testing procedure spanned 11 days, with one sample analyzed per day, and each evaluation session was completed within a 3-h time frame. The specific steps to determine the composition of simulation solution were as follows:
Step 1. The selected green tea sample was provided to the subjects in pairs with the corresponding simulation solutions 1–7 in a random order with covers at room temperature (25 ± 1 °C). Samples were divided into 20 mL in 50 mL cups marked with three random numbers.
Step 2. Subjects with a nose clip were instructed to take a small sip of the sample with their eyes closed after removing the covers, hold it in the mouth for 7–8 s and spit it out. Completing the evaluation of one sample, subjects were required to gargle with ultrapure water and have some unsalted biscuits to relieve taste bud stress for 15 min.
Step 3. The next sample was evaluated after rinsing the mouth with ultrapure water. Subjects were asked to write down the number of the sample with stronger BAIPI following the two samples tasting.
Step 4. When 11 green tea samples had been tested, it was necessary to record the number, denoted as m, at which the selection rates of the simulation solution are below 75% and above 25% [32]. The composition of the simulation solution with the largest m value was optimal. When multiple m maxima were the same, the composition of the simulation solution with the fewest compounds was optimal.
2.7. BAIPI Quantification Curves Establishment
The BAIPI quantification curves were grouped according to the compound ratios selected in Section 2.6 (Table 5). Each recombinant solution group maintained the corresponding compound concentration ratios and ranges specified in Table 6. The recombinant solution matrix contained sucrose, theanine, and citric acid at concentrations matching the average levels of total carbohydrates (TC), total free amino acids (TFAA), and total organic acids in the model samples (Table 4). Within each group, caffeine served as the independent variable (x) for establishing the BAIPI quantification curves. And the specific steps were as follows:
Table 5.
The ratio and the close ratio of caffeine, EGCG, and Que-rut in model-samples used for grouping.
Table 6.
The grouping basis and limitation of the BAIPI quantification curve of green tea.
Step 1. The lowest caffeine concentration in the selected group was used as the initial concentration, and the corresponding BAIPI value was defined as 1.
Step 2. Based on the initial concentration of caffeine, the first recombinant solution was prepared according to the proportion of compounds in this group. Subsequently, a series of recombinant solutions with varying compound concentrations within this group were established based on the lg11 increment.
Step 3. The first recombinant solution was provided to the subjects in pairs with other recombinant solutions. The tasting sequence between the two reconstituted solutions was randomized. With the first reconstituted solution held constant, the other recombinant solutions were paired with it for comparative tasting, with their presentation order following an ascending gradient of compound concentration.
Step 4. Tasting, rinsing, and recording followed Section 2.6 protocols. Until the selection rates, the first recombinant solution was less than or equal to 25% comparing with the nth recombinant solution, and the caffeine content in the nth recombinant solution was recorded as Cn.
Step 5. The BAIPI value was increased by one unit, and the caffeine concentration, denoted as C, corresponding to the updated BAIPI value was calculated according to this formula:
where Cn−1 was the concentration of caffeine in the n − 1th recombinant solution.
Step 6. The caffeine concentration C calculated in Step 5 was used as the initial concentration of the next round. Sequentially, subjects were instructed to advance to Steps 2 to 6 if all compounds were within the concentration range or to Step 7 otherwise.
Step 7. The initial caffeine concentration and the caffeine concentration C calculated in each round were recorded as the x variable, and the BAIPI value was recorded as the y variable. Subsequently, the curve was fitted for this group.
After establishing the BAIPI quantification curve for a given group, Steps 1 to 7 were repeated for the next group. In the initial group, participants performed duplicate tests—both with and without nose clips. Results indicated that nasal occlusion had no significant effect on BAIPI curve establishment (p > 0.05). Consequently, we omitted nose clip usage in following trials.
2.8. Initial BAIPI Values Calibration
The group of BAIPI quantification curves corresponding to the initial compound with the lowest dose-over-threshold (DoT) values was designated as ‘Group r‘. The DoT value represents the ratio of a compound’s concentration to its corresponding perception threshold [24]. The compound concentrations associated with BAIPI values within this group was used as references to calibrate the initial BAIPI values of other groups by 2-AFC tests. The specific steps were as follows:
Step 1. A series of recombinant solutions was prepared at the compound concentrations corresponding to the BAIPI values of ‘Group r’.
Step 2. The recombinant solution described in Step 1 was provided to the subjects one by one in ascending order of BAIPI values. Concurrently, the first recombinant solution from each group (as described in Section 2.7) was also provided to subjects as a comparison sample. These solutions were presented in ascending order according to their initial compound DoT values.
Step 3. Tasting, rinsing, and recording followed Section 2.6 protocols. The BAIPI value of the recombinant solution in ‘Group r’ with the selection rates exceeding 25% but below 75% was the initial BAIPI value of the other group in the pairing comparison.
Step 4. When the selection rate remained at 25% or lower following the tests of all recombinant solutions in ‘Group r’, the group with the highest initial BAIPI value was chosen as a new ‘Group r’. Steps 1 to 4 were repeated until the initial BAIPI values standardization was completed across all groups.
2.9. Direct Assessment for BAIPI Values
The concentration of bitter and astringent compounds corresponding to BAPI values at certain intervals was used as the scale (the specific scale was described in Section 3.4). Subjects underwent a three-week training period to become acquainted with the varying levels of bitter and astringent intensity. Subsequently, a 9-point intensity scale (1 = lowest, 9 = highest) was used for direct evaluation. The specific steps of providing samples, tasting, and gargling were carried out according to Section 2.6.
3. Results
3.1. Bitter–Astringent Simulation Solution of Green Tea
3.1.1. Bitter Compounds Analysis of Green Tea
Figure 1 shows the concentration of bitter and astringent compounds in green tea, as detected by HPLC, along with their corresponding bitter (red dashed line) and astringent (blue dotted line) perceived thresholds. Bitterness in green tea is mainly caused by alkaloids and catechins [2]. The primary alkaloids in green tea are caffeine, theobromine, and theophylline. Caffeine accounts for over 90% of the total alkaloid content and was the only alkaloid exceeding the bitter threshold (Figure 1A). In Figure 1B,C, the levels of theobromine and theophylline in green tea samples were very low. Theophylline’s threshold was not found, but quantitative structure-activity relationship analysis suggests its content was below the threshold [33,34].
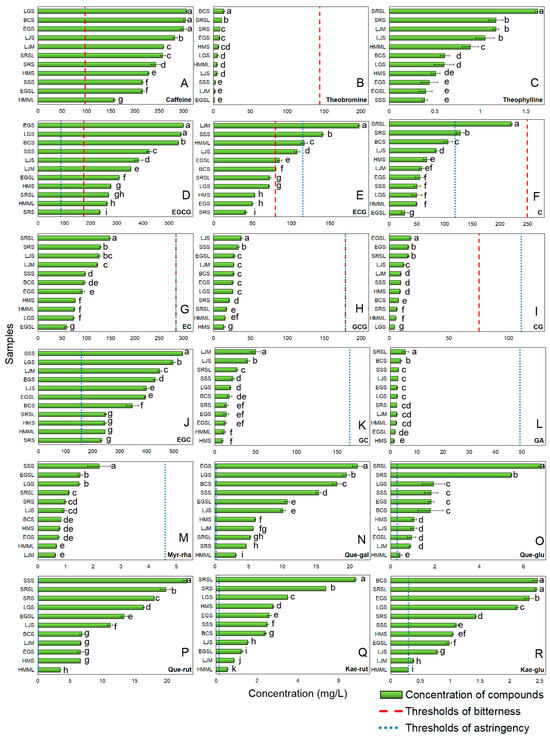
Figure 1.
The concentration and perceived thresholds of bitter and astringent compounds (A) Caffeine; (B) Theobromine; (C) Theophylline; (D) EGCG; (E) ECG; (F) C; (G) EC; (H) GCG; (I) CG; (J) EGC; (K) GC; (L) GA; (M) Myr-rha; (N) Que-gal; (O) Que-glu; (P) Que-rut; (Q) Kae-rut; (R) Kae-glu in model samples. (Error lines were based on standard deviation; ‘a–k’ referred to the significant differences between the groups were determined by one-way ANOVA analysis based on Duncan’s multiple range test at p ≤ 0.05.).
Most of catechins contribute to both bitterness and astringency [2], including EGCG, (–)-epicatechin-3-gallate (ECG), (+)-catechin (C), (–)-epicatechin (EC), (–)-gallocatechin gallate (GCG), and (–)-catechin gallate (CG) (Figure 1). EGCG (65% of total catechins [35]) exceeded bitter and astringent thresholds in all samples (Figure 1D). ECG surpassed the bitter threshold in half of the samples but only exceeded the astringency threshold in three (Figure 1E), likely due to fewer hydroxyl groups on its B-ring compared to EGCG [2,36]. Non-galloylated catechins (C and EC) have higher thresholds than galloylated ones [2,36]. Only two green tea samples exceeded the astringency threshold (119.01 mg/L) for C (Figure 1F). EC showed a similar distribution to C, suggesting minimal impact on the bitterness and astringency (Figure 1G). GCG and CG were present in low amounts (Figure 1H,I) due to their conversion to EGCG and ECG at high temperatures [37,38].
3.1.2. Astringent Compounds Analysis of Green Tea
Catechins, phenolic acids, and flavonol glycosides mainly contribute to the astringency of green tea [2,29]. Apart from the above catechins, (-)-Epigallocatechin (EGC) and (-)-gallocatechin (GC) can only provide astringency to green tea, likely because they weakly interact with bitter receptors [36]. EGC (second most abundant after EGCG) exceeded its astringent threshold (159.26 mg/L) (Figure 1J). GC (a minor catechin) fell below the threshold due to processing losses [38] (Figure 1K). GA (linked to astringency, sourness, and sweet aftertaste [2]) had concentrations < 10 mg/L, making its contribution negligible (Figure 1L). Flavonol glycosides with extremely low astringent thresholds can impart a silky astringency to green tea [2]. All flavonol glycosides except for myricetin-3-o-rhamnoside (Myr-rha) (Figure 1M) exceeded thresholds (Figure 1N–R). In summary, 9 compounds contributed significantly to the bitterness and astringency of green tea, which were caffeine, EGCG, ECG, EGC, Quercetin-3-o-galactoside (Que-gal), Quercetin-3-o-glucoside (Que-glu), Quercetin-3-o-rutinoside (Que-rut), Kaempferol-3-o-rutinoside (Kae-rut), and Kaempferol-3-o-β-D-glucoside (Kae-glu).
3.1.3. Composition of Bitter–Astringent Simulation Solution
Additionally, the contribution of the 9 compounds to the overall bitter and astringent profiles of green tea was determined by 2-AFC test. Simulation solution 1 contained all 9 compounds. Simulation solutions 2 to 7 were created by progressively removing the compound with the lowest DoT value from the previous solution, while maintaining at least one representative from each perceived type. Finally, simulation solution 7 was composed of caffeine, EGCG, and Que-rut. According to the 2-AFC test results between green tea samples and simulation solutions in Table 7, the selection rates of simulation solutions 1, 2, and 3 were nearly all greater than or equal to 75%. This indicates that nearly all subjects perceived the simulation solution as exhibiting significantly greater bitterness and astringency (α ≤ 0.05) [32]. This may be attributed to GA, non-galloylated catechins, and galloylated catechin hydrolysis products in green tea, which likely reduce BAIPI through sweet aftertaste effects [2,29]. Five green tea samples showed no significant difference (α > 0.05) in bitter and astringent intensity compared to simulation solution 4 and 5, with selectivity ranging from 25% to 75%. Simulation solutions 6–7 matched over 80% of samples after removing Kae-rut and Que-gal and 9 out of the 11 green tea samples showed no significant difference in bitter and astringent intensity from simulated solutions 6 and 7. Therefore, the minimal 3-compound combination (caffeine, EGCG, Que-rut) in solution 7 was identified as optimal. This result was similar to the taste reconstitution and omission experiment of black tea in the study of [24] and our study extends prior work by specifically examining individual flavonol glycosides’ effect. Meanwhile, caffeine, EGCG, and Que-rut were used to develop recombinant solutions for BAIPI quantification curves.
Table 7.
The percentage of responses considering the simulation solution more bitter and astringent compared to samples (n = 20).
3.2. BAIPI Quantification Curves in Green Tea
According the actual ratio of caffeine, EGCG, and Que-rut in model-samples (Table 5), 14 groups with similar ratios were selected to construct BAIPI quantification curves (Table 6). Table 8 shows the BAIPI quantification curves for different groups divided based on the ratio of caffeine, EGCG, and Que-rut of model-samples. When the BAIPI value of Group 2 reached 2, the concentration of caffeine, EGCG, and Que-rut exceeded the content range of model-samples specified in Table 6. As a result, it was not feasible to establish the curve in Group 2. Logarithmic curve fitting for several BAIPI plots across different groups showed that they all followed the same equation form, except for Group 2:
where a, b, and c were constants, x was the concentration of caffeine in this group, and y was the value of BAIPI. It can be observed that all parameter values of a are greater than zero (a > 0), indicating a positive correlation between BAIPI values and caffeine concentration, where larger magnitudes of a correspond to accelerated rates of BAIPI change. The parameter b defines the effective concentration threshold of caffeine, as the logarithmic term ln(x − b) requires x > b to maintain mathematical validity. The parameter c modulates the vertical offset of the baseline, effectively shifting the entire dose-response curve to calibrate BAIPI reference values. As caffeine concentration approaches b (x → b⁺), BAIPI values plummet, reflecting heightened sensitivity to minimal concentration variations. When caffeine concentration substantially exceeds b (x ≫ b), the growth rate of BAIPI diminishes progressively due to the asymptotic nature of logarithmic functions, ultimately approaching saturation.
Table 8.
The specific information of BAIPI quantification curves of green tea.
The goodness of fit (R2) and adjusted R2 of the other groups were greater than 0.99, and the standard error of estimate (SEE) and residual sum of squares (RSS) were less than 0.3, indicating that a high level of curve fitting and predictive accuracy. However, in this study, the Weber fraction increased with BAIPI values (Figure 2A–D), indicating reduced perceptual sensitivity at higher BAIPI levels. This phenomenon also appeared in the study to determine the human sweetness and sourness interactive response [22]. This could be attributed to the interactive effect of the two sensations, resulting in alterations to the Weber fraction when the intensity of stimulation surpassed a certain threshold [7,22,24,39]. Equation (2) conformed to the complete form of Fechner law [39], which indicated that the interactive perceived intensity of the two sensations (e.g., bitterness and astringency) conformed to the Weber–Fechner law.
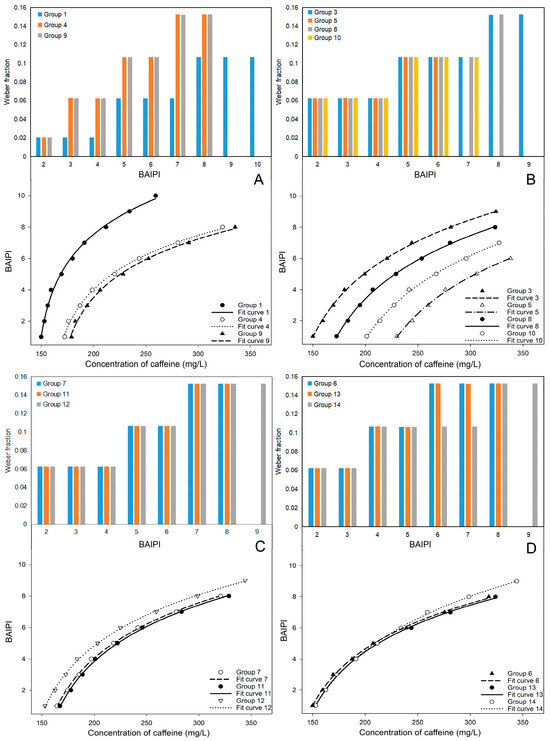
Figure 2.
The Weber fraction and fit curves for 13 groups of BAIPI quantification curves (A) Group 1, 4 and 9; (B) Group 3, 5, 8 and 10; (C) Group 7, 11 and 12; (D) Group 6, 13 and 14.
3.2.1. X-Intercept of Curves
In Figure 2A, Groups 1, 4, and 9 showed an initial Weber fraction of 0.02. Groups 4 and 9 exhibited identical trends in Weber fraction changes. Additionally, it was also observed that fit curves 4 and 9 had similar degree of curvature and inclination, while fit curve 1 was quite different from them. In Figure 2B, a similar phenomenon was also observed in Groups 3, 5, 8, and 10, where the change of Weber fraction and the curvature and inclination of fit curves were similar. However, a distinct observation was the gradual rightward shift along the X-axis of fit curves 3, 8, 10, and 5 as the ratio of caffeine and EGCG (n) increased. In Figure 2C, fit curves 12, 7, and 11 were also arranged in sequence along the X-axis, with the corresponding n being 0.53, 0.71, and 0.73, respectively. Among them, the position of fit curves 7 and 11 in the figure was closer due to the n of Groups 7 and 11 was relatively close. The n of Groups 13, 6, and 14 were very close, about 0.58, resulting in their nearly overlapping positions in Figure 2D. Therefore, the curvature and inclination of the fit curve was correlated with the change trend of Weber fraction, and the position of the fit curve on the X-axis was closely associated with n.
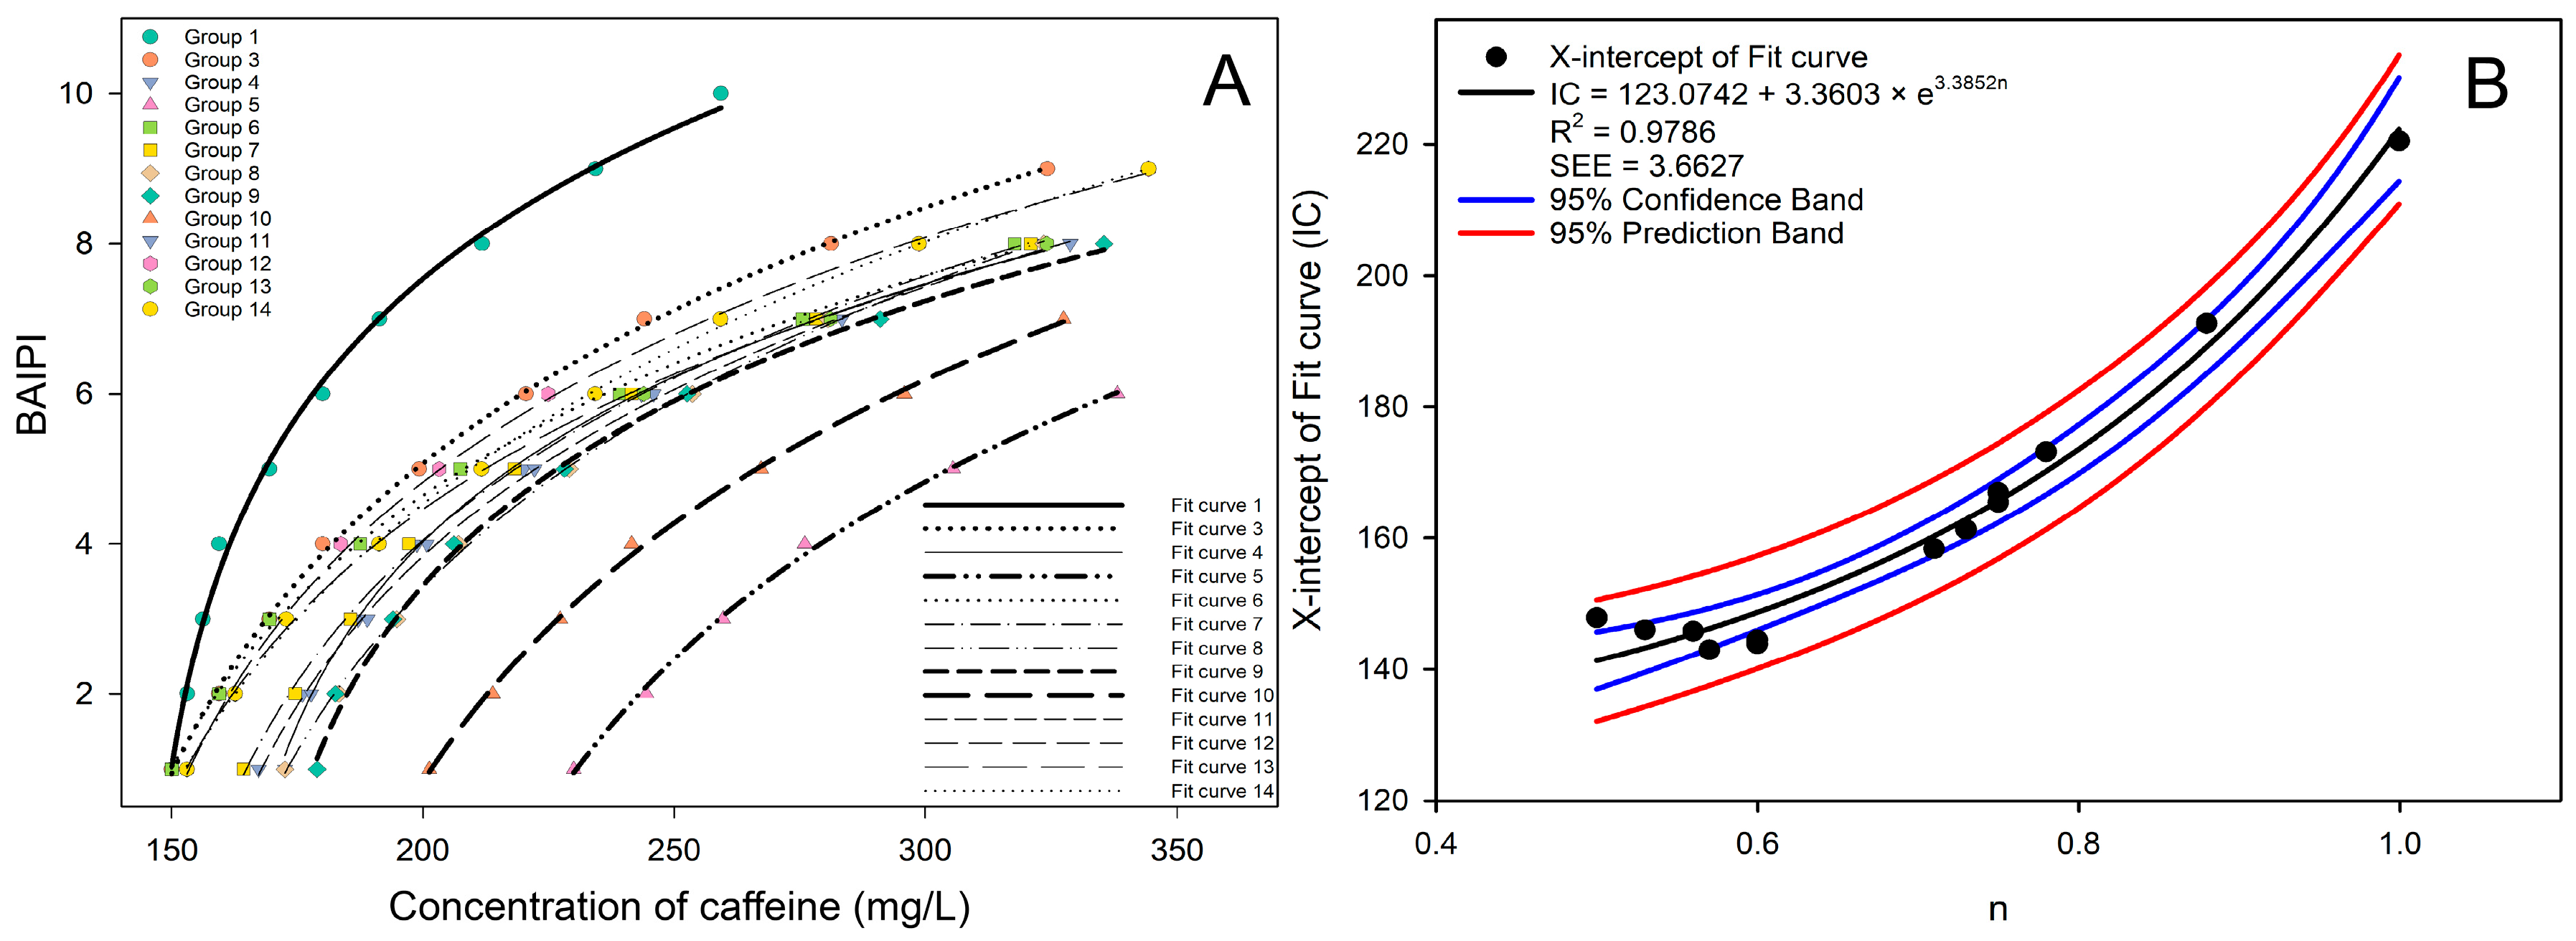
Figure 3A shows the BAIPI value points and fit curves of all groups, and it was found that the fit curve gradually shifted to the right with the increase of n in general. This phenomenon appeared due to the gradual increase of n from 0.5 to 1.0, where the molecular quantities of caffeine and EGCG approached stoichiometric equilibrium. Under these conditions, caffeine and EGCG preferentially formed 2:2 heterotypic complexes [40]. These complexes competitively inhibited EGCG’s binding affinity for salivary proteins, thereby attenuating astringency perception [41]. To maintain equivalent BAIPI values, compensatory elevation of total caffeine concentration (x) became requisite to achieve parity in overall sensory stimulation. The X-intercept, as an approximate indicator of the position of the fit curve on the X-axis, was used to conduct a correlation analysis with the n of all groups as shown in Figure 3B. It was found that the correlation fitted into exponential curves, and the equation form was as follows:
where n was the ratio of caffeine and EGCG in different groups, and IC was the X-intercept of the fit curve. The IC value, representing the caffeine concentration required to achieve a null BAIPI (relatively complete bitter–astringent suppression), exhibited an exponential amplification relationship with n. Specifically, at n = 0.5, IC ≈ 141.2 mg/L; at n = 1.0, IC ≈ 222.5 mg/L. This 57% increase in IC despite caffeine proportion doubling revealed a nonlinear caffeine-mediated bitter–astringent suppression efficacy reduction. The R2 and SEE of the exponential curve were 0.9786 and 3.6627, respectively, indicating a strong correlation between n and X-intercept of the fit curve. The X-intercept of Equation (2) was as follows:
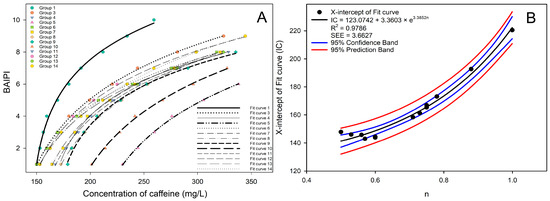
Figure 3.
All the fit curves (A) and the correlation analysis between the concentration ratio of caffeine and EGCG and the X-intercept (B) for 13 groups of BAIPI quantification curves.
Substitute Equation (3) into Equation (4), the constant term c of Equation (2) could be calculated according to the following equation:
3.2.2. Slope of Curves
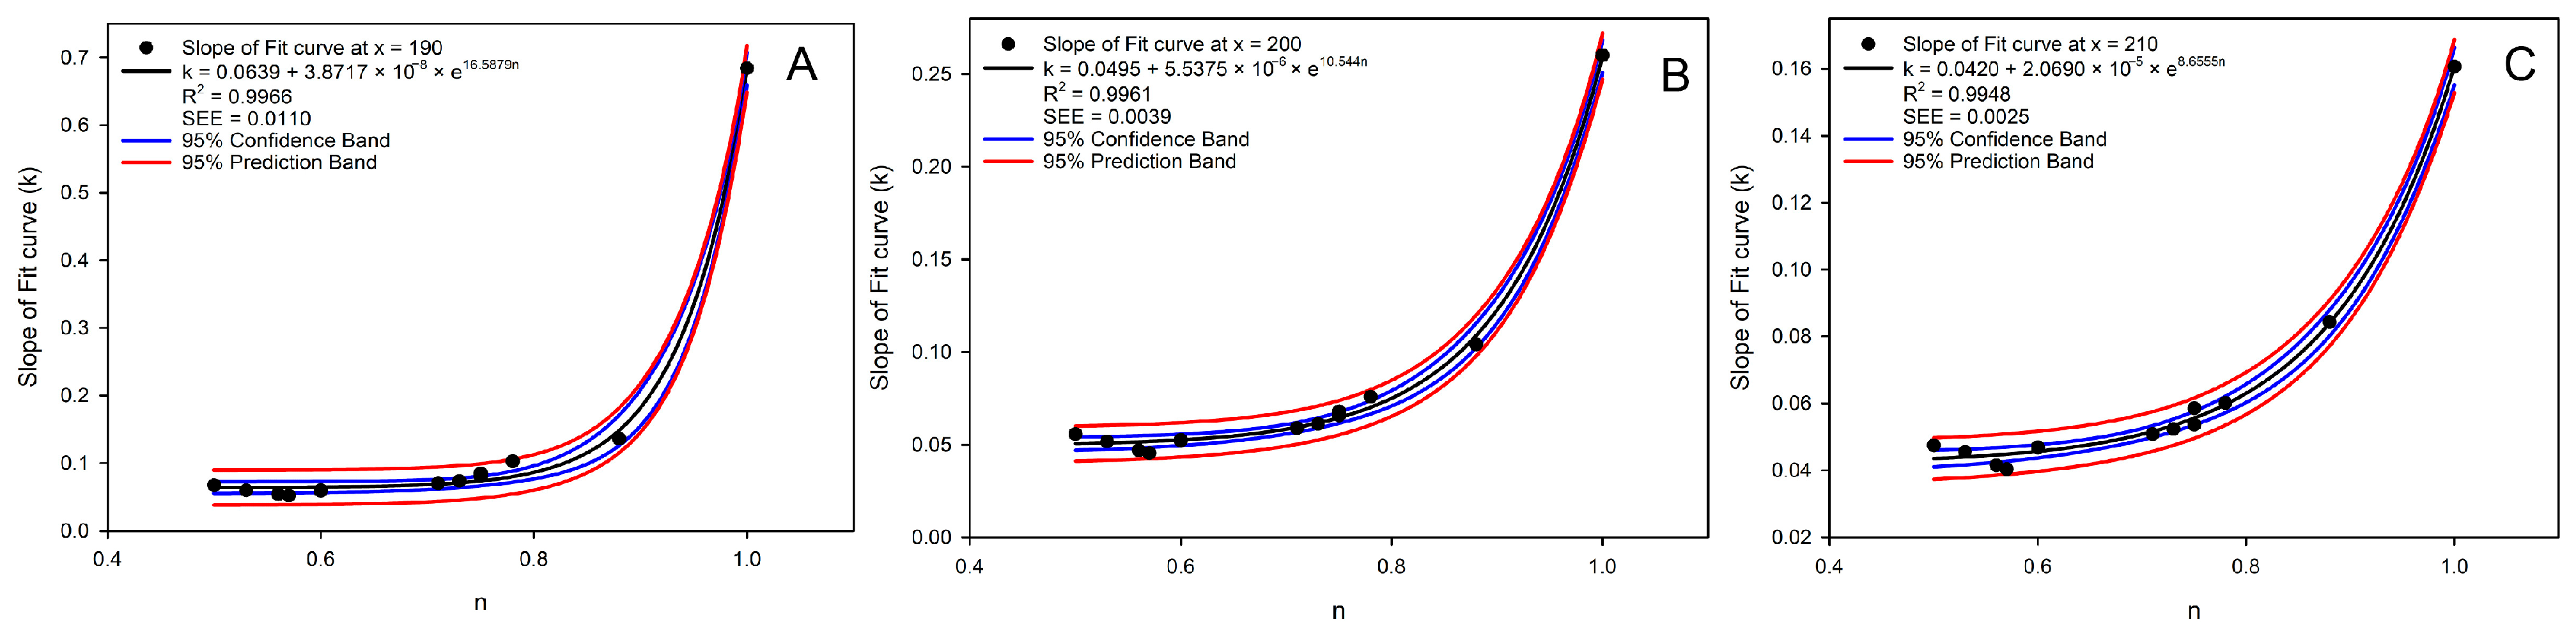
It was difficult to observe the regularity for the curvature and inclination of fit curves in Figure 3A, so an attempt was made to establish a correlation between the n and the slopes at different points of all the fit curves. Since the b of fit curve 5 was 183.86 (requiring N of ln N to be greater than 0), the slopes of the fitted curves at x = 190, 200, and 210 were calculated for correlation analysis with the n, which conformed the exponentially correlation (Figure 4A–C):
where k was the slope of the fit curve at x = 190, 200, and 210. As x increased (from 190 to 210), the exponential coefficient decreased (from 16.5879 to 8.6555), indicating that in the high-concentration range, the sensitivity of k to n is reduced.

Figure 4.
The correlation analysis between the concentration ratio of caffeine and EGCG and the slope at x = 190 (A), 200 (B), and 210 (C) for 13 groups of BAIPI quantification curves.
The R2 of the above exponential curves were 0.9966, 0.9961, and 0.9948, respectively, and the SEEs were 0.0110, 0.0039, and 0.0025, respectively. The R2 for the slope of the fit curve at the point following x = 220 was lower than 0.99, so the slopes of the three points were used to calculate a and b of Equation (2). Additionally, the slope of the fit curve at x = x0 was as follows:
Substitute Equations (7)–(9) into Equation (10), the constant term a and b of Equation (2) could be calculated according to the following equation:
Equations (10)–(12) were combined in pairs, and the n values of all groups were substituted into to calculate a and b. These values then substituted into Equation (6) to calculate the corresponding c, as shown in Table 9. It was found that only the a and b values calculated by the combination of Equations (12) and (13) could substituted into Equation (6), so a and b were:
Table 9.
Different sets of equations solving a, b and c of Equation (2).
3.3. Initial BAIPI Values Calibration of Quantification Curves
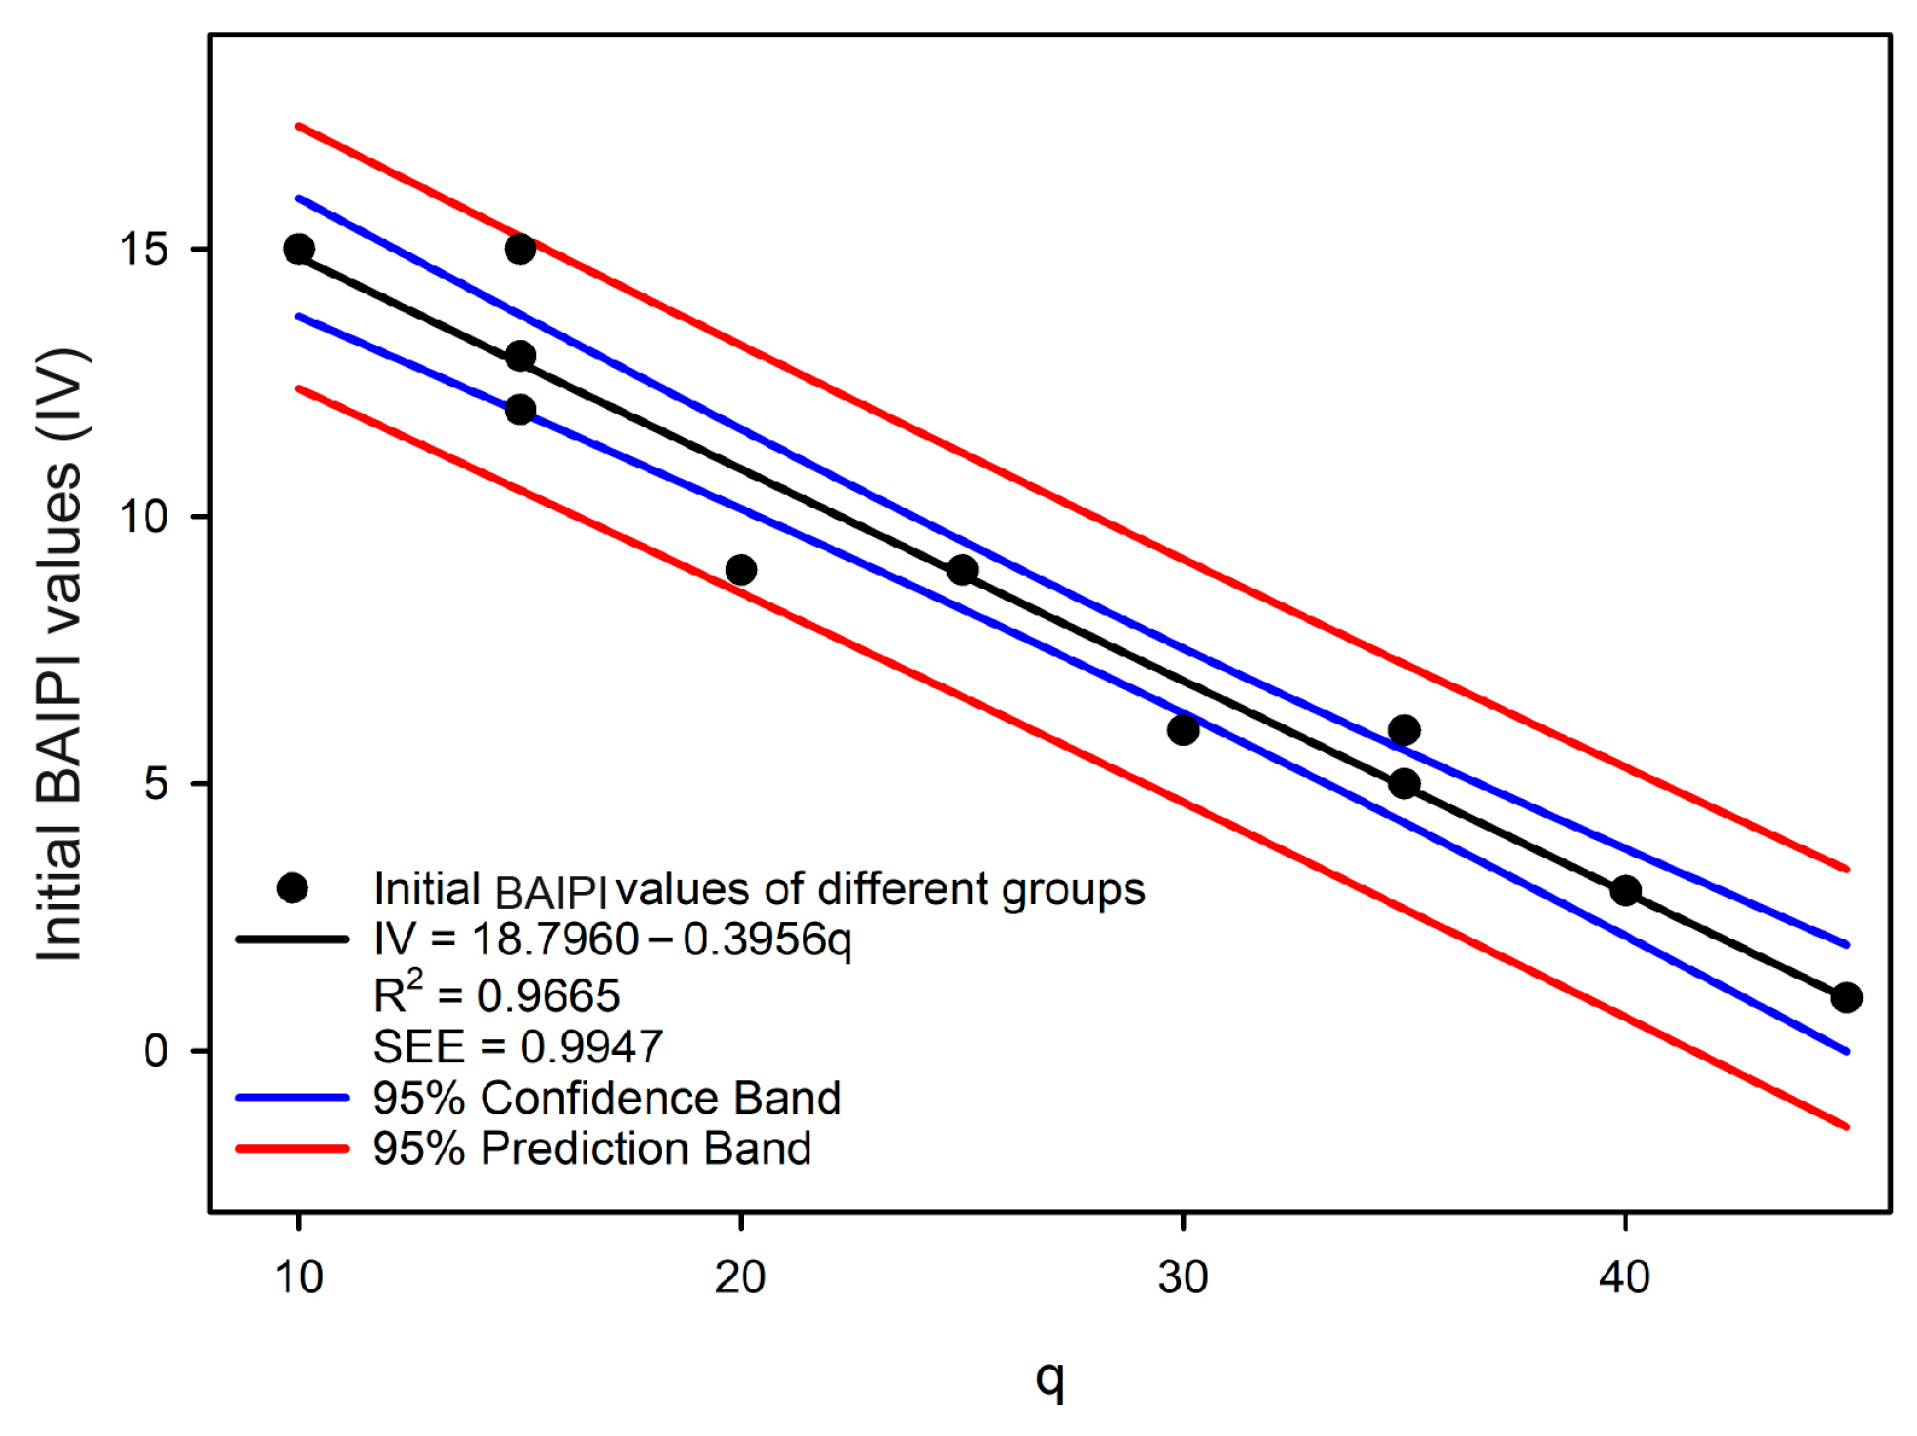
The initial BAIPI values of all quantification curves were calibrated using 2-AFC tests (Table 10). While previous studies on taste intensity quantification typically used absolute thresholds as starting points [14,42,43], this approach may not adequately represent the actual concentration ranges of compounds in specific foods, potentially introducing bias in practical applications [44]. Therefore, the minimum concentration of compounds found in green tea was employed as the quantification baseline in this research. Based on the perceived thresholds and concentration of caffeine, EGCG, and Que-rut in Table 2 and Table 6, Group 14 (with the lowest initial compound DoT values) was designated as the first reference group (’Group r’). Groups 6–13 were calibrated against ’Group r’ via 2-AFC tests (Table 10). Groups 6 and 7 showed the highest initial BAIPI value (9), qualifying them as potential new reference groups and Group 6 was selected to be the new ‘Group r’ because its DoT values were closer to the remaining groups. Thus, the initial BAIPI values of Groups 1–5 were then calibrated against the new ‘Group r’. A linear correlation was observed between the initial BAIPI values of all groups and the ratio of caffeine to Que-rut (q) (Figure 5):
where q was the ratio of caffeine and Que-rut of different groups, and IV was initial BAIPI values.
Table 10.
Standardized BAPI values.
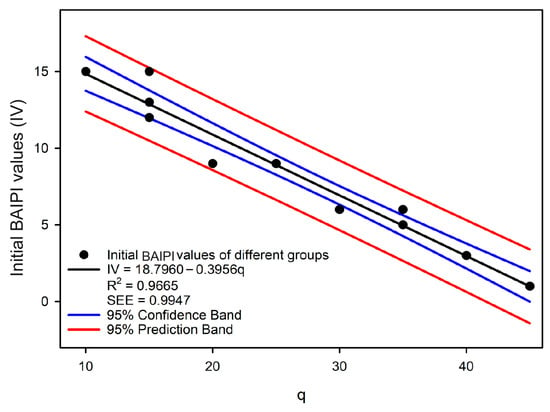
Figure 5.
The correlation analysis between the concentration ratio of caffeine and Que-rut and the initial BAIPI values for 13 groups of BAIPI quantification curves.
The R2 of the linear correlation model was 0.9665, and the SEE was 0.9947, indicating that the model was acceptable. Since the initial BAIPI value of all the fit curves in Table 8 was set to 1, the Equation (2) should be modified as follow:
3.4. Verification of BAIPI Quantification Curves in Green Tea
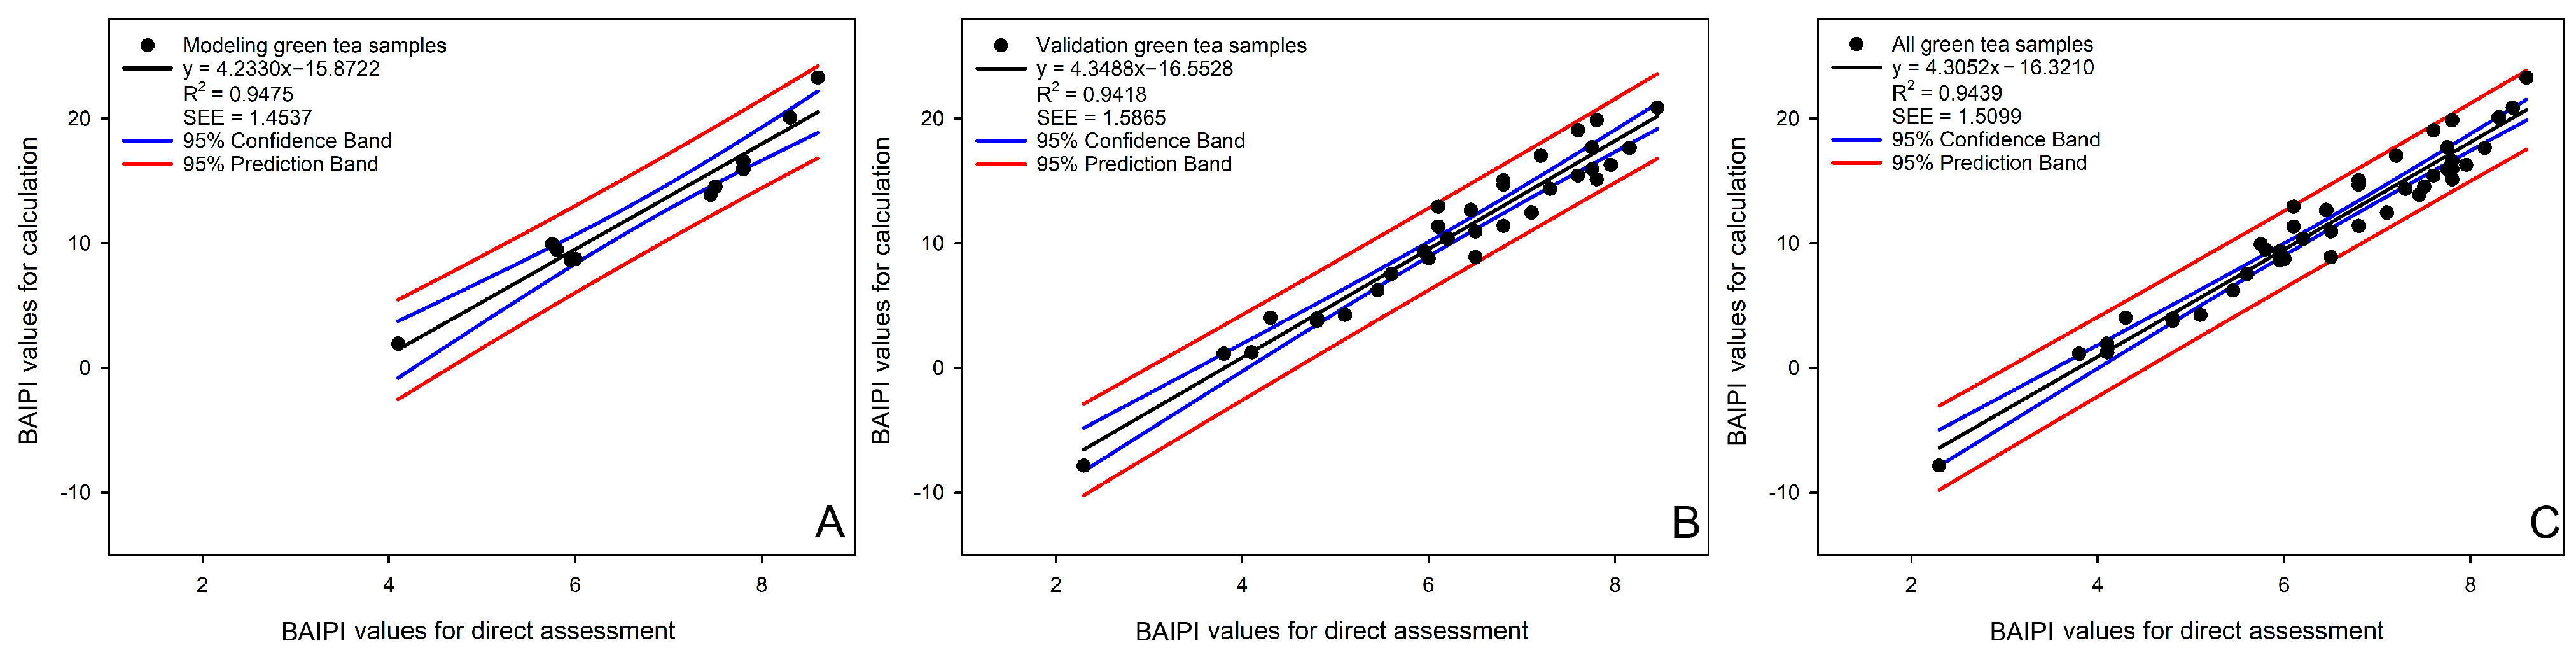
The applicability of the BAIPI quantification curve was assessed through correlation analysis between calculated and directly assessed BAIPI values (Figure 6). The concentration of caffeine, EGCG, and Que-rut of green tea samples were input into Equations (6) and (14)–(16) calculated the corresponding a, b, c and IV. These parameters were then substituted into Equation (17) to calculate final BAIPI values (Table 11). Direct assessment of BAIPI values was based on a 9-point intensity scale (1 = lowest, 9 = highest). Scale reference points corresponded to the concentration of caffeine, EGCG, and Que-rut corresponding to the BAIPI values of 1, 3, 6 (in Group 14), 9, 12, 15 (in Group 6), 18, 21 and 24 (in Group 1) in Table 10. In Figure 6, the R2 of the correlation model based on the model, validation and all samples were 0.9475, 0.9418 and 0.9439, respectively, and SEEs were 1.4537, 1.5865 and 1.5099, respectively. These results demonstrate the model’s ability to reliably estimate the comprehensive bitter–astringent perception in green tea.
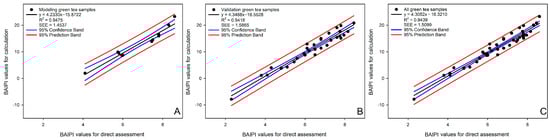
Figure 6.
The correlation analysis between the BAIPI values calculated by BAIPI quantification curves and those obtained by direct assessment based on model (A), validation (B), and all samples (C).
Table 11.
BAIPI values calculated by BAIPI quantification curves and those obtained by direct assessment.
4. Conclusions
This study developed a quantification curve to evaluate BAIPI in green tea, based on its unique flavor profile. Caffeine, EGCG, and Que-rut were identified as primary contributors to BAIPI, which were also subsequently employed to develop the quantification curve. The utilization of 2-AFC test enhanced the assessment reliability of subjects in this research, with all the fit curves conforming to the Weber–Fechner law. The slope and X-intercept of the fit curve were exponentially related to the concentration ratio of caffeine and EGCG (n). The initial BAIPI values of the fit curve were linearly associated with the concentration ratio of caffeine and Que-rut (q). Thus, BAIPI values were calculated by inputting concentrations of the three key compounds into the BAIPI quantification curve. Validation showed strong correlation with direct assessment. The R2 and SEE of the correlation analysis were about 0.94 and 1.51, respectively. This work advances the objective assessment of tea sensory properties while offering practical tools for industry applications. However, further research integrating biochemical, genetic, and larger-scale sensory data will strengthen the robustness of this approach. These findings pave the way for more precise flavor profiling, quality control, and consumer-driven product design in the tea and broader beverage sector.
Author Contributions
Conceptualization, S.L. and Z.W.; methodology, S.L.; software, D.D.; validation, S.C.; formal analysis, D.D.; investigation, S.C.; resources, D.D.; data curation, S.L.; writing—original draft preparation, S.L.; writing—review and editing, S.L.; visualization, Z.W.; supervision, Z.W.; project administration, Z.W.; funding acquisition, Z.W. All authors have read and agreed to the published version of the manuscript.
Funding
The work was funded by the National Natural Science Foundation of China [grant number 31972200].
Institutional Review Board Statement
Ethical approval for the involvement of human subjects in this study was granted by the Medical Ethics Committee in School of Medicine of Zhejiang University, Reference number 2019-046, dtd 3/4/2019. All subjects signed a consent form to participate in the sensory and consumer tests.
Informed Consent Statement
Informed consent was obtained from all subjects involved in the study. Written informed consent has been obtained from the patients to publish this paper.
Data Availability Statement
Data will be made available on request.
Acknowledgments
The authors are grateful to the financial support from the National Natural Science Foundation of China (NSFC, 31972200) and technical support from Zhejiang University.
Conflicts of Interest
All authors declared that there was no conflicts of interest.
References
- Wang, J.Q.; Fu, Y.Q.; Chen, J.X.; Wang, F.; Feng, Z.H.; Yin, J.F.; Zeng, L.; Xu, Y.Q. Effects of baking treatment on the sensory quality and physicochemical properties of green tea with different processing methods. Food Chem. 2022, 380, 132217. [Google Scholar] [CrossRef] [PubMed]
- Ye, J.-H.; Ye, Y.; Yin, J.-F.; Jin, J.; Liang, Y.-R.; Liu, R.-Y.; Tang, P.; Xu, Y.-Q. Bitterness and astringency of tea leaves and products: Formation mechanism and reducing strategies. Trends Food Sci. Technol. 2022, 123, 130–143. [Google Scholar] [CrossRef]
- Lu, L.; Wang, L.; Liu, R.Y.; Zhang, Y.B.; Zheng, X.Q.; Lu, J.L.; Wang, X.C.; Ye, J.H. An efficient artificial intelligence algorithm for predicting the sensory quality of green and black teas based on the key chemical indices. Food Chem. 2024, 441, 138341. [Google Scholar] [CrossRef]
- Romeo-Arroyo, E.; Mora, M.; Noguera-Artiaga, L.; Vazquez-Araujo, L. Tea pairings: Impact of aromatic congruence on acceptance and sweetness perception. Curr. Res. Food Sci. 2023, 6, 100432. [Google Scholar] [CrossRef]
- Chong, P.H.; Chen, J.; Yin, D.; Qin, L. Tea compound-saliva interactions and their correlations with sweet aftertaste. Npj Sci. Food 2022, 6, 13. [Google Scholar] [CrossRef]
- Nolden, A.A.; Feeney, E.L. Genetic Differences in Taste Receptors: Implications for the Food Industry. Annu. Rev. Food Sci. Technol. 2020, 11, 183–204. [Google Scholar] [CrossRef]
- Yin, J.F.; Zhang, Y.N.; Du, Q.Z.; Chen, J.X.; Yuan, H.B.; Xu, Y.Q. Effect of Ca2+ concentration on the tastes from the main chemicals in green tea infusions. Food Res. Int. 2014, 62, 941–946. [Google Scholar] [CrossRef]
- Zhang, Y.N.; Yin, J.F.; Chen, J.X.; Wang, F.; Du, Q.Z.; Jiang, Y.W.; Xu, Y.Q. Improving the sweet aftertaste of green tea infusion with tannase. Food Chem. 2016, 192, 470–476. [Google Scholar] [CrossRef]
- Chong, P.H.; Chen, J.; Yin, D.; Upadhyay, R.; Mo, L.; Han, L. “Oral” tribology study on saliva-tea compound mixtures: Correlation between sweet aftertaste (Huigan) perception and friction coefficient. Food Res. Int. 2019, 125, 108642. [Google Scholar] [CrossRef]
- Jiang, Y.; Gong, N.N.; Matsunami, H. Astringency: A More Stringent Definition. Chem. Senses 2014, 39, 467–469. [Google Scholar] [CrossRef]
- Lyu, J.; Fu, J.; Chen, S.; Xu, Y.; Nie, Y.; Tang, K. Impact of tannins on intraoral aroma release and retronasal perception, including detection thresholds and temporal perception by taste, in model wines. Food Chem. 2022, 375, 131890. [Google Scholar] [CrossRef] [PubMed]
- Zeng, Y.; Liang, J.H.; Zhang, J.Y.; Chen, W.; Hu, D.; Xia, H.L.; Ma, C.Y.; Qiao, X.Y. Improvement of the sensory characteristics of Dancong tea using a dry-heating post-treatment approach. LWT—Food Sci. Technol. 2023, 185, 115118. [Google Scholar] [CrossRef]
- De Toffoli, A.; Spinelli, S.; Monteleone, E.; Arena, E.; Di Monaco, R.; Endrizzi, I.; Toschi, T.G.; Laureati, M.; Napolitano, F.; Torri, L.; et al. Influences of Psychological Traits and PROP Taster Status on Familiarity with and Choice of Phenol-Rich Foods and Beverages. Nutrients 2019, 11, 1329. [Google Scholar] [CrossRef] [PubMed]
- Mao, Y.Z.; Tian, S.Y.; Qin, Y.M.; Han, J.Z. A new sensory sweetness definition and sweetness conversion method of five natural sugars, based on the Weber-Fechner Law. Food Chem. 2019, 281, 78–84. [Google Scholar] [CrossRef]
- Hayashi, N.; Ujihara, T.; Chen, R.; Irie, K.; Ikezaki, H. Objective evaluation methods for the bitter and astringent taste intensities of black and oolong teas by a taste sensor. Food Res. Int. 2013, 53, 816–821. [Google Scholar] [CrossRef]
- Ye, Q.Q.; Chen, G.S.; Pan, W.; Cao, Q.Q.; Zeng, L.; Yin, J.F.; Xu, Y.Q. A predictive model for astringency based on in vitro interactions between salivary proteins and (−)-Epigallocatechin gallate. Food Chem. 2021, 340, 127845. [Google Scholar] [CrossRef]
- Hayashi, N.; Chen, R.; Hiraoka, M.; Ujihara, T.; Ikezaki, H. β-Cyclodextrin/Surface Plasmon Resonance Detection System for Sensing Bitter-Astringent Taste Intensity of Green Tea Catechins. J. Agric. Food Chem. 2010, 58, 8351–8356. [Google Scholar] [CrossRef]
- Li, S.; Du, D.; Wang, J.; Wei, Z. Application progress of intelligent flavor sensing system in the production process of fermented foods based on the flavor properties. Crit. Rev. Food Sci. Nutr. 2022, 64, 3764–3793. [Google Scholar] [CrossRef]
- Zhang, J.; Zhao, X.; Li, L.; Chen, W.; Zhao, Q.; Su, G.; Zhao, M. Application of electronic tongue in umami detection and soy sauce refining process. Food Chem. X 2023, 18, 100652. [Google Scholar] [CrossRef]
- Portugal, R.D.; Svaiter, B.F. Weber-Fechner Law and the Optimality of the Logarithmic Scale. Minds Mach. 2011, 21, 73–81. [Google Scholar] [CrossRef]
- Mao, Y.; Tian, S.; Qin, Y.; Cheng, S. An optimized organic acid human sensory sourness analysis method. J. Sci. Food Agric. 2021, 101, 5880–5887. [Google Scholar] [CrossRef] [PubMed]
- Mao, Y.Z.; Tian, S.Y.; Qin, Y.M.; Chen, S.W. Sensory sweetness and sourness interactive response of sucrose-citric acid mixture based on synergy and antagonism. Npj Sci. Food 2022, 6, 33. [Google Scholar] [CrossRef] [PubMed]
- Wang, Y.; Wan, S.; Pan, S.; Luan, P.; Cen, X.; Sun, G.; Feng, Y.; Zhu, M. A quantitative equation for umami evaluation of food and condiments based on the Weber-Fechner law. Food Qual. Prefer. 2025, 123, 105347. [Google Scholar] [CrossRef]
- Scharbert, S.; Hofmann, T. Molecular definition of black tea taste by means of quantitative studies, taste reconstitution, and omission experiments. J. Agric. Food Chem. 2005, 53, 5377–5384. [Google Scholar] [CrossRef]
- Kishi, M.; Sadachi, H.; Nakamura, J.; Tonoike, M. Functional magnetic resonance imaging investigation of brain regions associated with astringency. Neurosci. Res. 2017, 122, 9–16. [Google Scholar] [CrossRef]
- Huang, Y.L.; Vivian, R.M.; Goh, A.; Quan, S.; Sakumoto, S.; Yun, H.; Huey, K.; Sun, J.C.; Lassabliere, B.; Yu, B. Effect of three milling processes (cyclone-, bead- and stone-millings) on the quality of matcha: Physical properties, taste and aroma. Food Chem. 2022, 372, 131202. [Google Scholar] [CrossRef]
- Liu, Y.; Luo, L.H.; Liao, C.X.; Chen, L.; Wang, J.; Zeng, L. Effects of brewing conditions on the phytochemical composition, sensory qualities and antioxidant activity of green tea infusion: A study using response surface methodology. Food Chem. 2018, 269, 24–34. [Google Scholar] [CrossRef]
- Yu, J.Y.; Liu, Y.; Zhang, S.R.; Luo, L.Y.; Zeng, L. Effect of brewing conditions on phytochemicals and sensory profiles of black tea infusions: A primary study on the effects of geraniol and β-ionone on taste perception of black tea infusions. Food Chem. 2021, 354, 129504. [Google Scholar] [CrossRef]
- Zhang, L.; Cao, Q.Q.; Granato, D.; Xu, Y.Q.; Ho, C.T. Association between chemistry and taste of tea: A review. Trends Food Sci. Technol. 2020, 101, 139–149. [Google Scholar] [CrossRef]
- Daniel Estevez-Lopez, R.; Garcia-Gomez, B.; Lourdes Vazquez-Oderiz, M.; Munoz Ferreiro, N.; Angeles Romero-Rodriguez, M. Influence of bread shape on the sensory characteristics of Galician breads: Development of lexicon, efficacy control of the trained panel and establishment of a sensory profile. LWT—Food Sci. Technol. 2021, 135, 110024. [Google Scholar]
- ISO 8586; Sensory Analysis. General Guidelines for the Selection, Training and Monitoring of Selected Assessors and Expert Sensory Assessors. International Organization for Standardization: Geneva, Switzerland, 2012.
- ISO 5495; Sensory Analysis. Methodology. Paired Comparison Test. International Organization for Standardization: Geneva, Switzerland, 2005.
- Kim, H.O.; Li-Chan, E.C.Y. Quantitative structure-activity relationship study of bitter peptides. J. Agric. Food Chem. 2006, 54, 10102–10111. [Google Scholar] [CrossRef] [PubMed]
- Feng, B.L.; Ren, H.B.; Duan, J.H.; Zhang, H.S.; Wen, C.H.; Bai, X.S.; Gao, F.; Wang, Y.T. Molecular recognition and threshold prediction model of bitterness in natural compounds. Sci. Technol. Food Ind. 2022, 43, 24–32. [Google Scholar]
- Shitandi, A.A.; Muigai Ngure, F.; Mahungu, S.M. Chapter 16—Tea Processing and its Impact on Catechins, Theaflavin and Thearubigin Formation. In Tea in Health and Disease Prevention; Preedy, V.R., Ed.; Academic Press: Cambridge, MA, USA, 2013; pp. 193–205. [Google Scholar]
- Narukawa, M.; Kimata, H.; Noga, C.; Watanabe, T. Taste characterisation of green tea catechins. Int. J. Food Sci. Technol. 2010, 45, 1579–1585. [Google Scholar] [CrossRef]
- Rong, W.; Zhou, W.; Wen, R.A.H. Kinetic study of the thermal stability of tea catechins in aqueous systems using a microwave reactor. J. Agric. Food Chem. 2006, 54, 5924–5932. [Google Scholar]
- Ananingsih, V.K.; Sharma, A.; Zhou, W. Green tea catechins during food processing and storage: A review on stability and detection. Food Res. Int. 2013, 50, 469–479. [Google Scholar] [CrossRef]
- Norwich, K.H.; Wong, W. Unification of psychophysical phenomena: The complete form of Fechner’s law. Percept. Psychophys. 1997, 59, 929–940. [Google Scholar] [CrossRef]
- Ishizu, T.; Tsutsumi, H.; Sato, T. Mechanism of Creaming Down Based on Chemical Characterization of a Complex of Caffeine and Tea Catechins. Chem. Pharm. Bull. 2016, 64, 676–686. [Google Scholar] [CrossRef]
- Zhou, Z.; Ou, M.; Shen, W.; Jin, W.; Yang, G.; Huang, W.; Guo, C. Caffeine weakens the astringency of epigallocatechin gallate by inhibiting its interaction with salivary proteins. Food Chem. 2024, 460, 140753. [Google Scholar] [CrossRef]
- Li, C.X.; Ren, Y.N.; Yao, J.; Wang, Y.L.; Gao, X.L.; Li, H.; Guo, X.F.; Liu, R.X.; Li, X.L. Study on quantitative method of specific bitterness of bitter compounds based on traditional human taste panel method. Chin. Tradit. Herb. Drugs 2023, 54, 2758–2764. [Google Scholar]
- Li, X.L.; Gui, X.J.; Liu, R.X.; Gao, X.J.; Meng, X.L.; Chen, P.J.; Kang, B.Y.; Zhang, L.; Shi, J.H. Bitterness intensity prediction of bitter compounds of traditional Chinese medicine based on an electronic tongue. Chin. J. New Drugs 2016, 25, 1307–1314. [Google Scholar]
- Zhu, Y.W.; Zhou, X.R.; Chen, Y.P.; Liu, Z.Y.; Jiang, S.; Chen, G.L.; Liu, Y. Exploring the relationships between perceived umami intensity, umami components and electronic tongue responses in food matrices. Food Chem. 2022, 368, 130849. [Google Scholar] [CrossRef] [PubMed]


Disclaimer/Publisher’s Note: The statements, opinions and data contained in all publications are solely those of the individual author(s) and contributor(s) and not of MDPI and/or the editor(s). MDPI and/or the editor(s) disclaim responsibility for any injury to people or property resulting from any ideas, methods, instructions or products referred to in the content. |
© 2025 by the authors. Licensee MDPI, Basel, Switzerland. This article is an open access article distributed under the terms and conditions of the Creative Commons Attribution (CC BY) license (https://creativecommons.org/licenses/by/4.0/).