
A Comparative Evaluation of the Structural and Biomechanical Properties of Food-Grade Biopolymers as Potential Hydrogel Building Blocks


Abstract
:1. Introduction
2. Materials and Methods
2.1. Material
2.2. Samples Preparation
2.3. Methods
2.3.1. Volumetric Gelling Index (VGI) and Sample Appearance after Inversion
2.3.2. Microrheological Properties
2.3.3. Physical Stability
2.3.4. Color Parameters
2.3.5. Statistical Analysis
3. Results
3.1. Volumetric Gelling Index (VGI) and Sample Appearance after Inversion
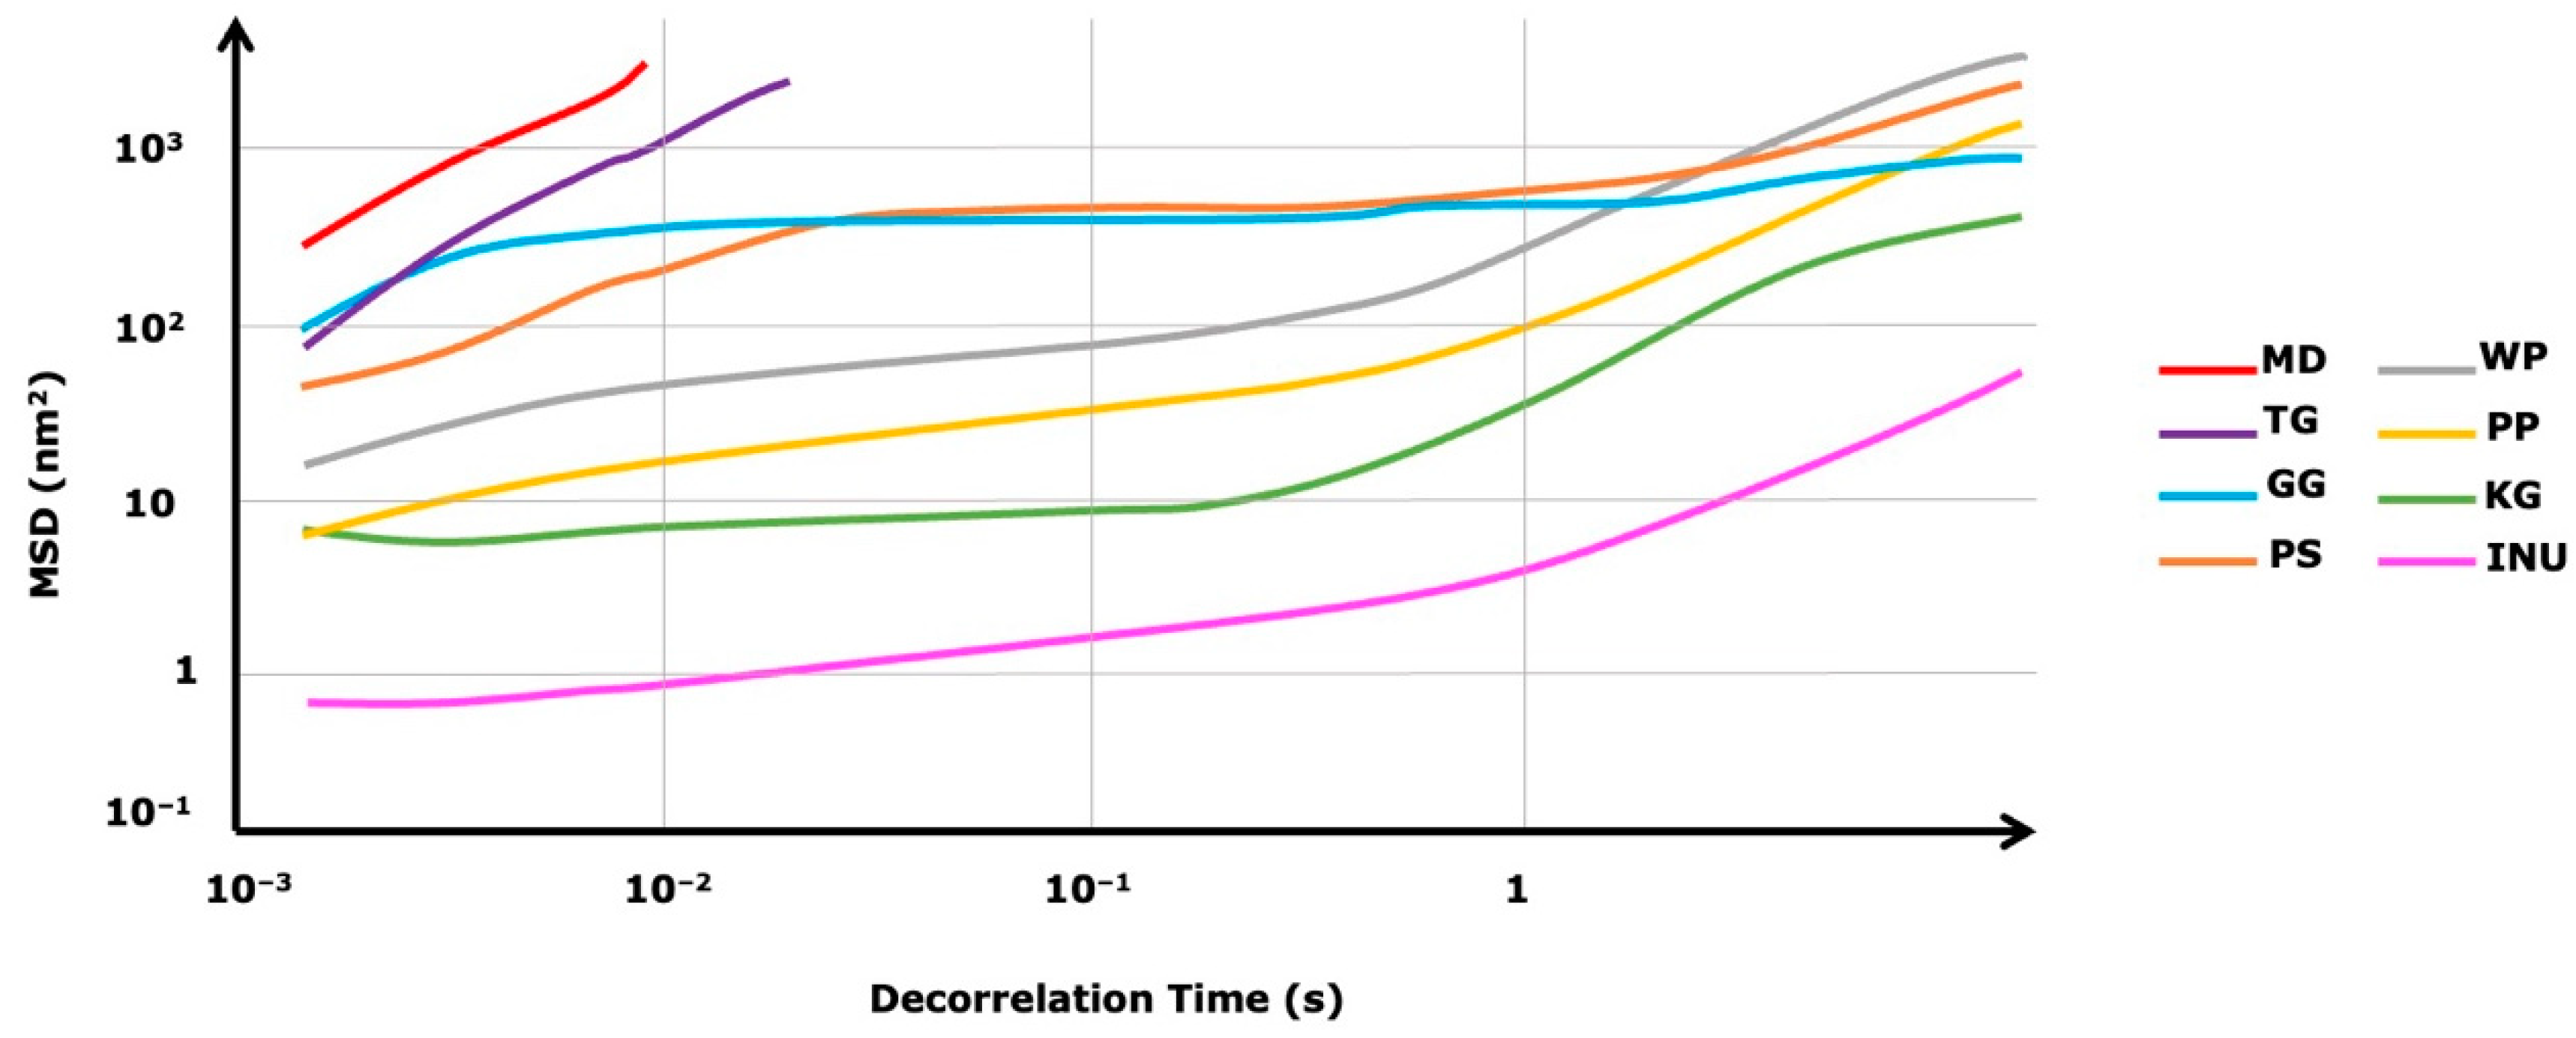
3.2. Microrheological Properties
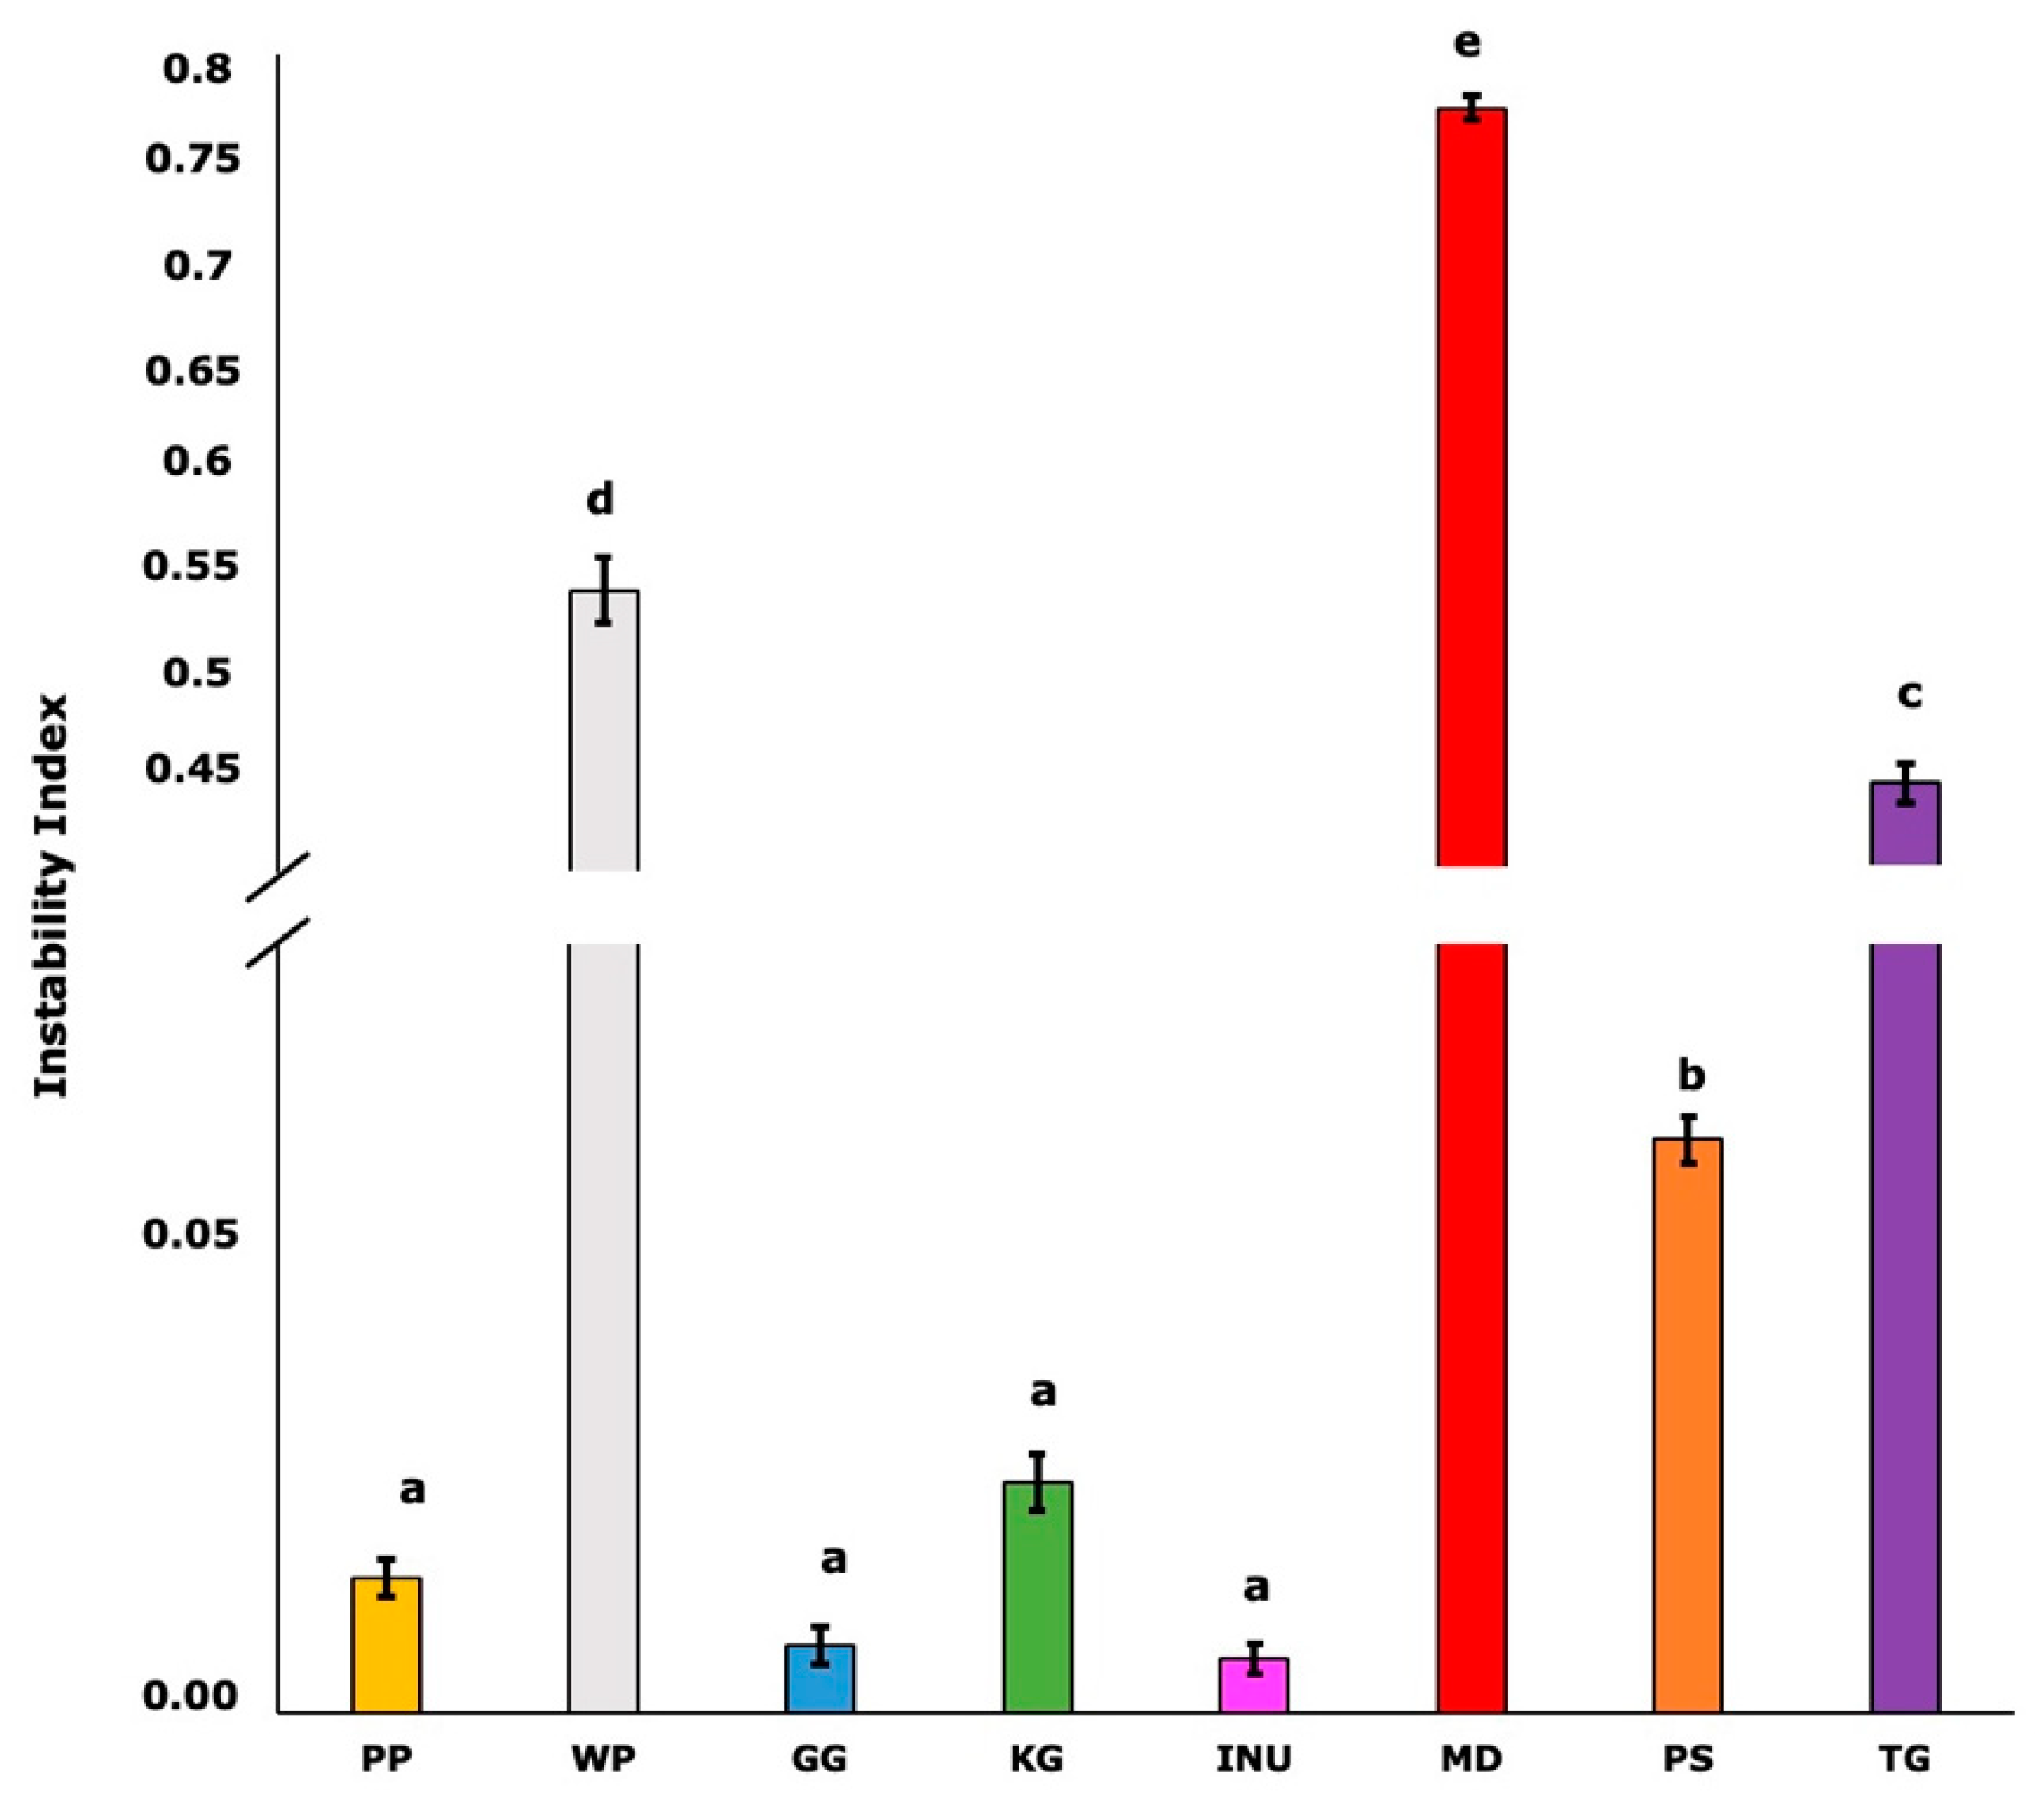
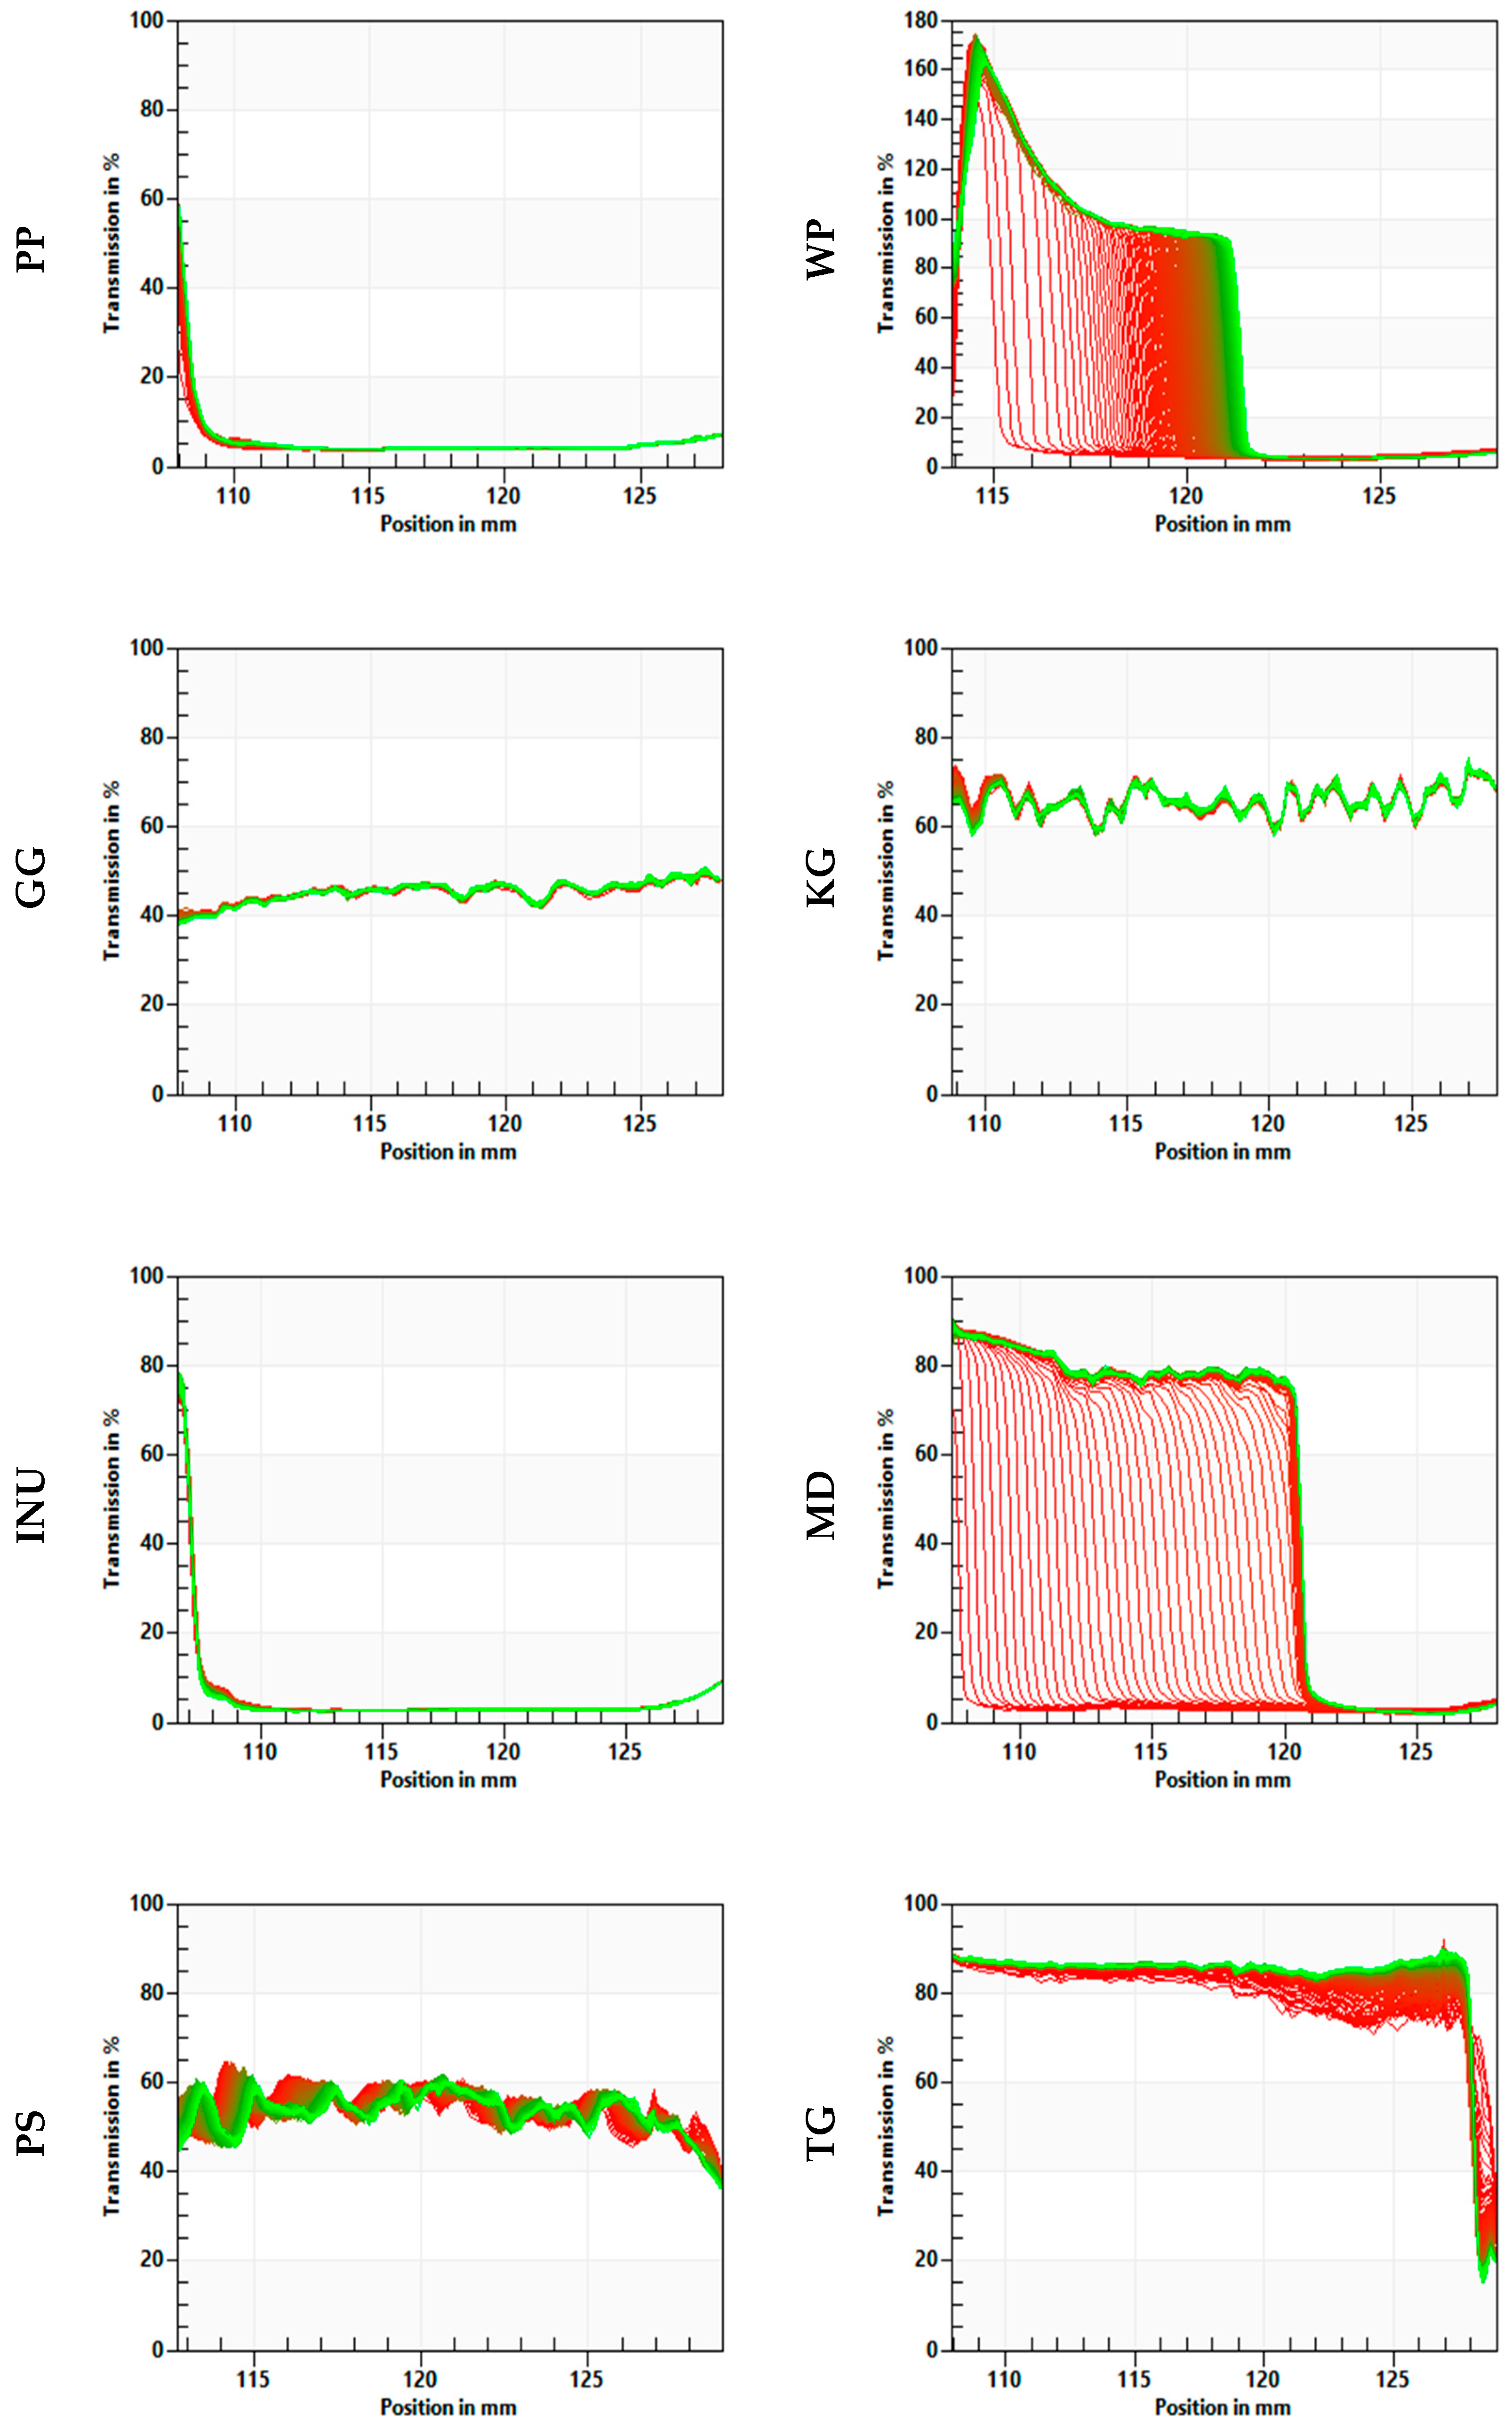
3.3. Physical Stability
3.4. Color Parameters
3.5. Principal Component Analysis (PCA) and Hierarchal Cluster Analysis (HCA)
4. Discussion
5. Conclusions
Author Contributions
Funding
Institutional Review Board Statement
Informed Consent Statement
Conflicts of Interest
References
- Li, J.; Jia, X.; Yin, L. Hydrogel: Diversity of Structures and Applications in Food Science. Food Rev. Int. 2021, 37, 313–372. [Google Scholar] [CrossRef]
- Mantha, S.; Pillai, S.; Khayambashi, P.; Upadhyay, A.; Zhang, Y.; Tao, O.; Pham, H.M.; Tran, S.D. Smart Hydrogels in Tissue Engineering and Regenerative Medicine. Materials 2019, 12, 3323. [Google Scholar] [CrossRef]
- Boni, R.; Ali, A.; Shavandi, A.; Clarkson, A.N. Current and Novel Polymeric Biomaterials for Neural Tissue Engineering. J. Biomed. Sci. 2018, 25, 90. [Google Scholar] [CrossRef] [PubMed]
- Ma, Z.; Wang, N.; He, H.; Tang, X. Pharmaceutical Strategies of Improving Oral Systemic Bioavailability of Curcumin for Clinical Application. J. Control. Release 2019, 316, 359–380. [Google Scholar] [CrossRef] [PubMed]
- Narayanaswamy, R.; Torchilin, V.P. Hydrogels and Their Applications in Targeted Drug Delivery. Molecules 2019, 24, 603. [Google Scholar] [CrossRef]
- Li, J.; Wu, C.; Chu, P.K.; Gelinsky, M. 3D Printing of Hydrogels: Rational Design Strategies and Emerging Biomedical Applications. Mater. Sci. Eng. R Rep. 2020, 140, 100543. [Google Scholar] [CrossRef]
- Lim, J.; Lin, Q.; Xue, K.; Loh, X. Recent Advances in Supramolecular Hydrogels for Biomedical Applications. Mater. Today Adv. 2019, 3, 100021. [Google Scholar] [CrossRef]
- Lee, Y.; Song, W.J.; Sun, J.Y. Hydrogel Soft Robotics. Mater. Today Phys. 2020, 15, 100258. [Google Scholar] [CrossRef]
- Shiblee, M.N.I.; Ahmed, K.; Kawakami, M.; Furukawa, H. 4D Printing of Shape-Memory Hydrogels for Soft-Robotic Functions. Adv. Mater. Technol. 2019, 4, 1900071. [Google Scholar] [CrossRef]
- Yang, J.; Shen, M.; Luo, Y.; Wu, T.; Chen, X.; Wang, Y.; Xie, J. Advanced Applications of Chitosan-Based Hydrogels: From Biosensors to Intelligent Food Packaging System. Trends Food Sci. Technol. 2021, 110, 822–832. [Google Scholar] [CrossRef]
- Bae, J.; Park, J.; Kim, S.; Cho, H.; Kim, H.J.; Park, S.; Shin, D.S. Tailored Hydrogels for Biosensor Applications. J. Ind. Eng. Chem. 2020, 89, 1–12. [Google Scholar] [CrossRef]
- Wankhade, V. Animal-Derived Biopolymers in Food and Biomedical Technology. In Biopolymer-Based Formulations: Biomedical and Food Applications; Elsevier: Amsterdam, The Netherlands, 2020; pp. 139–152. ISBN 9780128168981. [Google Scholar]
- Cao, Y.; Mezzenga, R. Design Principles of Food Gels. Nat. Food 2020, 1, 106–118. [Google Scholar] [CrossRef]
- Parhi, R. Cross-Linked Hydrogel for Pharmaceutical Applications: A Review. Adv. Pharm. Bull. 2017, 7, 515–530. [Google Scholar] [CrossRef]
- Mitura, S.; Sionkowska, A.; Jaiswal, A. Biopolymers for Hydrogels in Cosmetics: Review. J. Mater. Sci. Mater. Med. 2020, 31, 30. [Google Scholar] [CrossRef] [PubMed]
- Zhang, H.; Zhang, F.; Yuan, R. Applications of Natural Polymer-Based Hydrogels in the Food Industry. In Hydrogels Based on Natural Polymers; Elsevier: Amsterdam, The Netherlands, 2020; pp. 357–410. ISBN 9780128164211. [Google Scholar]
- Chen, X.; Fan, M.; Tan, H.; Ren, B.; Yuan, G.; Jia, Y.; Li, J.; Xiong, D.; Xing, X.; Niu, X.; et al. Magnetic and Self-Healing Chitosan-Alginate Hydrogel Encapsulated Gelatin Microspheres via Covalent Cross-Linking for Drug Delivery. Mater. Sci. Eng. C 2019, 101, 619–629. [Google Scholar] [CrossRef] [PubMed]
- Lu, Y.; Mao, L.; Zheng, H.; Chen, H.; Gao, Y. Characterization of β-Carotene Loaded Emulsion Gels Containing Denatured and Native Whey Protein. Food Hydrocoll. 2019, 102, 105600. [Google Scholar] [CrossRef]
- Florowska, A.; Hilal, A.; Florowski, T.; Mrozek, P.; Wroniak, M. Sodium Alginate and Chitosan as Components Modifying the Properties of Inulin Hydrogels. Gels 2022, 8, 63. [Google Scholar] [CrossRef]
- Chantanuson, R.; Nagamine, S.; Kobayashi, T.; Nakagawa, K. Preparation of Soy Protein-Based Food Gels and Control of Fibrous Structure and Rheological Property by Freezing. Food Struct. 2022, 32, 100258. [Google Scholar] [CrossRef]
- Klost, M.; Drusch, S. Structure Formation and Rheological Properties of Pea Protein-Based Gels. Food Hydrocoll. 2019, 94, 622–630. [Google Scholar] [CrossRef]
- Florowska, A.; Florowski, T.; Sokołowska, B.; Janowicz, M.; Adamczak, L.; Pietrzak, D. Effect of High Hydrostatic Pressure on Formation and Rheological Properties of Inulin Gels. LWT 2020, 121, 108995. [Google Scholar] [CrossRef]
- Jiang, Y.; Liu, L.; Wang, B.; Yang, X.; Chen, Z.; Zhong, Y.; Zhang, L.; Mao, Z.; Xu, H.; Sui, X. Polysaccharide-Based Edible Emulsion Gel Stabilized by Regenerated Cellulose. Food Hydrocoll. 2019, 91, 232–237. [Google Scholar] [CrossRef]
- Tong, K.; Xiao, G.; Cheng, W.; Chen, J.; Sun, P. Large Amplitude Oscillatory Shear Behavior and Gelation Procedure of High and Low Acyl Gellan Gum in Aqueous Solution. Carbohydr. Polym. 2018, 199, 397–405. [Google Scholar] [CrossRef] [PubMed]
- Michalicha, A.; Pałka, K.; Roguska, A.; Pisarek, M.; Belcarz, A. Polydopamine-Coated Curdlan Hydrogel as a Potential Carrier of Free Amino Group-Containing Molecules. Carbohydr. Polym. 2020, 256, 117524. [Google Scholar] [CrossRef] [PubMed]
- Oun, A.A.; Rhim, J.-W. Carrageenan-Based Hydrogels and Films: Effect of ZnO and CuO Nanoparticles on the Physical, Mechanical, and Antimicrobial Properties. Food Hydrocoll. 2017, 67, 45–53. [Google Scholar] [CrossRef]
- Zhang, H.; Guo, H.; Liu, Y.; Shi, C.; Pan, L.; Zhang, X.; Zou, J.-J. Thixotropic Composite Hydrogels Based on Agarose and Inorganic Hybrid Gellants. Chin. J. Chem. Eng. 2022; in press. [Google Scholar] [CrossRef]
- Cui, C.; Fu, Q.; Meng, L.; Hao, S.; Dai, R.; Yang, J. Recent Progress in Natural Biopolymers Conductive Hydrogels for Flexible Wearable Sensors and Energy Devices: Materials, Structures, and Performance. ACS Appl. Bio Mater. 2021, 4, 85–121. [Google Scholar] [CrossRef]
- Seifert, A.; Freilich, S.; Kashi, Y.; Livney, Y.D. Protein-oligosaccharide Conjugates as Novel Prebiotics. Polym. Adv. Technol. 2019, 30, 2577–2585. [Google Scholar] [CrossRef]
- Bealer, E.J.; Onissema-Karimu, S.; Rivera-Galletti, A.; Francis, M.; Wilkowski, J.; Salas-de la Cruz, D.; Hu, X. Protein–Polysaccharide Composite Materials: Fabrication and Applications. Polymers 2020, 12, 464. [Google Scholar] [CrossRef]
- Zhang, Y.S.; Khademhosseini, A. Advances in Engineering Hydrogels. Science 2017, 356, eaaf3627. [Google Scholar] [CrossRef]
- Naahidi, S.; Jafari, M.; Logan, M.; Wang, Y.; Yuan, Y.; Bae, H.; Dixon, B.; Chen, P. Biocompatibility of Hydrogel-Based Scaffolds for Tissue Engineering Applications. Biotechnol. Adv. 2017, 35, 530–544. [Google Scholar] [CrossRef]
- Zhou, L.; Guo, P.; D’Este, M.; Tong, W.; Xu, J.; Yao, H.; Stoddart, M.J.; van Osch, G.J.V.M.; Ho, K.K.W.; Li, Z.; et al. Functionalized Hydrogels for Articular Cartilage Tissue Engineering. Engineering 2022, 13, 71–90. [Google Scholar] [CrossRef]
- Liang, Y.; He, J.; Guo, B. Functional Hydrogels as Wound Dressing to Enhance Wound Healing. ACS Nano 2021, 15, 12687–12722. [Google Scholar] [CrossRef] [PubMed]
- Ferreira, M.O.G.; Ribeiro, A.B.; Rizzo, M.S.; de Jesus Oliveira, A.C.; Osajima, J.A.; Estevinho, L.M.; Silva-Filho, E.C. Potential Wound Healing Effect of Gel Based on Chicha Gum, Chitosan, and Mauritia Flexuosa Oil. Biomedicines 2022, 10, 899. [Google Scholar] [CrossRef] [PubMed]
- Sabbagh, F.; Muhamad, I.I. Physical and Chemical Characterisation of Acrylamide-Based Hydrogels, Aam, Aam/NaCMC and Aam/NaCMC/MgO. J. Inorg. Organomet. Polym. Mater. 2017, 27, 1439–1449. [Google Scholar] [CrossRef]
- Marzi, M.; Rostami Chijan, M.; Zarenezhad, E. Hydrogels as Promising Therapeutic Strategy for the Treatment of Skin Cancer. J. Mol. Struct. 2022, 1262, 133014. [Google Scholar] [CrossRef]
- Li, S.; Zhang, Y.; Wang, Y.; Xia, K.; Yin, Z.; Wang, H.; Zhang, M.; Liang, X.; Lu, H.; Zhu, M.; et al. Physical Sensors for Skin-Inspired Electronics. InfoMat 2020, 2, 184–211. [Google Scholar] [CrossRef]
- Wang, M.; Li, R.; Feng, X.; Dang, C.; Dai, F.; Yin, X.; He, M.; Liu, D.; Qi, H. Cellulose Nanofiber-Reinforced Ionic Conductors for Multifunctional Sensors and Devices. ACS Appl. Mater. Interfaces 2020, 12, 27545–27554. [Google Scholar] [CrossRef] [PubMed]
- Fang, G.; Yang, X.; Wang, Q.; Zhang, A.; Tang, B. Hydrogels-Based Ophthalmic Drug Delivery Systems for Treatment of Ocular Diseases. Mater. Sci. Eng. C 2021, 127, 112212. [Google Scholar] [CrossRef] [PubMed]
- Razavi, S.M.A.; Behrouzian, F. Biopolymers for Fat-Replaced Food Design. In Biopolymers for Food Design; Elsevier: Amsterdam, The Netherlands, 2018; pp. 65–94. ISBN 9780128115015. [Google Scholar]
- Hutchings, S.C.; Low, J.Y.Q.; Keast, R.S.J. Sugar Reduction without Compromising Sensory Perception. An Impossible Dream? Crit. Rev. Food Sci. Nutr. 2019, 59, 2287–2307. [Google Scholar] [CrossRef]
- Nazir, A.; Asghar, A.; Aslam Maan, A. Chapter 13-Food Gels: Gelling Process and New Applications A2; Ahmed, J., Ed.; Elsevier Ltd.: Amsterdam, The Netherlands, 2017; ISBN 978-0-08-100431-9. [Google Scholar]
- Florowska, A.; Hilal, A.; Florowski, T. Prebiotics and Synbiotics. In Probiotics; Brandelli, A., Ed.; Elsevier: Amsterdam, The Netherlands, 2022; pp. 19–37. [Google Scholar]
- Enam, F.; Mansell, T.J. Prebiotics: Tools to Manipulate the Gut Microbiome and Metabolome. J. Ind. Microbiol. Biotechnol. 2019, 46, 1445–1459. [Google Scholar] [CrossRef]
- Tan, Y.; McClements, D.J. Plant-Based Colloidal Delivery Systems for Bioactives. Molecules 2021, 26, 6895. [Google Scholar] [CrossRef] [PubMed]
- McClements, D.J. Encapsulation, Protection, and Delivery of Bioactive Proteins and Peptides Using Nanoparticle and Microparticle Systems: A Review. Adv. Colloid Interface Sci. 2018, 253, 1–22. [Google Scholar] [CrossRef] [PubMed]
- Enrione, J.; Blaker, J.J.; Brown, D.I.; Weinstein-Oppenheimer, C.R.; Pepczynska, M.; Olguín, Y.; Sánchez, E.; Acevedo, C.A. Edible Scaffolds Based on Non-Mammalian Biopolymers for Myoblast Growth. Materials 2017, 10, 1404. [Google Scholar] [CrossRef] [PubMed]
- Tanan, W.; Panichpakdee, J.; Saengsuwan, S. Novel Biodegradable Hydrogel Based on Natural Polymers: Synthesis, Characterization, Swelling/Reswelling and Biodegradability. Eur. Polym. J. 2019, 112, 678–687. [Google Scholar] [CrossRef]
- Kang, N.W.; Yoon, S.Y.; Kim, S.; Yu, N.Y.; Park, J.H.; Lee, J.Y.; Cho, H.J.; Kim, D.D. Subcutaneously Injectable Hyaluronic Acid Hydrogel for Sustained Release of Donepezil with Reduced Initial Burst Release: Effect of Hybridization of Microstructured Lipid Carriers and Albumin. Pharmaceutics 2021, 13, 864. [Google Scholar] [CrossRef]
- Szymańska, I.; Żbikowska, A.; Onacik-Gür, S. Candelilla Wax-Based Oleogels versus Palm Oil: Evaluation of Physical Properties of Innovative and Conventional Lipids Using Optical Techniques. J. Sci. Food Agric. 2021, 102, 2309–2320. [Google Scholar] [CrossRef]
- Cristiano, M.C.; Froiio, F.; Mancuso, A.; de Gaetano, F.; Ventura, C.A.; Fresta, M.; Paolino, D. The Rheolaser MasterTM and Kinexus Rotational Rheometer® to Evaluate the Influence of Topical Drug Delivery Systems on Rheological Features of Topical Poloxamer Gel. Molecules 2020, 25, 1979. [Google Scholar] [CrossRef]
- Lima, M.B.; Domingos, F.M.; Lima, J.J.F.d.J.; Monteiro, R.d.S.; Santos, O.D.H.d.; Pereira, P.A.P. Characterization and Influence of Hydrocolloids on Low Caloric Orange Jellies. Emir. J. Food Agric. 2019, 31, 7–15. [Google Scholar] [CrossRef]
- Florowska, A.; Hilal, A.; Florowski, T.; Wroniak, M. Addition of Selected Plant-Derived Proteins as Modifiers of Inulin Hydrogels Properties. Foods 2020, 9, 845. [Google Scholar] [CrossRef]
- Sobol, Z.; Jakubowski, T.; Nawara, P. Application of the CIE L*a*b* Method for the Evaluation of the Color of Fried Products from Potato Tubers Exposed to C Band Ultraviolet Light. Sustainability 2020, 12, 3487. [Google Scholar] [CrossRef] [Green Version]
- Tang, C.; Zhang, W.; Zou, Y.; Xing, L.; Zheng, H.; Xu, X.; Zhou, G. Influence of RosA-Protein Adducts Formation on Myofibrillar Protein Gelation Properties under Oxidative Stress. Food Hydrocoll. 2017, 67, 197–205. [Google Scholar] [CrossRef]
- Florowska, A.; Florowski, T.; Sokołowska, B.; Adamczak, L.; Szymańska, I. Effects of Pressure Level and Time Treatment of High Hydrostatic Pressure (HHP) on Inulin Gelation and Properties of Obtained Hydrogels. Foods 2021, 10, 2514. [Google Scholar] [CrossRef]
- Beccard, S.; Bernard, J.; Wouters, R.; Gehrich, K.; Zielbauer, B.; Mezger, M.; Vilgis, T.A. Alteration of the Structural Properties of Inulin Gels. Food Hydrocoll. 2019, 89, 302–310. [Google Scholar] [CrossRef]
- Klost, M.; Brzeski, C.; Drusch, S. Effect of Protein Aggregation on Rheological Properties of Pea Protein Gels. Food Hydrocoll. 2020, 108, 106036. [Google Scholar] [CrossRef]
- Munialo, C.D.; Euston, S.R.; de Jongh, H.H.J. Protein Gels. In Proteins in Food Processing: Second Edition; Elsevier Inc.: Amsterdam, The Netherlands, 2018; pp. 501–521. ISBN 9780081007297. [Google Scholar]
- Cassanelli, M.; Norton, I.; Mills, T. Effect of Alcohols on Gellan Gum Gel Structure: Bridging the Molecular Level and the Three-Dimensional Network. Food Struct. 2017, 14, 112–120. [Google Scholar] [CrossRef]
- Zhou, Y.; Jiang, R.; Perkins, W.S.; Cheng, Y. Morphology Evolution and Gelation Mechanism of Alkali Induced Konjac Glucomannan Hydrogel. Food Chem. 2018, 269, 80–88. [Google Scholar] [CrossRef] [PubMed]
- Belorio, M.; Gómez, M. Psyllium: A Useful Functional Ingredient in Food Systems. Crit. Rev. Food Sci. Nutr. 2021, 62, 527–538. [Google Scholar] [CrossRef]
- Mao, Y.; Nielsen, P.; Ali, J. Passive and Active Microrheology for Biomedical Systems. Front. Bioeng. Biotechnol. 2022, 10, 916354. [Google Scholar] [CrossRef]
- Wang, K.Q.; Luo, S.Z.; Zhong, X.Y.; Cai, J.; Jiang, S.T.; Zheng, Z. Changes in Chemical Interactions and Protein Conformation during Heat-Induced Wheat Gluten Gel Formation. Food Chem. 2017, 214, 393–399. [Google Scholar] [CrossRef]
- Biesiekierski, J.R. What Is Gluten? J. Gastroenterol. Hepatol. 2017, 32, 78–81. [Google Scholar] [CrossRef] [Green Version]
- Kanyuck, K.M.; Mills, T.B.; Norton, I.T.; Norton-Welch, A.B. Temperature Influences on Network Formation of Low DE Maltodextrin Gels. Carbohydr. Polym. 2019, 218, 170–178. [Google Scholar] [CrossRef] [PubMed]
- Huamaní-Meléndez, V.J.; Mauro, M.A.; Darros-Barbosa, R. Physicochemical and Rheological Properties of Aqueous Tara Gum Solutions. Food Hydrocoll. 2020, 111, 106195. [Google Scholar] [CrossRef]
- Kees de Kruif, C.G.; Anema, S.G.; Zhu, C.; Havea, P.; Coker, C. Water Holding Capacity and Swelling of Casein Hydrogels. Food Hydrocoll. 2015, 44, 372–379. [Google Scholar] [CrossRef]
- Qayum, A.; Hussain, M.; Li, M.; Li, J.; Shi, R.; Li, T.; Anwar, A.; Ahmed, Z.; Hou, J.; Jiang, Z. Gelling, Microstructure and Water-Holding Properties of Alpha-Lactalbumin Emulsion Gel: Impact of Combined Ultrasound Pretreatment and Laccase Cross-Linking. Food Hydrocoll. 2020, 110, 106122. [Google Scholar] [CrossRef]
- Koutsopoulos, S. Self-Assembling Peptide Nanofiber Hydrogels in Tissue Engineering and Regenerative Medicine: Progress, Design Guidelines, and Applications. J. Biomed. Mater. Res. Part A 2016, 104, 1002–1016. [Google Scholar] [CrossRef]
- Li, Y.; Yang, H.Y.; Lee, D.S. Advances in Biodegradable and Injectable Hydrogels for Biomedical Applications. J. Control. Release 2021, 330, 151–160. [Google Scholar] [CrossRef]
- Feng, X.; Dai, H.; Ma, L.; Fu, Y.; Yu, Y.; Zhu, H.; Wang, H.; Sun, Y.; Tan, H.; Zhang, Y. Effect of Microwave Extraction Temperature on the Chemical Structure and Oil-Water Interface Properties of Fish Skin Gelatin. Innov. Food Sci. Emerg. Technol. 2021, 74, 102835. [Google Scholar] [CrossRef]
- Barragán-Martínez, L.P.; Román-Guerrero, A.; Vernon-Carter, E.J.; Alvarez-Ramirez, J. Impact of Fat Replacement by a Hybrid Gel (Canola Oil/Candelilla Wax Oleogel and Gelatinized Corn Starch Hydrogel) on Dough Viscoelasticity, Color, Texture, Structure, and Starch Digestibility of Sugar-Snap Cookies. Int. J. Gastron. Food Sci. 2022, 29, 100563. [Google Scholar] [CrossRef]
- Li, K.; Liu, J.Y.; Fu, L.; Li, W.J.; Zhao, Y.Y.; Bai, Y.H.; Kang, Z.L. Effect of Gellan Gum on Functional Properties of Low-Fat Chicken Meat Batters. J. Texture Stud. 2019, 50, 131–138. [Google Scholar] [CrossRef]


| Samples | Microrheology Parameters | ||
|---|---|---|---|
| SLB [nm−2] | EI × 10−2 [nm−2] | MVI × 10−4 [nm−2] | |
| PP | 0.43 ab ± 0.01 | 2.30 a ± 0.25 | 53.50 b ± 0.76 |
| WP | 0.57 b ± 0.03 | 0.55 a ± 0.05 | 13.58 a ± 2.85 |
| GG | 0.39 a ± 0.02 | 0.19 a ± 0.02 | 59.98 b ± 2.20 |
| KG | 0.34 a ± 0.13 | 3.70 a ± 1.25 | 81.58 b ± 3.75 |
| INU | 0.32 a ± 0.01 | 31.05 b ± 3.54 | 590.17 c ± 20.14 |
| MD | 0.93 c ± 0.01 | 0.11 a ± 0.01 | 0.04 a ± 0.00 |
| PS | 0.39 a ± 0.04 | 0.22 a ± 0.05 | 45.62 b ± 5.21 |
| TG | 0.94 c ± 0.01 | 0.08 a ± 0.01 | 0.25 a ± 0.01 |
| Samples | Color Parameters | |||
|---|---|---|---|---|
| L* | a* | b* | WI | |
| PP | 72.45 f ± 0.02 | 3.44 g ± 0.00 | 20.31 g ± 0.00 | 15.35 a ± 0.02 |
| WP | 68.63 e ± 0.04 | 1.30 f ± 0.03 | 20.75 g ± 0.07 | 22.68 b ± 0.01 |
| GG | 42.53 d ± 0.02 | −1.27 a ± 0.00 | −2.48 a ± 0.09 | 24.61 c ± 0.02 |
| KG | 22.69 b ± 1.32 | −0.19 d ± 0.08 | −0.58 c ± 0.37 | 42.46 d ± 1.32 |
| INU | 92.06 h ± 0.18 | −0.77 b ± 0.02 | 1.23 e ± 0.15 | 62.37 e ± 0.15 |
| MD | 90.41 g ± 0.25 | −0.44 c ± 0.02 | 0.73 d ± 0.10 | 65.60 f ± 0.25 |
| PS | 24.78 c ± 0.21 | 0.13 e ± 0.08 | 5.00 f ± 0.16 | 90.37 g ± 0.20 |
| TG | 15.37 a ± 0.44 | −0.19 d ± 0.03 | −2.00 b ± 0.10 | 91.92 h ± 0.44 |
| Samples | PP | WP | GG | KG | INU | MD | PS | TG |
|---|---|---|---|---|---|---|---|---|
| TG | 61.38 | 57.93 | 27.18 | 7.45 | 76.75 | 75.08 | 11.72 | - |
| PS | 50.17 | 46.60 | 19.31 | 5.96 | 67.38 | 65.765 | - | |
| MD | 26.84 | 29.63 | 47.98 | 67.73 | 1.75 | - | ||
| INU | 27.68 | 30.56 | 49.66 | 69.39 | - | |||
| KG | 54.08 | 50.67 | 19.96 | - | ||||
| GG | 37.89 | 35.03 | - | |||||
| WP | 4.40 | - | ||||||
| PP | - |
Publisher’s Note: MDPI stays neutral with regard to jurisdictional claims in published maps and institutional affiliations. |
© 2022 by the authors. Licensee MDPI, Basel, Switzerland. This article is an open access article distributed under the terms and conditions of the Creative Commons Attribution (CC BY) license (https://creativecommons.org/licenses/by/4.0/).
Share and Cite
Hilal, A.; Florowska, A.; Florowski, T.; Wroniak, M. A Comparative Evaluation of the Structural and Biomechanical Properties of Food-Grade Biopolymers as Potential Hydrogel Building Blocks. Biomedicines 2022, 10, 2106. https://doi.org/10.3390/biomedicines10092106
Hilal A, Florowska A, Florowski T, Wroniak M. A Comparative Evaluation of the Structural and Biomechanical Properties of Food-Grade Biopolymers as Potential Hydrogel Building Blocks. Biomedicines. 2022; 10(9):2106. https://doi.org/10.3390/biomedicines10092106
Chicago/Turabian StyleHilal, Adonis, Anna Florowska, Tomasz Florowski, and Małgorzata Wroniak. 2022. "A Comparative Evaluation of the Structural and Biomechanical Properties of Food-Grade Biopolymers as Potential Hydrogel Building Blocks" Biomedicines 10, no. 9: 2106. https://doi.org/10.3390/biomedicines10092106
APA StyleHilal, A., Florowska, A., Florowski, T., & Wroniak, M. (2022). A Comparative Evaluation of the Structural and Biomechanical Properties of Food-Grade Biopolymers as Potential Hydrogel Building Blocks. Biomedicines, 10(9), 2106. https://doi.org/10.3390/biomedicines10092106