
The Cortical Silent Period in the Cricothyroid Muscle as a Neurophysiologic Feature for Dystonia Observation: E-Field-Navigated Transcranial Magnetic (TMS) Study
 , ,
, ,  ,
, 
Abstract
:1. Introduction
2. Materials and Methods
2.1. Participants
2.2. Procedure for Electrode Positioning
2.2.1. Skin Preparation
2.2.2. Hand Region Assessment
2.2.3. Laryngeal Region Assessment
2.3. E-Field-Navigated Transcranial Magnetic Stimulator
2.4. Outcome Measures and Data Processing
2.5. Data Analysis
3. Results
4. Discussion
5. Conclusions
Author Contributions
Funding
Institutional Review Board Statement
Informed Consent Statement
Data Availability Statement
Acknowledgments
Conflicts of Interest
References
- Berardelli, A.; Rothwell, J.C.; Hallett, M.; Thompson, P.D.; Manfredi, M.; Marsden, C.D. The pathophysiology of primary dystonia. Brain 1998, 121, 1195–1212. [Google Scholar] [CrossRef] [PubMed]
- Haslinger, B.; Erhard, P.; Dresel, C.; Castrop, F.; Roettinger, M.; Ceballos-Baumann, A.O. “Silent event-related” fMRI reveals reduced sensorimotor activation in laryngeal dystonia. Neurology 2005, 65, 1562–1569. [Google Scholar] [CrossRef] [PubMed]
- Simonyan, K.; Ludlow, C.L. Abnormal Activation of the Primary Somatosensory Cortex in Spasmodic Dysphonia: An fMRI Study. Cereb. Cortex. 2010, 20, 2749–2759. [Google Scholar] [CrossRef] [PubMed]
- Ertekin, C.; Turman, B.; Tarlaci, S.; Celik, M.; Aydogdu, I.; Secil, Y.; Kiylioglu, N. Cricopharyngeal sphincter muscle responses to transcranial magnetic stimulation in normal subjects and in patients with dysphagia. Clin. Neurophysiol. 2011, 112, 86–94. [Google Scholar] [CrossRef] [PubMed]
- Rödel, R.M.V.; Olthoff, A.; Tergau, F.; Simonyan, K.; Kraemer, D.; Markus, H.; Kruse, E. Human cortical motor representation of larynx as assessed by transcranial magnetic stimulation (TMS). Laryngoscope 2004, 114, 918–922. [Google Scholar] [CrossRef]
- Espadaler, J.; Rogić, M.; Deletis, V.; Leon, A.; Quijada, C.; Conesa, G. Representation of cricothyroid muscles at the primary motor cortex (M1) in healthy subjects, mapped by navigated transcranial magnetic stimulation (nTMS). Clin. Neurophysiol. 2012, 123, 2205–2211. [Google Scholar] [CrossRef]
- Deletis, V.; Rogić, M.; Fernandez-Conejero, I.; Gabarrós, A.; Jerončić, A. Neurophysiologic markers in laryngeal muscles indicate functional anatomy of motor speech related cortical areas. Clin. Neurophysiol. 2014, 125, 1912–1922. [Google Scholar] [CrossRef]
- Rogić Vidaković, M.; Zmajević Schönwald, M.; Rotim, K.; Jurić, T.; Vulević, Z.; Tafra, R.; Banožić, A.; Hamata, Ž.; Đogaš, Z. Excitability of contralateral and ipsilateral projections of corticobulbar pathways recorded as corticobulbar motor evoked potentials of the cricothyroid muscles. Clin. Neurophysiol. 2015, 126, 1570–1577. [Google Scholar] [CrossRef]
- Deletis, V.; Fernandez-Conejero, I.; Ulkatan, S.; Costantino, P. Methodology for intraoperatively eliciting motor evoked potentials in the vocal muscles by electrical stimulation of the corticobulbar tract. Clin. Neurophysiol. 2009, 120, 336–341. [Google Scholar] [CrossRef]
- Deletis, V.; Fernández-Conejero, I.; Ulkatan, S.; Rogić, M.; Lladó Carbó, E.; Hiltzik, D. Methodology for intraoperative recording of the corticobulbar motor evoked potentials from cricothyroid muscles. Clin. Neurophysiol. 2011, 122, 1883–1889. [Google Scholar] [CrossRef]
- Chen, M.; Summers, R.L.S.; Goding, G.S.; Samargia, S.; Ludlow, C.L.; Prudente, C.N.; Kimberley, T.J. Evaluation of the Cortical Silent Period of the Laryngeal Motor Cortex in Healthy Individuals. Front. Neurosci. 2017, 11, 88. [Google Scholar] [CrossRef]
- Paulus, W.; Classen, J.; Cohen, L.G.; Large, C.H.; Di Lazzaro, V.; Nitsche, M.; Pascual-Leone, A.; Rosenow, F.; Rothwell, J.C.; Ziemann, U. State of the art: Pharmacologic effects on cortical excitability measures tested by transcranial magnetic stimulation. Brain Stimul. 2008, 1, 151–163. [Google Scholar] [CrossRef]
- Wolters, A.; Ziemann, U.; Benecke, R. The cortical silent period. In Oxford Handbook of Transcranial Stimulation; Epstein, C.M., Wassermann, E.M., Ziemann, U., Eds.; Oxford University Press: New York, NY, USA, 2008; pp. 1–23. [Google Scholar]
- Chen, M.; Summers, R.L.S.; Prudente, C.N.; Goding, G.S.; Samargia-Grivette, S.; Ludlow, C.L.; Kimberley, T.J. Transcranial magnetic stimulation and functional magnet resonance imaging evaluation of adductor spasmodic dysphonia during phonation. Brain Stimul. 2020, 13, 908–915. [Google Scholar] [CrossRef]
- Hannula, H.; Ilmoniemi, R.J. Basic Principles of Navigated TMS. In Navigated Transcranial Magnetic Stimulation in Neurosurgery; Krieg, S.M., Ed.; Springer: Cham, Switzerland, 2017. [Google Scholar]
- Šoda, J.; Pavelin, S.; Vujović, I.; Rogić Vidaković, M. Assessment of Motor Evoked Potentials in Multiple Sclerosis. Sensors 2023, 23, 497. [Google Scholar] [CrossRef]
- Ruohonen, J.; Karhu, J. Navigated transcranial magnetic stimulation. Neurophysiol. Clin. 2010, 40, 7–17. [Google Scholar] [CrossRef]
- Rossini, P.M.; Burke, D.; Chen, R.; Cohen, L.G.; Daskalakis, Z.; Di Iorio, R.; Di Lazzaro, V.; Ferreri, F.; Fitzgerald, P.B.; George, M.S.; et al. Non-invasive electrical and magnetic stimulation of the brain, spinal cord, roots and peripheral nerves: Basic principles and procedures for routine clinical and research application. An updated report from an I.F.C.N. Committee. Clin. Neurophysiol. 2015, 126, 1071–1107. [Google Scholar] [CrossRef]
- Šoda, J.; Rogić Vidaković, M.; Lorincz, J.; Jerković, A.; Vujović, I. Novel Latency Estimation Algorithm of Motor Evoked Potential Signals. IEEE Access 2020, 8, 193356–193374. [Google Scholar] [CrossRef]
- Merton, P.A.; Morton, H.B. Stimulation of the cerebral cortex in the intact human subject. Nature 1980, 285, 227. [Google Scholar] [CrossRef]
- Zeugin, D.; Ionta, S. Anatomo-Functional Origins of the Cortical Silent Period: Spotlight on the Basal Ganglia. Brain Sci. 2021, 11, 705. [Google Scholar] [CrossRef]
- Chen, R.; Lozano, A.M.; Ashby, P. Mechanism of the silent period following transcranial magnetic stimulation. Evidence from epidural recordings. Exp. Brain Res. 1999, 128, 539–542. [Google Scholar] [CrossRef]
- Kimiskidis, V.K.; Papagiannopoulos, S.; Sotirakoglou, K.; Kazis, D.A.; Kazis, A.; Mills, K.R. Silent period to transcranial magnetic stimulation: Construction and properties of stimulus-response curves in healthy volunteers. Exp. Brain Res. 2005, 163, 21–31. [Google Scholar] [CrossRef] [PubMed]
- Werhahn, K.J.; Classen, J.; Benecke, R. The silent period induced by transcranial magnetic stimulation in muscles supplied by cranial nerves: Normal data and changes in patients. J. Neurol. Neurosurg. Psychiatr. 1995, 59, 586–596. [Google Scholar] [CrossRef] [PubMed]
- Paradiso, G.O.; Cunic, D.I.; Gunraj, C.A.; Chen, R. Representation of facial muscles in human motor cortex. J. Physiol. 2005, 567, 323–336. [Google Scholar] [CrossRef] [PubMed]
- Katayama, T.; Aizawa, H.; Kuroda, K.; Suzuki, Y.; Kikuchi, K.; Kimura, T.; Hashimoto, K.; Yahara, O. Cortical silent period in the tongue induced by transcranial magnetic stimulation. J. Neurol. Sci. 2001, 193, 37–41. [Google Scholar] [CrossRef]
- Nieminen, E.A.; Nieminen, J.O.; Stenroos, M.; Novikov, P.; Nazarova, M.; Vaalto, S.; Nikulin, V.; Ilmoniemi, R.J. Accuracy and precision of navigated transcranial magnetic stimulation. J. Neural Eng. 2022, 19, 066037. [Google Scholar] [CrossRef]
- Sollmann, N.; Goblirsch-Kolb, M.F.; Ille, S.; Butenschoen, V.M.; Boeckh-Behrens, T.; Meyer, B.; Ringel, F.; Krieg, S.M. Comparison between electric-field-navigated and line-navigated TMS for cortical motor mapping in patients with brain tumors. Acta Neurochir. 2016, 158, 2277–2289. [Google Scholar] [CrossRef]

| Mean ± SD (ms) | t-Test | p-Value | ||
|---|---|---|---|---|
| RMT Intensity for APB (%) | Right hemisphere | 33.66 ± 5.40 | t = 0.98 | 0.33 |
| Left hemisphere | 35.83 ± 6.91 | |||
| MEP Latency APB (ms) | Right hand | 23.53 ± 1.71 | t = 0.94 | 0.35 |
| Left hand | 22.91 ± 2.10 | |||
| MEP Amplitude APB (μV) | Right hand | 298.05 ± 221.83 | t = 0.86 | 0.39 |
| Left hand | 238.93 ± 155.88 | |||
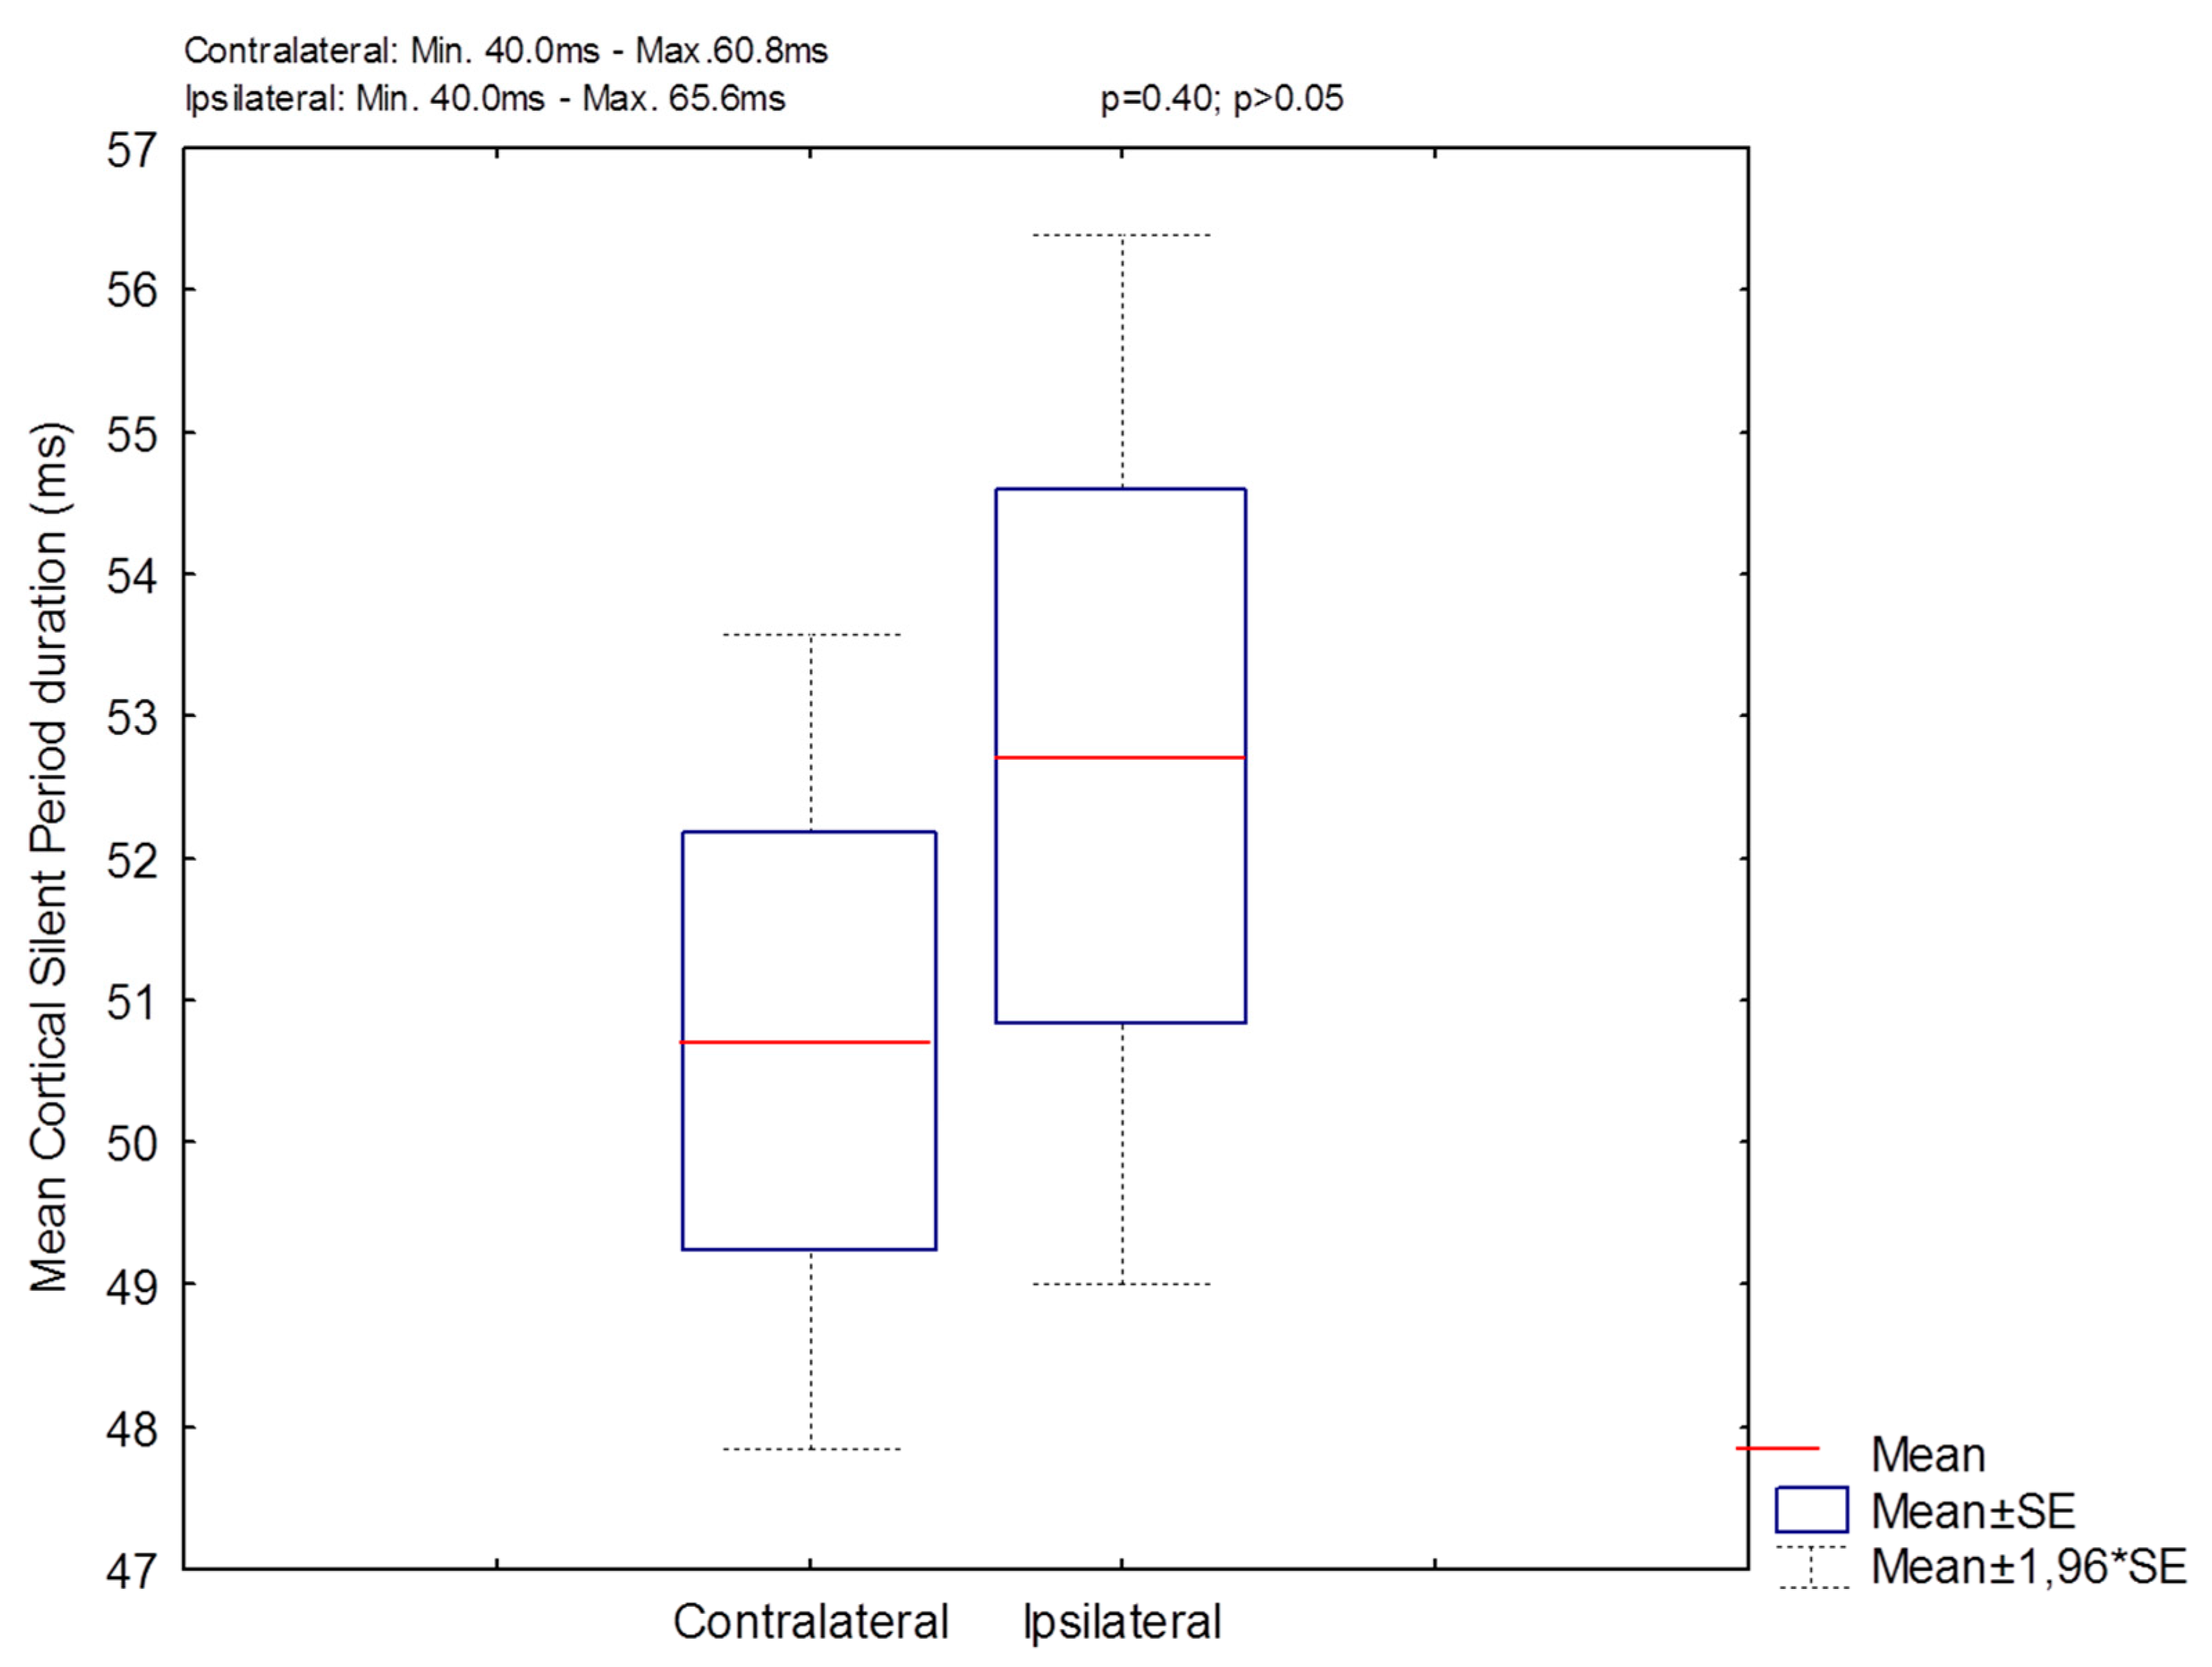
| cSP Duration CT (ms) | Contralateral | 50.71 ± 6.19 | t = −0.85 | 0.40 |
| Ipsilateral | 52.70 ± 7.04 | |||
| MEP Amplitude CT (μV) | Contralateral | 972.70 ± 656.47 | t = −0.91 | 0.36 |
| Ipsilateral | 1234.34 ± 961.88 | |||
| LMC Intensity (%) | Contralateral | 55.76 ± 10.62 | t = 1.20 | 0.23 |
| Ipsilateral | 51.50 ± 8.83 | |||
Disclaimer/Publisher’s Note: The statements, opinions and data contained in all publications are solely those of the individual author(s) and contributor(s) and not of MDPI and/or the editor(s). MDPI and/or the editor(s) disclaim responsibility for any injury to people or property resulting from any ideas, methods, instructions or products referred to in the content. |
© 2023 by the authors. Licensee MDPI, Basel, Switzerland. This article is an open access article distributed under the terms and conditions of the Creative Commons Attribution (CC BY) license (https://creativecommons.org/licenses/by/4.0/).
Share and Cite
Konstantinović, I.; Bošković, B.; Šoda, J.; Dolić, K.; Đogaš, Z.; Lapčić, M.; Ledenko, V.; Vrgoč, T.; Rogić Vidaković, M. The Cortical Silent Period in the Cricothyroid Muscle as a Neurophysiologic Feature for Dystonia Observation: E-Field-Navigated Transcranial Magnetic (TMS) Study. Biomedicines 2023, 11, 1373. https://doi.org/10.3390/biomedicines11051373
Konstantinović I, Bošković B, Šoda J, Dolić K, Đogaš Z, Lapčić M, Ledenko V, Vrgoč T, Rogić Vidaković M. The Cortical Silent Period in the Cricothyroid Muscle as a Neurophysiologic Feature for Dystonia Observation: E-Field-Navigated Transcranial Magnetic (TMS) Study. Biomedicines. 2023; 11(5):1373. https://doi.org/10.3390/biomedicines11051373
Chicago/Turabian StyleKonstantinović, Ivan, Braco Bošković, Joško Šoda, Krešimir Dolić, Zoran Đogaš, Mirko Lapčić, Vlatko Ledenko, Toni Vrgoč, and Maja Rogić Vidaković. 2023. "The Cortical Silent Period in the Cricothyroid Muscle as a Neurophysiologic Feature for Dystonia Observation: E-Field-Navigated Transcranial Magnetic (TMS) Study" Biomedicines 11, no. 5: 1373. https://doi.org/10.3390/biomedicines11051373