
Detection of PTCH1 Copy-Number Variants in Mosaic Basal Cell Nevus Syndrome
 , and
, and
Abstract
1. Introduction
2. Materials and Methods
2.1. Patients and DNA Samples
2.2. PCR and Sanger Sequencing
2.3. MLPA
2.4. ddPCR
3. Results
3.1. Sanger Sequencing
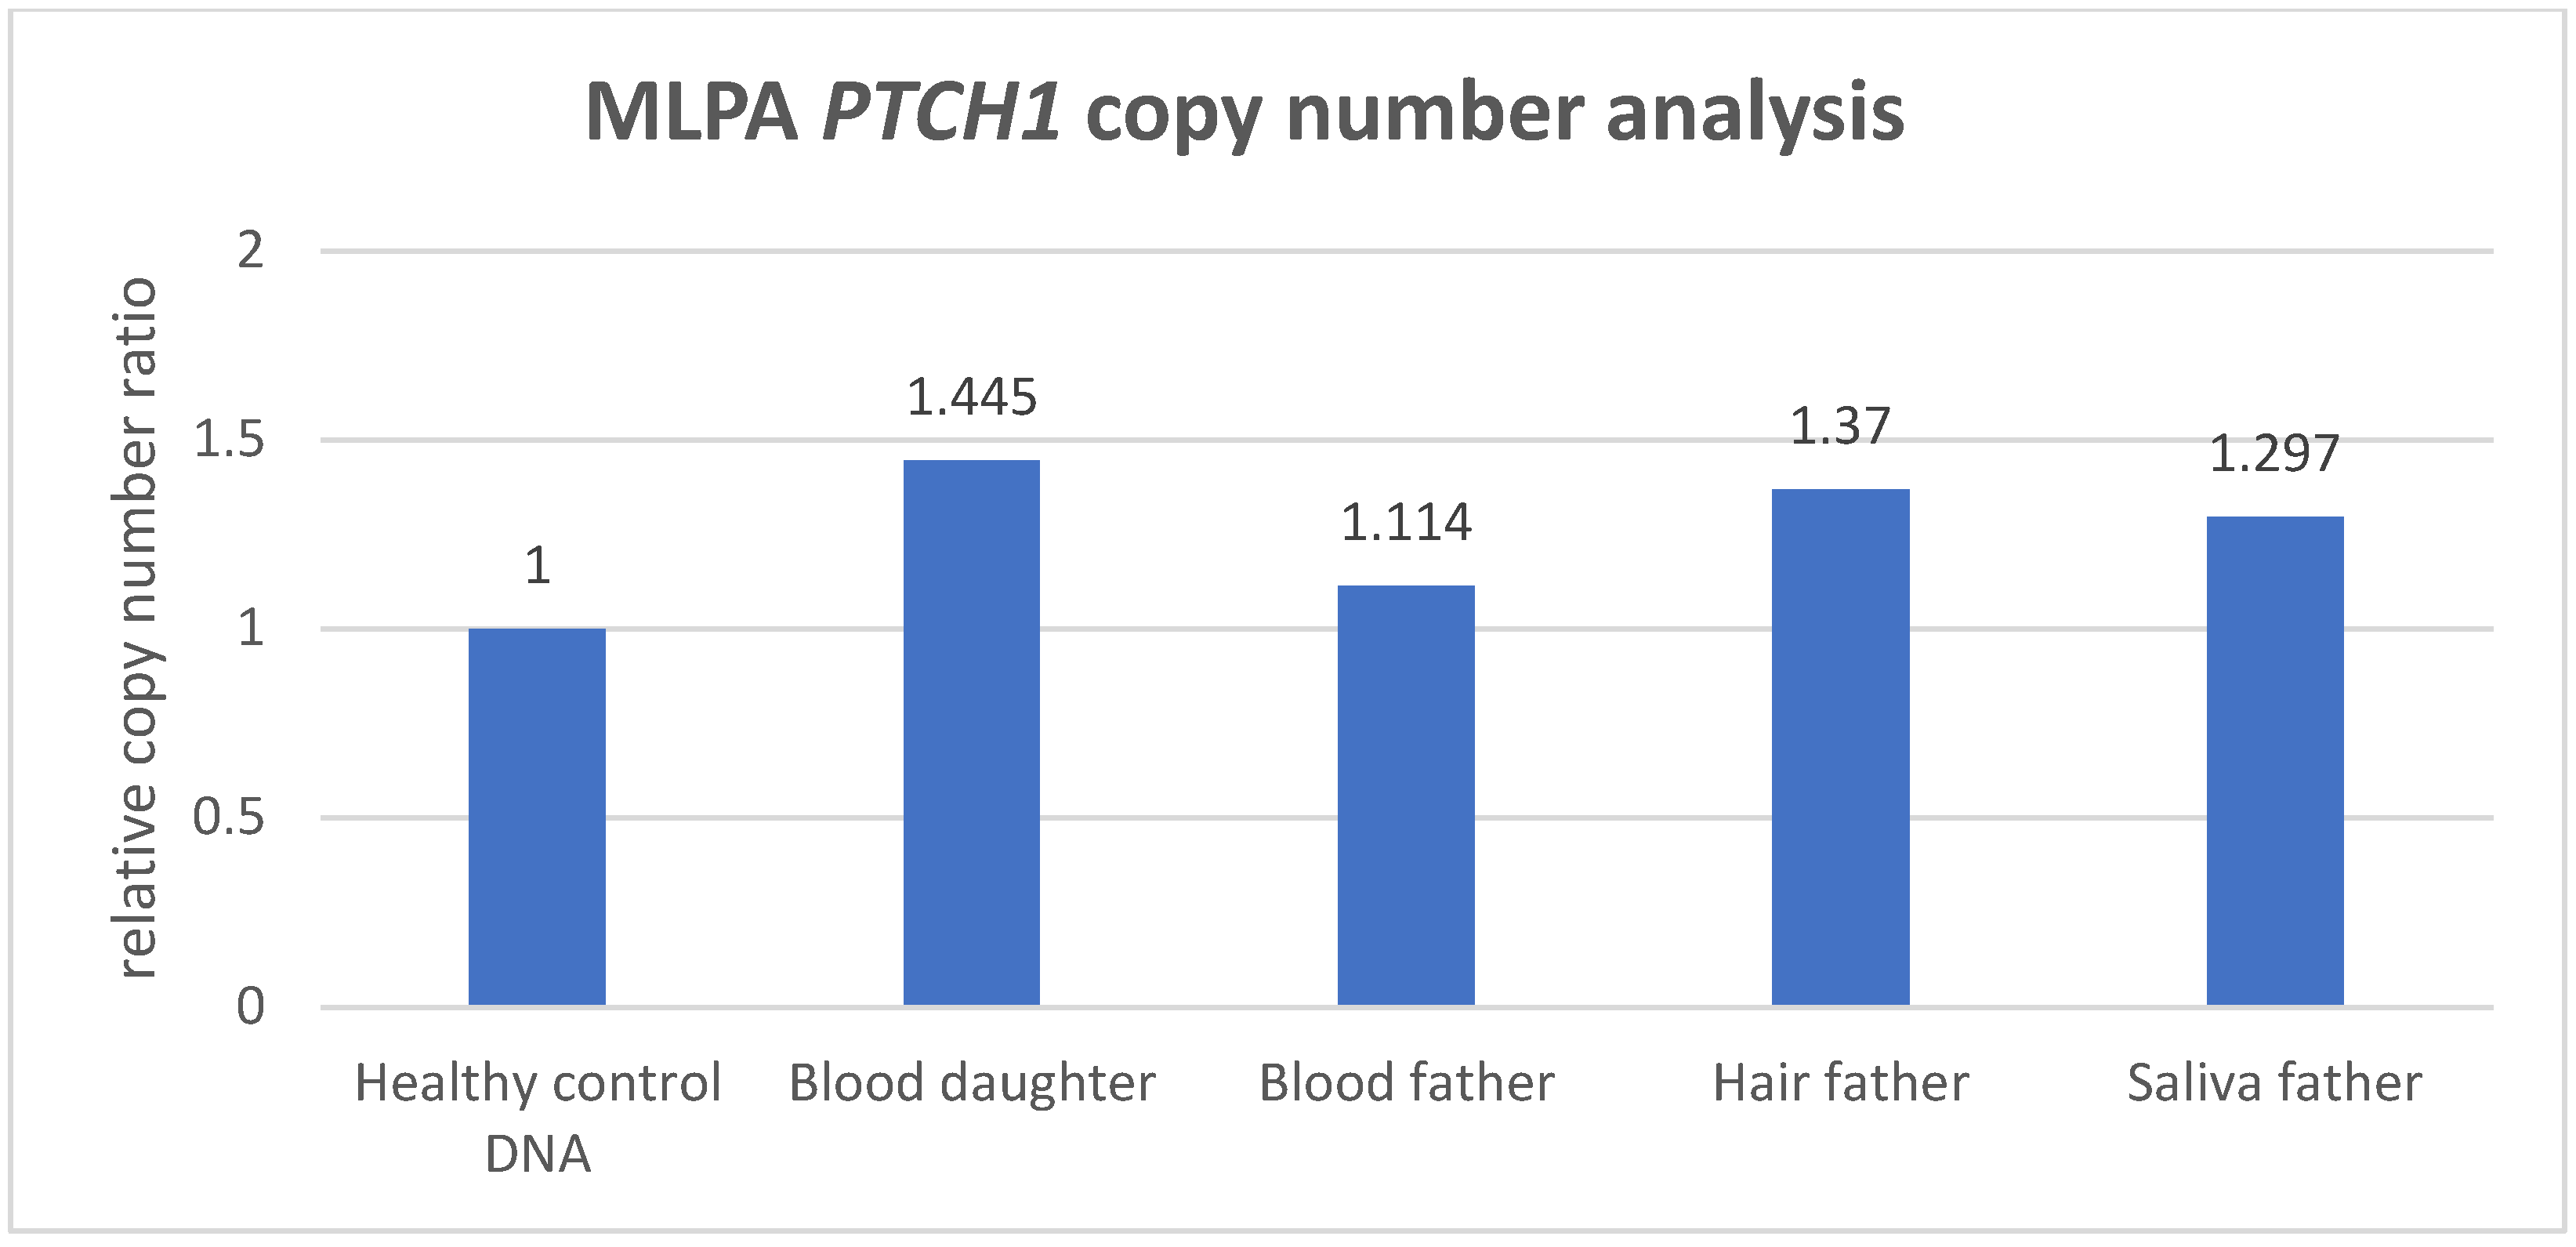
3.2. MLPA Analysis
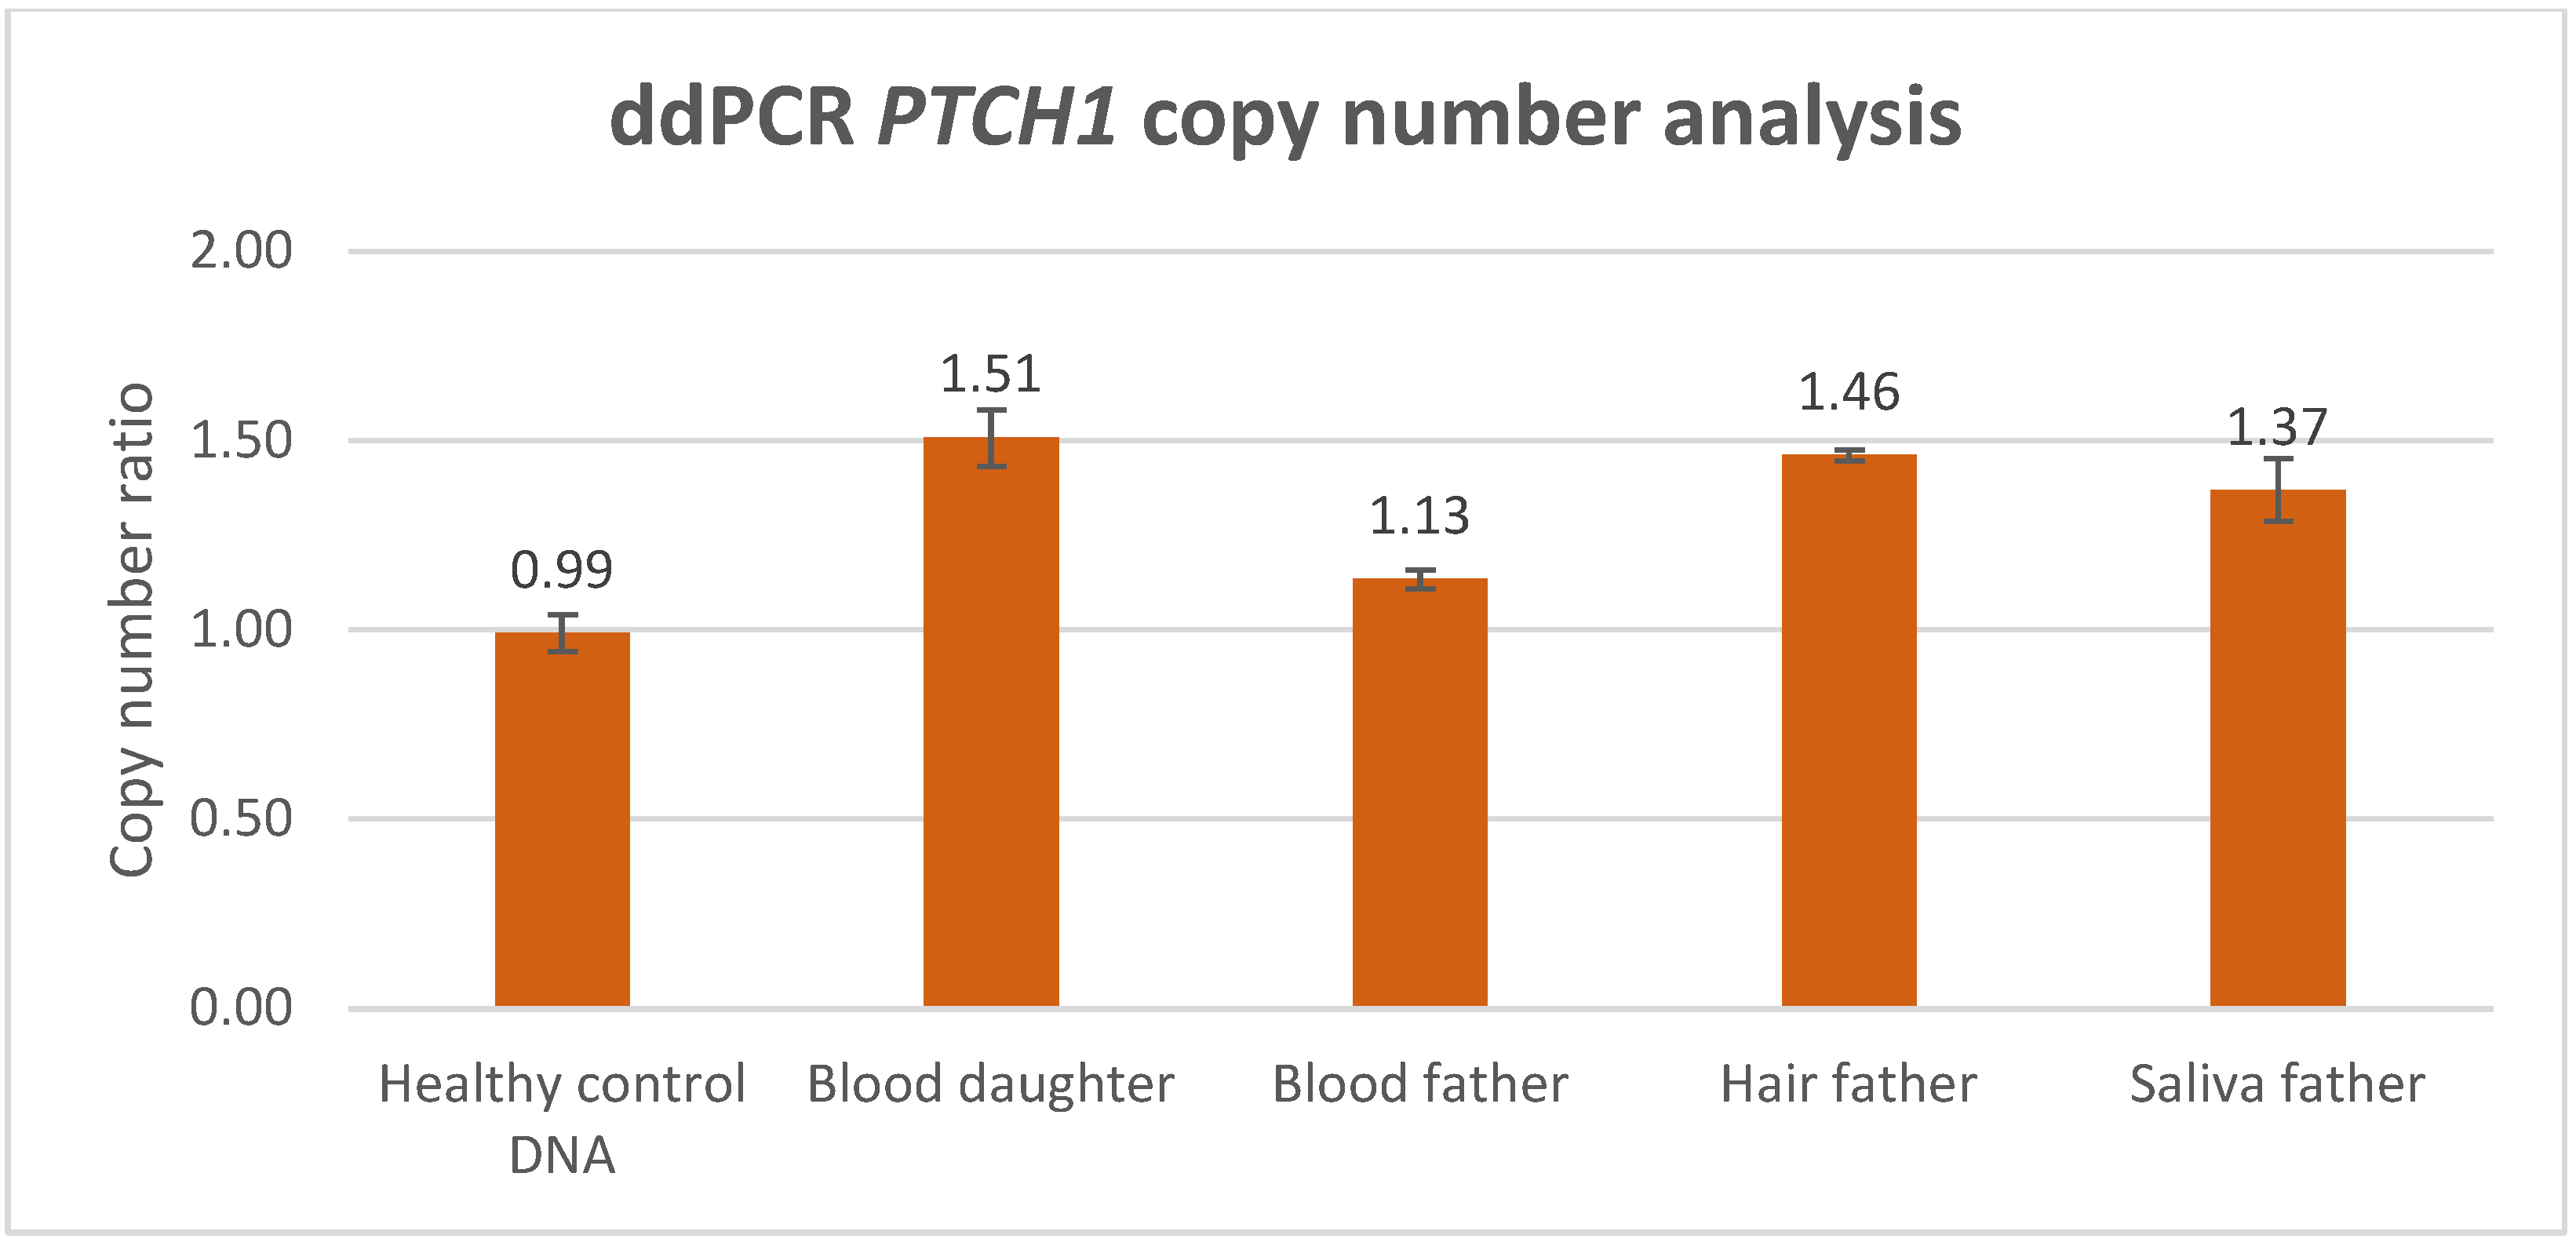
3.3. ddPCR Analysis
4. Discussion
Supplementary Materials
Author Contributions
Funding
Institutional Review Board Statement
Informed Consent Statement
Data Availability Statement
Conflicts of Interest
References
- Verkouteren, B.J.A.; Cosgun, B.; Reinders, M.; Kessler, P.; Vermeulen, R.J.; Klaassens, M.; Lambrechts, S.; van Rheenen, J.R.; van Geel, M.; Vreeburg, M.; et al. A guideline for the clinical management of basal cell naevus syndrome (Gorlin-Goltz syndrome). Br. J. Dermatol. 2022, 186, 215–226. [Google Scholar] [CrossRef]
- Fujii, K.; Ohashi, H.; Suzuki, M.; Hatsuse, H.; Shiohama, T.; Uchikawa, H.; Miyashita, T. Frameshift mutation in the PTCH2 gene can cause nevoid basal cell carcinoma syndrome. Fam. Cancer 2013, 12, 611–614. [Google Scholar] [CrossRef]
- Smith, M.J.; Beetz, C.; Williams, S.G.; Bhaskar, S.S.; O’Sullivan, J.; Anderson, B.; Daly, S.B.; Urquhart, J.E.; Bholah, Z.; Oudit, D.; et al. Germline mutations in SUFU cause Gorlin syndrome-associated childhood medulloblastoma and redefine the risk associated with PTCH1 mutations. J. Clin. Oncol. 2014, 32, 4155–4161. [Google Scholar] [CrossRef]
- Smith, M.J.; Evans, D.G. PTCH2 is not a strong candidate gene for gorlin syndrome predisposition. Fam. Cancer 2022, 21, 343–346. [Google Scholar] [CrossRef]
- Jia, Y.; Wang, Y.; Xie, J. The Hedgehog pathway: Role in cell differentiation, polarity and proliferation. Arch. Toxicol. 2015, 89, 179–191. [Google Scholar] [CrossRef]
- Cano, R.; Abad, M.E.; Schanze, D.; Zenker, M.; Serafin, E.; Larralde, M. Happle-Tinschert syndrome variable phenotype as part of the mosaic hedgehog spectrum: Report of three cases. Pediatr. Dermatol. 2023, 40, 691–694. [Google Scholar] [CrossRef]
- Okamoto, N.; Naruto, T.; Kohmoto, T.; Komori, T.; Imoto, I. A novel PTCH1 mutation in a patient with Gorlin syndrome. Hum. Genome Var. 2014, 1, 14022. [Google Scholar] [CrossRef]
- Fokkema, I.; Kroon, M.; López Hernández, J.A.; Asscheman, D.; Lugtenburg, I.; Hoogenboom, J.; den Dunnen, J.T. The LOVD3 platform: Efficient genome-wide sharing of genetic variants. Eur. J. Hum. Genet. 2021, 29, 1796–1803. [Google Scholar] [CrossRef]
- Eijkelenboom, A.; Tops, B.B.J.; van den Berg, A.; van den Brule, A.J.C.; Dinjens, W.N.M.; Dubbink, H.J.; Ter Elst, A.; Geurts-Giele, W.R.R.; Groenen, P.; Groenendijk, F.H.; et al. Recommendations for the clinical interpretation and reporting of copy number gains using gene panel NGS analysis in routine diagnostics. Virchows Arch. 2019, 474, 673–680. [Google Scholar] [CrossRef]
- Oscorbin, I.; Kechin, A.; Boyarskikh, U.; Filipenko, M. Multiplex ddPCR assay for screening copy number variations in BRCA1 gene. Breast Cancer Res. Treat. 2019, 178, 545–555. [Google Scholar] [CrossRef]
- Stuppia, L.; Antonucci, I.; Palka, G.; Gatta, V. Use of the MLPA assay in the molecular diagnosis of gene copy number alterations in human genetic diseases. Int. J. Mol. Sci. 2012, 13, 3245–3276. [Google Scholar] [CrossRef]
- Singh, A.K.; Olsen, M.F.; Lavik, L.A.S.; Vold, T.; Drabløs, F.; Sjursen, W. Detecting copy number variation in next generation sequencing data from diagnostic gene panels. BMC Med. Genomics 2021, 14, 214. [Google Scholar] [CrossRef]
- Fu, X.; Shi, Y.; Ma, J.; Zhang, K.; Wang, G.; Li, G.; Xiao, L.; Wang, H. Advances of multiplex ligation-dependent probe amplification technology in molecular diagnostics. Biotechniques 2022, 73, 205–213. [Google Scholar] [CrossRef]
- Gajecka, M. Unrevealed mosaicism in the next-generation sequencing era. Mol. Genet. Genomics 2016, 291, 513–530. [Google Scholar] [CrossRef]
- Cusenza, V.Y.; Bisagni, A.; Rinaldini, M.; Cattani, C.; Frazzi, R. Copy Number Variation and Rearrangements Assessment in Cancer: Comparison of Droplet Digital PCR with the Current Approaches. Int. J. Mol. Sci. 2021, 22, 4732. [Google Scholar] [CrossRef]
- van Veghel-Plandsoen, M.M.; Wouters, C.H.; Kromosoeto, J.N.; den Ridder-Klünnen, M.C.; Halley, D.J.; van den Ouweland, A.M. Multiplex ligation-depending probe amplification is not suitable for detection of low-grade mosaicism. Eur. J. Hum. Genet. 2011, 19, 1009–1012. [Google Scholar] [CrossRef]
- Evans, D.G.; Ramsden, R.T.; Shenton, A.; Gokhale, C.; Bowers, N.L.; Huson, S.M.; Pichert, G.; Wallace, A. Mosaicism in neurofibromatosis type 2: An update of risk based on uni/bilaterality of vestibular schwannoma at presentation and sensitive mutation analysis including multiple ligation-dependent probe amplification. J. Med. Genet. 2007, 44, 424–428. [Google Scholar] [CrossRef]
- Zhang, X.; Wang, B.; Zhang, L.; You, G.; Palais, R.A.; Zhou, L.; Fu, Q. Accurate diagnosis of spinal muscular atrophy and 22q11.2 deletion syndrome using limited deoxynucleotide triphosphates and high-resolution melting. BMC Genom. 2018, 19, 485. [Google Scholar] [CrossRef]
- Abdool, A.; Donahue, A.C.; Wohlgemuth, J.G.; Yeh, C.H. Detection, analysis and clinical validation of chromosomal aberrations by multiplex ligation-dependent probe amplification in chronic leukemia. PLoS ONE 2010, 5, e15407. [Google Scholar] [CrossRef]
- Villamon, E.; Piqueras, M.; Berbegall, A.P.; Tadeo, I.; Castel, V.; Navarro, S.; Noguera, R. Comparative study of MLPA-FISH to determine DNA copy number alterations in neuroblastic tumors. Histol. Histopathol. 2011, 26, 343–350. [Google Scholar] [CrossRef]
- Van Opstal, D.; Boter, M.; de Jong, D.; van den Berg, C.; Brüggenwirth, H.T.; Wildschut, H.I.; de Klein, A.; Galjaard, R.J. Rapid aneuploidy detection with multiplex ligation-dependent probe amplification: A prospective study of 4000 amniotic fluid samples. Eur. J. Hum. Genet. 2009, 17, 112–121. [Google Scholar] [CrossRef]
- Zang, M.; Zou, D.; Yu, Z.; Li, F.; Yi, S.; Ai, X.; Qin, X.; Feng, X.; Zhou, W.; Xu, Y.; et al. Detection of recurrent cytogenetic aberrations in multiple myeloma: A comparison between MLPA and iFISH. Oncotarget 2015, 6, 34276–34287. [Google Scholar] [CrossRef]
- Reinders, M.; Boersma, H.J.; Leter, E.M.; Vreeburg, M.; Paulussen, A.D.C.; Arits, A.; Roemen, G.; Speel, E.J.M.; Steijlen, P.M.; van Geel, M.; et al. Postzygotic mosaicism in basal cell naevus syndrome. Br. J. Dermatol. 2017, 177, 249–252. [Google Scholar] [CrossRef]
- Zhou, B.; Haney, M.S.; Zhu, X.; Pattni, R.; Abyzov, A.; Urban, A.E. Detection and Quantification of Mosaic Genomic DNA Variation in Primary Somatic Tissues Using ddPCR: Analysis of Mosaic Transposable-Element Insertions, Copy-Number Variants, and Single-Nucleotide Variants. Methods Mol. Biol. 2018, 1768, 173–190. [Google Scholar] [CrossRef]
- Jamuar, S.S.; Tan, E.C. Clinical application of next-generation sequencing for Mendelian diseases. Hum. Genom. 2015, 9, 10. [Google Scholar] [CrossRef]
- Abyzov, A.; Mariani, J.; Palejev, D.; Zhang, Y.; Haney, M.S.; Tomasini, L.; Ferrandino, A.F.; Rosenberg Belmaker, L.A.; Szekely, A.; Wilson, M.; et al. Somatic copy number mosaicism in human skin revealed by induced pluripotent stem cells. Nature 2012, 492, 438–442. [Google Scholar] [CrossRef]
- Hughesman, C.B.; Lu, X.J.; Liu, K.Y.; Zhu, Y.; Poh, C.F.; Haynes, C. A Robust Protocol for Using Multiplexed Droplet Digital PCR to Quantify Somatic Copy Number Alterations in Clinical Tissue Specimens. PLoS ONE 2016, 11, e0161274. [Google Scholar] [CrossRef]


| Probe | Amplicon Context Sequence | Probe Region |
|---|---|---|
| FAM-labeled PTCH1 probe | CACAGCACACAGGAGGCTGGCTGGGCCAAGCCTGGG GGCCGGGTGGCATTTGTCAACGGACAGCAGATAAAT GGCTCCTTTAGTACCTGAGTTGTTGCAGCGTTAAAGG AAATTCCGATCAAT | exon 10–intron 10 (NM_000264.5) |
| HEX-labeled EIF2C1 probe | GAGGGCTACTACCACCCGCTGGGGGGTGGGCGCGAG GTCTGGTTCGGCTTTCACCAGTCTGTGCGCCCTGCCAT GTGGAAGATGATGCTCAACATTGATGGTGAGTG GGGAGAGCTATGGAGC | exon 5–intron 5 (NM_012199.5) |
Disclaimer/Publisher’s Note: The statements, opinions and data contained in all publications are solely those of the individual author(s) and contributor(s) and not of MDPI and/or the editor(s). MDPI and/or the editor(s) disclaim responsibility for any injury to people or property resulting from any ideas, methods, instructions or products referred to in the content. |
© 2024 by the authors. Licensee MDPI, Basel, Switzerland. This article is an open access article distributed under the terms and conditions of the Creative Commons Attribution (CC BY) license (https://creativecommons.org/licenses/by/4.0/).
Share and Cite
Roemen, G.M.J.M.; Theunissen, T.E.J.; Hoezen, W.W.J.; Steyls, A.R.M.; Paulussen, A.D.C.; Mosterd, K.; Rahikkala, E.; zur Hausen, A.; Speel, E.J.M.; van Geel, M. Detection of PTCH1 Copy-Number Variants in Mosaic Basal Cell Nevus Syndrome. Biomedicines 2024, 12, 330. https://doi.org/10.3390/biomedicines12020330
Roemen GMJM, Theunissen TEJ, Hoezen WWJ, Steyls ARM, Paulussen ADC, Mosterd K, Rahikkala E, zur Hausen A, Speel EJM, van Geel M. Detection of PTCH1 Copy-Number Variants in Mosaic Basal Cell Nevus Syndrome. Biomedicines. 2024; 12(2):330. https://doi.org/10.3390/biomedicines12020330
Chicago/Turabian StyleRoemen, Guido M. J. M., Tom E. J. Theunissen, Ward W. J. Hoezen, Anja R. M. Steyls, Aimee D. C. Paulussen, Klara Mosterd, Elisa Rahikkala, Axel zur Hausen, Ernst Jan M. Speel, and Michel van Geel. 2024. "Detection of PTCH1 Copy-Number Variants in Mosaic Basal Cell Nevus Syndrome" Biomedicines 12, no. 2: 330. https://doi.org/10.3390/biomedicines12020330
APA StyleRoemen, G. M. J. M., Theunissen, T. E. J., Hoezen, W. W. J., Steyls, A. R. M., Paulussen, A. D. C., Mosterd, K., Rahikkala, E., zur Hausen, A., Speel, E. J. M., & van Geel, M. (2024). Detection of PTCH1 Copy-Number Variants in Mosaic Basal Cell Nevus Syndrome. Biomedicines, 12(2), 330. https://doi.org/10.3390/biomedicines12020330