

GDF-15 Levels and Other Laboratory Findings as Predictors of COVID-19 Severity and Mortality: A Pilot Study

 , , , , ,
  , , and
Abstract
1. Introduction
1.1. GDF-15 Expression and Its Role as an Immune Mediator
1.2. GDF-15 and COVID-19
1.3. Study Design, Objectives, and Hypothesis
2. Materials and Methods
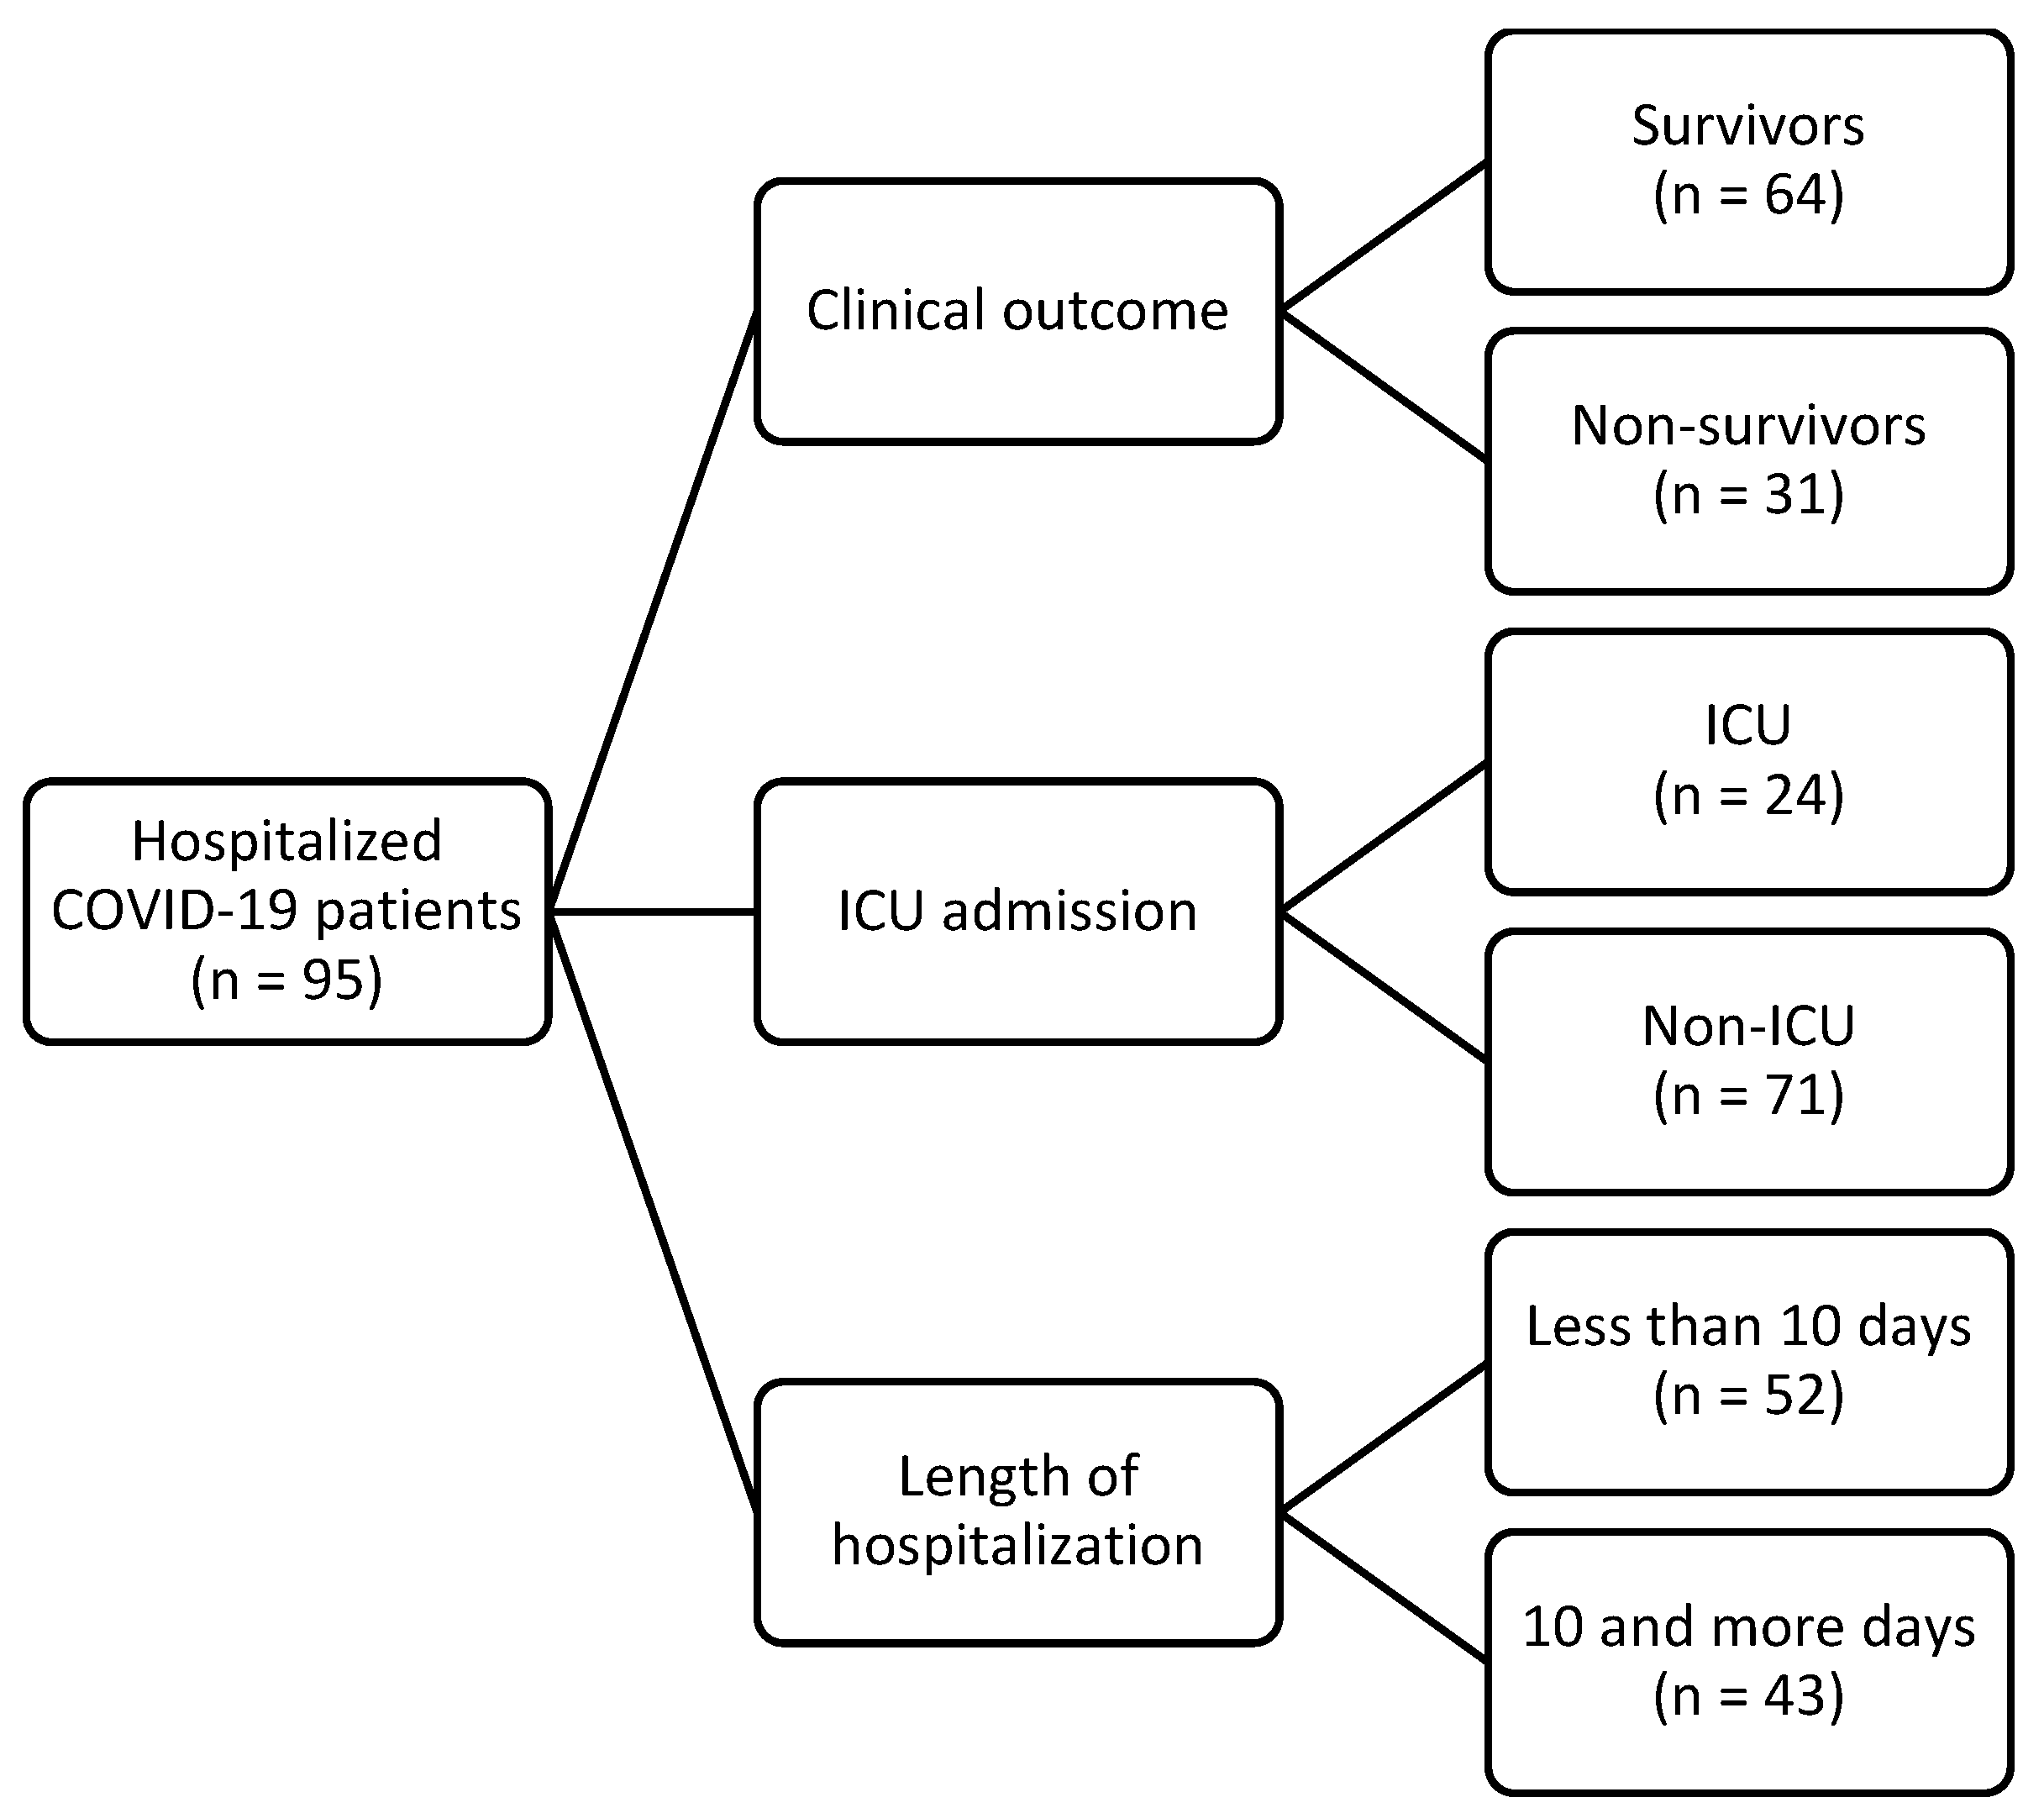
2.1. Participants
2.2. Methods
2.3. Statistical Methods
3. Results
4. Discussion
4.1. Findings Regarding GDF-15
4.2. Highlighted Findings on Other Laboratory Parameters
4.3. The Study’s Limitations
5. Conclusions
Author Contributions
Funding
Institutional Review Board Statement
Informed Consent Statement
Data Availability Statement
Acknowledgments
Conflicts of Interest
References
- Wischhusen, J.; Melero, I.; Fridman, W.H. Growth/Differentiation Factor-15 (GDF-15): From Biomarker to Novel Targetable Immune Checkpoint. Front. Immunol. 2020, 11, 951. [Google Scholar] [CrossRef] [PubMed]
- Modi, A.; Dwivedi, S.; Roy, D.; Khokhar, M.; Purohit, P.; Vishnoi, J.; Pareek, P.; Sharma, S.; Sharma, P.; Misra, S. Growth differentiation factor 15 and its role in carcinogenesis: An update. Growth Factors 2019, 37, 190–207. [Google Scholar] [CrossRef]
- Moore, A.G.; Brown, D.A.; Fairlie, W.D.; Bauskin, A.R.; Brown, P.K.; Munier, M.L.C.; Russell, P.K.; Salamonsen, L.A.; Wallace, E.M.; Breit, S.N. The transforming growth factor-ss superfamily cytokine macrophage inhibitory cytokine-1 is present in high concentrations in the serum of pregnant women. J. Clin. Endocrinol. Metab. 2000, 85, 4781–4788. [Google Scholar] [CrossRef]
- Lockhart, S.M.; Saudek, V.; O’Rahilly, S. GDF15: A Hormone Conveying Somatic Distress to the Brain. Endocr. Rev. 2020, 41, 610–642. [Google Scholar] [CrossRef]
- Siddiqui, J.A.; Pothuraju, R.; Khan, P.; Sharma, G.; Muniyan, S.; Seshacharyulu, P.; Jain, M.; Nasser, M.W.; Batra, S.K. Pathophysiological role of growth differentiation factor 15 (GDF15) in obesity, cancer, and cachexia. Cytokine Growth Factor. Rev. 2022, 64, 71–83. [Google Scholar] [CrossRef] [PubMed]
- Chen, L.; Zheng, S. Understand variability of COVID-19 through population and tissue variations in expression of SARS-CoV-2 host genes. Inform. Med. Unlocked 2020, 21, 100443. [Google Scholar] [CrossRef] [PubMed]
- Conte, M.; Giuliani, C.; Chiariello, A.; Iannuzzi, V.; Franceschi, C.; Salvioli, S. GDF15, an emerging key player in human aging. Ageing Res. Rev. 2022, 75, 101569. [Google Scholar] [CrossRef] [PubMed]
- Rochette, L.; Dogon, G.; Zeller, M.; Cottin, Y.; Vergely, C. GDF15 and Cardiac Cells: Current Concepts and New Insights. Int. J. Mol. Sci. 2021, 22, 8889. [Google Scholar] [CrossRef] [PubMed]
- Adela, R.; Banerjee, S.K. GDF-15 as a Target and Biomarker for Diabetes and Cardiovascular Diseases: A Translational Prospective. J. Diabetes Res. 2015, 2015, 490842. [Google Scholar] [CrossRef] [PubMed]
- He, Y.W.; He, C.S. Association of Growth and Differentiation Factor 15 in Rheumatoid Arthritis. J. Inflamm. Res. 2022, 15, 1173–1181. [Google Scholar] [CrossRef]
- Sarıyıldız, M.A.; Yazmalar, L.; Batmaz, I.; Alpaycı, M.; Burkan, Y.K.; Sula, B.; Kaplan, I.; Yıldız, M.; Akar, Z.A.; Bozkurt, M. Serum GDF-15 level in Behçet’s disease: Relationships between disease activity and clinical parameters. Int. J. Dermatol. 2016, 55, 1289–1294. [Google Scholar] [CrossRef] [PubMed]
- Wan, Y.; Fu, J. GDF15 as a key disease target and biomarker: Linking chronic lung diseases and ageing. Mol. Cell Biochem. 2023, 1, 453–466. [Google Scholar] [CrossRef] [PubMed]
- Ebihara, T.; Matsumoto, H.; Matsubara, T.; Togami, Y.; Nakao, S.; Matsuura, H.; Kojima, T.; Sugihara, F.; Okuzaki, D.; Hirata, H.; et al. Cytokine Elevation in Severe COVID-19 From Longitudinal Proteomics Analysis: Comparison With Sepsis. Front. Immunol. 2022, 12, 798338. [Google Scholar] [CrossRef] [PubMed]
- Gisby, J.; Clarke, C.L.; Medjeral-Thomas, N.; Malik, T.H.; Papadaki, A.; Mortimer, P.M.; Buang, N.B.; Lewis, S.; Pereira, M.; Toulza, F.; et al. Longitudinal proteomic profiling of dialysis patients with COVID-19 reveals markers of severity and predictors of death. eLife 2021, 10, e64827. [Google Scholar] [CrossRef]
- Díaz-Troyano, N.; Gabriel-Medina, P.; Weber, S.; Klammer, M.; Barquín-DelPino, R.; Castillo-Ribelles, L.; Esteban, A.; Hernández-González, M.; Ferrer-Costa, R.; Pumarola, T.; et al. Soluble Angiotensin-Converting Enzyme 2 as a Prognostic Biomarker for Disease Progression in Patients Infected with SARS-CoV-2. Diagnostics 2022, 12, 886. [Google Scholar] [CrossRef]
- Batista, F.d.M.; Puga, M.A.M.; da Silva, P.V.; Oliveira, R.; dos Santos, P.C.P.; da Silva, B.O.; Tatara, M.B.; Tsuha, D.H.; Pires, M.A.d.S.; Gonçalves, C.C.M.; et al. Serum biomarkers associated with SARS-CoV-2 severity. Sci. Rep. 2022, 12, 15999. [Google Scholar] [CrossRef]
- Alserawan, L.; Peñacoba, P.; Echevarría, S.E.O.; Castillo, D.; Ortiz, E.; Martínez-Martínez, L.; Naranjo, E.M.; Domingo, P.; Castellví, I.; Juárez, C.; et al. Growth Differentiation Factor 15 (GDF-15): A Novel Biomarker Associated with Poorer Respiratory Function in COVID-19. Diagnostics 2021, 11, 1998. [Google Scholar] [CrossRef] [PubMed]
- Torrens-Mas, M.; Perelló-Reus, C.M.; Trias-Ferrer, N.; Ibargüen-González, L.; Crespí, C.; Galmes-Panades, A.M.; Navas-Enamorado, C.; Sanchez-Polo, A.; Piérola-Lopetegui, J.; Masmiquel, L.; et al. GDF15 and ACE2 stratify COVID-19 patients according to severity while ACE2 mutations increase infection susceptibility. Front. Cell. Infect. Microbiol. 2022, 12, 942951. [Google Scholar] [CrossRef] [PubMed]
- Romualdo, L.G.d.G.; Mulero, M.D.R.; Olivo, M.H.; Rojas, C.R.; Arenas, V.R.; Morales, M.G.; Abellán, A.B.; Conesa-Zamora, P.; García-García, J.; Hernández, A.C.; et al. Circulating levels of GDF-15 and calprotectin for prediction of in-hospital mortality in COVID-19 patients: A case series. J. Infect. 2021, 82, e40. [Google Scholar] [CrossRef]
- Teng, X.; Zhang, J.; Shi, Y.; Liu, Y.; Yang, Y.; He, J.; Luo, S.; Huang, Y.; Liu, Y.; Liu, D.; et al. Comprehensive Profiling of Inflammatory Factors Revealed That Growth Differentiation Factor-15 Is an Indicator of Disease Severity in COVID-19 Patients. Front. Immunol. 2021, 12, 662465. [Google Scholar] [CrossRef]
- Myhre, P.L.; Prebensen, C.; Strand, H.; Røysland, R.; Jonassen, C.M.; Rangberg, A.; Sørensen, V.; Søvik, S.; Røsjø, H.; Svensson, M.; et al. Growth Differentiation Factor 15 Provides Prognostic Information Superior to Established Cardiovascular and Inflammatory Biomarkers in Unselected Patients Hospitalized With COVID-19. Circulation 2020, 142, 2128–2137. [Google Scholar] [CrossRef] [PubMed]
- Ackermann, M.; Ackermann, M.; Kamp, J.C.; Kamp, J.C.; Werlein, C.; Werlein, C.; Walsh, C.L.; Walsh, C.L.; Stark, H.; Stark, H.; et al. The fatal trajectory of pulmonary COVID-19 is driven by lobular ischemia and fibrotic remodelling. EBioMedicine 2022, 85, 104296. [Google Scholar] [CrossRef]
- Delaye, J.-B.; Alarcan, H.; Vallet, N.; Veyrat-Durebex, C.; Bernard, L.; Hérault, O.; Ropert, M.; Marlet, J.; Gyan, E.; Andres, C.; et al. Specific changes of erythroid regulators and hepcidin in patients infected by SARS-CoV-2. J. Investig. Med. 2022, 70, 934–938. [Google Scholar] [CrossRef]
- Wang, Y.; Yao, P.; Li, K.; Qin, S. GDF-15 (a biomarker for metformin) and the risk of COVID-19: A two-sample Mendelian randomization study. Medicine 2023, 102, e34675. [Google Scholar] [CrossRef] [PubMed]
- Lim, W.S.; van der Eerden, M.M.; Laing, R.; Boersma, W.G.; Karalus, N.; I Town, G.; A Lewis, S.; Macfarlane, J.T. Defining community acquired pneumonia severity on presentation to hospital: An international derivation and validation study. Thorax 2003, 58, 377–382. [Google Scholar] [CrossRef] [PubMed]
- Evans, L.; Rhodes, A.; Alhazzani, W.; Antonelli, M.; Coopersmith, C.M.; French, C.; Machado, F.R.; Mcintyre, L.; Ostermann, M.; Prescott, H.C.; et al. Surviving sepsis campaign: International guidelines for management of sepsis and septic shock 2021. Intensive Care Med. 2021, 47, 1181–1247. [Google Scholar] [CrossRef] [PubMed]
- Vahey, G.M.; McDonald, E.; Marshall, K.; Martin, S.W.; Chun, H.; Herlihy, R.; Tate, J.E.; Kawasaki, B.; Midgley, C.M.; Alden, N.; et al. Risk factors for hospitalization among persons with COVID-19-Colorado. PLoS ONE 2021, 16, e0256917. [Google Scholar] [CrossRef] [PubMed]
- García, H.A.V.; Adu, P.A.; Harrigan, S.; Wilton, J.; Rasali, D.; Binka, M.; Sbihi, H.; Smolina, K.; Janjua, N.Z. Risk factors for COVID-19 hospitalization after COVID-19 vaccination: A population-based cohort study in Canada. Int. J. Infect. Dis. 2023, 127, 116–123. [Google Scholar] [CrossRef]
- Doerstling, S.; Hedberg, P.; Öhrvik, J.; Leppert, J.; Henriksen, E. Growth differentiation factor 15 in a community-based sample: Age-dependent reference limits and prognostic impact. Ups. J. Med. Sci. 2018, 123, 86–93. [Google Scholar] [CrossRef]
- Perico, L.; Benigni, A.; Casiraghi, F.; Ng, L.F.P.; Renia, L.; Remuzzi, G. Immunity, endothelial injury and complement-induced coagulopathy in COVID-19. Nat. Rev. Nephrol. 2021, 17, 46–64. [Google Scholar] [CrossRef]
- Hilton, J.; Boyer, N.; Nadim, M.K.; Forni, L.G.; Kellum, J.A. COVID-19 and Acute Kidney Injury. Crit. Care Clin. 2022, 38, 473–489. [Google Scholar] [CrossRef] [PubMed]
- Rochette, L.; Zeller, M.; Cottin, Y.; Vergely, C. GDF15: An emerging modulator of immunity and a strategy in COVID-19 in association with iron metabolism. Trends Endocrinol. Metab. 2021, 32, 875–889. [Google Scholar] [CrossRef]
- Chambers, K.; Ashraf, M.A.; Sharma, S. Physiology, Hepcidin. In StatPearls; StatPearls Publishing: Treasure Island, FL, USA, 2023. [Google Scholar]
- Liu, Z.; Li, L.; Zhang, H.; Pang, X.; Qiu, Z.; Xiang, Q.; Cui, Y. Platelet factor 4(PF4) and its multiple roles in diseases. Blood Rev. 2024, 64, 101155. [Google Scholar] [CrossRef] [PubMed]
- Bikfalvi, A. Platelet factor 4: An inhibitor of angiogenesis. Semin. Thromb. Hemost. 2004, 30, 379–385. [Google Scholar] [CrossRef] [PubMed]
- Iba, T.; Wada, H.; Levy, J.H. Platelet Activation and Thrombosis in COVID-19. Semin. Thromb. Hemost. 2023, 49, 55–61. [Google Scholar] [CrossRef] [PubMed]
- Favaloro, E.J.; Pasalic, L.; Lippi, G. Antibodies against Platelet Factor 4 and Their Associated Pathologies: From HIT/HITT to Spontaneous HIT-like Syndrome, to COVID-19, to VITT/TTS. Antibodies 2022, 11, 7. [Google Scholar] [CrossRef] [PubMed]
- Park, J.M.; Woo, W.; Lee, S.C.; Park, S.; Yon, D.K.; Lee, S.W.; Smith, L.; Koyanagi, A.; Shin, J.I.; Kim, Y.W. Prevalence and Mortality Risk of Neurological Disorders during the COVID-19 Pandemic: An Umbrella Review of the Current Evidence. Neuroepidemiology 2023, 57, 129–147. [Google Scholar] [CrossRef] [PubMed]
- Cho, K.; Park, S.; Kim, E.; Koyanagi, A.; Jacob, L.; Yon, D.K.; Lee, S.W.; Kim, M.S.; Radua, J.; Elena, D.; et al. Immunogenicity of COVID-19 vaccines in patients with diverse health conditions: A comprehensive systematic review. J. Med. Virol. 2022, 94, 4144–4155. [Google Scholar] [CrossRef] [PubMed]
- Black, S.; Kushner, I.; Samols, D. C-reactive Protein. J. Biol. Chem. 2004, 279, 48487–48490. [Google Scholar] [CrossRef]
- Izcovich, A.; Ragusa, M.A.; Tortosa, F.; Marzio, M.A.L.; Agnoletti, C.; Bengolea, A.; Ceirano, A.; Espinosa, F.; Saavedra, E.; Sanguine, V.; et al. Prognostic factors for severity and mortality in patients infected with COVID-19: A systematic review. PLoS ONE 2020, 15, e0241955. [Google Scholar] [CrossRef]
- Malik, P.; Patel, U.; Mehta, D.; Patel, N.; Kelkar, R.; Akrmah, M.; Gabrilove, J.L.; Sacks, H. Biomarkers and outcomes of COVID-19 hospitalisations: Systematic review and meta-analysis. BMJ Evid. Based Med. 2021, 26, 107–108. [Google Scholar] [CrossRef] [PubMed]
- Galassi, A.; Ciceri, P.; Bono, V.; Magagnoli, L.; Sala, M.; Artioli, L.; Rovito, R.; Hadla, M.; Yellenki, V.; Monforte, A.D.; et al. Growth Differentiation Factor 15 (GDF-15) Levels Associate with Lower Survival in Chronic Kidney Disease Patients with COVID-19. Biomedicines 2022, 10, 3251. [Google Scholar] [CrossRef] [PubMed]

| Sex [n (%)] | |
| Male | 41 (43) |
| Female | 54 (57) |
| Age [Median (range)] | 76 (22–93) |
| Length of hospitalization [Median (IQR)] | 9 (6–13) |
| Mean arterial pressure—MAP (mmHg) | 83.3 (76.7–93.3) |
| Vaccinated [n (%)] | 34 (36) |
| Comorbidities [n (%)] | |
| Type 2 diabetes mellitus | 21 (22) |
| Hypertension | 68 (72) |
| Cardiomyopathy | 21 (22) |
| Atrial fibrillation | 9 (10) |
| Lung disease | 10 (11) |
| Chronic kidney disease | 4 (4) |
| Clinical symptoms [n (%)] | |
| General symptoms | |
| Fever | 71 (75) |
| Cephalea | 5 (5) |
| Chills/shivering | 19 (20) |
| General weakness | 63 (66) |
| Nausea | 15 (16) |
| Myalgia or arthralgia | 21 (22) |
| Confusion | 15 (16) |
| Respiratory symptoms | |
| Cough | 81 (85) |
| Sore throat | 5 (5) |
| Chest pain | 28 (30) |
| Hemoptysis | 3 (3) |
| Dyspnea (anamnestic) | 60 (63) |
| Dyspnea (at examination) | 73 (77) |
| Gastrointestinal symptoms | |
| Diarrhea | 26 (27) |
| Vomiting | 6 (6) |
| Skin changes | 2 (2) |
| Complications [n(%)] | |
| Pulmonary complications | |
| Pneumonia | 91 (96) |
| Unilateral involvement | 10/91 (11) |
| Bilateral involvement | 81/91 (89) |
| Pulmonary embolism | 1 (1) |
| Pleural effusion | 36 (38) |
| Oxygenation (nasal catheter or mask) | 89 (94) |
| Oxygenation (high-flow nasal cannula—HFNC) | 36 (38) |
| Invasive mechanical ventilation (IMV) | 20 (21) |
| Clinical Outcome | p 3 | ICU Admission | p 3 | Length of Hospitalization | p 3 | ||||
|---|---|---|---|---|---|---|---|---|---|
| Survivors (n = 64) | Non-Survivors (n = 31) | Non-ICU (n = 71) | ICU (n = 24) | Less than 10 Days (n = 52) | 10 and More Days (n = 43) | ||||
| Demographic data | |||||||||
| Female, n (%) | 36 (56) | 18 (58) | 0.870 1 | 41 (58) | 13 (54) | 0.760 1 | 31 (59) | 23 (54) | 0.550 1 |
| Age in years, median (range) | 71 (22–90) | 79 (56–93) | 0.003 | 74 (22–93) | 77 (56–89) | 0.400 | 77 (22–93) | 76 (33–89) | 0.550 |
| Vaccinated, n (%) | 25 (39) | 9 (29) | 0.3401 | 28 (39) | 65 (25) | 0.200 1 | 22 (42) | 12 (28) | 0.150 1 |
| Length of hospitalization in days, median (IQR) | 8 (6–13) | 11 (7–15) | 0.090 | 8 (6–12) | 13 (8–15) | 0.002 | 7 (5–8) | 14 (12–16) | <0.001 |
| MAP in mmHg, median (IQR) | 83.3 (80–93.3) | 83.3 (73.3–86.7) | 0.120 | 83.3 (73.3–90) | 85 (78.3–83.3) | 0.240 | 83.3 (73.3–89.6) | 83.3 (80–93.3) | 0.340 |
| Comorbidity, n (%) | |||||||||
| Type 2 diabetes mellitus | 15 (23) | 6 (19) | 0.650 1 | 15 (21) | 6 (25) | 0.690 1 | 13 (25) | 8 (19) | 0.460 1 |
| Hypertension | 42 (66) | 26 (84) | 0.070 1 | 50 (70) | 18 (75) | 0.670 1 | 36 (69) | 32 (74) | 0.580 1 |
| Cardiomyopathy | 10 (16) | 11 (36) | 0.030 1 | 13 (18) | 8 (33) | 0.130 1 | 10 (19) | 11 (26) | 0.460 1 |
| Atrial fibrillation | 4 (6) | 5 (16) | 0.15 2 | 7 (10) | 2 (8) | >0.990 2 | 4 (8) | 5 (12) | 0.730 2 |
| Lung disease | 6 (9) | 4 (13) | 0.720 1 | 7 (10) | 3 (13) | 0.710 1 | 5 (10) | 5 (12) | 0.750 1 |
| Chronic kidney disease | 2 (3) | 2 (7) | 0.600 2 | 3 (4) | 1 (4) | >0.990 2 | 3 (6) | 1 (2) | 0.620 2 |
| Clinical scores, median (IQR) | |||||||||
| qSOFA score | 1 (1–1) | 1 (1–2) | 0.010 | 1 (1–2) | 1 (1–2) | 0.760 | 1 (1–2) | 1 (1–1) | 0.670 |
| CURB-65 score | 2 (2–3) | 3 (3–4) | <0.001 | 1 (2–3) | 2 (2–4) | 0.200 | 3 (2–3) | 3 (2–3) | 0.580 |
| Laboratory findings, median (IQR) | |||||||||
| WBC (×109/L) | 6.6 (5.3–9.4) | 6.8 (4.6–11.9) | 0.990 | 6.4 (5.1–10.1) | 7.5 (4.8–10.1) | 0.870 | 7.1 (5.1–10.5) | 6.3 (5.1–9.3) | 0.570 |
| RBC (×1012/L) | 4.5 (4–5) | 4.3 (4–4.9) | 0.380 | 4.46 (4–5) | 4.48 (4–4.9) | 0.840 | 4.39 (3.9–4.9) | 4.64 (4.1–5) | 0.060 |
| Hb (g/L) | 136 (119–146) | 131 (120–146) | 0.850 | 135 (119–144) | 135 (122–1501) | 0.470 | 130 (116–143) | 138 (125–150) | 0.050 |
| Hct (L/L) | 0.4 (0.4–0.4) | 0.4 (0.4–0.4) | 0.810 | 0.4 (0.4–0.4) | 0.41 (0.4–0.4) | 0.340 | 0.39 (0.4–0.4) | 0.41 (0.4–0.4) | 0.040 |
| MCV fL) | 87.8 (84.6–91.8) | 89.9 (87–93.7) | 0.110 | 88.2 (84.5–92.6) | 89.05 (87–93.4) | 0.330 | 88.9 (86.1–92.9) | 87.4 (84.3–92.3) | 0.220 |
| MCHC (g/L) | 334 (327–342) | 331 (320–338) | 0.040 | 333 (326–342) | 332 (321–342) | 0.410 | 334 (325–341) | 333 (326–342) | 0.920 |
| RDW-CV (%) | 13.3 (12.9–14.1) | 14.3 (13.4–15.9) | 0.002 | 13.4 (13.1–14.6) | 13.95 (13–15.2) | 0.330 | 13.4 (13–14.7) | 13.7 (13.1–14.6) | 0.620 |
| Platelets (×109/L) | 213 (155–273) | 195 (138–224) | 0.220 | 210 (148–281) | 197 (159–222) | 0.390 | 204 (159–307) | 195 (138–251) | 0.130 |
| Neutrophils (%) | 76 (68–86) | 79 (73–87) | 0.200 | 76 (68–86) | 80 (74–88) | 0.110 | 76 (68–87) | 78 (70–86) | 0.320 |
| Lymphocytes (%) | 15 (8–22) | 12 (7–17) | 0.190 | 15 (8–21) | 12 (6–16) | 0.120 | 15 (8–23) | 12 (7–17) | 0.170 |
| Band cells (%) | 0 (0–0) | 0 (0–0) | 0.080 | 0 (0–0) | 0 (0–0) | 0.930 | 0 (0–0) | 0 (0–0) | 0.230 |
| Monocytes (%) | 8 (5–9) | 6 (4–9) | 0.170 | 8 (5–9) | 6 (4–9) | 0.270 | 8 (5–9) | 7 (5–10) | 0.590 |
| Basophils (%) | 0 (0–0) | 0 (0–0) | 0.110 | 0 (0–0) | 0 (0–0) | 0.180 | 0 (0–0) | 0 (0–0) | 0.240 |
| Eosinophils (%) | 0 (0–7) | 0 (0–0) | 0.030 | 0 (0–0) | 0 (0–0) | 0.070 | 0 (0–7) | 0 (0–1) | 0.410 |
| PT (INR) | 0.9 (0.9–1) | 1 (0.9–1) | 0.160 | 0.94 (0.9–1) | 0.97 (0.9–1) | 0.950 | 0.95 (0.9–1) | 0.96 (0.9–1) | 0.790 |
| Fbg (g/L) | 6.4 (5.7–7.9) | 6.1 (5.4–8.6) | 0.830 | 6.4 (5.4–7.9) | 6.4 (5.6–9.5) | 0.450 | 6.35 (5.4–7.4) | 6.6 (5.6–9.5) | 0.140 |
| APTT (1) | 0.8 (0.8–0.9) | 0.9 (0.8–1) | 0.110 | 0.85 (0.8–0.9) | 0.82 (0.8–0.9) | 0.560 | 0.85 (0.8–0.9) | 0.82 (0.8–0.9) | 0.400 |
| D-dimers (μg/L FEU) | 1281 (799–2173) | 1514 (1124–3117) | 0.330 | 1335 (808–2120) | 1438 (1037–3356) | 0.430 | 1286 (816–2110) | 1506 (840–2685) | 0.710 |
| AT-3 (1) | 1.1 (1–1.3) | 1.1 (1–1.2) | 0.060 | 1.1 (1–1.3) | 1.1 (0.9–1.2) | 0.200 | 1.1 (1–1.2) | 1.1 (1–1.3) | 0.650 |
| AST (U/L) | 44 (31–66) | 57 (43–98) | 0.003 | 44 (34–66) | 67 (44–98) | 0.008 | 45 (29–68) | 50 (41–86) | 0.060 |
| ALT (U/L) | 34 (19–51) | 36 (23–51) | 0.510 | 31 (16–50) | 39 (30–53) | 0.100 | 31 (17–52) | 36 (23–50) | 0.330 |
| ALP (U/L) | 68 (56–89) | 57 (51–75) | 0.180 | 63 (53–89) | 63 (50–75) | 0.240 | 61 (55–86) | 64 (50–89) | 0.570 |
| GGT (U/L) | 41 (24–101) | 37 (20–96) | 0.630 | 39 (22–90) | 38 (23–111) | 0.720 | 30 (17–86) | 50 (30–116) | 0.030 |
| CK (U/L) | 82 (50–228) | 142 (74–386) | 0.030 | 83 (55–223) | 112 (73–430) | 0.080 | 76 (49–233) | 107 (78–288) | 0.030 |
| LDH (U/L) | 309 (255–382) | 405 (278–491) | 0.003 | 314 (253–392) | 405 (298–492) | 0.005 | 296 (252–400) | 365 (282–432) | 0.030 |
| Urea (mmol/L) | 6.9 (5.5–9.4) | 9.1 (6.9–16) | 0.010 | 7.1 (5.6–10.3) | 7.5 (6.2–11.8) | 0.390 | 7.1 (6–10.7) | 7.4 (5.5–10.7) | 0.850 |
| Creatinine (μmol/L) | 80 (65–96) | 93 (79–152) | 0.004 | 83 (66–107) | 90 (78–114) | 0.160 | 82 (65–108) | 86 (72–116) | 0.340 |
| Albumin (g/L) | 34.7 (31.2–36.8) | 32.2 (30.2–37.2) | 0.220 | 34.45 (30.6–36.6) | 33.8 (31.4–37.7) | 0.510 | 34.8 (31.1–37.1) | 33.6 (30.5–36.3) | 0.420 |
| CRP (mg/L) | 64 (30.5–110.9) | 116.6 (73.3–158.4) | 0.002 | 71.9 (30.9–114.2) | 116.8 (60.9–152.8) | 0.010 | 72.6 (30.1–109.1) | 101.7 (48.3–152.1) | 0.020 |
| PCT (μg/L) | 0.1 (0.1–0.2) | 0.2 (0.1–0.4) | 0.002 | 0.13 (0.1–0.3) | 0.18 (0.1–0.3) | 0.150 | 0.14 (0.1–0.3) | 0.17 (0.1–0.3) | 0.310 |
| hsTnI (ng/L) | 16.8 (8.9–35.5) | 29.8 (21.4–64.8) | 0.020 | 24.6 (9.9–57.7) | 26.2 (12.6–53.1) | 0.960 | 21.4 (9.8–66) | 26.7 (12.3–37.9) | 0.550 |
| IL-6 (ng/L) | 50.4 (24.5–115.6) | 96.9 (58.6–179.5) | 0.003 | 55.6 (26.2–121.2) | 76.3 (58.7–154) | 0.080 | 53 (20.5–124) | 70.6 (36–136.3) | 0.16 |
| Ferritin (μg/I) | 582.8 (200–1036.6) | 559.8 (234–1275.4) | 0.700 | 528.3 (199.5–1071.7) | 594.2 (291.1–1185.9) | 0.650 | 422.8 (191.8–1101.3) | 653.5 (361–1070.8) | 0.260 |
| Na (mmol/L) | 138 (136–140) | 138 (137–141) | 0.350 | 138 (136–141) | 138 (137–141) | 0.750 | 139 (136–141) | 138 (136–141) | 0.400 |
| K (mmol/L) | 4.1 (3.7–4.4) | 4.2 (3.7–4.4) | 0.640 | 4.1 (3.7–4.4) | 4.2 (3.8–4.4) | 0.450 | 4.2 (3.7–4.4) | 4.1 (3.7–4.4) | 0.990 |
| Cl (mmol/L) | 101 (96–103) | 101 (99–104) | 0.360 | 100 (96–103) | 101 (99–104) | 0.450 | 102 (98–104) | 100 (96–102) | 0.060 |
| Glucose (mmol/L) | 7.1 (6.1–9) | 7.2 (6–9.8) | 0.970 | 6.9 (6.1–8.6) | 7.4 (6.1–10.2) | 0.280 | 6.8 (6–8.5) | 7.4 (6.2–9.9) | 0.150 |
| GDF-15 (pg/mL) | 3078.0 (1671.5–5041.3) | 5762.0 (4213.0–10,795) | <0.001 | 3298 (2144–6282) | 4845.5 (3039–6700) | 0.080 | 3517 (1957.3–6419) | 4143 (2842–5762) | 0.590 |
| Spearman’s Rank Correlation Coefficient Rho (p Value) GDF-15 | |||||
|---|---|---|---|---|---|
| All Patients | Clinical Outcome | ICU Admission | |||
| Survivors | Non-Survivors | Non-ICU | ICU | ||
| Age | 0.442 (<0.001) | 0.479 (<0.001) | 0.152 (0.420) | 0.541 (<0.001) | −0.011 (0.960) |
| qSOFA score | 0.307 (0.003) | 0.055 (0.660) | 0.644 (<0.001) | 0.248 (0.040) | 0.499 (0.010) |
| CURB-65 score | 0.537 (<0.001) | 0.427 (<0.001) | 0.541 (0.002) | 0.534 (<0.001) | 0.448 (0.030) |
| Inflammatory markers | |||||
| CRP | 0.337 (0.001) | 0.319 (0.010) | 0.042 (0.820) | 0.380 (0.001) | −0.012 (0.960) |
| PCT | 0.586 (<0.001) | 0.482 (<0.001) | 0.619 (<0.001) | 0.541 (<0.001) | 0.656 (0.001) |
| IL-6 | 0.461 (<0.001) | 0.401 (0.001) | 0.424 (0.030) | 0.520 (<0.001) | 0.106 (0.650) |
| Negative Outcome | β | Wald | p Value | Odds Ratio | 95% CI |
|---|---|---|---|---|---|
| Bivariate regression | |||||
| Age | 0.07 | 8.48 | 0.004 | 1.07 | 1.02 to 1.12 |
| Cardiomyopathy | 1.09 | 4.57 | 0.030 | 2.97 | 1.09 to 8.6 |
| CURB-65 score | 0.99 | 14.6 | <0.001 | 2.7 | 1.62 to 4.5 |
| MCHC | −0.05 | 6.32 | 0.010 | 0.95 | 0.91 to 0.98 |
| RDW-CV | 0.25 | 4.4 | 0.040 | 1.29 | 1.02 to 1.64 |
| AST | 0.02 | 6.95 | 0.008 | 1.02 | 1.005 to 1.03 |
| CK | 0.001 | 4.05 | 0.040 | 1.001 | 1.00 to 1.0003 |
| LDH | 0.005 | 7.99 | 0.005 | 1.005 | 1.002 to 1.009 |
| Urea | 0.12 | 7.27 | 0.007 | 1.13 | 1.03 to 1.23 |
| Creatinine | 0.01 | 7.33 | 0.007 | 1.01 | 1.004 to 1.03 |
| CRP | 0.008 | 6.54 | 0.010 | 1.01 | 1.002 to 1.01 |
| PCT | 0.96 | 3.36 | 0.070 | 2.60 | 0.94 to 7.22 |
| hsTnI | −0.001 | 0.01 | 0.910 | 0.99 | 0.99 to 1.001 |
| IL-6 | 0.002 | 3.87 | 0.040 | 1.002 | 1.00 to 1.005 |
| GDF-15 | 0.0002 | 7.99 | 0.005 | 1.0002 | 1.0001 to 1.0003 |
| Multivariate regression | |||||
| CURB-65 score | 0.99 | 11.21 | <0.001 | 2.55 | 1.48 to 4.42 |
| LDH | 0.005 | 5.05 | 0.020 | 1.01 | 1.001 to 1.009 |
| Constant | −5.31 | 18.01 | <0.001 |
| ICU Admission | β | Wald | p Value | Odds Ratio | 95% CI |
|---|---|---|---|---|---|
| Bivariate regression | |||||
| Age | 0.03 | 1.91 | 0.170 | 1.03 | 0.98 to 1.07 |
| Cardiomyopathy | 0.80 | 2.29 | 0.130 | 2.23 | 0.79 to 6.31 |
| CURB-65 score | 0.23 | 1.19 | 0.270 | 1.26 | 0.84 to 1.89 |
| Pleural effusion | 1.14 | 5.45 | 0.020 | 3.12 | 1.20 to 8.10 |
| AST | 0.005 | 1.47 | 0.230 | 1.01 | 0.99 to 1.01 |
| LDH | 0.004 | 4.65 | 0.030 | 1.004 | 1.0003 to 1.007 |
| CRP | 0.005 | 3.37 | 0.070 | 1.005 | 0.99 to 1.01 |
| IL-6 | −0.001 | 0.39 | 0.530 | 0.99 | 0.99 to 1.002 |
| GDF-15 | 0 | 0.79 | 0.370 | 1.00 | 1.00 to 1.0001 |
| Multivariate regression | |||||
| LDH | 0.004 | 4.33 | 0.030 | 1.004 | 1.0003 to 1.007 |
| Constant | −2.55 | 12.8 | <0.001 |
| Length of Hospitalization ≥ 10 Days | β | Wald | p Value | Odds Ratio | 95% CI |
|---|---|---|---|---|---|
| Bivariate regression | |||||
| Age | 0.007 | 0.20 | 0.650 | 1.01 | 0.97 to 1.03 |
| Bilateral pneumonia | 1.39 | 4.12 | 0.040 | 4.0 | 1.05 to 15.3 |
| Pleural effusion | 0.86 | 3.93 | 0.040 | 2.35 | 1.01 to 5.49 |
| High-flow nasal cannula (HFNC) | 1.44 | 10.2 | 0.001 | 4.21 | 1.74 to 10.17 |
| IMV | 1.62 | 8.07 | 0.005 | 5.04 | 1.65 to 15.36 |
| GGT | 0.002 | 0.32 | 0.570 | 1.002 | 0.99 to 1.01 |
| CK | 0.001 | 2.09 | 0.150 | 1.001 | 0.99 to 1.002 |
| LDH | 0.003 | 2.52 | 0.110 | 1.003 | 0.99 to 1.01 |
| CRP | 0.007 | 5.25 | 0.020 | 1.01 | 1.001 to 1.01 |
| GDF-15 | −0.0003 | 0.49 | 0.480 | 1.00 | 0.99 to 1.0001 |
| Multivariate regression | |||||
| High-flow nasal cannula (HFNC) | 1.56 | 11.8 | <0.001 | 4.75 | 1.95 to 11.6 |
| Constant | −0.99 | 11.4 | <0.001 |
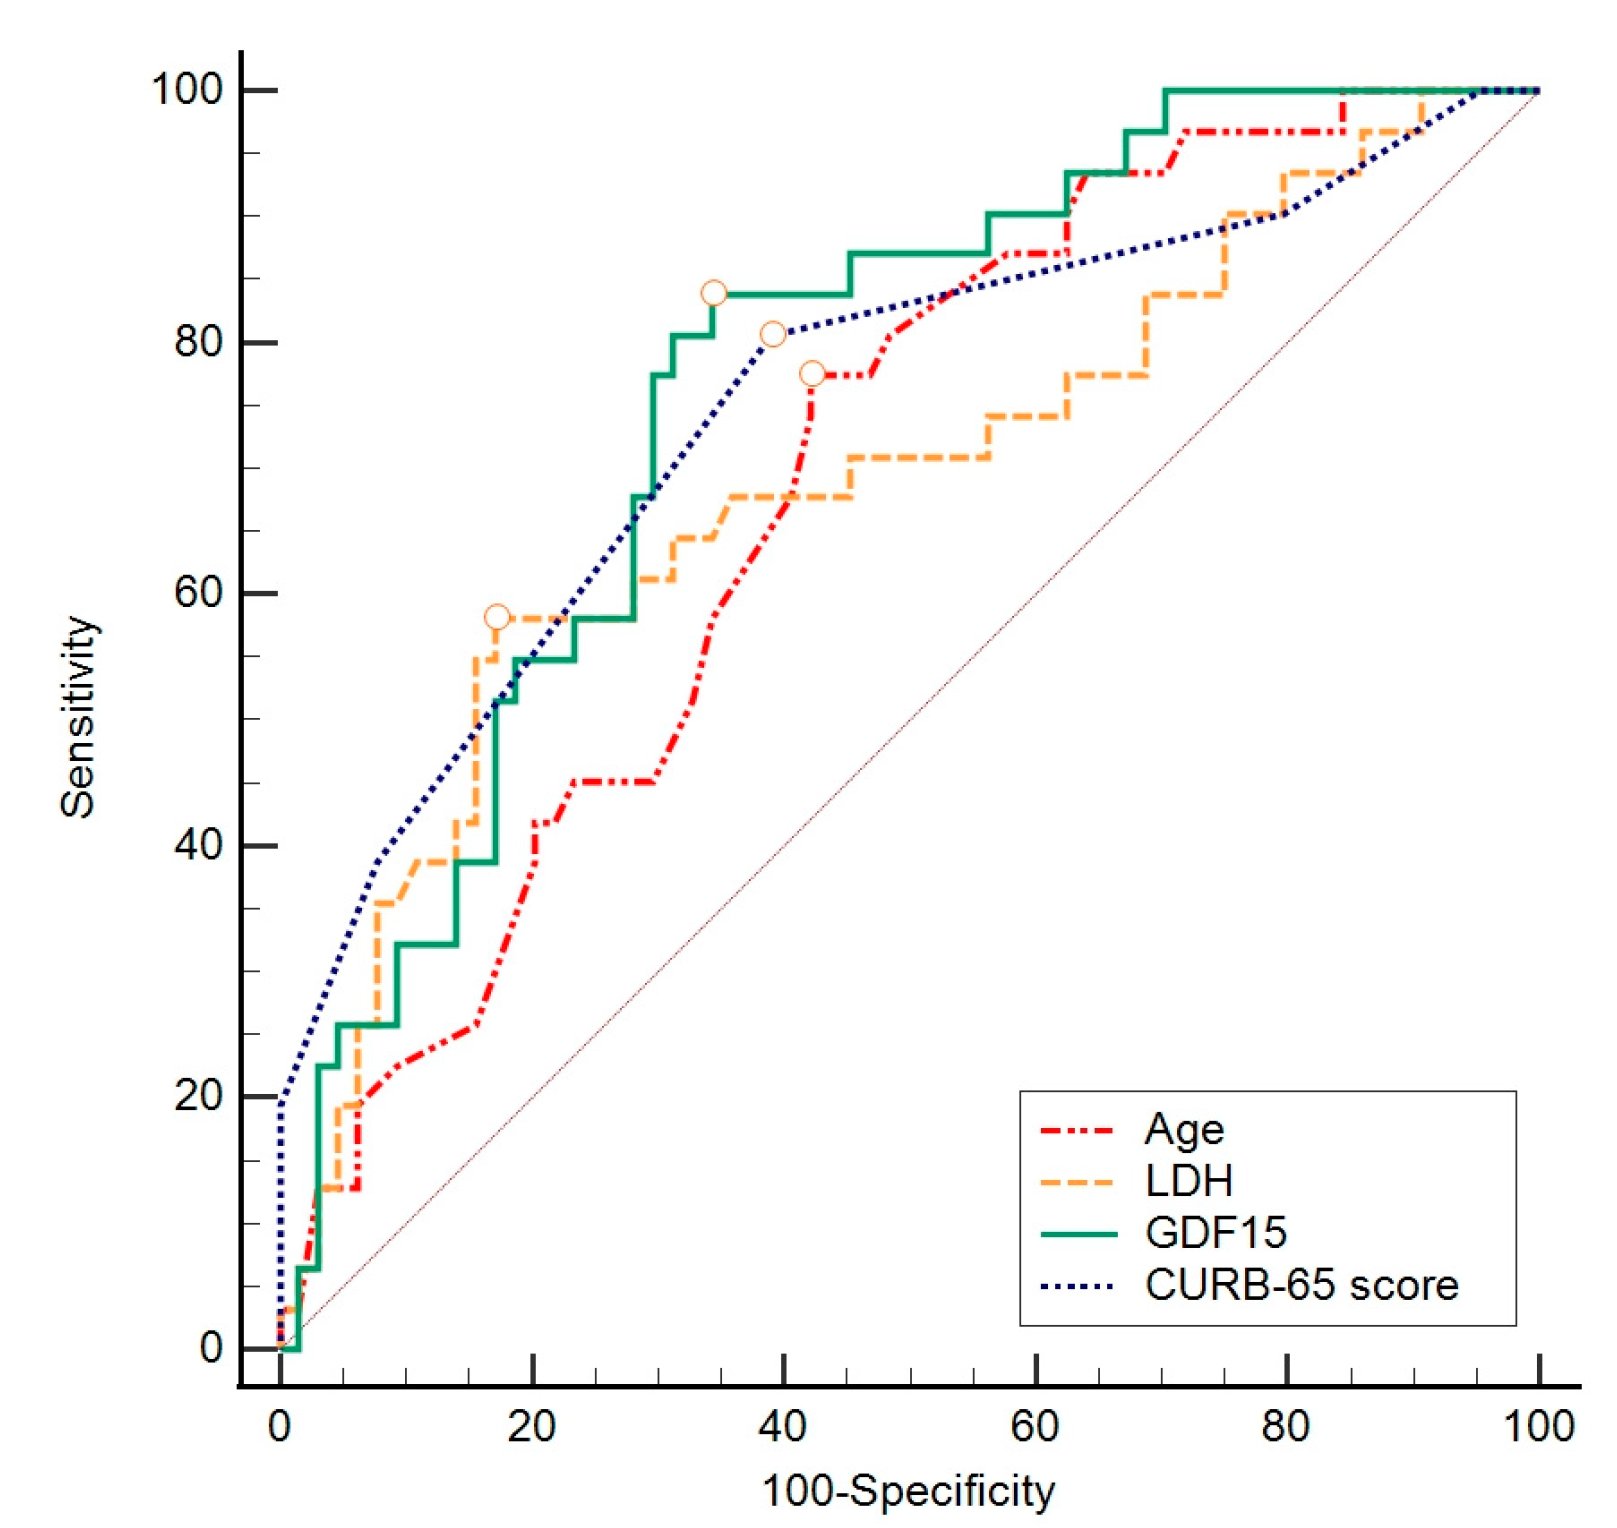
| GDF-15 | |||||||
|---|---|---|---|---|---|---|---|
| AUC | 95% CI | Sensitivity | Specificity | Cut Off | Youden Index | p Value | |
| GDF-15 (pg/mL) | 0.767 | 0.669–0.848 | 83.9 | 65.6 | >3528 | 0.50 | <0.001 |
| Age (years) | 0.691 | 0.588–0.782 | 77.4 | 57.8 | >74 | 0.35 | <0.001 |
| CURB-65 score | 0.752 | 0.653–0.835 | 80.6 | 60.9 | >2 | 0.42 | <0.001 |
| LDH (U/L) | 0.691 | 0.587–0.781 | 58.1 | 82.8 | >395 | 0.41 | 0.002 |
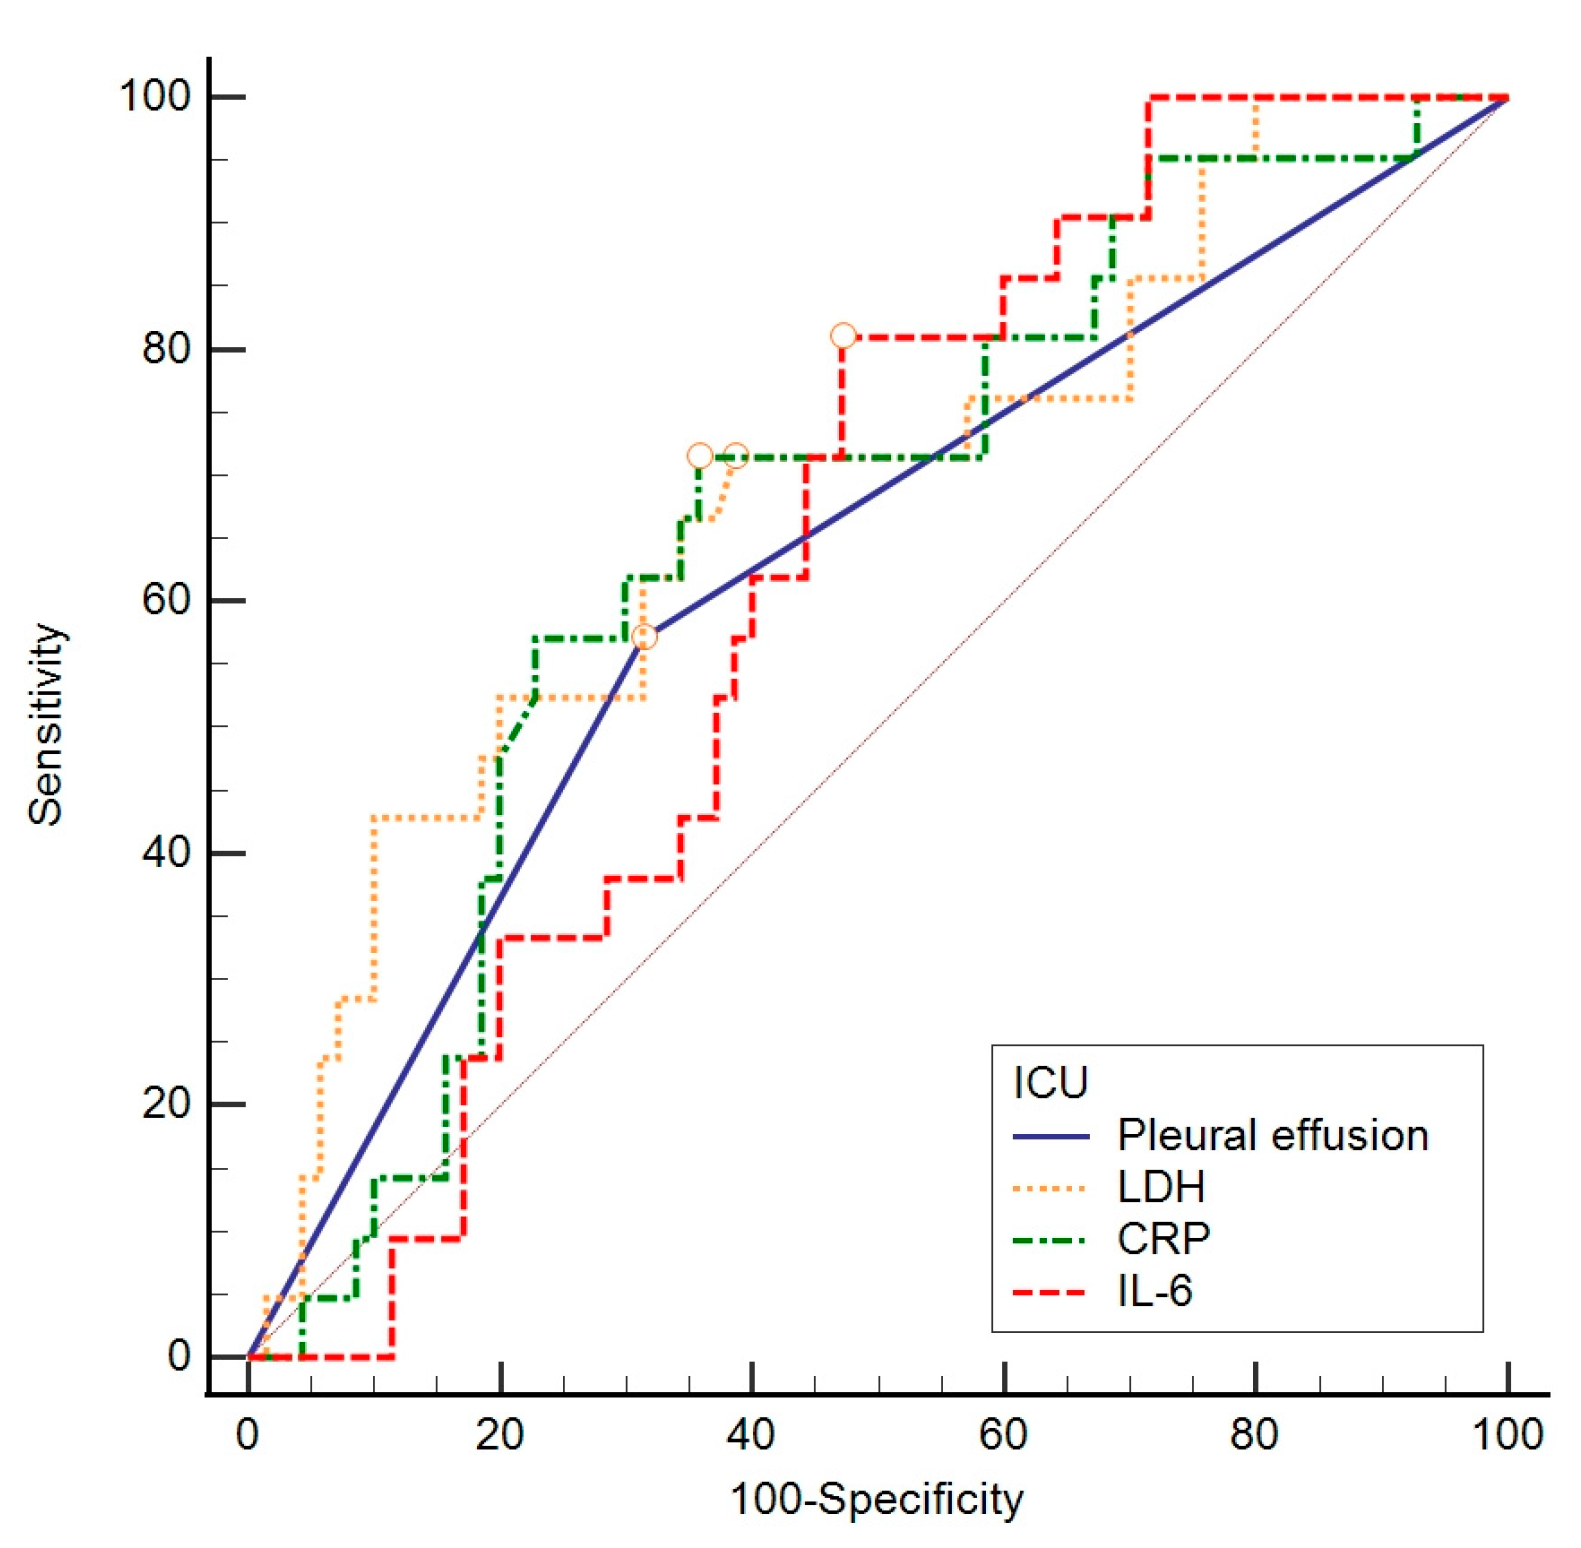
| AUC | 95% CI | Sensitivity | Specificity | Cut Off | Youden Index | p Value | |
|---|---|---|---|---|---|---|---|
| Pleural effusion | 0.637 | 0.532–0.733 | 58.3 | 69.0 | >0 | 0.27 | 0.020 |
| LDH (U/L) | 0.694 | 0.591–0.784 | 54.2 | 80.3 | >404 | 0.34 | 0.002 |
| CRP (mg/L) | 0.676 | 0.572–0.768 | 70.8 | 64.8 | >95.9 | 0.36 | 0.004 |
| IL-6 (ng/L) | 0.629 | 0.521–0.728 | 81.0 | 52.9 | >58.5 | 0.34 | 0.030 |
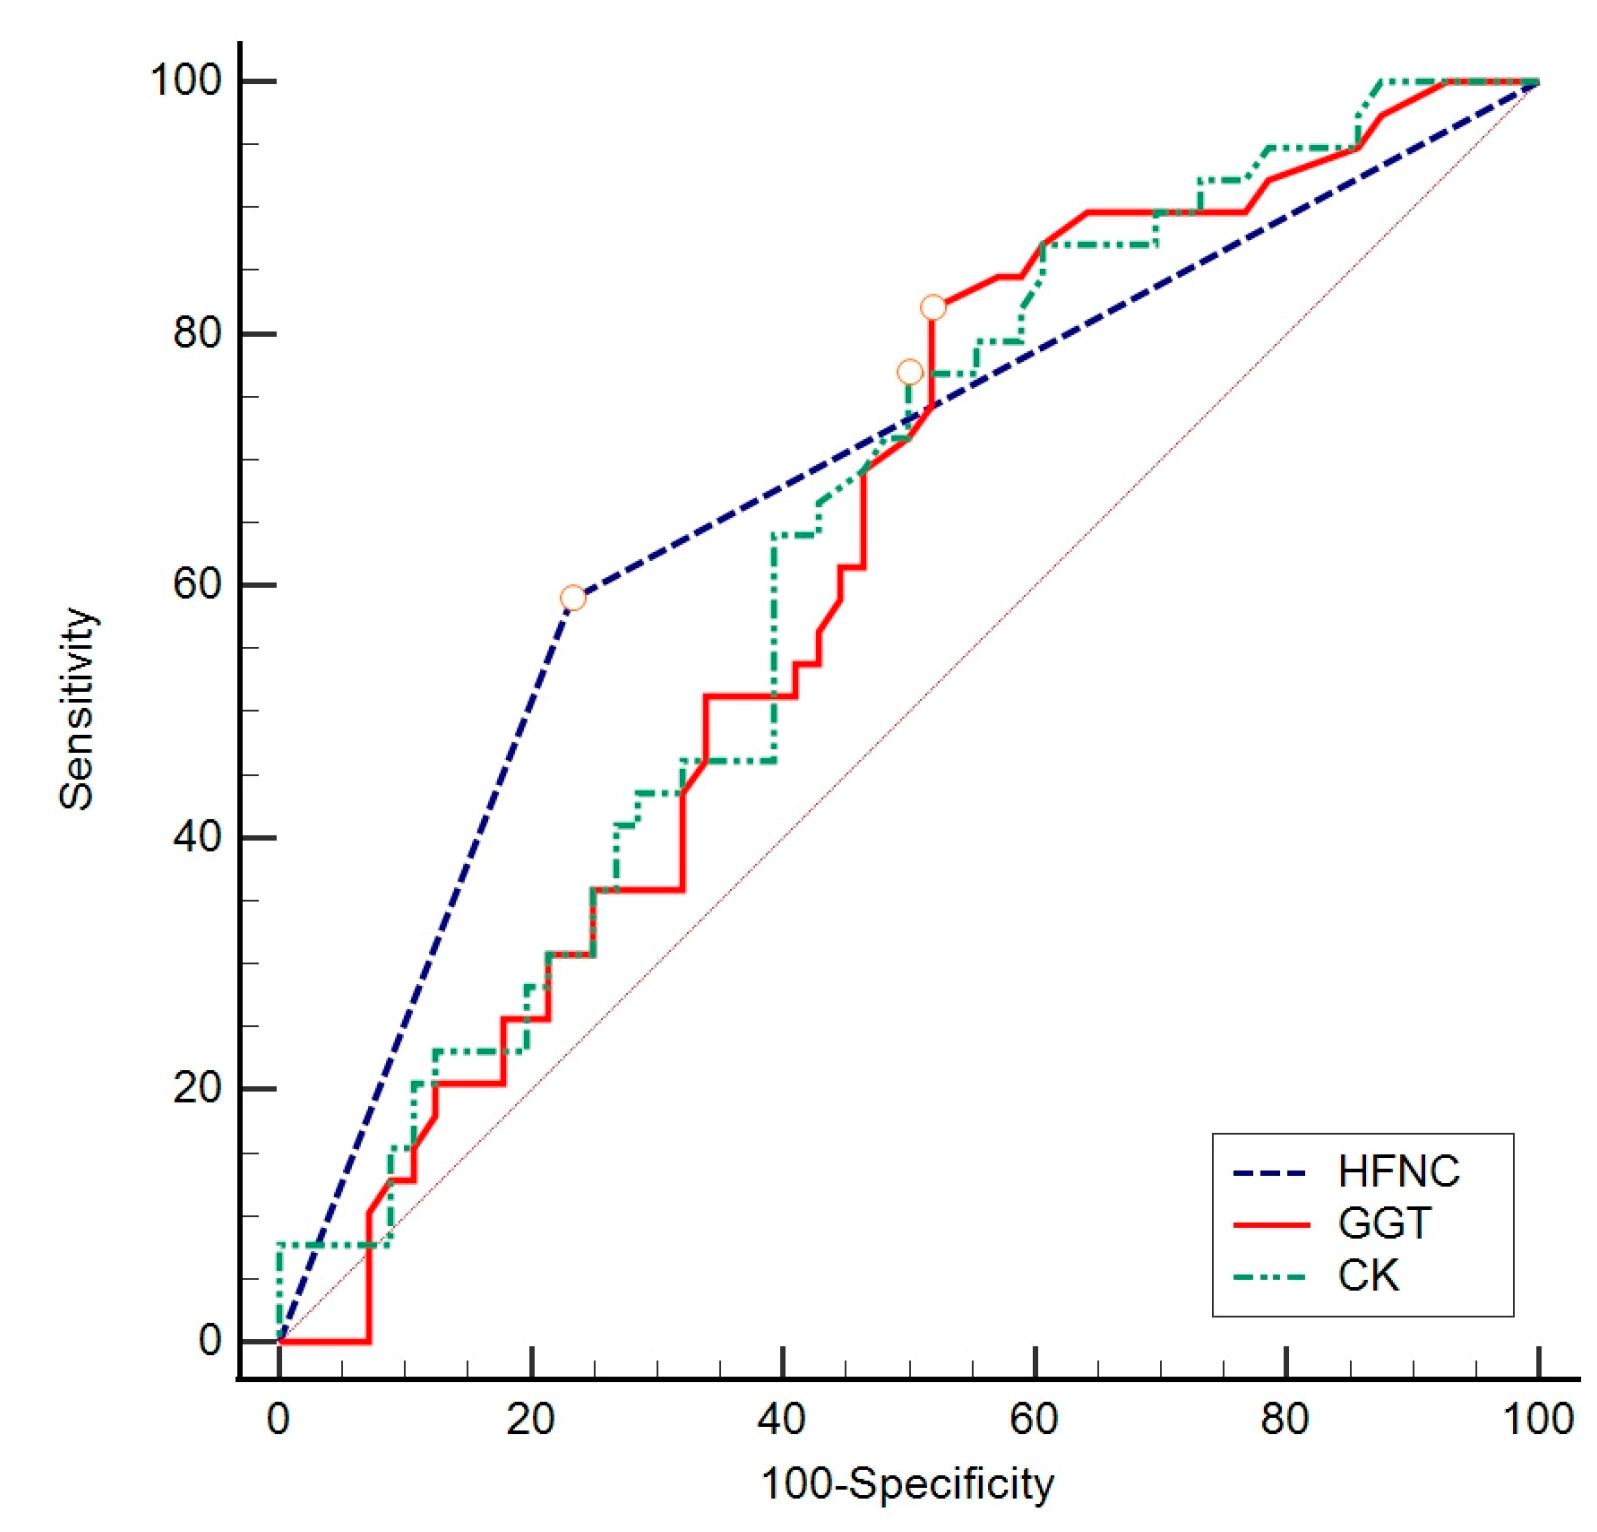
| AUC | 95% CI | Sensitivity | Specificity | Cut Off | Youden Index | p Value | |
|---|---|---|---|---|---|---|---|
| High-flow nasal cannula (HFNC) | 0.679 | 0.575–0.771 | 59.0 | 76.8 | >0 | 0.36 | <0.001 |
| GGT (U/L) | 0.621 | 0.516–0.719 | 82.1 | 48.2 | >28 | 0.30 | 0.030 |
| CK (U/L) | 0.635 | 0.530–0.731 | 76.9 | 50.0 | >76 | 0.27 | 0.020 |
Disclaimer/Publisher’s Note: The statements, opinions and data contained in all publications are solely those of the individual author(s) and contributor(s) and not of MDPI and/or the editor(s). MDPI and/or the editor(s) disclaim responsibility for any injury to people or property resulting from any ideas, methods, instructions or products referred to in the content. |
© 2024 by the authors. Licensee MDPI, Basel, Switzerland. This article is an open access article distributed under the terms and conditions of the Creative Commons Attribution (CC BY) license (https://creativecommons.org/licenses/by/4.0/).
Share and Cite
Švitek, L.; Lišnjić, D.; Grubišić, B.; Zlosa, M.; Schönberger, E.; Vlahović Vlašić, N.; Smajić, P.; Sabadi, D.; Rolić, T.; Kralik, K.; et al. GDF-15 Levels and Other Laboratory Findings as Predictors of COVID-19 Severity and Mortality: A Pilot Study. Biomedicines 2024, 12, 757. https://doi.org/10.3390/biomedicines12040757
Švitek L, Lišnjić D, Grubišić B, Zlosa M, Schönberger E, Vlahović Vlašić N, Smajić P, Sabadi D, Rolić T, Kralik K, et al. GDF-15 Levels and Other Laboratory Findings as Predictors of COVID-19 Severity and Mortality: A Pilot Study. Biomedicines. 2024; 12(4):757. https://doi.org/10.3390/biomedicines12040757
Chicago/Turabian StyleŠvitek, Luka, Dubravka Lišnjić, Barbara Grubišić, Mihaela Zlosa, Ema Schönberger, Nika Vlahović Vlašić, Petra Smajić, Dario Sabadi, Tara Rolić, Kristina Kralik, and et al. 2024. "GDF-15 Levels and Other Laboratory Findings as Predictors of COVID-19 Severity and Mortality: A Pilot Study" Biomedicines 12, no. 4: 757. https://doi.org/10.3390/biomedicines12040757
APA StyleŠvitek, L., Lišnjić, D., Grubišić, B., Zlosa, M., Schönberger, E., Vlahović Vlašić, N., Smajić, P., Sabadi, D., Rolić, T., Kralik, K., & Mandić, S. (2024). GDF-15 Levels and Other Laboratory Findings as Predictors of COVID-19 Severity and Mortality: A Pilot Study. Biomedicines, 12(4), 757. https://doi.org/10.3390/biomedicines12040757