
Associations between Skin Autofluorescence Levels with Cardiovascular Risk and Diabetes Complications in Patients with Type 2 Diabetes

 ,
,  ,
,  , ,
, ,  ,
,
Abstract
1. Introduction
2. Materials and Methods
2.1. Study Design, Protocol, and Patients
2.2. Demographic, Anthropometric, Clinical, and Laboratory Data Collection
2.3. Cardiovascular Risk Profile Assessment
2.4. Measurements of SAF Levels
2.5. Diabetes Complication Assessment
2.6. Statistical Analysis
2.7. Ethical Aspects of the Research
3. Results
4. Discussion
4.1. SAF and Microvascular Complications of DM (Neuropathy, Retinopathy, Nephropathy)
4.2. SAF and CV Risk in DM
4.3. Strengths and Limitations
5. Conclusions
Author Contributions
Funding
Institutional Review Board Statement
Informed Consent Statement
Data Availability Statement
Acknowledgments
Conflicts of Interest
References
- Moldogazieva, N.T.; Mokhosoev, I.M.; Mel’nikova, T.I.; Porozov, Y.B.; Terentiev, A.A. Oxidative Stress and Advanced Lipoxidation and Glycation End Products (ALEs and AGEs) in Aging and Age-Related Diseases. Oxid. Med. Cell. Longev. 2019, 2019, 3085756. [Google Scholar] [CrossRef] [PubMed]
- Sultana, R.; Parveen, A.; Kang, M.C.; Hong, S.M.; Kim, S.Y. Glyoxal-derived advanced glycation end products (GO-AGEs) with UVB critically induce skin inflammaging: In vitro and in silico approaches. Sci. Rep. 2024, 14, 1843. [Google Scholar] [CrossRef] [PubMed]
- Rukadikar, C.; Rukadikar, A.; Kishore, S. A Review on Autonomic Functional Assessment in Diabetic Patients. Cureus 2023, 15, e34598. [Google Scholar] [CrossRef] [PubMed]
- Mosquera-Sulbarán, J.A.; Hernández-Fonseca, J.P. Advanced Glycation End Products in Diabetes. In Biomarkers in Diabetes; Springer International Publishing: Cham, Switzerland, 2022; pp. 171–194. [Google Scholar]
- Chaudhuri, J.; Bains, Y.; Guha, S.; Kahn, A.; Hall, D.; Bose, N.; Gugliucci, A.; Kapahi, P. The Role of Advanced Glycation End Products in Aging and Metabolic Diseases: Bridging Association and Causality. Cell Metab. 2018, 28, 337–352. [Google Scholar] [CrossRef] [PubMed]
- Shardlow, A.; McIntyre, N.J.; Kolhe, N.V.; Nellums, L.B.; Fluck, R.J.; McIntyre, C.W.; Taal, M.W. The association of skin autofluorescence with cardiovascular events and all-cause mortality in persons with chronic kidney disease stage 3: A prospective cohort study. PLoS Med. 2020, 17, e1003163. [Google Scholar] [CrossRef]
- Majchrzak, C.; Cougnard-Gregoire, A.; Le-Goff, M.; Féart, C.; Delcourt, C.; Reydit, M.; Helmer, C.; Rigalleau, V. Skin autofluorescence of Advanced Glycation End-products and mortality in older adults: The roles of chronic kidney disease and diabetes. Nutr. Metab. Cardiovasc. Dis. 2022, 32, 2526–2533. [Google Scholar] [CrossRef]
- Kawamoto, H.; Hanatani, S.; Tsujita, K.; Ruparelia, N.; Chou, S.; Kono, Y.; Nakamura, S. Skin Autofluorescence and Clinical Outcomes in Patients with Coronary Artery Disease. J. Atheroscler. Thromb. 2024, 31, 316–325. [Google Scholar] [CrossRef]
- Aoki, E.; Hirashima, T.; Kumamoto, Y.; Yamamoto, Y.; Suzuki, N.; Oshima, T.; Saito, D.; Hirano, T. Clinical significance of skin autofluorescence for diabetic macroangiopathy and comparison with conventional markers of atherosclerosis: A cross-sectional and prospective study. Diabetol. Int. 2022, 14, 145–154. [Google Scholar] [CrossRef]
- Jujic, A.; Engström, G.; Nilsson, P.M.; Johansson, M. Accumulation of advanced glycation end products in skin and increased vascular ageing in the general population: The Malmö Offspring Study. J. Hypertens. 2024, 42, 530–537. [Google Scholar] [CrossRef]
- Mengstie, M.A.; Chekol Abebe, E.; Behaile Teklemariam, A.; Tilahun Mulu, A.; Agidew, M.M.; Teshome Azezew, M.; Zewde, E.A.; Agegnehu Teshome, A. Endogenous advanced glycation end products in the pathogenesis of chronic diabetic complications. Front. Mol. Biosci. 2022, 9, 1002710. [Google Scholar] [CrossRef]
- Twarda-Clapa, A.; Olczak, A.; Białkowska, A.M.; Koziołkiewicz, M. Advanced Glycation End-Products (AGEs): Formation, Chemistry, Classification, Receptors, and Diseases Related to AGEs. Cells 2022, 11, 1312. [Google Scholar] [CrossRef] [PubMed]
- Prasad, A.; Bekker, P.; Tsimikas, S. Advanced Glycation End Products and Diabetic Cardiovascular Disease. Cardiol. Rev. 2012, 20, 177–183. [Google Scholar] [CrossRef] [PubMed]
- Klonoff, D.C.; Aaron, R.E.; Tian, T.; DuNova, A.Y.; Pandey, A.; Rhee, C.; Fleming, G.A.; Sacks, D.B.; Pop-Busui, R.; Kerr, D. Advanced Glycation Endproducts: A Marker of Long-term Exposure to Glycemia. J. Diabetes Sci. Technol. 2024; advance online publication. [Google Scholar] [CrossRef]
- Perrone, A.; Giovino, A.; Benny, J.; Martinelli, F. Advanced Glycation End Products (AGEs): Biochemistry, Signaling, Analytical Methods, and Epigenetic Effects. Oxid. Med. Cell. Longev. 2020, 2020, 3818196. [Google Scholar] [CrossRef]
- van Waateringe, R.P. Skin Autofluorescence in the General Population: Associations and Prediction; Rijksuniversiteit Groningen: Groningen, The Netherland, 2019. [Google Scholar]
- Da Moura Semedo, C.; Webb, M.; Waller, H.; Khunti, K.; Davies, M. Skin autofluorescence, a non-invasive marker of advanced glycation end products: Clinical relevance and limitations. Postgrad. Med. J. 2017, 93, 289–294. [Google Scholar] [CrossRef]
- Stirban, A. Noninvasive Skin Fluorescence Spectroscopy for Diabetes Screening. J. Diabetes Sci. Technol. 2013, 7, 1001–1004. [Google Scholar] [CrossRef]
- Fokkens, B.T.; van Waateringe, R.P.; Mulder, D.J.; Wolffenbuttel, B.H.R.; Smit, A.J. Skin autofluorescence improves the Finnish Diabetes Risk Score in the detection of diabetes in a large population-based cohort: The LifeLines Cohort Study. Diabetes Metab. 2018, 44, 424–430. [Google Scholar] [CrossRef]
- Boersma, H.E.; van der Klauw, M.M.; Smit, A.J.; Wolffenbuttel, B.H.R. A non-invasive risk score including skin autofluorescence predicts diabetes risk in the general population. Sci. Rep. 2022, 12, 21794. [Google Scholar] [CrossRef]
- van Waateringe, R.P.; Fokkens, B.T.; Slagter, S.N.; van der Klauw, M.M.; van Vliet-Ostaptchouk, J.V.; Graaff, R.; Paterson, A.D.; Smit, A.J.; Lutgers, H.L.; Wolffenbuttel, B.H.R. Skin autofluorescence predicts incident type 2 diabetes, cardiovascular disease and mortality in the general population. Diabetologia 2019, 62, 269–280. [Google Scholar] [CrossRef] [PubMed]
- Reurean-Pintilei, D.; Pantea Stoian, A.; Potcovaru, C.-G.; Salmen, T.; Cinteză, D.; Stoica, R.-A.; Lazăr, S.; Timar, B. Skin Autofluorescence as a Potential Adjunctive Marker for Cardiovascular Risk Assessment in Type 2 Diabetes: A Systematic Review. Int. J. Mol. Sci. 2024, 25, 3889. [Google Scholar] [CrossRef]
- Cavero-Redondo, I.; Soriano-Cano, A.; Álvarez-Bueno, C.; Cunha, P.G.; Martínez-Hortelano, J.A.; Garrido-Miguel, M.; Berlanga-Marcias, C.; Martinez-Vizcaino, V. Skin Autofluorescence–Indicated Advanced Glycation End Products as Predictors of Cardiovascular and All-Cause Mortality in High-Risk Subjects: A Systematic Review and Meta-analysis. J. Am. Heart Assoc. 2018, 7, e009833. [Google Scholar] [CrossRef]
- Du, T.; Brandl, B.; Hauner, H.; Skurk, T. Skin Autofluorescence Mirrors Surrogate Parameters of Vascular Aging: An Enable Study. Nutrients 2023, 15, 1597. [Google Scholar] [CrossRef]
- Pan, J.; Bao, X.; Gonçalves, I.; Jujić, A.; Engström, G. Skin autofluorescence, a measure of tissue accumulation of advanced glycation end products, is associated with subclinical atherosclerosis in coronary and carotid arteries. Atherosclerosis 2022, 345, 26–32. [Google Scholar] [CrossRef]
- Kunimoto, M.; Yokoyama, M.; Shimada, K.; Matsubara, T.; Aikawa, T.; Ouchi, S.; Fukao, K.; Miyazaki, T.; Fujiwara, K.; Abulimiti, A.; et al. Relationship between skin autofluorescence levels and clinical events in patients with heart failure undergoing cardiac rehabilitation. Cardiovasc. Diabetol. 2021, 20, 208. [Google Scholar] [CrossRef]
- Ahmad, M.S.; Kimhofer, T.; Ahmad, S.; AlAma, M.N.; Mosli, H.H.; Hindawi, S.I.; Mook-Kanamori, D.O.; Šebeková, K.; Damanhouri, Z.A.; Holmes, E. Ethnicity and skin autofluorescence-based risk-engines for cardiovascular disease and diabetes mellitus. PLoS ONE 2017, 12, e0185175. [Google Scholar] [CrossRef]
- Stirban, A.; Heinemann, L. Skin Autofluorescence—A Non-invasive Measurement for Assessing Cardiovascular Risk and Risk of Diabetes. Eur. Endocrinol. 2014, 10, 106–110. [Google Scholar] [CrossRef]
- Mach, F.; Baigent, C.; Catapano, A.L.; Koskinas, K.C.; Casula, M.; Badimon, L.; Chapman, M.J.; De Backer, G.G.; Delgado, V.; Ference, B.A. 2019 ESC/EAS Guidelines for the management of dyslipidaemias: Lipid modification to reduce cardiovascular risk. Eur. Heart J. 2020, 41, 111–188. [Google Scholar] [CrossRef]
- Casellini, C.M.; Parson, H.K.; Richardson, M.S.; Nevoret, M.L.; Vinik, A.I. Sudoscan, a noninvasive tool for detecting diabetic small fiber neuropathy and autonomic dysfunction. Diabetes Technol. Ther. 2013, 15, 948–953. [Google Scholar] [CrossRef]
- Freedman, B.I.; Bowden, D.W.; Smith, S.C.; Xu, J.; Divers, J. Relationships between electrochemical skin conductance and kidney disease in Type 2 diabetes. J. Diabetes Complicat. 2014, 28, 56–60. [Google Scholar] [CrossRef]
- Yajnik, C.S.; Kantikar, V.; Pande, A.; Deslypere, J.P.; Dupin, J.; Calvet, J.H.; Bauduceau, B. Screening of cardiovascular autonomic neuropathy in patients with diabetes using non-invasive quick and simple assessment of sudomotor function. Diabetes Metab. 2013, 39, 126–131. [Google Scholar] [CrossRef]
- Stevens, P.E.; Ahmed, S.B.; Carrero, J.J.; Foster, B.; Francis, A.; Hall, R.K.; Herrington, W.G.; Hill, G.; Inker, L.A.; Kazancıoğlu, R.; et al. KDIGO 2024 Clinical Practice Guideline for the Evaluation and Management of Chronic Kidney Disease. Kidney Int. 2024, 105, S117–S314. [Google Scholar]
- Hosseini, M.S.; Razavi, Z.; Ehsani, A.H.; Firooz, A.; Afazeli, S. Clinical Significance of Non-invasive Skin Autofluorescence Measurement in Patients with Diabetes: A Systematic Review and Meta-analysis. EClinicalMedicine 2021, 42, 101194. [Google Scholar] [CrossRef]
- Wang, X.; Zhao, X.; Lian, T.; Wei, J.; Yue, W.; Zhang, S.; Chen, Q. Skin autofluorescence and the complexity of complications in patients with type 2 diabetes mellitus: A cross-sectional study. BMC Endocr. Disord. 2021, 21, 58. [Google Scholar] [CrossRef]
- Papachristou, S.; Pafili, K.; Trypsianis, G.; Papazoglou, D.; Vadikolias, Κ.; Papanas, N. Skin advanced glycation end products as a screening tool of neuropathy in type 2 diabetes mellitus. J. Diabetes Complicat. 2022, 36, 108356. [Google Scholar] [CrossRef]
- Borderie, G.; Foussard, N.; Larroumet, A.; Blanco, L.; Barbet-Massin, M.A.; Ducos, C.; Rami-Arab, L.; Domenge, F.; Mohammedi, K.; Ducasse, E.; et al. The skin autofluorescence of advanced glycation end-products relates to the development of foot ulcers in type 2 diabetes: A longitudinal observational study. J. Diabetes Complicat. 2023, 37, 108595. [Google Scholar] [CrossRef]
- Stirban, A.O.; Bondor, C.I.; Florea, B.; Veresiu, I.A.; Gavan, N.A. Skin autofluorescence: Correlation with measures of diabetic sensorimotor neuropathy. J. Diabetes Complicat. 2018, 32, 851–856. [Google Scholar] [CrossRef]
- Al-Saoudi, E.; Christensen, M.M.B.; Nawroth, P.; Fleming, T.; Hommel, E.E.; Jørgensen, M.E.; Fleischer, J.; Hansen, C.S. Advanced glycation end-products are associated with diabetic neuropathy in young adults with type 1 diabetes. Front. Endocrinol. 2022, 13, 891442. [Google Scholar] [CrossRef]
- Guo, H.; Xu, Y. Role of advanced glycation end products in the progression of diabetes mellitus. Glob. J. Obes. Diabetes Metab. Syndr. 2017, 4, 024–035. [Google Scholar]
- Al-Mesallamy, H.O.; Hammad, L.N.; El-Mamoun, T.A.; Khalil, B.M. Role of advanced glycation end product receptors in the pathogenesis of diabetic retinopathy. J. Diabetes Complicat. 2011, 25, 168–174. [Google Scholar] [CrossRef]
- Yasuda, M.; Shimura, M.; Kunikata, H.; Kanazawa, H.; Yasuda, K.; Tanaka, Y.; Konno, H.; Takahashi, M.; Kokubun, T.; Maruyama, K. Relationship of Skin Autofluorescence to Severity of Retinopathy in Type 2 Diabetes. Curr. Eye Res. 2015, 40, 338–345. [Google Scholar] [CrossRef]
- Hirano, T.; Iesato, Y.; Toriyama, Y.; Imai, A.; Chiba, D.; Murata, T. Correlation between diabetic retinopathy severity and elevated skin autofluorescence as a marker of advanced glycation end-product accumulation in type 2 diabetic patients. J. Diabetes Complicat. 2014, 28, 729–734. [Google Scholar] [CrossRef]
- Takayanagi, Y.; Yamanaka, M.; Fujihara, J.; Matsuoka, Y.; Gohto, Y.; Obana, A.; Tanito, M. Evaluation of Relevance between Advanced Glycation End Products and Diabetic Retinopathy Stages Using Skin Autofluorescence. Antioxidants 2020, 9, 1100. [Google Scholar] [CrossRef]
- Martínez-García, I.; Cavero-Redondo, I.; Álvarez-Bueno, C.; Pascual-Morena, C.; Gómez-Guijarro, M.D.; Saz-Lara, A. Non-invasive skin autofluorescence as a screening method for diabetic retinopathy. Diabetes Metab. Res. Rev. 2024, 40, e3721. [Google Scholar] [CrossRef]
- Błaszkiewicz, M.; Walulik, A.; Florek, K.; Górecki, I.; Sławatyniec, O.; Gomułka, K. Advances and Perspectives in Relation to the Molecular Basis of Diabetic Retinopathy—A Review. Biomedicines 2023, 11, 2951. [Google Scholar] [CrossRef]
- Dozio, E.; Caldiroli, L.; Molinari, P.; Castellano, G.; Delfrate, N.W.; Romanelli, M.M.C.; Vettoretti, S. Accelerated AGEing: The Impact of Advanced Glycation End Products on the Prognosis of Chronic Kidney Disease. Antioxidants 2023, 12, 584. [Google Scholar] [CrossRef]
- Fraser, S.D.; Roderick, P.J.; McIntyre, N.J.; Harris, S.; McIntyre, C.W.; Fluck, R.J.; Taal, M.W. Skin autofluorescence and all-cause mortality in stage 3 CKD. Clin. J. Am. Soc. Nephrol. 2014, 9, 1361–1368. [Google Scholar] [CrossRef]
- Rigalleau, V.; Cougnard-Gregoire, A.; Nov, S.; Gonzalez, C.; Maury, E.; Lorrain, S.; Gin, H.; Barberger-Gateau, P. Association of advanced glycation end products and chronic kidney disease with macroangiopathy in type 2 diabetes. J. Diabetes Complicat. 2015, 29, 270–274. [Google Scholar] [CrossRef]
- Jin, Q.; Lau, E.S.; Luk, A.O.; Ozaki, R.; Chow, E.Y.; So, T.; Yeung, T.; Loo, K.M.; Lim, C.K.; Kong, A.P.; et al. Skin autofluorescence is associated with progression of kidney disease in type 2 diabetes: A prospective cohort study from the Hong Kong diabetes biobank. Nutr. Metab. Cardiovasc. Dis. 2022, 32, 436–446. [Google Scholar] [CrossRef]
- Kulkarni, A.; Thool, A.R.; Daigavane, S.; Aditi, S. Understanding the Clinical Relationship Between Diabetic Retinopathy, Nephropathy, and Neuropathy: A Comprehensive Review. Cureus 2024, 16, e56674. [Google Scholar] [CrossRef]
- Bhatti, J.S.; Sehrawat, A.; Mishra, J.; Sidhu, I.S.; Navik, U.; Khullar, N.; Kumar, S.; Bhatti, G.K.; Reddy, P.H. Oxidative stress in the pathophysiology of type 2 diabetes and related complications: Current therapeutics strategies and future perspectives. Free Radic. Biol. Med. 2022, 184, 114–134. [Google Scholar] [CrossRef]
- Welsh, K.J.; Kirkman, M.S.; Sacks, D.B. Role of Glycated Proteins in the Diagnosis and Management of Diabetes: Research Gaps and Future Directions. Diabetes Care 2016, 39, 1299–1306. [Google Scholar] [CrossRef]
- Hosseini, M.S.; Razavi, Z.; Bahri, R.A.; Ehsani, A.H.; Firooz, A.; Aryanian, Z.; Ehsani, A.; Sadeghi, Y. Is skin autofluorescence a novel non-invasive marker in diabetes? A systematic review and meta-analysis of case-control studies. J. Res. Med. Sci. 2023, 28, 68. [Google Scholar]
- Genuth, S.; Sun, W.; Cleary, P.; Sell, D.R.; Dahms, W.; Malone, J.; Sivitz, W.; Monnier, V.M.; DCCT Skin Collagen Ancillary Study Group. Glycation and carboxymethyllysine levels in skin collagen predict the risk of future 10-year progression of diabetic retinopathy and nephropathy in the diabetes control and complications trial and epidemiology of diabetes interventions and complications participants with type 1 diabetes. Diabetes 2005, 54, 3103–3111. [Google Scholar]
- Planas, A.; Simó-Servat, O.; Hernández, C.; Simó, R. Advanced Glycations End Products in the Skin as Biomarkers of Cardiovascular Risk in Type 2 Diabetes. Int. J. Mol. Sci. 2022, 23, 6234. [Google Scholar] [CrossRef]
- Sternberg, M.; M’bemba, J.; Urios, P.; Borsos, A.M.; Selam, J.L.; Peyroux, J.; Slama, G. Skin collagen pentosidine and fluorescence in diabetes were predictors of retinopathy progression and creatininemia increase already 6years after punch-biopsy. Clin. Biochem. 2016, 49, 225–231. [Google Scholar] [CrossRef]
- Koetsier, M.; Lutgers, H.L.; de Jonge, C.; Links, T.P.; Smit, A.J.; Graaff, R. Reference values of skin autofluorescence. Diabetes Technol. Ther. 2010, 12, 399–403. [Google Scholar] [CrossRef]
- Zgutka, K.; Tkacz, M.; Tomasiak, P.; Tarnowski, M. A Role for Advanced Glycation End Products in Molecular Ageing. Int. J. Mol. Sci. 2023, 24, 9881. [Google Scholar] [CrossRef]
- Kohn, J.C.; Lampi, M.C.; Reinhart-King, C.A. Age-related vascular stiffening: Causes and consequences. Front. Genet. 2015, 6, 112. [Google Scholar] [CrossRef]
- de la Cruz-Ares, S.; Cardelo, M.P.; Gutiérrez-Mariscal, F.M.; Torres-Peña, J.D.; García-Rios, A.; Katsiki, N.; Malagón, M.M.; López-Miranda, J.; Pérez-Martínez, P.; Yubero-Serrano, E.M. Endothelial Dysfunction and Advanced Glycation End Products in Patients with Newly Diagnosed Versus Established Diabetes: From the CORDIOPREV Study. Nutrients 2020, 12, 238. [Google Scholar] [CrossRef]
- Alkhami, F.; Borderie, G.; Foussard, N.; Larroumet, A.; Blanco, L.; Barbet-Massin, M.A.; Ferriere, A.; Ducos, C.; Mohammedi, K.; Fawaz, S.; et al. Skin autofluorescence of advanced glycation end-products relates to new cardiovascular events in type 2 diabetes: A longitudinal observational study. Diabetes Metab. 2024, 50, 101524. [Google Scholar] [CrossRef]
- Boersma, H.E.; van Waateringe, R.P.; van der Klauw, M.M.; Graaff, R.; Paterson, A.D.; Smit, A.J.; Wolffenbuttel, B.H.R. Skin autofluorescence predicts new cardiovascular disease and mortality in people with type 2 diabetes. BMC Endocr. Disord. 2021, 21, 14. [Google Scholar] [CrossRef] [PubMed]
- Alkhami, F.; Borderie, G.; Foussard, N.; Larroumet, A.; Blanco, L.; Barbet-Massin, M.A.; Ferriere, A.; Ducos, C.; Mohammedi, K.; Fawaz, S.; et al. The skin autofluorescence may help to select patients with Type 2 diabetes candidates for screening to revascularization procedures. Cardiovasc. Diabetol. 2024, 23, 32. [Google Scholar] [CrossRef] [PubMed]
- Chen, J.; Arshi, B.; Waqas, K.; Lu, T.; Bos, D.; Ikram, M.A.; Uitterlinden, A.G.; Kavousi, M.; Zillikens, M.C. Advanced glycation end products measured by skin autofluorescence and subclinical cardiovascular disease: The Rotterdam Study. Cardiovasc. Diabetol. 2023, 22, 326. [Google Scholar] [CrossRef] [PubMed]
- Reurean-Pintilei, D.; Potcovaru, C.-G.; Salmen, T.; Mititelu-Tartau, L.; Cinteză, D.; Lazăr, S.; Pantea Stoian, A.; Timar, R.; Timar, B. Assessment of Cardiovascular Risk Categories and Achievement of Therapeutic Targets in European Patients with Type 2 Diabetes. J. Clin. Med. 2024, 13, 2196. [Google Scholar] [CrossRef]
- McGurnaghan, S.; Blackbourn, L.A.K.; Mocevic, E.; Haagen Panton, U.; McCrimmon, R.J.; Sattar, N.; Wild, S.; Colhoun, H.M. Cardiovascular disease prevalence and risk factor prevalence in Type 2 diabetes: A contemporary analysis. Diabet. Med. 2019, 36, 718–725. [Google Scholar] [CrossRef] [PubMed]
- Rungby, J.; Schou, M.; Warrer, P.; Ytte, L.; Andersen, G.S. Prevalence of cardiovascular disease and evaluation of standard of care in type 2 diabetes: A nationwide study in primary care. Cardiovasc. Endocrinol. 2017, 6, 145–151. [Google Scholar] [CrossRef] [PubMed]
- Ray, K.K.; Haq, I.; Bilitou, A.; Manu, M.C.; Burden, A.; Aguiar, C.; Arca, M.; Connolly, D.L.; Eriksson, M.; Ferrieres, J.; et al. Treatment gaps in the implementation of LDL cholesterol control among high- and very high-risk patients in Europe between 2020 and 2021: The multinational observational SANTORINI study. Lancet Reg. Health Eur. 2023, 29, 100624. [Google Scholar] [CrossRef] [PubMed]
- Lutgers, H.L.; Gerrits, E.G.; Graaff, R.; Links, T.P.; Sluiter, W.J.; Gans, R.O.; Bilo, H.J.; Smit, A.J. Skin autofluorescence provides additional information to the UK Prospective Diabetes Study (UKPDS) risk score for the estimation of cardiovascular prognosis in type 2 diabetes mellitus. Diabetologia 2009, 5, 789–797. [Google Scholar] [CrossRef] [PubMed]
- Noordzij, M.J.; Mulder, D.J.; Oomen, P.H.; Brouwer, T.; Jager, J.; Castro Cabezas, M.; Lefrandt, J.D.; Smit, A.J. Skin autofluorescence and risk of micro- and macrovascular complications in patients with Type 2 diabetes mellitus-a multi-centre study. Diabet. Med. 2012, 29, 1556–1561. [Google Scholar] [CrossRef]
- Chen, J.; Waqas, K.; Tan, R.C.; Voortman, T.; Ikram, M.A.; Nijsten, T.E.C.; de Groot, L.C.P.G.M.; Uitterlinden, A.G.; Zillikens, M.C. The association between dietary and skin advanced glycation end products: The Rotterdam Study. Am. J. Clin. Nutr. 2020, 112, 129–137. [Google Scholar] [CrossRef]


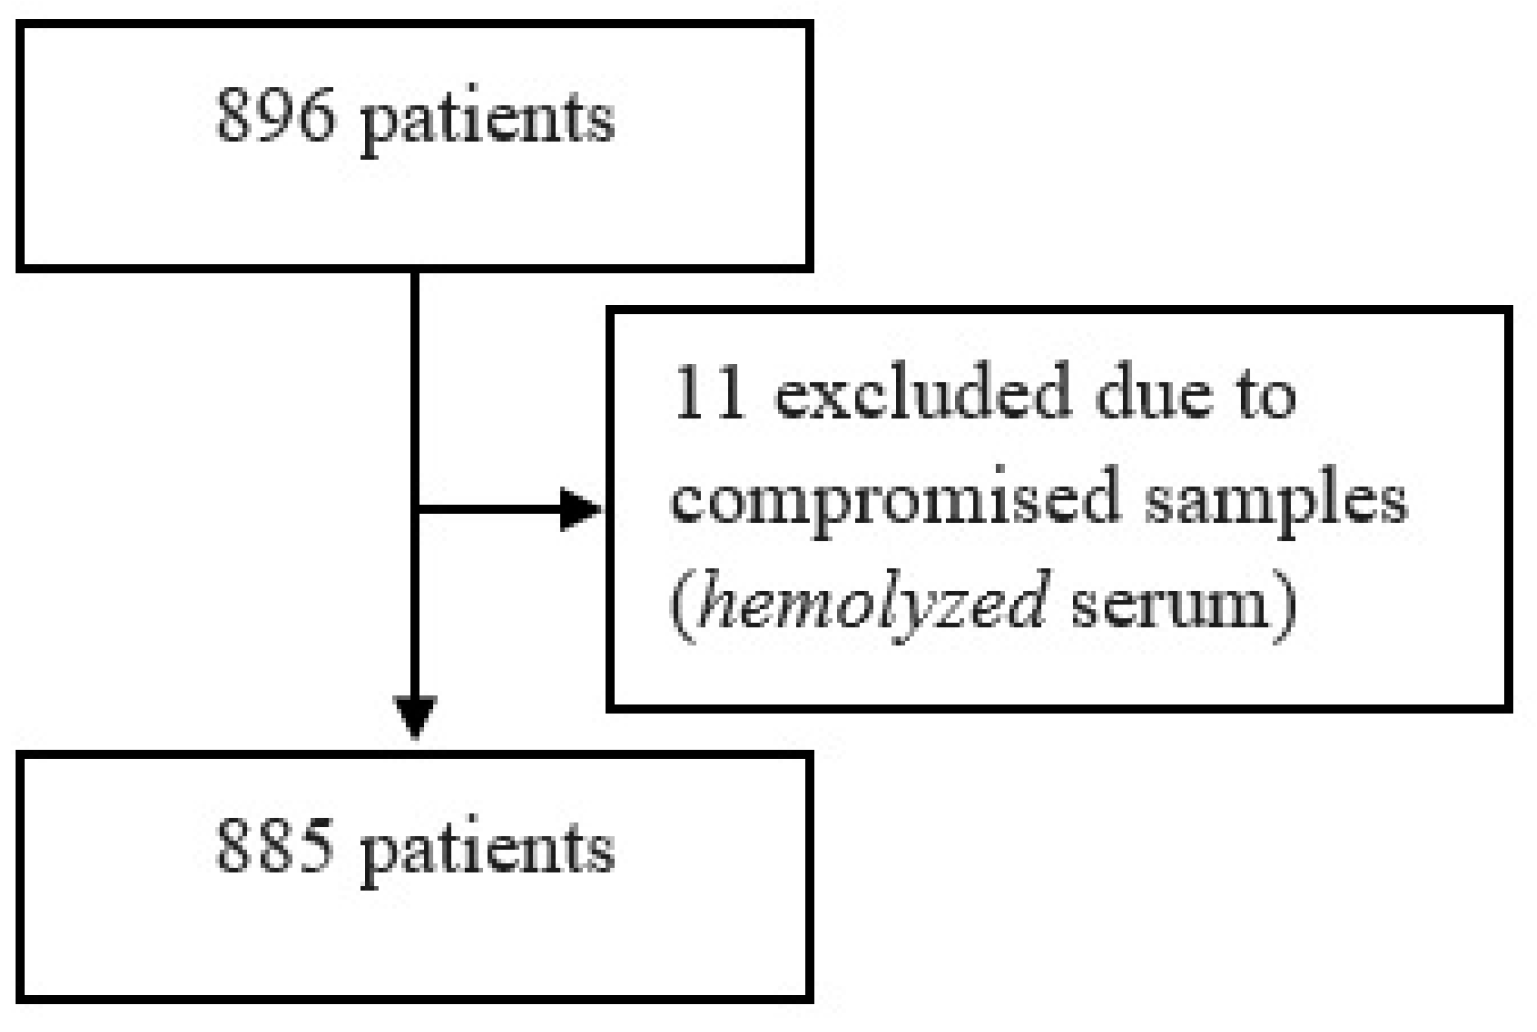
| Characteristic | n = 885 |
|---|---|
| Demographics | |
| Urban, %, n | 74.69% (661) |
| Age (years), mean (SD) | 62.9 ± 7.7 |
| Women, %, (n) | 53.7% (475) |
| Anthropometrics | |
| BMI (kg/m2), mean (SD) | 32.3 ± 5.3 |
| Waist circumference (cm), mean (SD) | 104.74 ± 11.7 |
| Hip circumference (cm), mean (SD) | 109.34 ± 9.94 |
| Waist–hip ratio, mean (SD) | 0.96 ± 0.074 |
| Characteristic | n = 885 |
|---|---|
| Risk factors | |
| Mean SAF level, mean (SD) | 2.6 ± 0.5 |
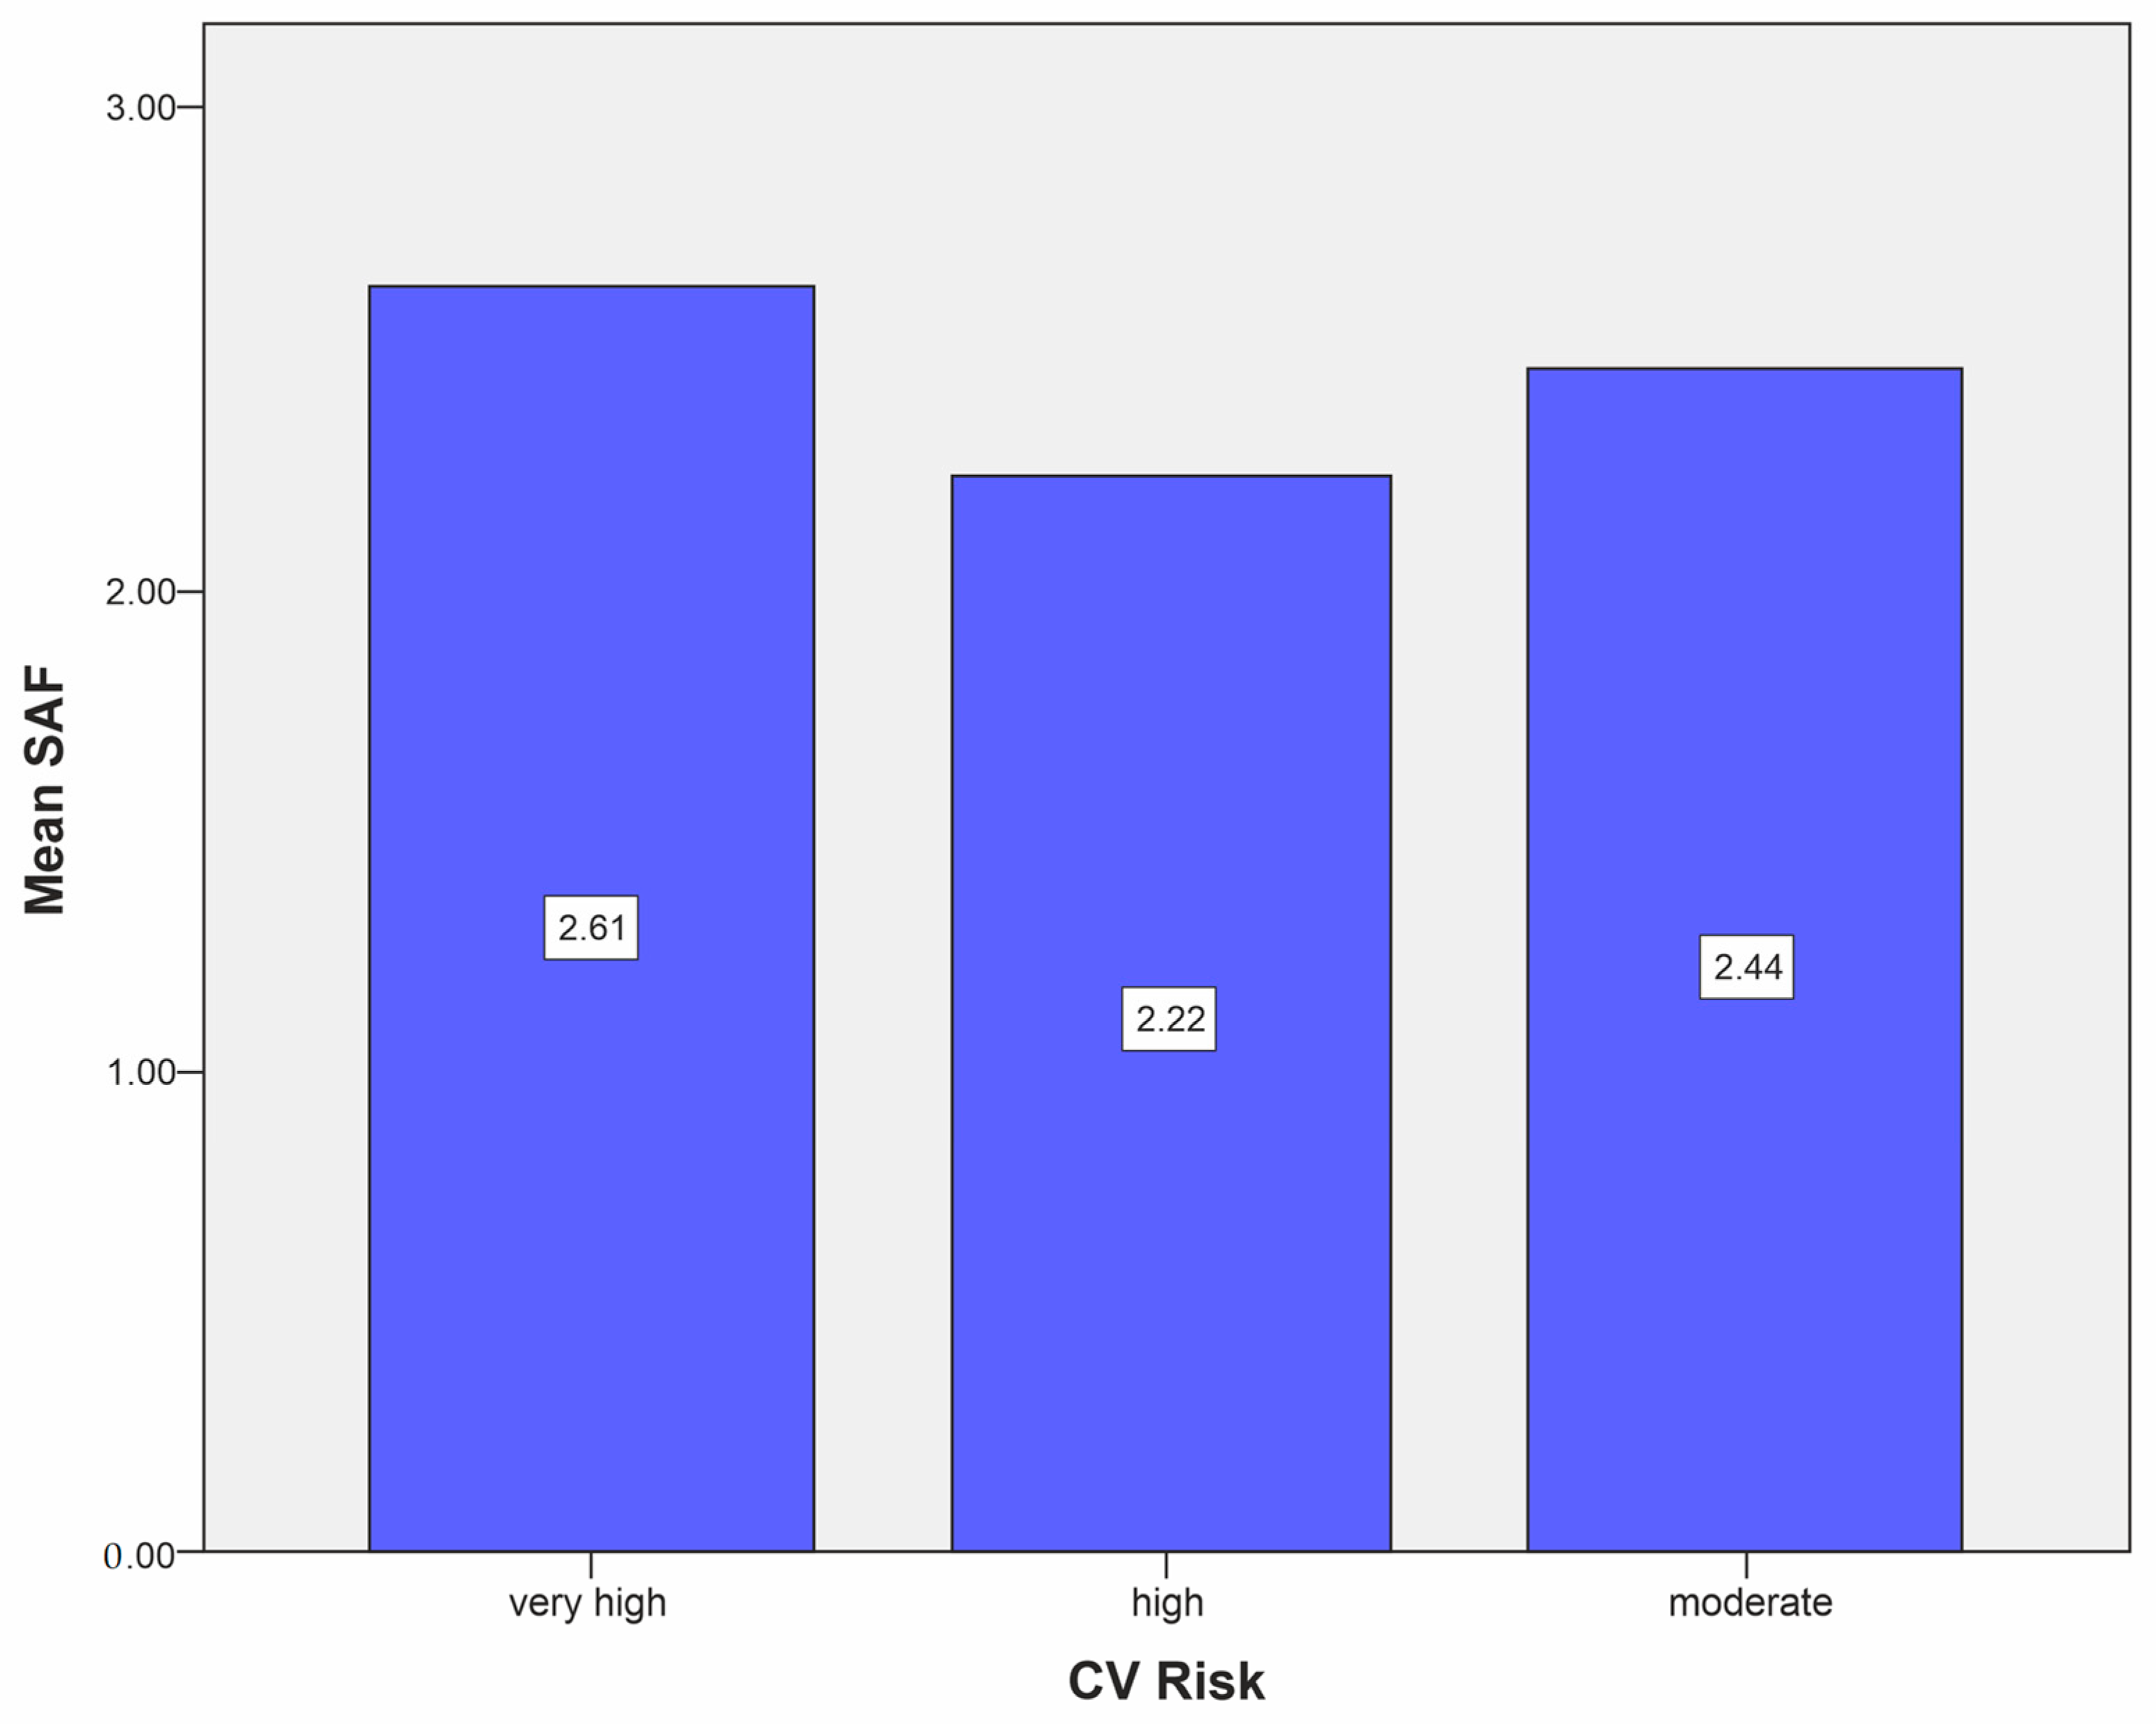
| Mean SAF level in the moderate CV risk category, mean (SD) | 2.44 ± 0.55 |
| Mean SAF level in the high CV risk category, mean (SD) | 2.22 ± 0.29 |
| Mean SAF level in the very high CV risk category, mean (SD) | 2.61 ± 0.5 |
| Obesity, %, (n) | 64.6% (572) |
| HBP, %, (n) | 83% (737) |
| SBP (mm Hg), mean (SD) | 132 ± 16.2 |
| DBP (mm Hg), mean (SD) | 80 ± 9.6 |
| CVD, %, (n) | 13.9% (123) |
| Total-C (mg/dL), mean (SD) | 185.1 ± 43.3 |
| HDL-C (mg/dL), mean (SD) | 44.9 ± 11.8 |
| TGs (mg/dL), median (interquartile range) | 142 (104 to 197) |
| LDL-C (mg/dL), mean (SD) | 107.7 ± 36.0 |
| Creatinin (mg/dL), median (interquartile range) | 0.83 (0.68 to 0.9) |
| eGFR (mL/min/1.73 m2) | 87.5 ± 20.6 |
| Moderate CV risk category, %, n | 6.1% (54) |
| High CV risk category, %, n | 1.13% (10) |
| Very high CV risk category, %, n | 92.77% (821) |
| DM Characteristics | n = 885 |
|---|---|
| DM mean duration, mean (SD) | 9.0 ± 4.4 |
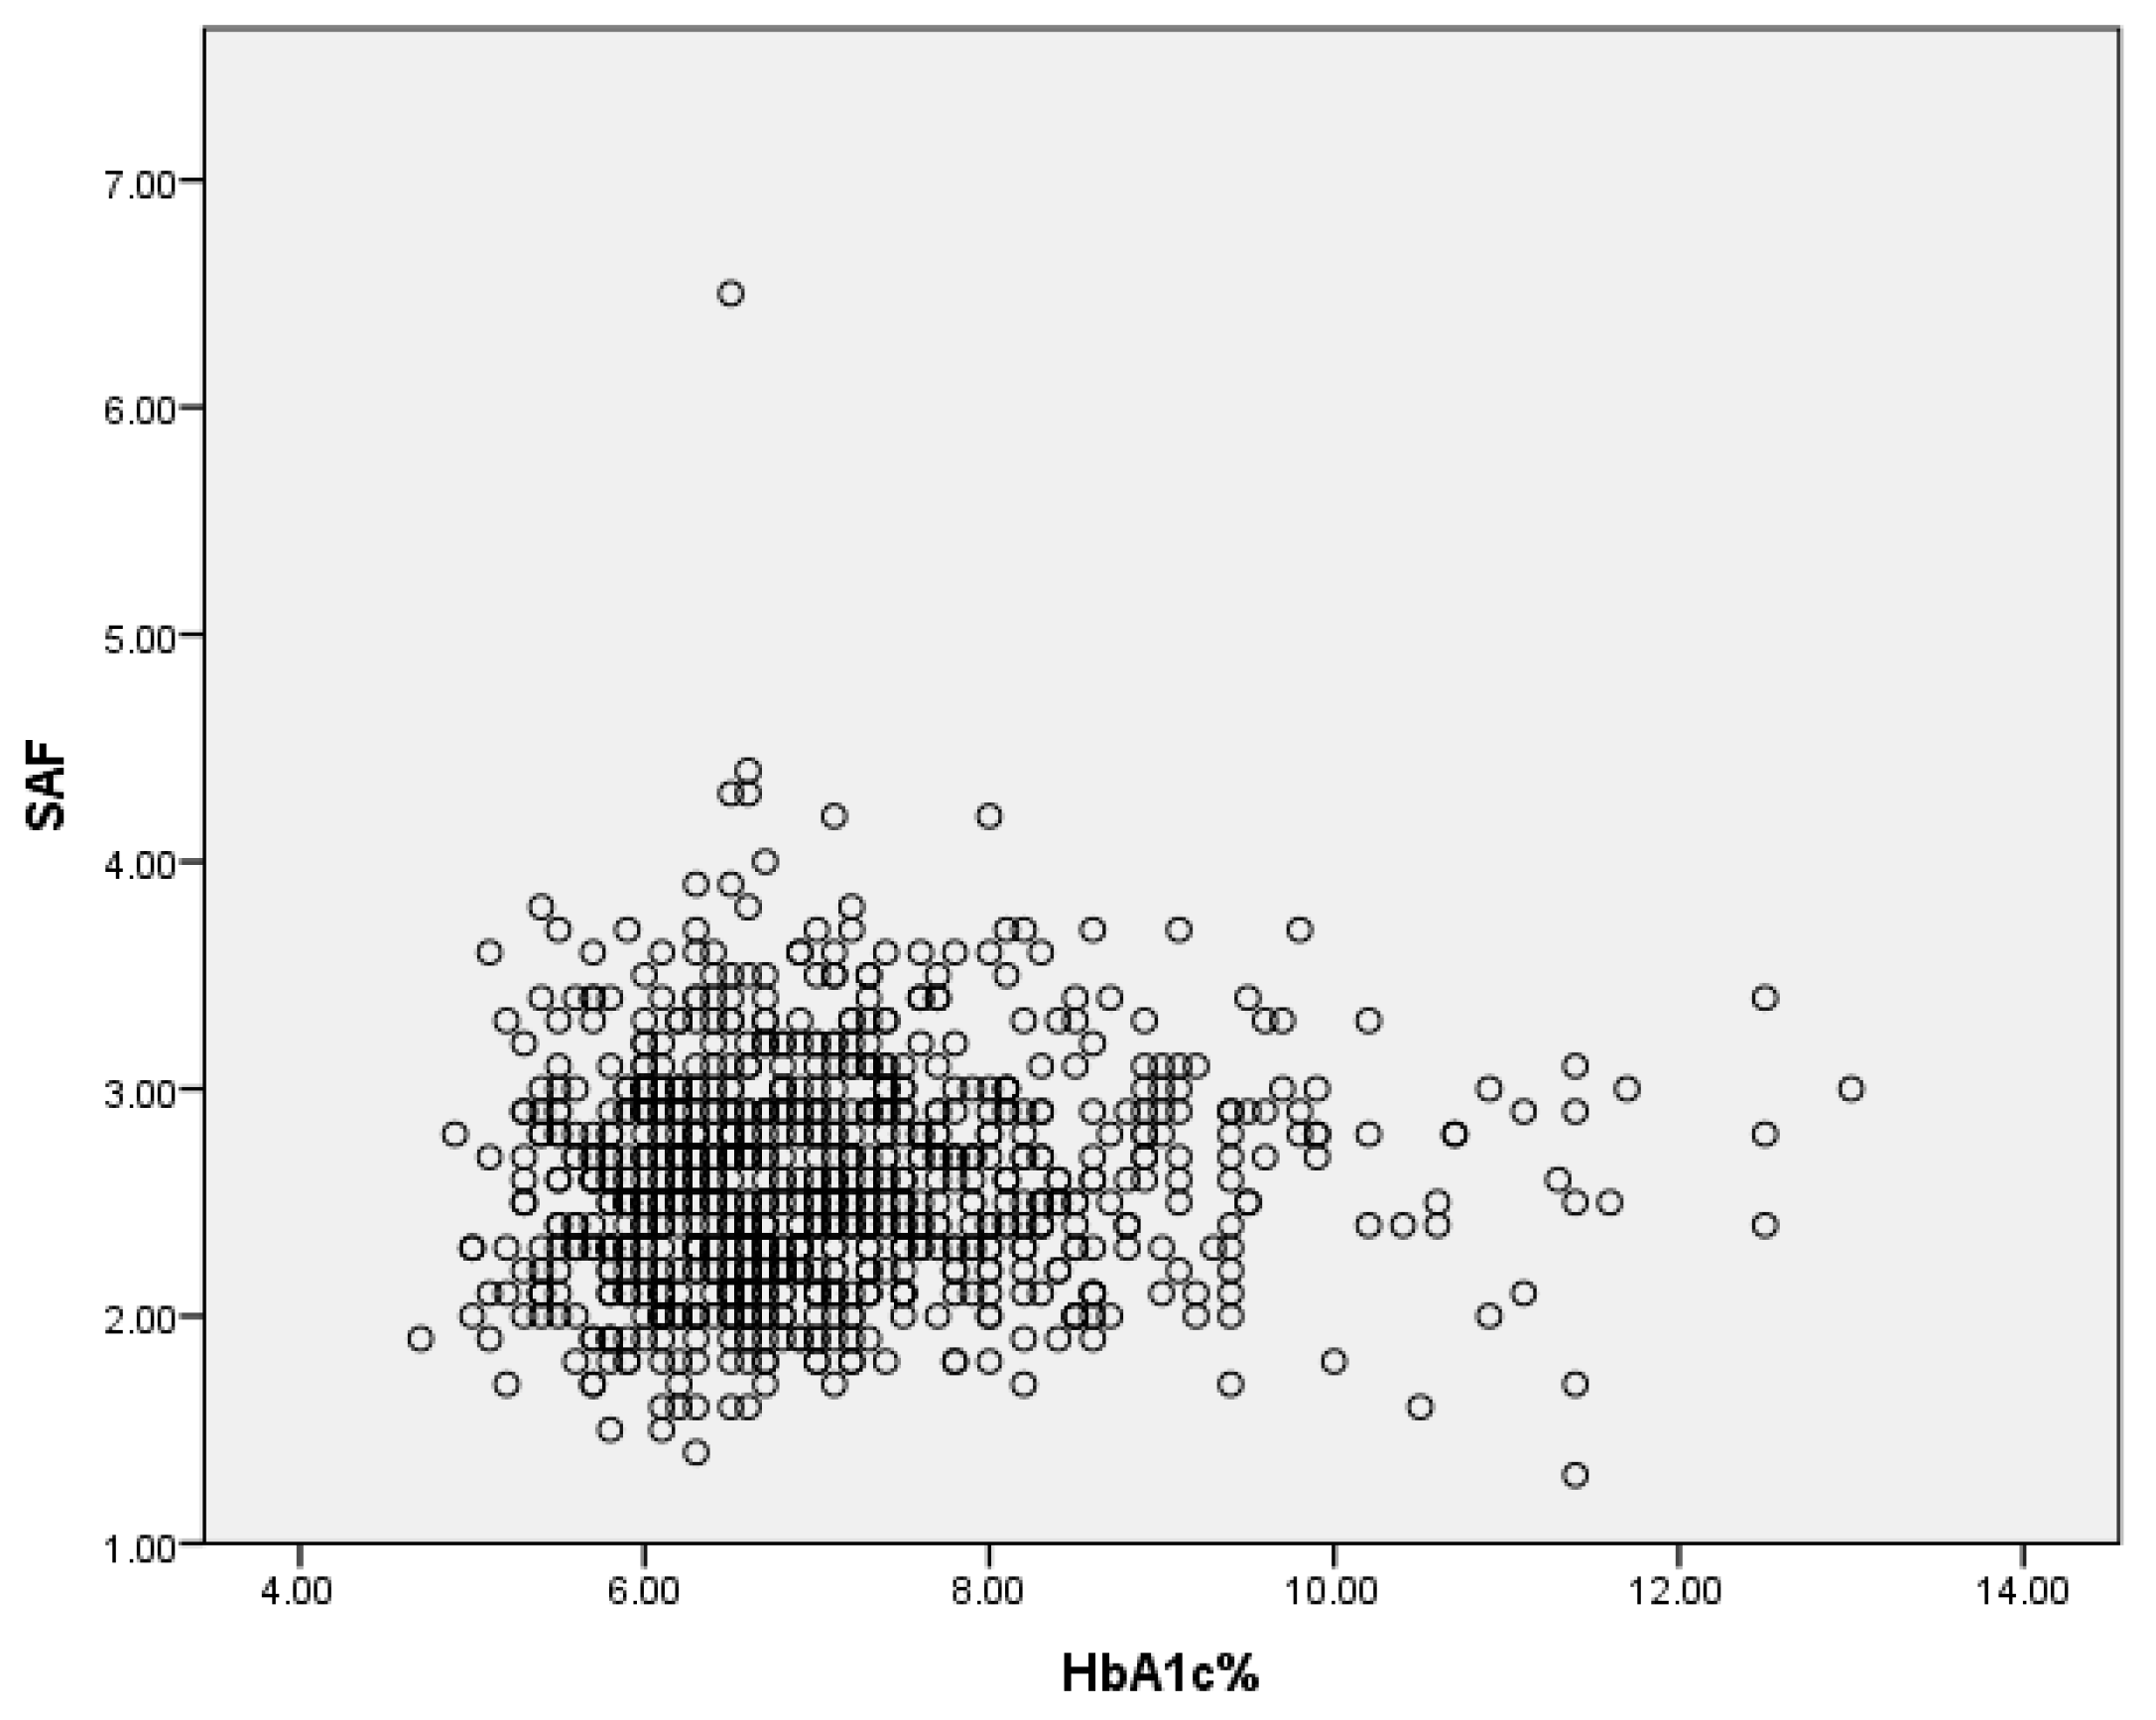
| HbA1c (%), mean (SD) | 7.1 ± 1.3 |
| DSPN, %, n | 67.9% (601) |
| DR, %, n | 4.29% (38) |
| CKD, %, n | 8.7% (76) |
| Stage V CKD, %, n | 0 |
| Stage IV CKD, %, n | 3 (0.34%) |
| Stage IIIa CKD, %, n | 13 (1.47%) |
| Stage IIIb CKD, %, n | 60 (6.78%) |
| Albuminuria, %, n | 6.21% (55) |
| Characteristic | n = 885 |
|---|---|
| Glucose-lowering medication usage | |
| Insulin, %, (n) | 25.2% (223) |
| Metformin, %, (n) | 87.0% (687) |
| DPP-4i, %, (n) | 13.0% (115) |
| GLP-1 RAs, %, (n) | 8.1% (71) |
| SGLT2i, %, (n) | 3.9% (34) |
| Sulfonylurea, %, (n) | 13.1% (116) |
| Thiazolidinediones, %, (n) | 1.35% (12) |
| Other therapies | |
| ACEi/ARBs, %, (n) | 61.5% (544) |
| Calcium channel blockers, %, (n) | 33.1% (293) |
| Beta-blockers, %, (n) | 54.57% (483) |
| Antiagregant, %, (n) | 44.85% (397) |
| Statin, %, (n) | 67.0% (593) |
| Ezetimibe, %, (n) | 4.5% (40) |
| Fibrate, %, (n) | 8.7% (77) |
| Non-vitamin K antagonist oral anticoagulants, %, (n) | 1.8% (16) |
| Vitamin K antagonists, %, (n) | 1.12% (10) |
| DM Complications | n | Present | Absent | Student’s t-Test |
|---|---|---|---|---|
| DSPN | 601 | 2.61 ± 0.51 | 2.60 ± 0.49 | p = 0.792 |
| DR | 38 | 2.58 ± 0.44 | 2.61 ± 0.51 | p = 0.746 |
| CKD | 76 | 2.76 ± 0.49 | 2.58 ± 0.51 | p = 0.003 |
| Albuminuria | 55 | 2.56 ± 0.50 | 2.61 ± 0.51 | p = 0.497 |
| Parameters | SAF ≤ 2.35 (n = 301) | SAF > 2.35 (n = 584) | Statistic Tests | p |
|---|---|---|---|---|
| Age, mean ± SD | 60.06 ± 8.42 | 64.30 ± 6.86 | Student’s t-test | <0.001 |
| Female, n, (%) | 163 (54.2%) | 312 (53.4%) | Chi2 test | 0.837 |
| Age of DM, mean ± SD | 8.78 ± 4.68 | 9.06 ± 4.25 | Student’s t-test | 0.369 |
| HbA1c mean ± SD | 6.86 ± 1.12 | 7.17 ± 1.30 | Student’s t-test | <0.001 |
| DSPN, n, (%) | 200 (66.44%) | 401 (68.66%) | Chi2 test | 0.733 |
| DR, n, (%) | 13 (4.31%) | 25 (4.28%) | Chi2 test | 0.937 |
| CKD, n, (%) | 5 (1.66%) | 12 (2.05%) | Chi2 test | 0.711 |
| Albuminuria, n, (%) | 19 (6.31%) | 36 (6.16%) | Chi2 test | 0.880 |
| Logistic Regression Models (Very High Risk—Yes/No) | Predictors | OR (95% CI) | p |
|---|---|---|---|
| Model adjust 1 | Age | 1.071 (1.049–1.094) | 0.001 |
| Model adjust 2 | Age | 1.067 (1.044–1.091) | 0.001 |
| Female gender | 1.408 (1.046–1.895) | 0.024 | |
| Model adjust 3 | Age | 1.072 (1.048–1.096) | 0.001 |
| Female gender | 1.430 (1.061–1.928) | 0.019 | |
| HbA1c | 1.322 (1.149–1.522) | 0.010 |
Disclaimer/Publisher’s Note: The statements, opinions and data contained in all publications are solely those of the individual author(s) and contributor(s) and not of MDPI and/or the editor(s). MDPI and/or the editor(s) disclaim responsibility for any injury to people or property resulting from any ideas, methods, instructions or products referred to in the content. |
© 2024 by the authors. Licensee MDPI, Basel, Switzerland. This article is an open access article distributed under the terms and conditions of the Creative Commons Attribution (CC BY) license (https://creativecommons.org/licenses/by/4.0/).
Share and Cite
Reurean-Pintilei, D.; Pantea Stoian, A.; Salmen, T.; Stoica, R.-A.; Mititelu-Tartau, L.; Lazăr, S.; Timar, B. Associations between Skin Autofluorescence Levels with Cardiovascular Risk and Diabetes Complications in Patients with Type 2 Diabetes. Biomedicines 2024, 12, 890. https://doi.org/10.3390/biomedicines12040890
Reurean-Pintilei D, Pantea Stoian A, Salmen T, Stoica R-A, Mititelu-Tartau L, Lazăr S, Timar B. Associations between Skin Autofluorescence Levels with Cardiovascular Risk and Diabetes Complications in Patients with Type 2 Diabetes. Biomedicines. 2024; 12(4):890. https://doi.org/10.3390/biomedicines12040890
Chicago/Turabian StyleReurean-Pintilei, Delia, Anca Pantea Stoian, Teodor Salmen, Roxana-Adriana Stoica, Liliana Mititelu-Tartau, Sandra Lazăr, and Bogdan Timar. 2024. "Associations between Skin Autofluorescence Levels with Cardiovascular Risk and Diabetes Complications in Patients with Type 2 Diabetes" Biomedicines 12, no. 4: 890. https://doi.org/10.3390/biomedicines12040890
APA StyleReurean-Pintilei, D., Pantea Stoian, A., Salmen, T., Stoica, R.-A., Mititelu-Tartau, L., Lazăr, S., & Timar, B. (2024). Associations between Skin Autofluorescence Levels with Cardiovascular Risk and Diabetes Complications in Patients with Type 2 Diabetes. Biomedicines, 12(4), 890. https://doi.org/10.3390/biomedicines12040890