Abstract
The prevalence of overweight and obesity increases in people with type 1 diabetes (T1D). However, the impact of fat accumulation on glucose dynamics in T1D is poorly understood. We assessed continuous glucose monitoring (CGM) parameters in patients with T1D depending on their body weight, body composition, and insulin sensitivity. In 547 patients, including 238 overweight/obese individuals, CGM-derived time in range (TIR) and glucose variability (GV) were estimated. Body composition was assessed by DXA. Estimated glucose disposal rate (eGDR) was used as an indicator of insulin sensitivity. Overweight/obese patients, when compared to normal-weight ones, have a lower time below range (TBR) (<3 mmol/L), GV, and experienced fewer episodes of low glucose. In men, lower TIR, higher time above range (TAR), and GV reduction were associated with central adiposity assessed by total, trunk, and android fat mass. In women, gynoid fat mass only was associated with a lower TIR and higher TAR. The eGDR was a positive predictor of TIR and a negative predictor of TAR, TBR, and GV in men and women. In conclusion, adiposity in people with T1D is associated with a lower risk of CGM-confirmed hypoglycemia, higher TAR, and reduced GV. These features of daily glucose dynamics may be mediated by insulin resistance.
1. Introduction
Type 1 diabetes (T1D) is a chronic disease with a high risk of complications and a negative impact on quality of life. In 2022, the total number of people living with T1D was estimated to be about 8.75 million worldwide [1]. Life expectancy of a 10-year-old individual diagnosed with T1D varies from a mean of 13 years in low-income countries to 65 years in high-income countries [2].
Current research demonstrates some trends in the natural history and phenotype of T1D. Nowadays, new cases of the disease are more often registered in adults [1,2]. Another current feature of T1D is the presence of overweight or obesity in a significant proportion of patients [3,4]. In youths with T1D, the prevalence of overweight and obesity varies from 15 to 36% [4]. In this cohort, a higher body mass index (BMI) and waist circumference (WC) correlate with lower insulin sensitivity [5]. Metabolic syndrome is increasingly detected in patients with T1D [6,7]. A recent meta-analysis of 27 studies revealed that 23.7% of T1D individuals are affected by metabolic syndrome [8].
It can be assumed that reduced insulin sensitivity in overweight and obese patients with T1D may affect their insulin requirement, the quality of glycemic control, and the risk of complications. Indeed, it was shown that an increased BMI in people with T1D is associated with a higher insulin dose and a worse cardiometabolic risk factor profile [9]. In the Diabetes Control and Complication Trial (DCCT), higher insulin resistance at baseline was associated with an increased subsequent risk of micro- and macrovascular diseases [10]. In the Diabetes Control and Complications Trial/Epidemiology of Diabetes Interventions and Complications (DCCT/EDIC) study, high body weight variability in people with T1D was related to an increased risk of major adverse events and all-cause mortality [11].
Accumulating evidence suggests that body weight and fat mass could be associated with both mean glucose and glucose variability (GV) levels across different stages of the metabolic continuum. In subjects with normal glucose tolerance, those who are overweight demonstrated slightly higher mean glucose estimated by continuous glucose monitoring (CGM) than individuals with normal weight; both fat mass and fat distribution were associated with mean glucose and amplitude-dependent GV parameters [12]. Results of a recent meta-analysis including 71 studies indicate that, in people with prediabetes, GV is increased, but is less clearly associated with adiposity and insulin sensitivity [13]. In patients with T1D, the presence of metabolic syndrome was reported to be associated with higher GV [14]. It was shown that GV is related to the adverse vascular profile in T1D patients, but only in those with concomitant insulin resistance [15].
Currently, there is very little data on the glucose dynamics in overweight and obese people with T1D, as well as on the relationships between GV and body composition in this cohort. Therefore, in this study, we examined CGM-derived time in the glucose ranges and a number of GV parameters in patients with T1D depending on body weight, body composition, and insulin sensitivity.
2. Materials and Methods
2.1. Design
Adult Caucasian men and women with insulin-treated T1D were included in this cross-sectional single-center comparative study. The list of exclusion criteria included: age under 18 years, type 2 diabetes (T2D) or other specific types of the disease, current hyperglycemic crises (diabetic ketoacidosis or hyperglycemic hyperosmolar states), pregnancy, end-stage renal disease, malignancies, and accompanied diseases, which may affect glucose metabolism. Since most patients also participated in the study of inflammatory markers [16], chronic inflammatory or autoimmune diseases, acute infections within three months prior to the study, treatment with glucocorticoids, non-steroidal anti-inflammatory drugs, or immunosuppressive agents also applied as exclusion criteria.
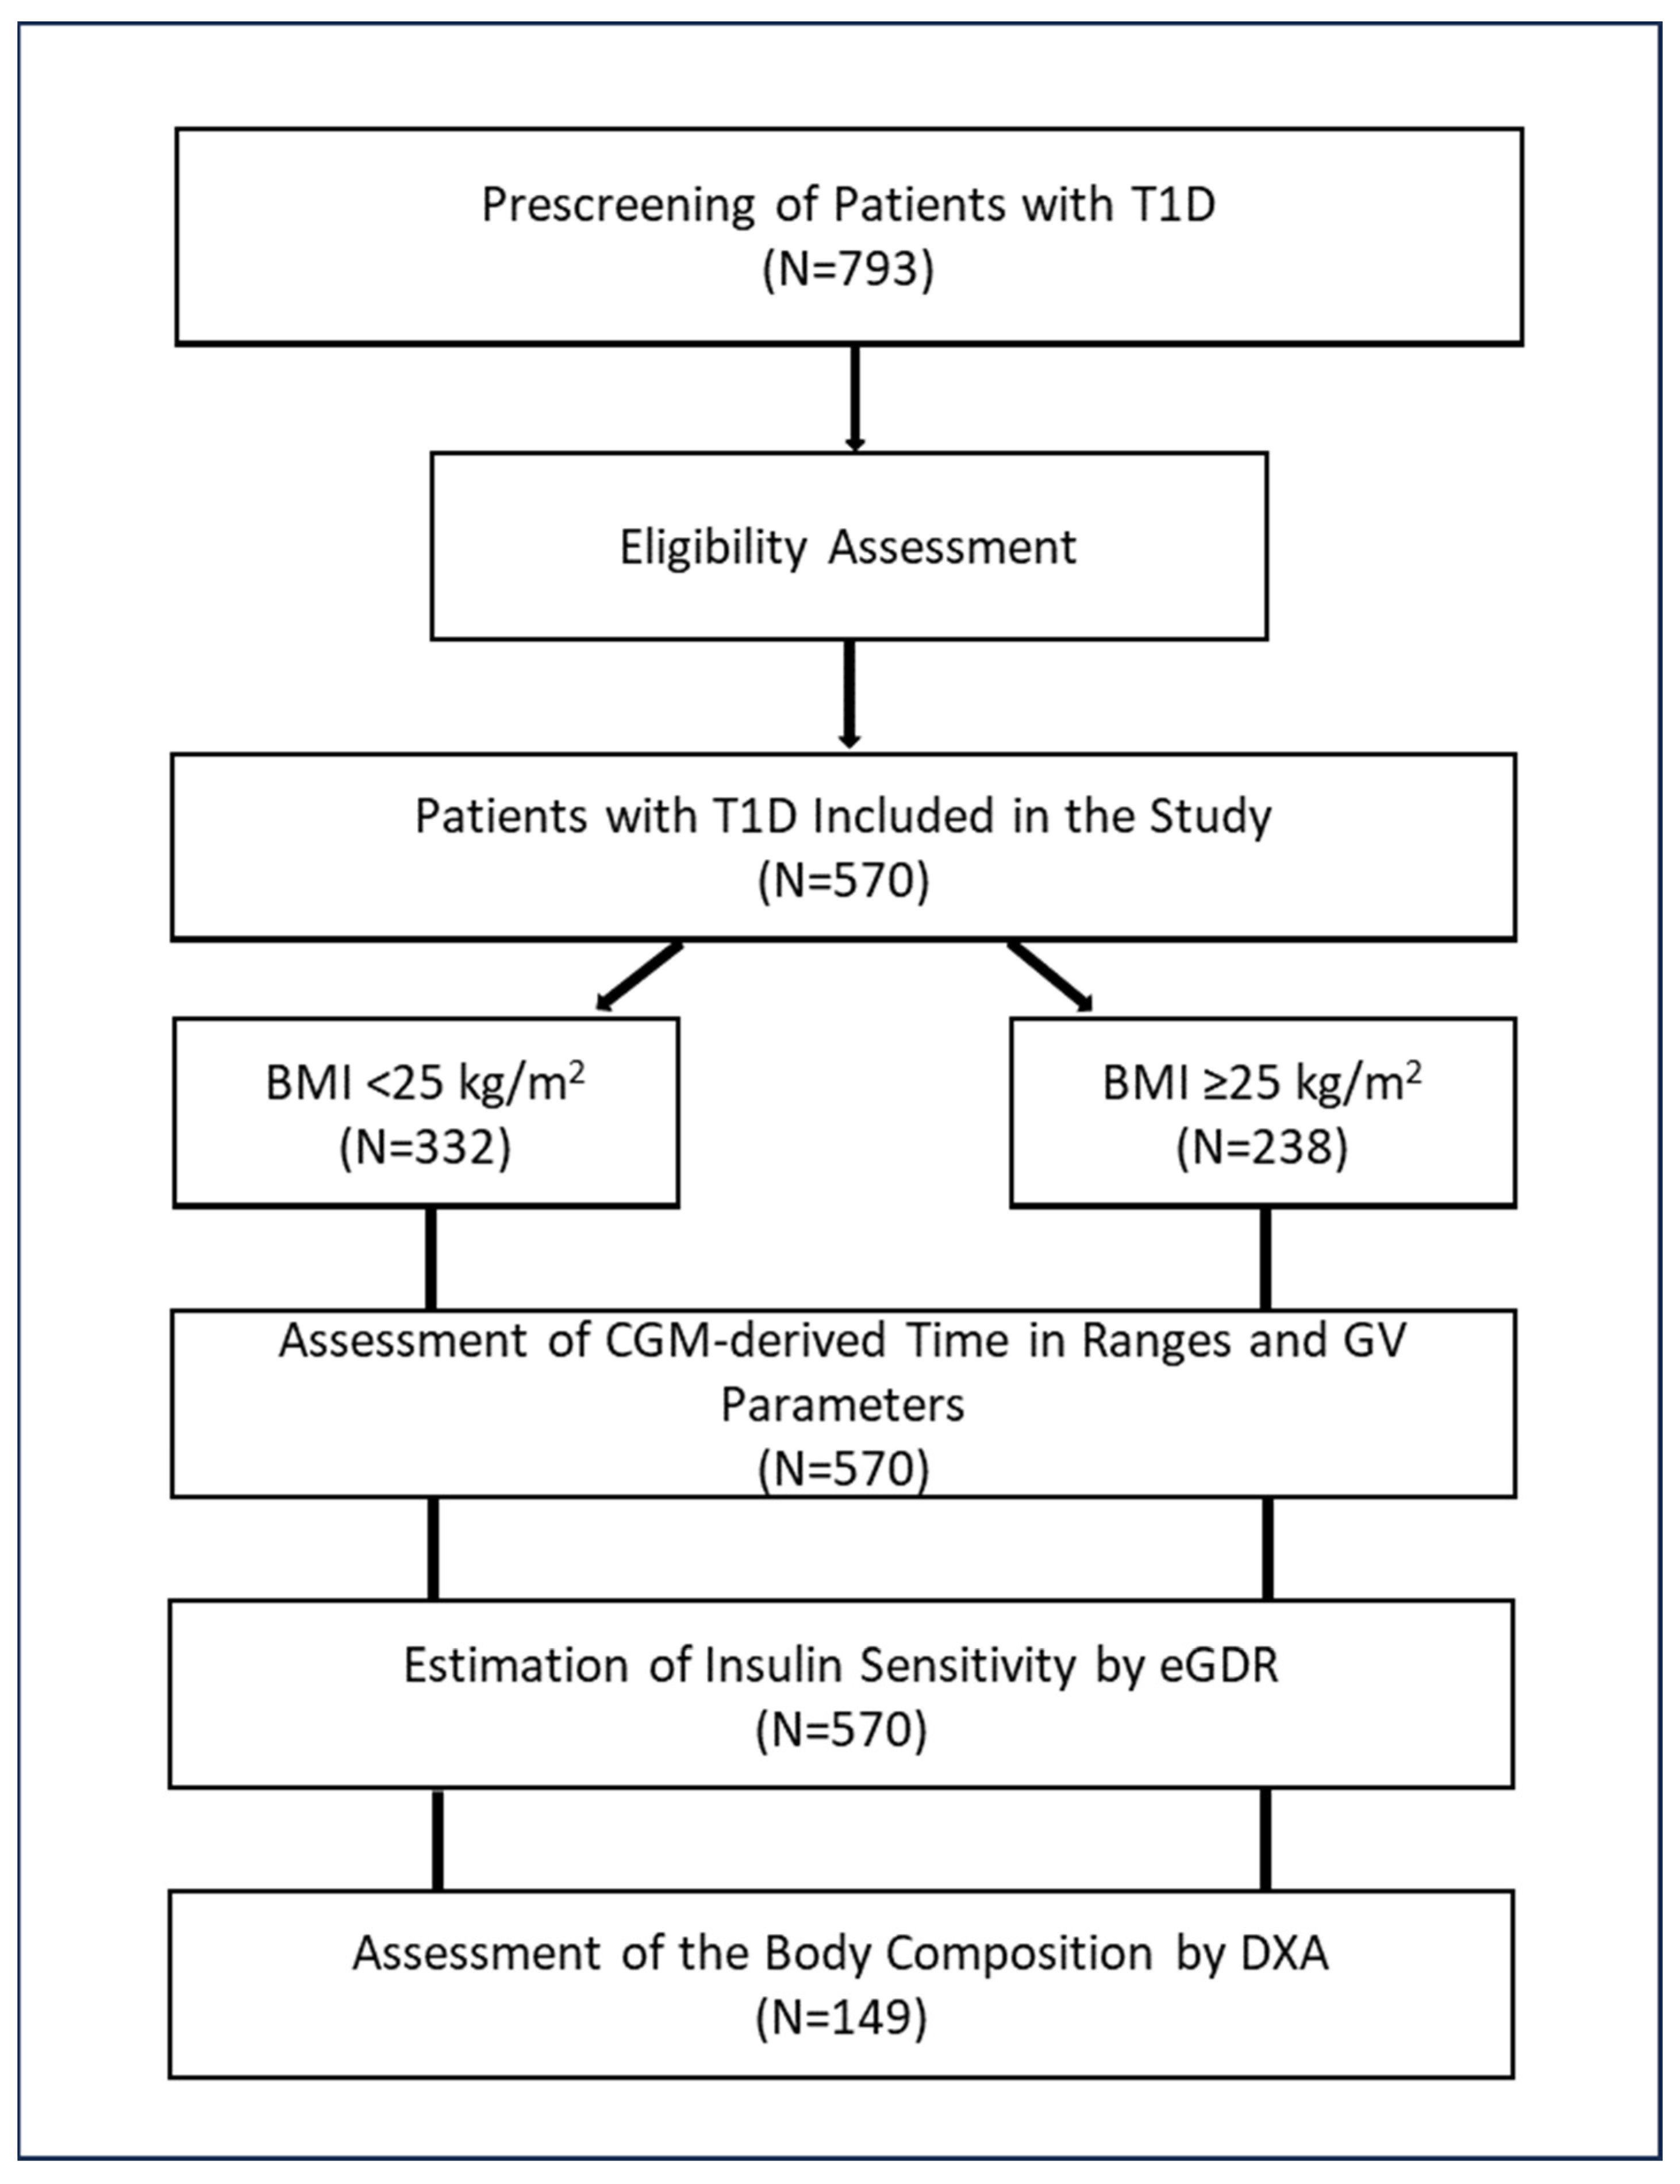
The search for potentially eligible patients was performed using an institutional database. After matching the inclusion and exclusion criteria, 570 individuals with T1D were included in the study. Patients with a BMI < 25 kg/m2 and those with a BMI ≥ 25 kg/m2 were considered as two separate groups.
Real-time CGM data for the last week were used for the calculation of mean glucose, time in the glucose ranges, and GV parameters. Insulin sensitivity was estimated indirectly by the estimated glucose disposal rate (eGDR). About a quarter of the study participants (n = 149) underwent dual-energy X-ray absorptiometry (DXA) to assess body composition parameters.
The study design is shown in Figure 1.
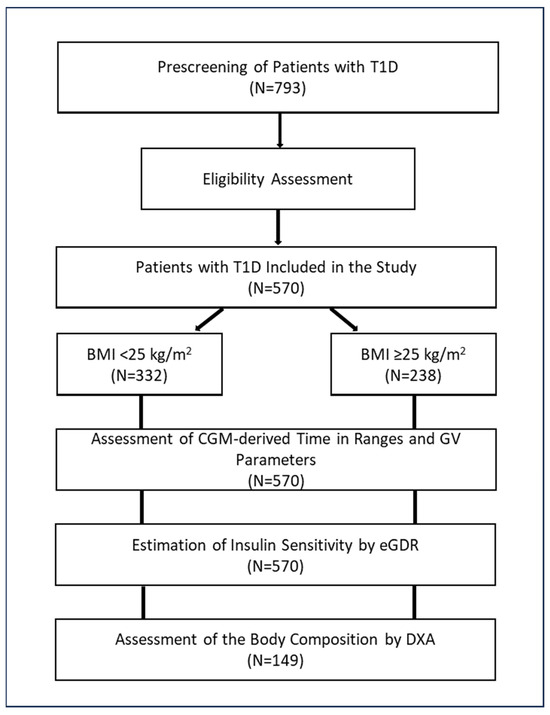
Figure 1.
Study design. Abbreviations: BMI, body mass index; CGM, continuous glucose monitoring; DXA, dual-energy X-ray absorptiometry; eGDR, estimated glucose disposal rate; GV, glucose variability; T1D, type 1 diabetes.
2.2. Methods
All patients underwent a detailed clinical examination with an assessment of metabolic status and screening/monitoring of complications.
Real-time CGM was performed with MMT-722 or MMT-754 monitoring systems, Enlite sensors, and CareLink® Pro software (2.5.524.0, v. 2.5A, Medtronic, Minneapolis, MN, USA). Patients were instructed to calibrate the systems at least 4 times a day. Median CGM duration was 6.7 days.
Time In the target Range (TIR: 3.9–10.0 mmol/L [70–180 mg/dL]); Time Above Range, Level 1 (TAR L-1: 10.0–13.9 mmol/L [180–250 mg/dL]); Time Above Range, Level 2 (TAR L-2: >13.9 mmol/L [>250 mg/dL]); Time Below Range, Level 1 (TBR L-1: 3.8–3.0 mmol/L, [< 70–54 mg/dL]); and Time Below Range, Level 2 (TBR L-2: <3.0 mmol/L [<54 mg/dL]) were estimated according to the international guidelines [17,18].
The following GV indices were calculated: Coefficient of Variation (CV), Mean Amplitude of Glycemic Excursions (MAGE), Mean Absolute Glucose rate of change (MAG), and Lability Index (LI). Characteristics of these indices can be found in recent reviews [19,20]. In brief, CV is a measure of the dispersion of glucose values, MAGE is the mean differences from peaks to nadirs, and MAG and LI estimate the rate of change in glucose concentration. The GV parameters were estimated with the use of an EasyGV v. 9.0.R2 calculator [21].
Mean numbers of glucose episodes of <3.9 mmol/L (<70 mg/dL) and <3.0 mmol/L (<54 mg/dL) per 24 CGM hours were analyzed also.
eGDR was calculated with the use of the following formula: eGDR = 21.158 − (0.09 × WC) − (3.407 × hypertension) − (0.551 × HbA1c), where WC is the waist circumference (cm), hypertension (yes = 1/no = 0), and HbA1c = HbA1c (%) [22].
Body composition parameters were assessed by DXA with the use a Lunar Prodigy Advance densitometer and Body Composition software (GE healthcare, Madison, WI, USA). Specifically, we estimated total, trunk, android, gynoid fat masses, and lean mass, as described previously [23].
2.3. Statistical Analysis
Statistical analysis was performed using the STATISTICA 12 software package (Dell, Round Rock, TX, USA). We used the Kolmogorov–Smirnov criterion to test normality. The differences between the groups in quantitative parameters were assessed using the Mann–Whitney test. Spearman’s rank correlation analysis and multiple stepwise regression analysis with a forward selection of variables were applied to test the associations between parameters. Medians, 25th and 75th percentiles, or minimum and maximum values are reported.
3. Results
3.1. Clinical Characteristics of Patients
The study included 570 patients, 211 men and 359 women, ranging from 18 to 73 years of age (median: 36 years). Diabetes duration varied from one to 55 years (median: 16 years). All patients received basal–bolus therapy with insulin analogs. Four-hundred subjects were managed with multiple daily injections (MDIs) and 170 individuals received a continuous subcutaneous insulin infusion (CSII) with the use of insulin pumps (mostly, MMT-722 or MMT-754, Medtronic, Minneapolis, MN, USA). Diabetic complications and/or associated diseases were verified in most patients: chronic kidney disease (n = 349), neuropathy (n = 349), diabetic retinopathy (n = 317), arterial hypertension (n = 216), impaired awareness of hypoglycemia (n = 200), non-alcoholic fatty liver disease (n = 187), peripheral artery disease (n = 84), diabetic foot (n = 44), and coronary artery disease (n = 29).
Three-hundred-and-thirty-two individuals had a BMI < 25 kg/m2 and two-hundred-and-thirty-eight patients had a BMI ≥ 25 kg/m2. In the second group, 156 subjects were overweight (BMI: 25–29.9 kg/m2) and 82 subjects were obese (BMI ≥ 30 kg/m2).
The clinical characteristics of the study groups are presented in Table 1. Patients with a BMI ≥ 25 kg/m2, when compared to those with a BMI < 25 kg/m2, were older, had a slightly longer diabetes duration, and were treated with higher insulin doses. Patients with a BMI ≥ 25 kg/m2 demonstrated higher levels of total and LDL-cholesterol, triglycerides, uric acid, high-sensitivity C-reactive protein (hsCRP), and a lower estimated glomerular filtration rate (eGFR). No significant differences in glycated hemoglobin A1c (HbA1c) and albuminuria levels were found between the groups. The values of eGDR were markedly lower in overweight/obese patients.

Table 1.
Clinical characteristics of study participants.
3.2. CGM Parameters in T1D Patients Depending on BMI and WC
Mean CGM glucose and TIR did not differ significantly between patients with a BMI ≥ 25 kg/m2 and those with a BMI < 25 kg/m2 (Table 2). Overweight/obese patients tended to have a higher TAR L-1 and lower TBR L-1; meanwhile, TBR-L2 was significantly lower in this group. There were no significant differences between the groups in CV and MAGE values. At the same time, lower MAG and LI values were revealed in overweight/obese individuals.
Table 2.
CGM parameters in patients with T1D depending on BMI.
Patients with a BMI ≥ 25 kg/m2 experienced fewer episodes of low glucose levels per day than those with a BMI < 25 kg/m2: 0.33 (0.0; 0.86) and 0.21 (0.0; 0.56) episodes of glucose at <3.9 mmol/L, p = 0.007, and 0.0 (0.0; 0.13) and 0.0 (0.0; 0.0) episodes of glucose at <3.0 mmol/L, respectively, p = 0.018.
In the Spearman’s rank correlation analysis, TBR L-2, MAG, and LI demonstrated weak negative correlations with BMI (Table 3). When men and women were considered separately, BMI correlated negatively with MAGE, MAG, and LI in men. In women, BMI demonstrated weak negative correlations with TBR L-2 and MAG, and a positive correlation with TAR L-1.
Table 3.
Correlations of CGM parameters with BMI and WC in patients with T1D.
Similarly to BMI, WC showed weak negative correlations with TBR L-2, MAG, and LI (Table 4). In men, WC correlated negatively with TAR L-1, CV, MAGE, MAG, and LI, and was associated positively with TIR. In women, WC showed weak negative correlations with TBR L-1, TBR L-2, and MAG, and demonstrated positive weak correlations with TAR L-1 and TAR L-2.
3.3. CGM Parameters in T1D Patients Depending on Body Composition
The assessment of body composition was performed on 149 subjects, 70 men and 79 women. Subjects with a BMI ≥ 25 kg/m2 demonstrated higher total, trunk, android, and gynoid fat mass, as well as lean mass, when compared to those with a BMI < 25 kg/m2 (Table 4).
Table 4.
Parameters of body composition in patients with T1D depending on the BMI.
Table 4.
Parameters of body composition in patients with T1D depending on the BMI.
| Parameter | Groups of Patients | p | |
|---|---|---|---|
| BMI < 25 kg/m2 N = 85 | BMI ≥ 25 kg/m2 N = 64 | ||
| Total fat mass, kg | 18.7 (14.3; 23.1) | 30.6 (25.1; 34.4) | <0.0001 |
| Total fat mass, % | 30.6 (24.6; 36.9) | 36.7 (31.6; 40.6) | <0.0001 |
| Trunk fat mass, kg | 8.2 (6.2; 11.5) | 16.5 (13.4; 19.5) | <0.0001 |
| Android fat mass, kg | 1.2 (0.8; 1.7) | 2.7 (2.2; 3.5) | <0.0001 |
| Gynoid fat mass, kg | 3.5 (2,7; 4.4) | 4.6 (3.9; 5.7) | <0.0001 |
| Lean mass, kg | 43.1 (38.9; 51.7) | 59.5 (46.7; 63.6) | <0.0001 |
Data are presented as medians [25% percentile; 75% percentile]. Abbreviations: BMI, body mass index; T1D, type 1 diabetes.
The values of TIR, TAR, and TBR did not correlate with the body composition parameters (Table 5). At the same time, MAG and LI demonstrated weak negative correlations with total, trunk, and android fat mass. MAGE correlated negatively with trunk fat mass only. No correlations were found between CGM-derived parameters and lean mass. In men, TIR correlated positively with total and trunk fat mass; TAR L-2 demonstrated negative correlations with total, trunk, android, and gynoid fat mass. In women, a positive correlation between CV and gynoid fat mass was found.
Table 5.
Correlations between CGM metrics and body composition parameters in patients with T1D.
3.4. Relationships between CGM Parameters and eGDR
The values of eGDR correlated negatively with BMI (r = −0.62, p < 0.0001), WC (r = −0.73, p < 0.0001), total fat mass (r = −0.52, p < 0.0001), trunk fat mass and android fat mass (both r = −0.58, p < 0.0001), gynoid fat mass (r = −0.27, p = 0.0009), and lean mass (r = −0.41, p < 0.0001).
The correlations between eGDR and CGM parameters are presented in Table 6. In men, eGDR demonstrated positive correlations with TBR L-1, TBR L-2, MAG, and LI; weak negative correlations with TAR L-1 and TAR L-2 were found. In women, eGDR was related to TIR and MAG positively, and with TAR L-1, TAR L-2, TBR L-1, and TBR L-2 negatively. In addition, we found positive correlations between eGDR and a daily number of episodes of glucose <3.9 and <3 mmol/L (r = 0.22 and r = 0.28, respectively, both p < 0.001).
Table 6.
Correlations of CGM parameters with eGDR in patients with T1D.
3.5. Multivariate Models
We assessed the associations of CGM metrics with clinical, anthropometric, body composition parameters, and eGDR in two sets of multivariate models.
In the first set, age, BMI, WC, diabetes duration, daily insulin dose, eGFR, and eGDR were included as independent variables. The results are presented in Table 7.
Table 7.
Clinical and anthropometric predictors of CGM parameters in subjects with T1D in multivariate stepwise regression analysis (model set 1).
In men, WC turned out to be a predictor of TIR, TAR L-1, TAR L-2, MAGE, and LI. The values of eGDR were associated with TIR, TAR L-1, TAR L-2, TBR L-2, and MAGE. In these models, daily insulin dose predicted MAG. No reliable models were built for TBR L-1 and CV.
In women, BMI was associated with TIR, TAR L-2, CV, MAGE, and LI. An association between WC and MAG was found. eGDR predicted TIR, TAR L-1, TAR L-2, TBR L-1, MAGE, and LI. Age predicted TIR and TAR L-2, and eGFR was associated with TBR L-1, CV, MAGE, LI, and LBGI. No significant model for TBR L-2 was generated.
In the second set of multivariate models, BMI and WC were replaced by body composition parameters, namely total, trunk, android, gynoid fat mass, and lean mass. The results are summarized in Table 8.
Table 8.
Clinical and body composition parameters as predictors of CGM metrics in subjects with T1D in multivariate stepwise regression analysis (model set 2).
In men, total fat mass was a negative predictor of TIR and LI, and a positive predictor of TAR L-2. Android fat mass was associated negatively with CV and MAGE. Trunk fat mass was a negative predictor of MAGE. eGDR demonstrated a positive association with MAG. Daily insulin dose was associated with TIR negatively, demonstrating positive relationships with TAR L-1 and TAR L-2. No reliable models were built for TBR L-1 and TBR L-2.
In women, gynoid fat mass was the negative predictor of TIR and positive predictor of TAR L-1 and TAR L-2. eGDF was associated negatively with TAR L-2 and demonstrated a positive association with TBR L-2. Daily insulin dose was associated positively with TBR L-1 and CV. We failed to generate models for MAGE and MAG. eGFR turned out to be the only predictor of LI.
4. Discussion
In this study, we assessed the associations of body weight, body composition, and insulin sensitivity to CGM-derived time in ranges and GV parameters in patients with T1D. To our knowledge, this is the first study demonstrating the relationships of adiposity and reduced insulin sensitivity with characteristics of glucose dynamics in these patients. For the in-depth analysis of CGM data, we calculated time in ranges (TIRs: TAR L-1, TAR L-2, TBR L-1, and TBR L-2), as well as GV indices, which characterize the dispersion of glucose values (CVs), the amplitude of glucose fluctuations (MAGEs), and the rate of change in glucose concentrations (MAGs, LI), as well as the number of low glucose episodes.
4.1. Main Findings
The principal finding of the study is an association of adiposity with a reduction in TIR, amplitude-dependent GV, and a risk of hypoglycemia. Specifically, we found that overweight/obese people with T1D when compared to those with BMI < 25 kg/m2 have lower TBR L-2 (<3 mmol/L), MAG, and LI values, and experience fewer episodes of low glucose despite the higher daily insulin dose. Both BMI and WC showed weak negative correlations with TBR L-2, MAG, and LI.
Previously, an inverse correlation between BMI and CV in T1D patients was reported [24]. In youths with T1D, an association between BMI and hyperglycemic excursions, but not with CV and MAGE, was observed [25]. In disagreement with these data, a positive association was reported between hypoglycemia, CV, and BMI percentile in children and youths with T1D [26]. The discrepancy of the data may be explained by the different populations surveyed, as well as by the fact that BMI may not reflect the characteristics of body composition in obese individuals with different physical activities and sensitivity to insulin [27].
In this study, we tested the hypothesis that differences in body composition and insulin sensitivity may explain the patterns of glucose dynamics in T1D patients with overweight/obesity and normal body weight. Taking into account sex differences in weight and fat distribution, we analyzed men and women separately. When studying the relationships between CGM parameters and body composition, we identified correlations between total, trunk, android and gynoid fat mass with high glucose (TAR L-2), and amplitude-dependent GV parameters (CV, MAGE, MAG, and LI) in men. In the multivariate regression analysis, total fat mass was associated with high glucose (TAR L-2), while android fat mass turned out to be a predictor of CV and MAGE. In women, gynoid fat mass, but not other body composition parameters, correlated with TAR L-1 and CV, and predicted TIR and TAR in the multivariate model. Recently, Lipsky LM et al. reported an association between adiposity and TAR in youths with T1D. However, no relationships were found between body composition and GV estimated by MAGE and standard deviation [25].
A number of studies have shown that android fat or its ratio to gynoid fat is associated with decreased insulin sensitivity and related metabolic abnormalities. In subjects with normal glucose tolerance, android fat mass was positively associated with insulin resistance (HOMA-IR index) and demonstrated negative correlations with TBR and Low Blood Glucose Index [12]. Similarly, in obese children and adolescents, the android/gynoid ratio was related to HOMA-IR [28]. In young overweight males, preferential fat accumulation in the android area was associated with insulin resistance, impairment in lipid profile, and endothelial dysfunction [29]. A population-based study performed in Hangzhou, China, showed that android/gynoid ratio is positively associated with non-alcoholic fatty liver disease [30]. The latter, in turn, is closely related to insulin resistance [31].
In our study, we used eGDR as a validated score based on WC, hypertension, and HbA1c, which was introduced to measure insulin sensitivity in T1D [32,33]. A reduction in eGDR was found in overweight/obese patients indicating a decrease in insulin sensitivity. The eGDR values correlated negatively with BMI, WC, total, trunk, and android fat mass, and, to a lesser extent, gynoid fat mass. In agreement, Q. Zeng et al. reported negative associations of eGDR with visceral fat index and trunk fat mass in Chinese subjects with T1D [34]. In the multivariate models, we recognized eGDR to be a positive predictor of TIR and a negative predictor of TAR, TBR, and MAGE in men and women, and LI in women. Therefore, we can assume that the observed associations of body weight and fat mass accumulation with hyperglycemia and reduced GV are mediated through a decrease in insulin sensitivity.
Currently, the relationships between insulin sensitivity, CGM profiles, and, especially, GV are not well understood. Recently, I. Clinck et al. reported higher CGM-assessed TAR in patients with T1D with the lowest eGDR. In the regression analysis, a higher eGDR was associated with a higher TIR and TBR and a lower TAR. Our data confirm these results. Having studied a larger number of GV parameters, we also found a negative association between eGDR and GV. However, in the cited work, insulin sensitivity was assessed not only using the eGDR, but also by a hyperinsulinemic–euglycemic clamp. Interestingly, no significant relationships between CGM parameters and measured glucose disposal rate were found [35]. It was assumed that the enhancing effect of insulin on glucose fluctuations can be mitigated by insulin resistance [36]. In agreement, a reciprocal relationship between HOMA-IR and GV was revealed in subjects with prediabetes [37].
The results of our study show that total, trunk, and android fat mass values are related to CGM parameters in men, but not in women. This finding may be explained by sex differences in the association between abdominal fat accumulation and insulin sensitivity [38]. In Chinese adults, android fat percentage was more closely associated with metabolic syndrome components in men. In women, android fat percentage and gynoid fat percentage showed opposite effects on the levels of triglycerides, HDL-cholesterol, and WC [39]. In subjects with newly diagnosed T2D and individuals with prediabetes, android fat positively correlated with HOMA-IR in men, but not in women [40]. In transgender individuals receiving gender-affirming hormone therapy, android fat more strongly correlated with insulin resistance compared to gynoid fat [41].
Pathogenetic links between adiposity, insulin resistance, and T1D could be multidirectional. Patients with T1D have specific risk factors that contribute to weight gain. These include intensive insulin therapy, subcutaneous insulin administration leading to peripheral hyperinsulinemia, repetitive episodes of hypoglycemia, and the consequences of a fear of hypoglycemia in the form of frequent snacking and decreased physical activity. Diabetes-specific psychosocial burden (stress, depression, decreased quality of life, lack of support, etc.) can exacerbate obesity. Obesity triggers lipotoxicity, mitochondrial dysfunction, adipose tissue dysfunction, gut microbiome imbalance, low-grade inflammation, and, ultimately, reduces insulin sensitivity. In its turn, obesity-driven insulin resistance increases the requirement for exogenous insulin, forming a vicious circle. At the same time, the accelerator hypothesis postulates that obesity and insulin resistance can lead to glucotoxicity and accelerated apoptosis of pancreatic β-cells via immune and inflammatory mechanisms. Finally, some people with T1D may be genetically predisposed to obesity and insulin resistance, especially when they have a family history of T2D [4,42].
4.2. Clinical Implications
An increasing prevalence of overweight and obesity in people with T1D is a serious challenge. Although patients with insulin resistance may have a reduced risk of hypoglycemia, other factors associated with decreased sensitivity to insulin may have a detrimental effect on vascular health and disease outcomes. A 10.9-year follow-up of 26,125 T1D patients registered in the Swedish National Diabetes Registry showed an increase in the risk of major cardiovascular disease, heart failure, cardiovascular death, and mortality with increasing BMI. These associations were more apparent in men than in women [43]. In subjects with T1D, insulin resistance verified by the eGDR was associated with vascular complications independently from HbA1c [44,45]. The results of recent meta-analysis demonstrate that insulin resistance, as estimated by the eGDR, may be an additional risk factor for cardiovascular disease and all-cause mortality in T1D [46]. Data from our and other studies [9,47] indicate that overweight and obese T1D patients require higher insulin doses for glycemic control than their lean counterparts, which may pose an additional risk of complications and impede weight loss. Therefore, the prevention of overweight and obesity should become a part of the management strategy for T1D patients as well.
The features of metabolic changes in obese patients with T1D should be taken into account in clinical practice. Our results indicate that individuals with T1D who are overweight or obese are less likely to achieve glycemic control targets, especially in managing hyperglycemia, than patients with normal weight. Therefore, adiposity-driven insulin resistance should be considered as a barrier to the control of T1D. Currently, there are several options to manage or even eliminate this barrier. Lifestyle modification programs, including nutrition therapy, correction of dietary habits, and increased levels of physical activity, should be an essential part of comprehensive care for people with T1D and obesity [48]. Glucagon-like peptide-1 receptor agonists, dual glucagon-like peptide-1 and gastric inhibitory polypeptide agonists, sodium-glucose cotransporter-2 inhibitors, metformin, pramlintide, and some other drugs are discussed as promising therapeutic agents for the management of obesity and/or insulin resistance in patients with T1D [49,50]. Bariatric surgery may be a viable treatment for patients with T1D and severe obesity [51]. However, it should be noted that drug therapy and surgical treatment are not yet standard approaches to weight management in T1D.
4.3. Limitations of the Study and Future Remarks
Limitations of our study include cross-sectional design, patient recruitment in one clinical center, and short CGM duration. We did not differentiate between visceral and subcutaneous adipose tissue when assessing body composition. Insulin sensitivity was estimated indirectly by eGDR, but not by a clamp technique. We did not take into account the level of physical activity, dietary habits, stress, and other lifestyle and psychosocial factors of the study participants. It is likely that these factors could modify some of the associations between GV, body composition, and insulin sensitivity we observed. The lack of a control group does not allow us to compare associations between body composition and glucose dynamics in people with T1D with those in healthy individuals. The representativeness of the sample is limited to young and middle-aged adults with T1D without advanced complications and serious concomitant diseases. In addition, the study focuses on a Caucasian population, which may limit the generalizability of the findings to other ethnic groups.
The strengths of this study are the large sample size, comprehensive analysis of CGM data with a broad range of time-dependent and amplitude-dependent GV parameters, and the use of DXA to examine body composition. In an effort to provide insights into the whole story, we assessed glucose dynamics, anthropometric parameters, body composition, and insulin sensitivity in a sample of patients with T1D.
Future studies are needed for the identification of mechanisms underlying the associations of fat mass and fat distribution with glucose homeostasis in T1D patients. Prospective studies could answer the question of how changes in body weight and body composition affect insulin sensitivity and glucose dynamics in people living with T1D. In particular, the effect of weight loss and adiposity reduction on TIR and GV parameters in obese subjects with T1D is a great challenge.
5. Conclusions
The results of this study demonstrate that overweight and obese people with T1D have a lower risk of CGM-confirmed hypoglycemia and reduced GV than those with a BMI <25 kg/m2. In men, central adiposity assessed by the total, trunk, and android fat mass is associated with higher glucose and lower GV. In women, gynoid fat mass, but no other body composition parameters, is related to hyperglycemia. The observed associations of body weight and body composition with the features of daily glucose dynamics may be mediated by insulin sensitivity.
Author Contributions
Conceptualization, V.V.K.; methodology, V.V.K.; investigation, J.F.S., A.Y.Y. and V.V.K.; data curation, A.Y.Y. and J.F.S.; formal analysis—A.I.K.; writing—original draft preparation, J.F.S. and A.Y.Y.; writing—review and editing, V.V.K.; supervision, project administration, and funding acquisition, V.V.K. All authors have read and agreed to the published version of the manuscript.
Funding
This research was funded by the Russian Science Foundation, grant number 20-15-00057-Π.
Institutional Review Board Statement
This study was conducted in accordance with the Declaration of Helsinki and approved by the Ethics Committee of RICEL—a branch of IC&G SB RAS (protocol N. 158, date of approval 1 June 2020).
Informed Consent Statement
Written informed consent was obtained from each subject involved in the study.
Data Availability Statement
The source data are available from the corresponding authors upon reasonable request.
Conflicts of Interest
The authors declare no conflicts of interest. The funder had no role in the design of the study; in the collection, analysis, or interpretation of data; in the writing of the manuscript, or in the decision to publish the results.
References
- Ogle, G.D.; Wang, F.; Gregory, G.A.; Maniam, J. Type 1 Diabetes Numbers in Children and Adults. IDF Atlas Report (2022). Available online: https://diabetesatlas.org/atlas/t1d-index-2022/ (accessed on 23 April 2024).
- Gregory, G.A.; Robinson, T.I.G.; Linklater, S.E.; Wang, F.; Colagiuri, S.; De Beaufort, C.; Donaghue, K.C.; Magliano, D.J.; Maniam, J.; Orchard, T.J.; et al. Global Incidence, Prevalence, and Mortality of Type 1 Diabetes in 2021 with Projection to 2040: A Modelling Study. Lancet Diabetes Endocrinol. 2022, 10, 741–760. [Google Scholar] [CrossRef]
- Van Der Schueren, B.; Ellis, D.; Faradji, R.N.; Al-Ozairi, E.; Rosen, J.; Mathieu, C. Obesity in People Living with Type 1 Diabetes. Lancet Diabetes Endocrinol. 2021, 9, 776–785. [Google Scholar] [CrossRef] [PubMed]
- Kueh, M.T.W.; Chew, N.W.S.; Al-Ozairi, E.; Le Roux, C.W. The Emergence of Obesity in Type 1 Diabetes. Int. J. Obes. 2024, 48, 289–301. [Google Scholar] [CrossRef] [PubMed]
- Chan, C.L.; Pyle, L.; Morehead, R.; Baumgartner, A.; Cree-Green, M.; Nadeau, K.J. The Role of Glycemia in Insulin Resistance in Youth with Type 1 and Type 2 Diabetes: Chan et Al. Pediatr. Diabetes 2017, 18, 470–477. [Google Scholar] [CrossRef] [PubMed]
- Yayıcı Köken, Ö.; Kara, C.; Can Yılmaz, G.; Aydın, H.M. Prevalence of Obesity and Metabolic Syndrome in Children with Type 1 Diabetes: A Comparative Assessment Based on Criteria Established by the International Diabetes Federation, World Health Organisation and National Cholesterol Education Program. J. Clin. Res. Pediatr. Endocrinol. 2020, 12, 55–62. [Google Scholar] [CrossRef]
- Mørk, F.B.; Madsen, J.O.B.; Pilgaard, K.A.; Jensen, A.K.; Klakk, H.; Tarp, J.; Bugge, A.; Heidemann, M.; Van Hall, G.; Pociot, F.; et al. The Metabolic Syndrome Is Frequent in Children and Adolescents with Type 1 Diabetes Compared to Healthy Controls. Pediatr. Diabetes 2022, 23, 1064–1072. [Google Scholar] [CrossRef] [PubMed]
- Belete, R.; Ataro, Z.; Abdu, A.; Sheleme, M. Global Prevalence of Metabolic Syndrome among Patients with Type I Diabetes Mellitus: A Systematic Review and Meta-Analysis. Diabetol. Metab. Syndr. 2021, 13, 25. [Google Scholar] [CrossRef]
- Braffett, B.H.; Dagogo-Jack, S.; Bebu, I.; Sivitz, W.I.; Larkin, M.; Kolterman, O.; Lachin, J.M. Association of Insulin Dose, Cardiometabolic Risk Factors, and Cardiovascular Disease in Type 1 Diabetes During 30 Years of Follow-up in the DCCT/EDIC Study. Diabetes Care 2019, 42, 657–664. [Google Scholar] [CrossRef]
- Kilpatrick, E.S.; Rigby, A.S.; Atkin, S.L. Insulin Resistance, the Metabolic Syndrome, and Complication Risk in Type 1 Diabetes. Diabetes Care 2007, 30, 707–712. [Google Scholar] [CrossRef]
- Petria, I.; Albuquerque, S.; Varoquaux, G.; Vie, J.-J.; Venteclef, N.; Mohammedi, K.; Roussel, R.; Camoin, M.; Perseghin, G.; Velho, G.; et al. Body-Weight Variability and Risk of Cardiovascular Outcomes in Patients with Type 1 Diabetes: A Retrospective Observational Analysis of Data from the DCCT/EDIC Population. Cardiovasc. Diabetol. 2022, 21, 247. [Google Scholar] [CrossRef]
- Klimontov, V.V.; Semenova, J.F. Glucose Variability in Subjects with Normal Glucose Tolerance: Relations with Body Composition, Insulin Secretion and Sensitivity. Diabetes Metab. Syndr. 2022, 16, 102387. [Google Scholar] [CrossRef] [PubMed]
- Hjort, A.; Iggman, D.; Rosqvist, F. Glycemic Variability Assessed Using Continuous Glucose Monitoring in Individuals without Diabetes and Associations with Cardiometabolic Risk Markers: A Systematic Review and Meta-Analysis. Clin. Nutr. 2024, 43, 915–925. [Google Scholar] [CrossRef] [PubMed]
- Guo, K.; Zhang, L.; Ye, J.; Niu, X.; Jiang, H.; Gan, S.; Zhou, J.; Yang, L.; Zhou, Z. Metabolic Syndrome Associated with Higher Glycemic Variability in Type 1 Diabetes: A Multicenter Cross-Sectional Study in China. Front. Endocrinol. 2022, 13, 972785. [Google Scholar] [CrossRef] [PubMed]
- Kietsiriroje, N.; Pearson, S.M.; O’Mahoney, L.L.; West, D.J.; Ariëns, R.A.; Ajjan, R.A.; Campbell, M.D. Glucose Variability Is Associated with an Adverse Vascular Profile but Only in the Presence of Insulin Resistance in Individuals with Type 1 Diabetes: An Observational Study. Diabetes Vasc. Dis. Res. 2022, 19, 147916412211032. [Google Scholar] [CrossRef]
- Klimontov, V.V.; Mavlianova, K.R.; Orlov, N.B.; Semenova, J.F.; Korbut, A.I. Serum Cytokines and Growth Factors in Subjects with Type 1 Diabetes: Associations with Time in Ranges and Glucose Variability. Biomedicines 2023, 11, 2843. [Google Scholar] [CrossRef]
- Danne, T.; Nimri, R.; Battelino, T.; Bergenstal, R.M.; Close, K.L.; DeVries, J.H.; Garg, S.; Heinemann, L.; Hirsch, I.; Amiel, S.A.; et al. International Consensus on Use of Continuous Glucose Monitoring. Diabetes Care 2017, 40, 1631–1640. [Google Scholar] [CrossRef]
- Battelino, T.; Danne, T.; Bergenstal, R.M.; Amiel, S.A.; Beck, R.; Biester, T.; Bosi, E.; Buckingham, B.A.; Cefalu, W.T.; Close, K.L.; et al. Clinical Targets for Continuous Glucose Monitoring Data Interpretation: Recommendations from the International Consensus on Time in Range. Diabetes Care 2019, 42, 1593–1603. [Google Scholar] [CrossRef]
- Kovatchev, B. Glycemic Variability: Risk Factors, Assessment, and Control. J. Diabetes Sci. Technol. 2019, 13, 627–635. [Google Scholar] [CrossRef]
- Sun, B.; Luo, Z.; Zhou, J. Comprehensive Elaboration of Glycemic Variability in Diabetic Macrovascular and Microvascular Complications. Cardiovasc. Diabetol. 2021, 20, 9. [Google Scholar] [CrossRef]
- Hill, N.R.; Oliver, N.S.; Choudhary, P.; Levy, J.C.; Hindmarsh, P.; Matthews, D.R. Normal Reference Range for Mean Tissue Glucose and Glycemic Variability Derived from Continuous Glucose Monitoring for Subjects without Diabetes in Different Ethnic Groups. Diabetes Technol. Ther. 2011, 13, 921–928. [Google Scholar] [CrossRef]
- Lu, Z.; Xiong, Y.; Feng, X.; Yang, K.; Gu, H.; Zhao, X.; Meng, X.; Wang, Y. Insulin Resistance Estimated by Estimated Glucose Disposal Rate Predicts Outcomes in Acute Ischemic Stroke Patients. Cardiovasc. Diabetol. 2023, 22, 225. [Google Scholar] [CrossRef]
- Klimontov, V.V.; Bulumbaeva, D.M.; Fazullina, O.N.; Lykov, A.P.; Bgatova, N.P.; Orlov, N.B.; Konenkov, V.I.; Pfeiffer, A.F.H.; Pivovarova-Ramich, O.; Rudovich, N. Circulating Wnt1-Inducible Signaling Pathway Protein-1 (WISP-1/CCN4) Is a Novel Biomarker of Adiposity in Subjects with Type 2 Diabetes. J. Cell Commun. Signal. 2020, 14, 101–109. [Google Scholar] [CrossRef] [PubMed]
- Jin, S.-M.; Kim, T.-H.; Bae, J.C.; Hur, K.Y.; Lee, M.-S.; Lee, M.-K.; Kim, J.H. Clinical Factors Associated with Absolute and Relative Measures of Glycemic Variability Determined by Continuous Glucose Monitoring: An Analysis of 480 Subjects. Diabetes Res. Clin. Pract. 2014, 104, 266–272. [Google Scholar] [CrossRef] [PubMed]
- Lipsky, L.M.; Gee, B.; Liu, A.; Nansel, T.R. Glycemic Control and Variability in Association with Body Mass Index and Body Composition over 18months in Youth with Type 1 Diabetes. Diabetes Res. Clin. Pract. 2016, 120, 97–103. [Google Scholar] [CrossRef] [PubMed]
- Piona, C.; Marigliano, M.; Mancioppi, V.; Mozzillo, E.; Occhiati, L.; Zanfardino, A.; Iafusco, D.; Maltoni, G.; Zucchini, S.; Delvecchio, M.; et al. Glycemic Variability and Time in Range Are Associated with the Risk of Overweight and High LDL-Cholesterol in Children and Youths with Type 1 Diabetes. Horm. Res. Paediatr. 2023, 1–7. [Google Scholar] [CrossRef]
- Santi, A.; Bosch, T.A.; Bantle, A.E.; Alvear, A.; Wang, Q.; Hodges, J.S.; Dengel, D.R.; Chow, L.S. High Body Mass Index Masks Body Composition Differences in Physically Active Versus Sedentary Participants. Metab. Syndr. Relat. Disord. 2018, 16, 483–489. [Google Scholar] [CrossRef]
- Aucouturier, J.; Meyer, M.; Thivel, D.; Taillardat, M.; Duché, P. Effect of Android to Gynoid Fat Ratio on Insulin Resistance in Obese Youth. Arch. Pediatr. Adolesc. Med. 2009, 163, 826–831. [Google Scholar] [CrossRef] [PubMed]
- Sari, C.I.; Eikelis, N.; Head, G.A.; Schlaich, M.; Meikle, P.; Lambert, G.; Lambert, E. Android Fat Deposition and Its Association with Cardiovascular Risk Factors in Overweight Young Males. Front. Physiol. 2019, 10, 1162. [Google Scholar] [CrossRef] [PubMed]
- Hsing, J.C.; Nguyen, M.H.; Yang, B.; Min, Y.; Han, S.S.; Pung, E.; Winter, S.J.; Zhao, X.; Gan, D.; Hsing, A.W.; et al. Associations Between Body Fat, Muscle Mass, and Nonalcoholic Fatty Liver Disease: A Population-Based Study. Hepatol. Commun. 2019, 3, 1061–1072. [Google Scholar] [CrossRef]
- Zhong, H. Non-Alcoholic Fatty Liver Disease: Pathogenesis and Models. Am. J. Transl. Res. 2024, 16, 387–399. [Google Scholar] [CrossRef]
- Epstein, E.J.; Osman, J.L.; Cohen, H.W.; Rajpathak, S.N.; Lewis, O.; Crandall, J.P. Use of the Estimated Glucose Disposal Rate as a Measure of Insulin Resistance in an Urban Multiethnic Population with Type 1 Diabetes. Diabetes Care 2013, 36, 2280–2285. [Google Scholar] [CrossRef] [PubMed]
- Nyström, T.; Holzmann, M.J.; Eliasson, B.; Svensson, A.; Sartipy, U. Estimated Glucose Disposal Rate Predicts Mortality in Adults with Type 1 Diabetes. Diabetes Obes. Metab. 2018, 20, 556–563. [Google Scholar] [CrossRef]
- Zeng, Q.; Chen, X.-J.; He, Y.-T.; Ma, Z.-M.; Wu, Y.-X.; Lin, K. Body Composition and Metabolic Syndrome in Patients with Type 1 Diabetes. World J. Diabetes 2024, 15, 81–91. [Google Scholar] [CrossRef]
- Clinck, I.; Mertens, J.; Wouters, K.; Dirinck, E.; De Block, C. Insulin Resistance and CGM-Derived Parameters in People with Type 1 Diabetes: Are They Associated? J. Clin. Endocrinol. Metab. 2024, dgae015. [Google Scholar] [CrossRef] [PubMed]
- Huang, Y.; Heng, C.; Wei, J.; Jing, X.; Wang, X.; Zhao, G.; Hou, J.; Liu, Q.; Jiao, K. Influencing Factors of Glycemic Variability in Hospitalized Type 2 Diabetes Patients with Insulin Therapy: A Strobe-Compliant Article. Medicine 2017, 96, e8021. [Google Scholar] [CrossRef] [PubMed]
- Dimova, R.; Chakarova, N.; Grozeva, G.; Kirilov, G.; Tankova, T. The Relationship between Glucose Variability and Insulin Sensitivity and Oxidative Stress in Subjects with Prediabetes. Diabetes Res. Clin. Pract. 2019, 158, 107911. [Google Scholar] [CrossRef]
- Bantle, A.E.; Bosch, T.A.; Dengel, D.R.; Wang, Q.; Mashek, D.G.; Chow, L.S. DXA-Determined Regional Adiposity Relates to Insulin Resistance in a Young Adult Population with Overweight andObesity. J. Clin. Densitom. 2019, 22, 287–292. [Google Scholar] [CrossRef]
- Bi, X.; Loo, Y.T.; Henry, C.J. Android Fat as a Determinant of Metabolic Syndrome: Sex Differences. Nutrition 2019, 57, 127–132. [Google Scholar] [CrossRef]
- Ma, M.; Jiang, T.; Wen, Z.; Zhang, D.; Xiu, L. Gender Differences in Relation to Body Composition, Insulin Resistance, and Islet Beta Cell Function in Newly Diagnosed Diabetic or Pre-Diabetic Patients. Diabetes Metab. Syndr. Obes. 2023, 16, 723–732. [Google Scholar] [CrossRef]
- Bretherton, I.; Spanos, C.; Leemaqz, S.Y.; Premaratne, G.; Grossmann, M.; Zajac, J.D.; Cheung, A.S. Insulin Resistance in Transgender Individuals Correlates with Android Fat Mass. Ther. Adv. Endocrinol. Metab. 2021, 12, 204201882098568. [Google Scholar] [CrossRef]
- Bielka, W.; Przezak, A.; Molęda, P.; Pius-Sadowska, E.; Machaliński, B. Double diabetes-when type 1 diabetes meets type 2 diabetes: Definition, pathogenesis and recognition. Cardiovasc. Diabetol. 2024, 23, 62. [Google Scholar] [CrossRef] [PubMed]
- Edqvist, J.; Rawshani, A.; Adiels, M.; Björck, L.; Lind, M.; Svensson, A.-M.; Gudbjörnsdottir, S.; Sattar, N.; Rosengren, A. BMI, Mortality, and Cardiovascular Outcomes in Type 1 Diabetes: Findings Against an Obesity Paradox. Diabetes Care 2019, 42, 1297–1304. [Google Scholar] [CrossRef] [PubMed]
- Helliwell, R.; Warnes, H.; Kietsiriroje, N.; Campbell, M.; Birch, R.; Pearson, S.M.; Ajjan, R.A. Body Mass Index, Estimated Glucose Disposal Rate and Vascular Complications in Type 1 Diabetes: Beyond Glycated Haemoglobin. Diabet. Med. 2021, 38, e14529. [Google Scholar] [CrossRef]
- Bhagadurshah, R.R.; Eagappan, S.; Kasthuri Santharam, R.; Subbiah, S. The Impact of Body Mass Index, Residual Beta Cell Function and Estimated Glucose Disposal Rate on the Development of Double Diabetes and Microvascular Complications in Patients with Type 1 Diabetes Mellitus. Cureus 2023, 15, e48979. [Google Scholar] [CrossRef]
- Sun, R.; Wang, J.; Li, M.; Li, J.; Pan, Y.; Liu, B.; Lip, G.Y.H.; Zhang, L. Association of Insulin Resistance with Cardiovascular Disease and All-Cause Mortality in Type 1 Diabetes: Systematic Review and Meta-Analysis. Diabetes Care 2024, dc240475. [Google Scholar] [CrossRef]
- Cantley, N.W.; Lonnen, K.; Kyrou, I.; Tahrani, A.A.; Kahal, H. The Association between Overweight/Obesity and Double Diabetes in Adults with Type 1 Diabetes; a Cross-Sectional Study. BMC Endocr. Disord. 2021, 21, 187. [Google Scholar] [CrossRef]
- Mottalib, A.; Kasetty, M.; Mar, J.Y.; Elseaidy, T.; Ashrafzadeh, S.; Hamdy, O. Weight Management in Patients with Type 1 Diabetes and Obesity. Curr. Diab. Rep. 2017, 17, 92. [Google Scholar] [CrossRef] [PubMed]
- Kim, Y.J.; Hwang, S.D.; Lim, S. Effects of Sodium-Glucose Cotransporter Inhibitor/Glucagon-Like Peptide-1 Receptor Agonist Add-On to Insulin Therapy on Glucose Homeostasis and Body Weight in Patients with Type 1 Diabetes: A Network Meta-Analysis. Front. Endocrinol. 2020, 11, 553. [Google Scholar] [CrossRef] [PubMed]
- Freeby, M.; Lane, K. Treating obesity in type 1 diabetes mellitus—Review of efficacy and safety. Curr. Opin. Endocrinol. Diabetes Obes. 2024, 31, 1–7. [Google Scholar] [CrossRef]
- Dessify, B.; Wood, C.; Parker, D.; Carmichael, D.; Petrick, A.; Daouadi, M. Is there a role for bariatric surgery in patients with severe obesity and type 1 diabetes? Surg. Obes. Relat. Dis. 2022, 18, 177–181. [Google Scholar] [CrossRef]
Disclaimer/Publisher’s Note: The statements, opinions and data contained in all publications are solely those of the individual author(s) and contributor(s) and not of MDPI and/or the editor(s). MDPI and/or the editor(s) disclaim responsibility for any injury to people or property resulting from any ideas, methods, instructions or products referred to in the content. |
© 2024 by the authors. Licensee MDPI, Basel, Switzerland. This article is an open access article distributed under the terms and conditions of the Creative Commons Attribution (CC BY) license (https://creativecommons.org/licenses/by/4.0/).