Abstract
Objectives: The objective of this study is to explore the potential variations in metabolic activity across gliomas originating from distinct cortical regions, as assessed by O-(2-18F-fluoroethyl)-L-tyrosine positron emission tomography (18F-FET PET). Also, this study seeks to elucidate whether these metabolic disparities correlate with the molecular characteristics and clinical prognoses of the tumors. Specifically, this research aims to determine whether variations in 18F-FET PET uptake are indicative of underlying genetic or biochemical differences that could influence patients’ outcomes. Methods: The researchers retrospectively included 107 patients diagnosed with gliomas from neocortex and mesocortex, all of whom underwent hybrid PET/MR examinations, including 18F-FET PET and diffusion weighted imaging (DWI), prior to surgery. The mean and maximum tumor-to-background ratio (TBR) and apparent diffusion coefficient (ADC) values were calculated based on whole tumor volume segmentations. Comparisons of TBR, ADC values, and survival outcomes were performed to determine statistical differences between groups. Results: Among glioblastomas (GBMs, WHO grade 4) originating from the two cortical regions, there was a significant difference in the human Telomerase Reverse Transcriptase (TERT) promoter mutation rate, while no difference was observed in O6-Methylguanine-DNA Methyltransferase (MGMT) promoter methylation status. For WHO grade 3 gliomas, significant differences were found in the TERT promoter mutation rate and the proportion of 1p/19q co-deletion between the two cortical regions, whereas no difference was noted in MGMT methylation status. For WHO grade 2 gliomas, no molecular phenotypic differences were observed between the two cortical regions. In terms of survival, only GBMs originating from the mesocortex demonstrated significantly longer survival compared to those from the neocortex, while no statistically significant differences were found in survival for the other two groups. Conclusions: Gliomas originating from different cortical regions exhibit variations in metabolic activity, molecular phenotypes, and clinical outcomes.
1. Introduction
Gliomas are among the most common primary intracranial tumors. According to the World Health Organization (WHO) classification, gliomas are categorized into four grades (1–4) based on histological and molecular features [1]. Glioblastoma (GBM, WHO grade 4), in particular, is associated with a poor prognosis, with a median overall survival of only 14.6 to 20 months [2,3]. Gliomas can originate from various locations in the brain, with the frontal lobe being the most commonly affected region, followed by the temporal lobe and other brain areas [4]. Previous studies have demonstrated that tumor location is a critical prognostic factor, influencing tumorigenesis and tumor-specific genetic alterations. Supratentorial gliomas, for instance, exhibit worse overall survival compared to infratentorial gliomas and show significant differences in molecular and imaging biomarkers [4,5,6]. Recent findings further indicate that gliomas originating from different brain regions, such as the neocortex, mesocortex, and cerebellum, present distinct clinical profiles and molecular landscapes [4]. Notably, neocortical gliomas are more aggressive, with higher Ki67 indices and Telomerase Reverse Transcriptase (TERT) promoter mutation rates, compared to mesocortical gliomas, which exhibit longer survival and distinct molecular alterations, including lower Epidermal Growth Factor Receptor (EGFR) amplification and a higher prevalence of 1p/19q co-deletion [4].
O-(2-18F-fluoroethyl)-L-tyrosine positron emission tomography (18F-FET PET) has demonstrated significant advantages in metabolic imaging of gliomas [7,8]. Unlike conventional Contrast-Enhanced MRI (CE-MRI), it is not affected by the integrity of the blood–brain barrier and provides a more comprehensive depiction of metabolically active tumor regions [9]. This enables greater specificity and sensitivity in tumor grading, subtyping, and treatment target delineation. Hybrid imaging that combines 18F-FET PET with multi-parametric MRI has shown to improve the spatial delineation of tumor distribution, revealing metabolically active regions often exceeding those defined by MRI alone [9,10]. These regions have been validated through biopsy, emphasizing the potential of 18F-FET PET in guiding biopsy, gross total resection, and radiotherapy planning [9]. Moreover, 18F-FET uptake correlates strongly with molecular markers such as Ki67, reflecting tumor proliferation and heterogeneity. This makes it an invaluable tool in understanding glioma biology and optimizing individualized treatment strategies [9,10].
Despite advancements in glioma imaging, systematic investigations on the metabolic characteristics of gliomas originating from different cortical regions remain scarce. Moreover, it is unclear whether the metabolic features are linked to tumor molecular features and clinical outcomes. This study aims to provide new insights into their biological behavior and clinical management by elucidating the metabolic heterogeneity of gliomas from neocortex and mesocortex, integrating molecular characteristics and clinical outcomes.
2. Materials and Methods
2.1. Patients
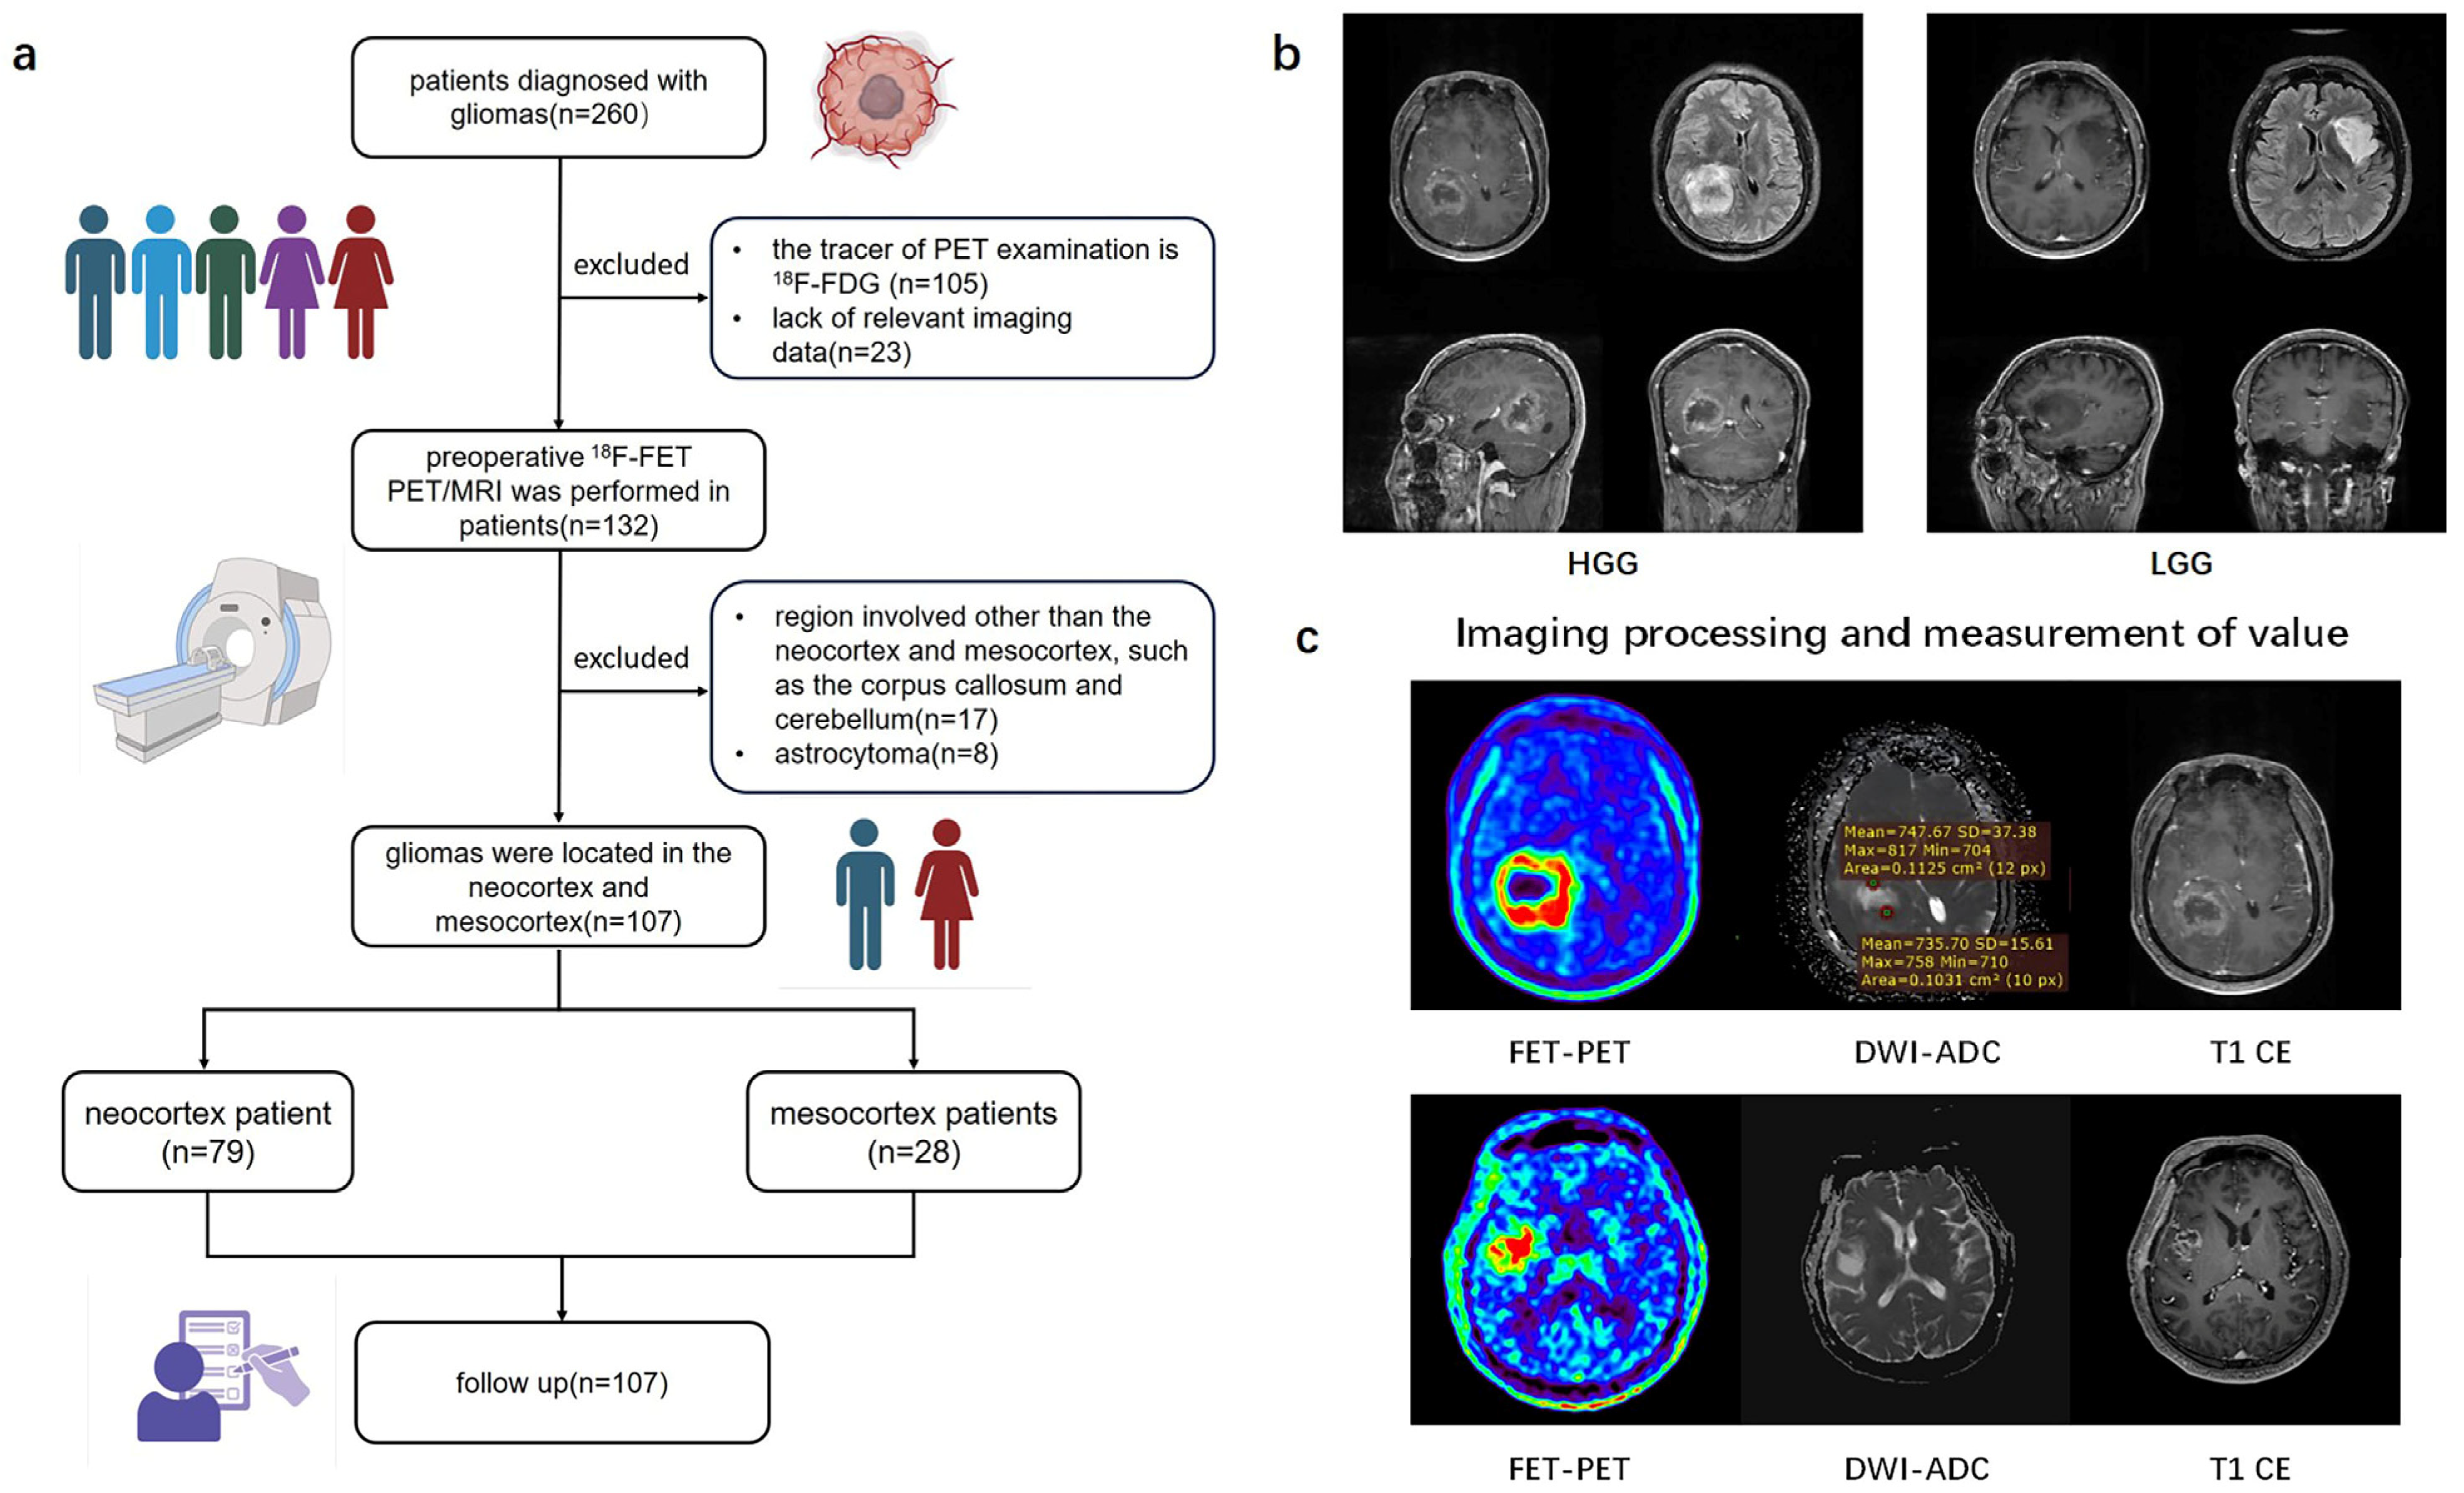
From July 2019 to August 2019, of the initial 260 patients, by the end a total of 107 patients with newly diagnosed or recurrent gliomas proven by pathology who underwent hybrid PET/MRI imaging prior to biopsy or surgical resection were retrospectively recruited into this study (Table 1). The study workflow is presented in Figure 1. Figure 1a shows the patient enrolment process. Based on brain MRI, gliomas involving the frontal, temporal, parietal, and occipital lobes are classified as the neocortex group, while those involving the cingulate gyrus and insular cortex are classified as the mesocortex group (Figure 1b). Written informed consent was obtained from all the patients before PET/MRI examinations. This study was conducted in accordance with the Declaration of Helsinki. This study was approved by the Medical Research Ethics Committee of Xuanwu Hospital, Capital Medical University. In accordance with the 2021 WHO classification, we collaborated with pathologists to reclassify glioma patients diagnosed prior to 2021 by integrating histopathological and molecular pathological results [1]. The inclusion criteria for this study were as follows: (1) adult-type diffuse gliomas pathologically diagnosed according to the 2021 WHO standards, (2) a tracer for PET examination of 18F-FET, (3) gliomas only involving the neocortex or mesocortex of the patient’s brain.

Table 1.
Patient data.

Figure 1.
Study flow chart. (a) A flowchart of inclusion and exclusion criteria for glioma patients in the retrospective study. (b) Typical imaging of glioma originating from different cortical regions. (c) The value of TBR and ADC values measured from 3D ROI of tumors. 18F-FDG (2-[18F]-fluoro-2-deoxy-D-glucose); 18F-FET (O-(2-18F-fluoroethyl)-L-tyrosine positron emission tomography); HGG (high-grade glioma); LGG (low-grade glioma); DWI (diffusion weighted imaging); ADC (apparent diffusion coefficient); TBR (Tumor-to-brain ratio).
RNA sequencing data (Transcripts Per Million, TPM) correlated clinical information of patients with glioma (WHO grade 2–4) and were downloaded from TCGA (https://cancergenome.nih.gov/, accessed on 4 December 2024) database.
2.2. PET/MRI Imaging Acquisition and Reconstruction
All patients underwent integrated preoperative PET and MRI examinations using a 3-T time-of-flight (TOF) hybrid PET/MRI scanner (GE Signa, GE Healthcare, Chicago, IL, USA) equipped with a 19-channel head and neck coil. Accurate attenuation correction in PET/MRI scanning was based on MRI. A 3.0T brain MRI scan was performed to process the attenuation correction of PET images. The MRI sequences included a contrast-enhanced T1-weighted sequence (T1 CE), an axial T2-weighted (T2) sequence, a T2-weighted fluid-attenuated inversion recovery (T2 FLAIR; repetition time/echo time = 9000/maximum) sequence, and an axial diffusion-weighted imaging (DWI) sequence. All patients were required to fast for at least 4 h prior to intravenous injection of 18F-FET at a dose recommended for adult brain imaging (185–200 MBq). Image acquisition for FET-PET and multiparametric MRI scanning was performed simultaneously 20 min after the injection, with a total acquisition time of 20 min [11].
We used another 3.0-T PET/MRI hybrid scanner (uPMR790, United Imaging Healthcare, Shanghai, China) to conduct the PET image reconstruction. Image reconstruction utilized the TOF point-spread function-ordered subset expectation maximization (TOF-PSF-OSEM) method with four iterations and 20 subsets [12]. The parameters were as follows: matrix = 256 × 256, axial field of view = 30 cm, and slice thickness = 1.40 mm. The emission data were corrected for scatter, random effects, and dead-time coincidences [12].
2.3. Quantitative Analysis of Cerebral Metabolism and DWI
All images were post-processed and analyzed using MM BrainAnalysis software (version 2.1.3, United Imaging Intelligence, Shanghai, China). FET uptake was normalized using the standardized uptake value (SUV), which was calculated by dividing the radioactivity in the tissue (kBq/mL) by the injected radioactivity per gram of body weight. A banana-shaped or crescent-shaped volume of interest (VOI) was placed in the healthy cortex (gray and white matter) on the contralateral hemisphere of the lesion to serve as a reference for calculating the tumor-to-background ratio (TBR) (Figure 1c) [11]. Any voxels within the VOI with SUV exceeding the threshold due to vessels or other non-tumor structures were excluded. The biological tumor volume (BTV) was determined using a three-dimensional automatic contouring process with a TBR threshold of 1.6 or higher [13]. Mean Tumor-to-Background Ratio (TBRmean) was calculated by dividing the mean SUV of the tumor VOI by the mean SUV of normal brain tissue. Maximum Tumor-to-Background Ratio (TBRmax) was calculated by dividing the maximum SUV of the tumor VOI by the mean SUV of normal brain tissue. Apparent diffusion coefficient (ADC) maps were generated from DWI sequences. The ADC value for each tumor was obtained through region of interest (ROI) analysis, with ROIs carefully drawn to exclude areas of hemorrhage, cysts, and necrosis. The mean value of multiple ROIs was used to calculate the mean ADC (meanADC) (Figure 1c) [14].
2.4. Molecular Phenotypes
The included gliomas were pathologically diagnosed based on the 2021 World Health Organization (WHO) classification of central nervous system (CNS) tumors, incorporating histological subtypes, and relevant molecular markers. The mutation status of isocitrate dehydrogenase 1 (IDH1), Ki67 index, O6-Methylguanine-DNA Methyltransferase (MGMT) promoter methylation status, TERT promoter mutation status, and 1p/19q codeletion status were assessed using immunohistochemistry, Sanger sequencing, pyrosequencing, next-generation sequencing (NGS), and fluorescence in situ hybridization (FISH), respectively. Pathological results were jointly confirmed by two neuropathologists.
2.5. Statistical Analysis
Statistical analyses were performed using SPSS version 26 (IBM) and GraphPad Prism version 10.1.0. All quantitative data were expressed as mean ± standard deviation. The Shapiro–Wilk test was used to assess the normality of continuous variables. For continuous variables, Student’s t test or the Mann–Whitney U test (two-tailed) were used to evaluate statistical differences between groups. For categorical variables, Pearson’s chi-square test or Fisher’s exact test were applied. Descriptive statistics were presented as a mean with standard deviation or a median with range. To determine the accuracy of PET imaging in predicting TERT promoter mutation status, receiver operating characteristic (ROC) analysis was conducted. Imaging measurements were used as the diagnostic test, with histopathological analysis serving as the reference standard. The area under the ROC curve (AUC) and its 95% confidence interval were calculated. A p-value of less than 0.05 was considered statistically significant.
3. Results
3.1. Patient Enrollment and Tumor Characteristics
A total of 260 glioma patients who underwent preoperative integrated PET/MRI examinations were retrospectively reviewed at the beginning of this study. After excluding 153 patients, 107 eligible patients from July 2019 to August 2024 were included in the analysis. This cohort consisted of 64 males and 43 females, with a mean age of 51.7 ± 14.7 years (Table 1). In the neocortex group, there were 54 GBM patients, 12 WHO grade 3 and 13 WHO grade 2 glioma patients. Gliomas originating from the frontal lobe accounted for the highest proportion in this group (32 cases, 40.5%), followed by those from the temporal lobe (25 cases, 31.6%), parietal lobe (12 cases, 15.2%), and occipital lobe (10 cases, 12.7%). In the mesocortex group, there were nine GBM patients, eight WHO grade 3 and eleven WHO grade 2 glioma patients. The majority of gliomas in this group originated from the insula (27 cases, 96.4%), with only a small proportion arising from the cingulate gyrus (1 case, 3.6%). The mean age of patients in the neocortex group was 53.3 years (SD: 14.0), while the mean age in the mesocortex group was 47.3 years (SD: 16.1) (Table 2). There were no significant differences in age or sex between the two groups (p > 0.05). However, a significant difference was observed in the tumor composition between the two groups (a higher proportion of high-grade gliomas in the neocortex group compared to the mesocortex group, p < 0.01) (Table 2). Therefore, we further divided gliomas involving the neocortex and mesocortex into three groups based on WHO grading and conducted statistical comparisons between groups of the same grade.
Table 2.
Distribution.
3.2. Metabolic Differences in GBM Originating from Different Cortexs
There were significant differences in TBR values and molecular testing results between GBMs originating from the two cortical regions. GBMs originating from the neocortex had higher TBRmax and TBRmean values compared to those from the mesocortex (4.46 ± 1.51 vs. 2.92 ± 1.12, p < 0.01; 2.57 ± 0.65 vs. 1.96 ± 0.67, p < 0.05) (Figure 2b) (Table 3). Additionally, the TERT promoter mutation rate and Ki67 index were significantly higher in neocortical GBMs (TERT promoter-mutant: 77.8% vs. 22.2%, p < 0.01; Ki67: 38.0% ± 15.5% vs. 20.9% ± 12.2%, p < 0.01) (Figure 2c) (Table 3). Meanwhile, we also observed that GBMs originating from the mesocortex had a better prognosis compared to those in the neocortex (Overall Survival (OS) 30 months vs. 18 months, p < 0.05; Progression-Free Survival (PFS) 25 months vs. 11 months p < 0.01) (Figure 2d) (Table 3).
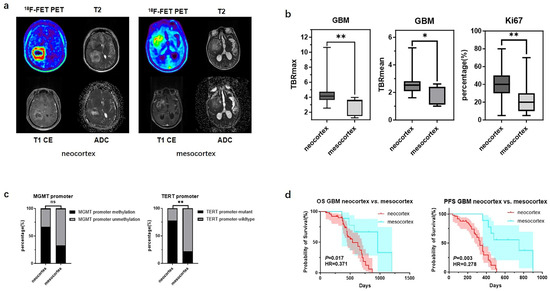
Figure 2.
Mutation landscapes, clinical and imaging characteristics of GBMs originating from the neocortex and mesocortex. (a) The 18F-FET metabolic range of gliomas determined by semi-automatically segmenting the 3D ROI with a TBR > 1.6. (b) Comparison of TBRmax and TBRmean values in GBMs originating from different cortices (Student’s t test, p < 0.01, p < 0.05). Ki67 percentage in GBMs originating from the neocortex and mesocortex (Student’s t test, p < 0.01). (c) Comparison of mutation rates of key genes in GBMs originating from different cortices (Fisher’s exact test, p > 0.05, p < 0.05) (*, p < 0.05; **, p < 0.01; ns, not significant). (d) Comparison of OS and PFS between GBMs of neocortex and mesocortex origins (Kaplan Maier). 18F-FET PET, O-(2-18F-fluoroethyl)-L-tyrosine positron emission tomography; ADC, apparent diffusion coefficient; T1 CE, contrast-enhanced T1-weighted sequence; TBR, tumor-to-background ratio; TBRmax, maximum tumor-to-background ratio; TBRmean, mean tumor-to-background ratio; GBM, glioblastoma; OS, overall survival; PFS, progression-free survival; TERT, telomerase reverse transcriptase; MGMT, O6-Methylguanine-DNA Methyltransferase.
Table 3.
GBM neocortex vs. mesocortex.
3.3. Metabolic Differences in WHO Grade 3 and 2 Gliomas Originating from Different Cortexs
For WHO grade 3 gliomas, significant differences in TBR values and molecular testing results were also observed between samples originating from the neocortex and the mesocortex. The determination of glioma location and the processing of PET images can be seen in Figure 3a. WHO grade 3 gliomas from the neocortex had higher TBRmax and TBRmean values compared to those from the mesocortex (3.94 ± 1.39 vs. 2.72 ± 0.83, p < 0.05; 2.55 ± 0.88 vs. 1.79 ± 0.32 p < 0.05) (Figure 3b) (Table 4). Moreover, neocortical WHO grade 3 gliomas exhibited higher rates of TERT promoter mutation and 1p/19q co-deletion (TERT promoter-mutant: 66.7% vs. 12.5%, p < 0.05; 1p/19q-codeleted: 66.7% vs. 12.5%, p < 0.05) (Figure 3c) (Table 4). However, there was no statistically significant difference in prognosis between the two groups (Figure 3d).
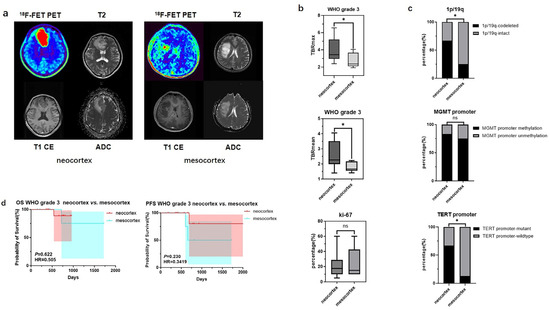
Figure 3.
Mutation landscapes, clinical, and imaging characteristics of WHO grade 3 gliomas originating from the neocortex and mesocortex. (a) The 18F-FET metabolic range of gliomas determined by semi-automatically segmenting the 3D ROI with a TBR > 1.6. (b) Comparison of TBRmax and TBRmean values in WHO grade 3 gliomas originating from different cortices (Student’s t test, p < 0.05, p < 0.05). Ki67 percentage in WHO grade 3 gliomas originating from the neocortex and mesocortex (Student’s t test, p > 0.05). (c) Comparison of mutation rates of key genes in WHO grade 3 gliomas originating from different cortices (Fisher’s exact test, p < 0.05, p > 0.05, p < 0.05) (*, p < 0.05; ns, not significant). (d) Comparison of OS and PFS between WHO grade 3 gliomas of neocortex and mesocortex origins (Kaplan Maier). 18F-FET PET, O-(2-18F-fluoroethyl)-L-tyrosine positron emission tomography; ADC, apparent diffusion coefficient; T1 CE, contrast-enhanced T1-weighted sequence; TBR, tumor-to-background ratio; TBRmax, maximum tumor-to-background ratio; TBRmean, mean tumor-to-background ratio; OS, overall survival; PFS, progression-free survival; TERT, telomerase reverse transcriptase; MGMT, O6-Methylguanine-DNA Methyltransferase.
Table 4.
WHO grade 3 neocortex vs. mesocortex.
In contrast, for WHO grade 2 gliomas originating from different cortical regions, differences were observed only in TBRmax and TBRmean values (2.86 ± 0.78 vs. 2.05 ± 0.50, p < 0.01; 1.78 ± 0.36 vs. 1.47 ± 0.30 p < 0.05), while no significant statistical differences were found in their molecular phenotypes and prognosis (Figure 4) (Table 5).
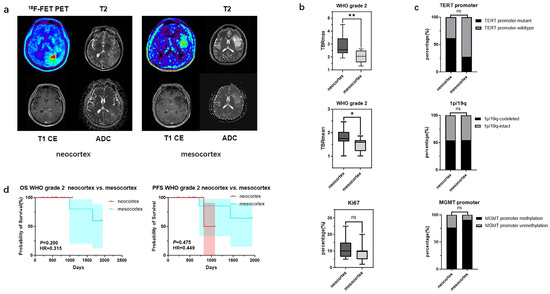
Figure 4.
Mutation landscapes, clinical, and imaging characteristics of WHO grade 2 gliomas originating from the neocortex and mesocortex. (a) The 18F-FET metabolic range of gliomas determined by semi-automatically segmenting the 3D ROI with a TBR > 1.6. (b) Comparison of TBRmax and TBRmean values in WHO grade 2 gliomas originating from different cortices (Student’s t test, p < 0.01, p < 0.05). Ki67 percentage in WHO grade 2 gliomas originating from the neocortex and mesocortex (Student’s t test, p > 0.05). (c) Comparison of mutation rates of key genes in WHO grade 2 gliomas originating from different cortices (Fisher’s exact test, p > 0.05, p > 0.05, p > 0.05) (*, p < 0.05; **, p < 0.01; ns, not significant). (d) Comparison of OS and PFS between WHO grade 2 gliomas of neocortex and mesocortex origins (Kaplan Maier). 18F-FET PET, O-(2-18F-fluoroethyl)-L-tyrosine positron emission tomography; ADC, apparent diffusion coefficient; T1 CE, contrast-enhanced T1-weighted sequence; TBR, tumor-to-background ratio; TBRmax, maximum tumor-to-background ratio; TBRmean, mean tumor-to-background ratio; OS, overall survival; PFS, progression-free survival; TERT, telomerase reverse transcriptase; MGMT, O6-Methylguanine-DNA Methyltransferase.
Table 5.
WHO grade 2 neocortex vs. mesocortex.
3.4. FET Uptake Levels and Prognosis Are Influenced by the Status of TERT Promoter and Ki67
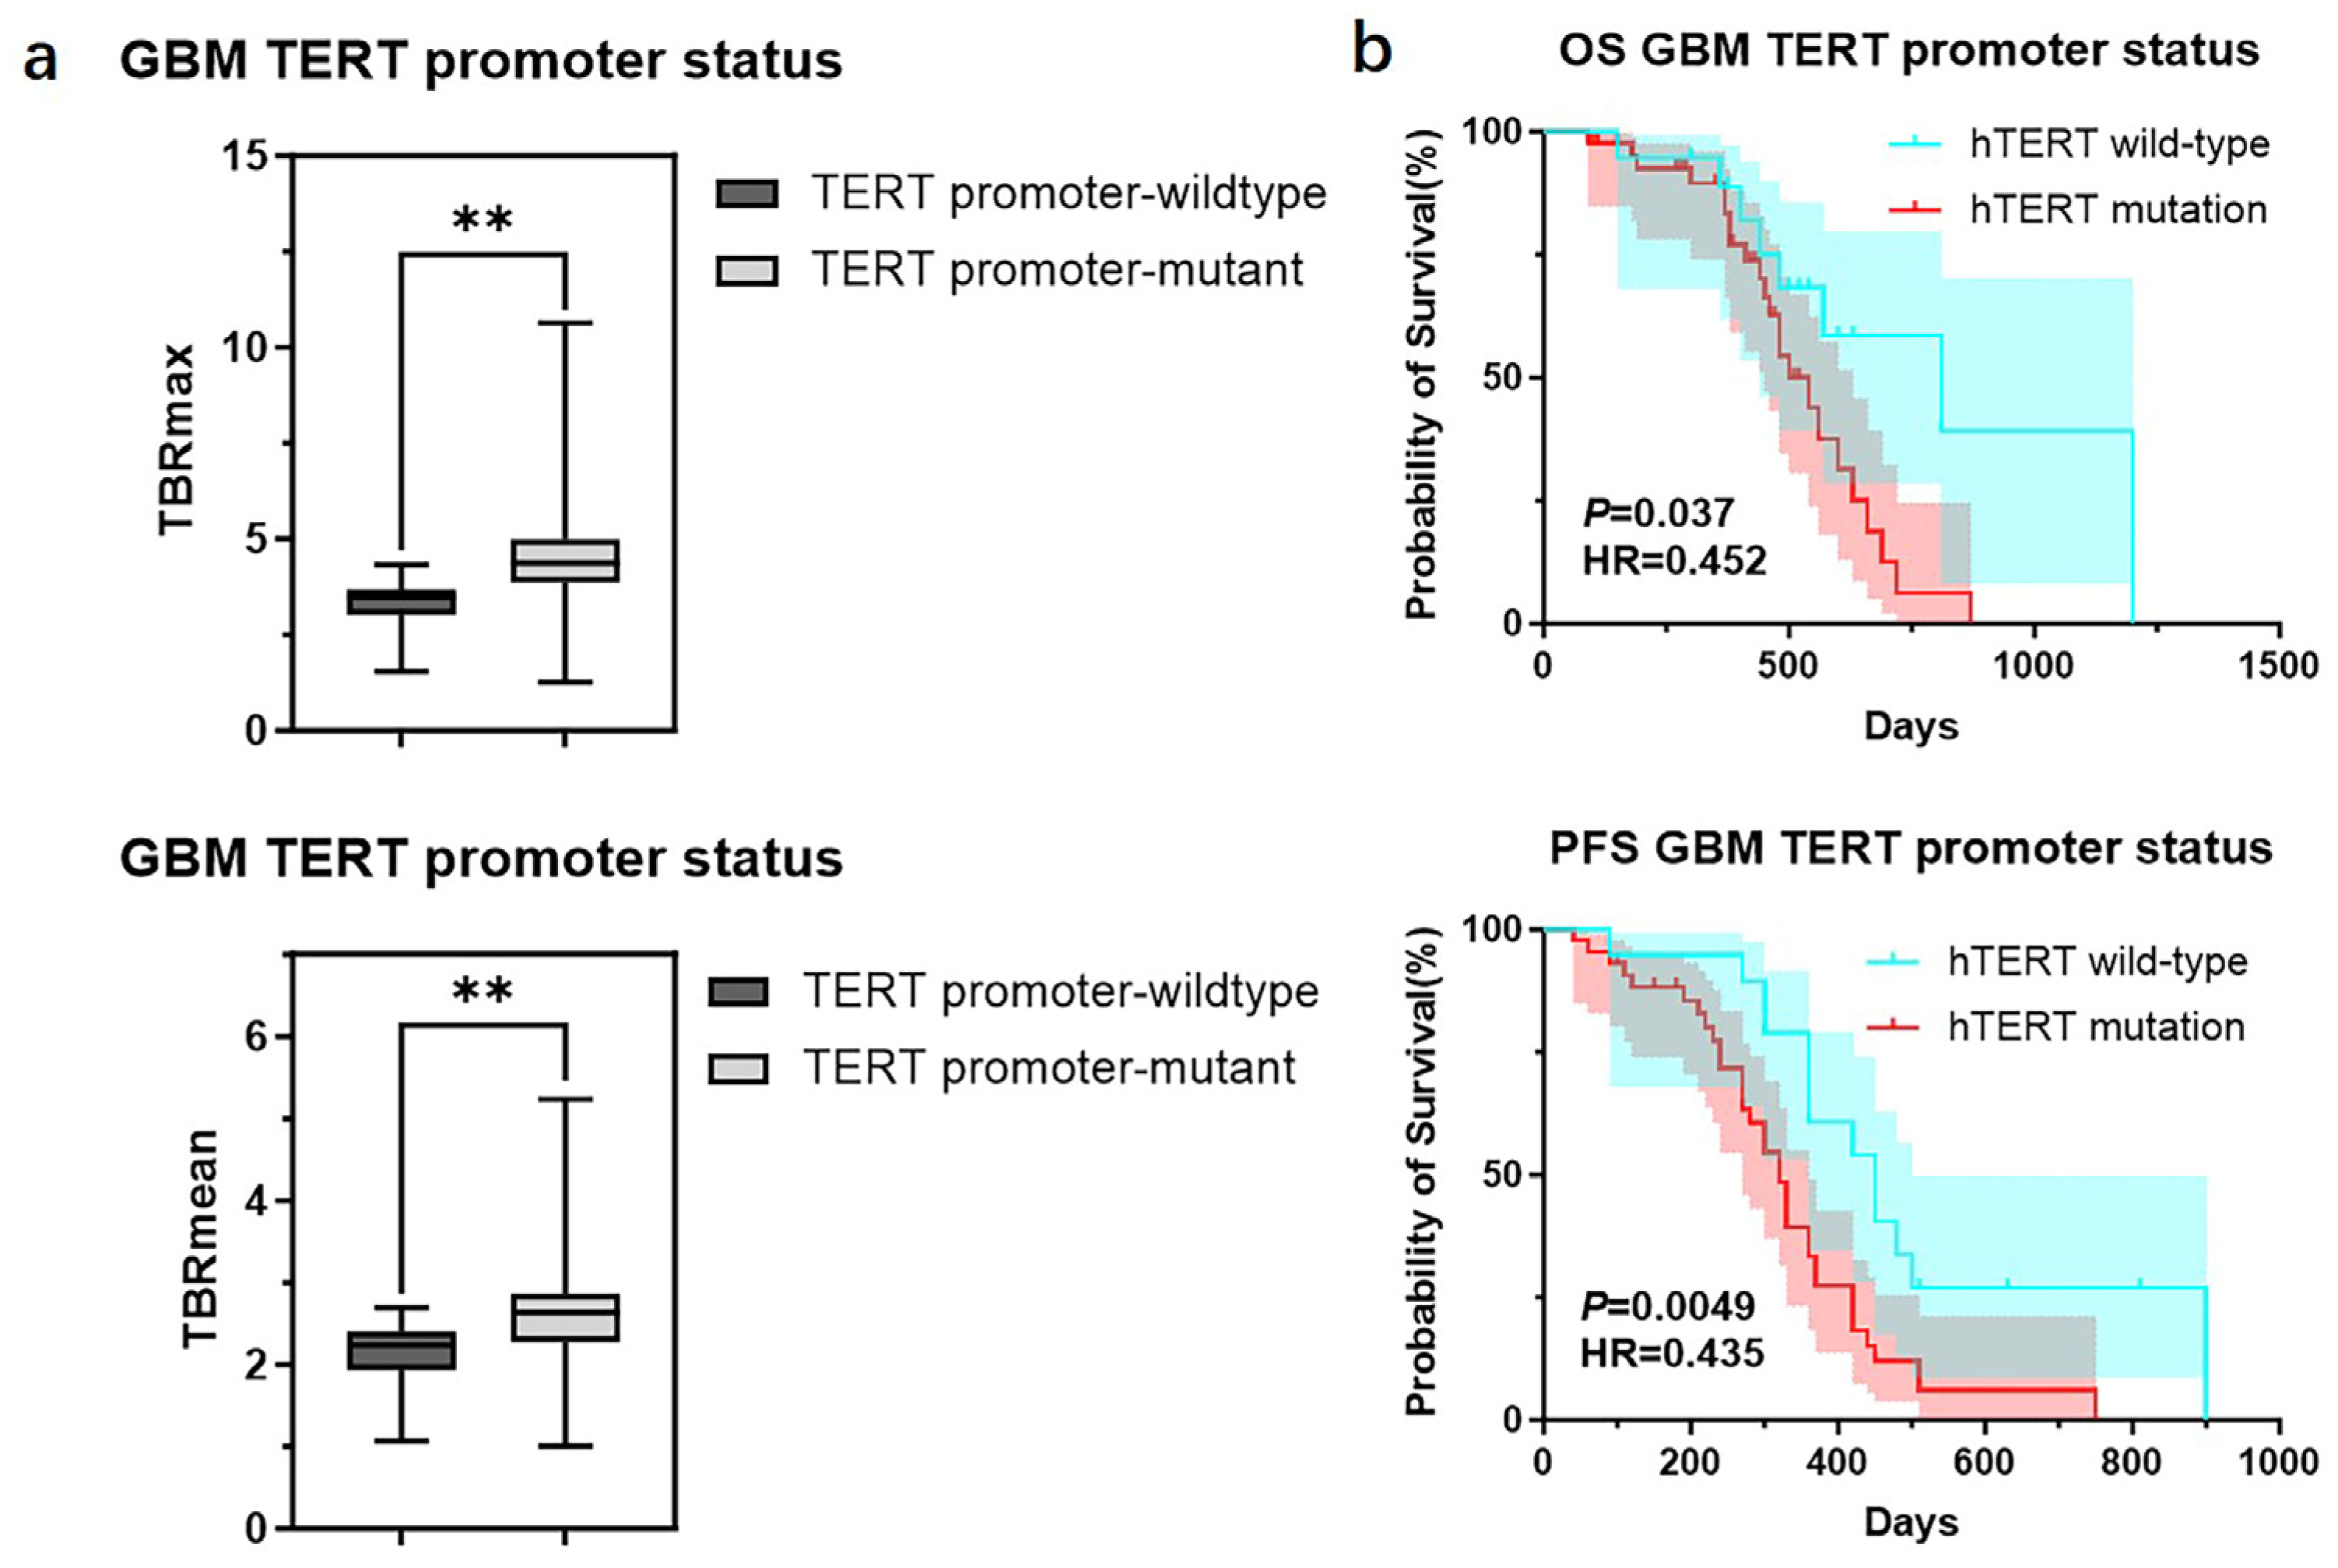
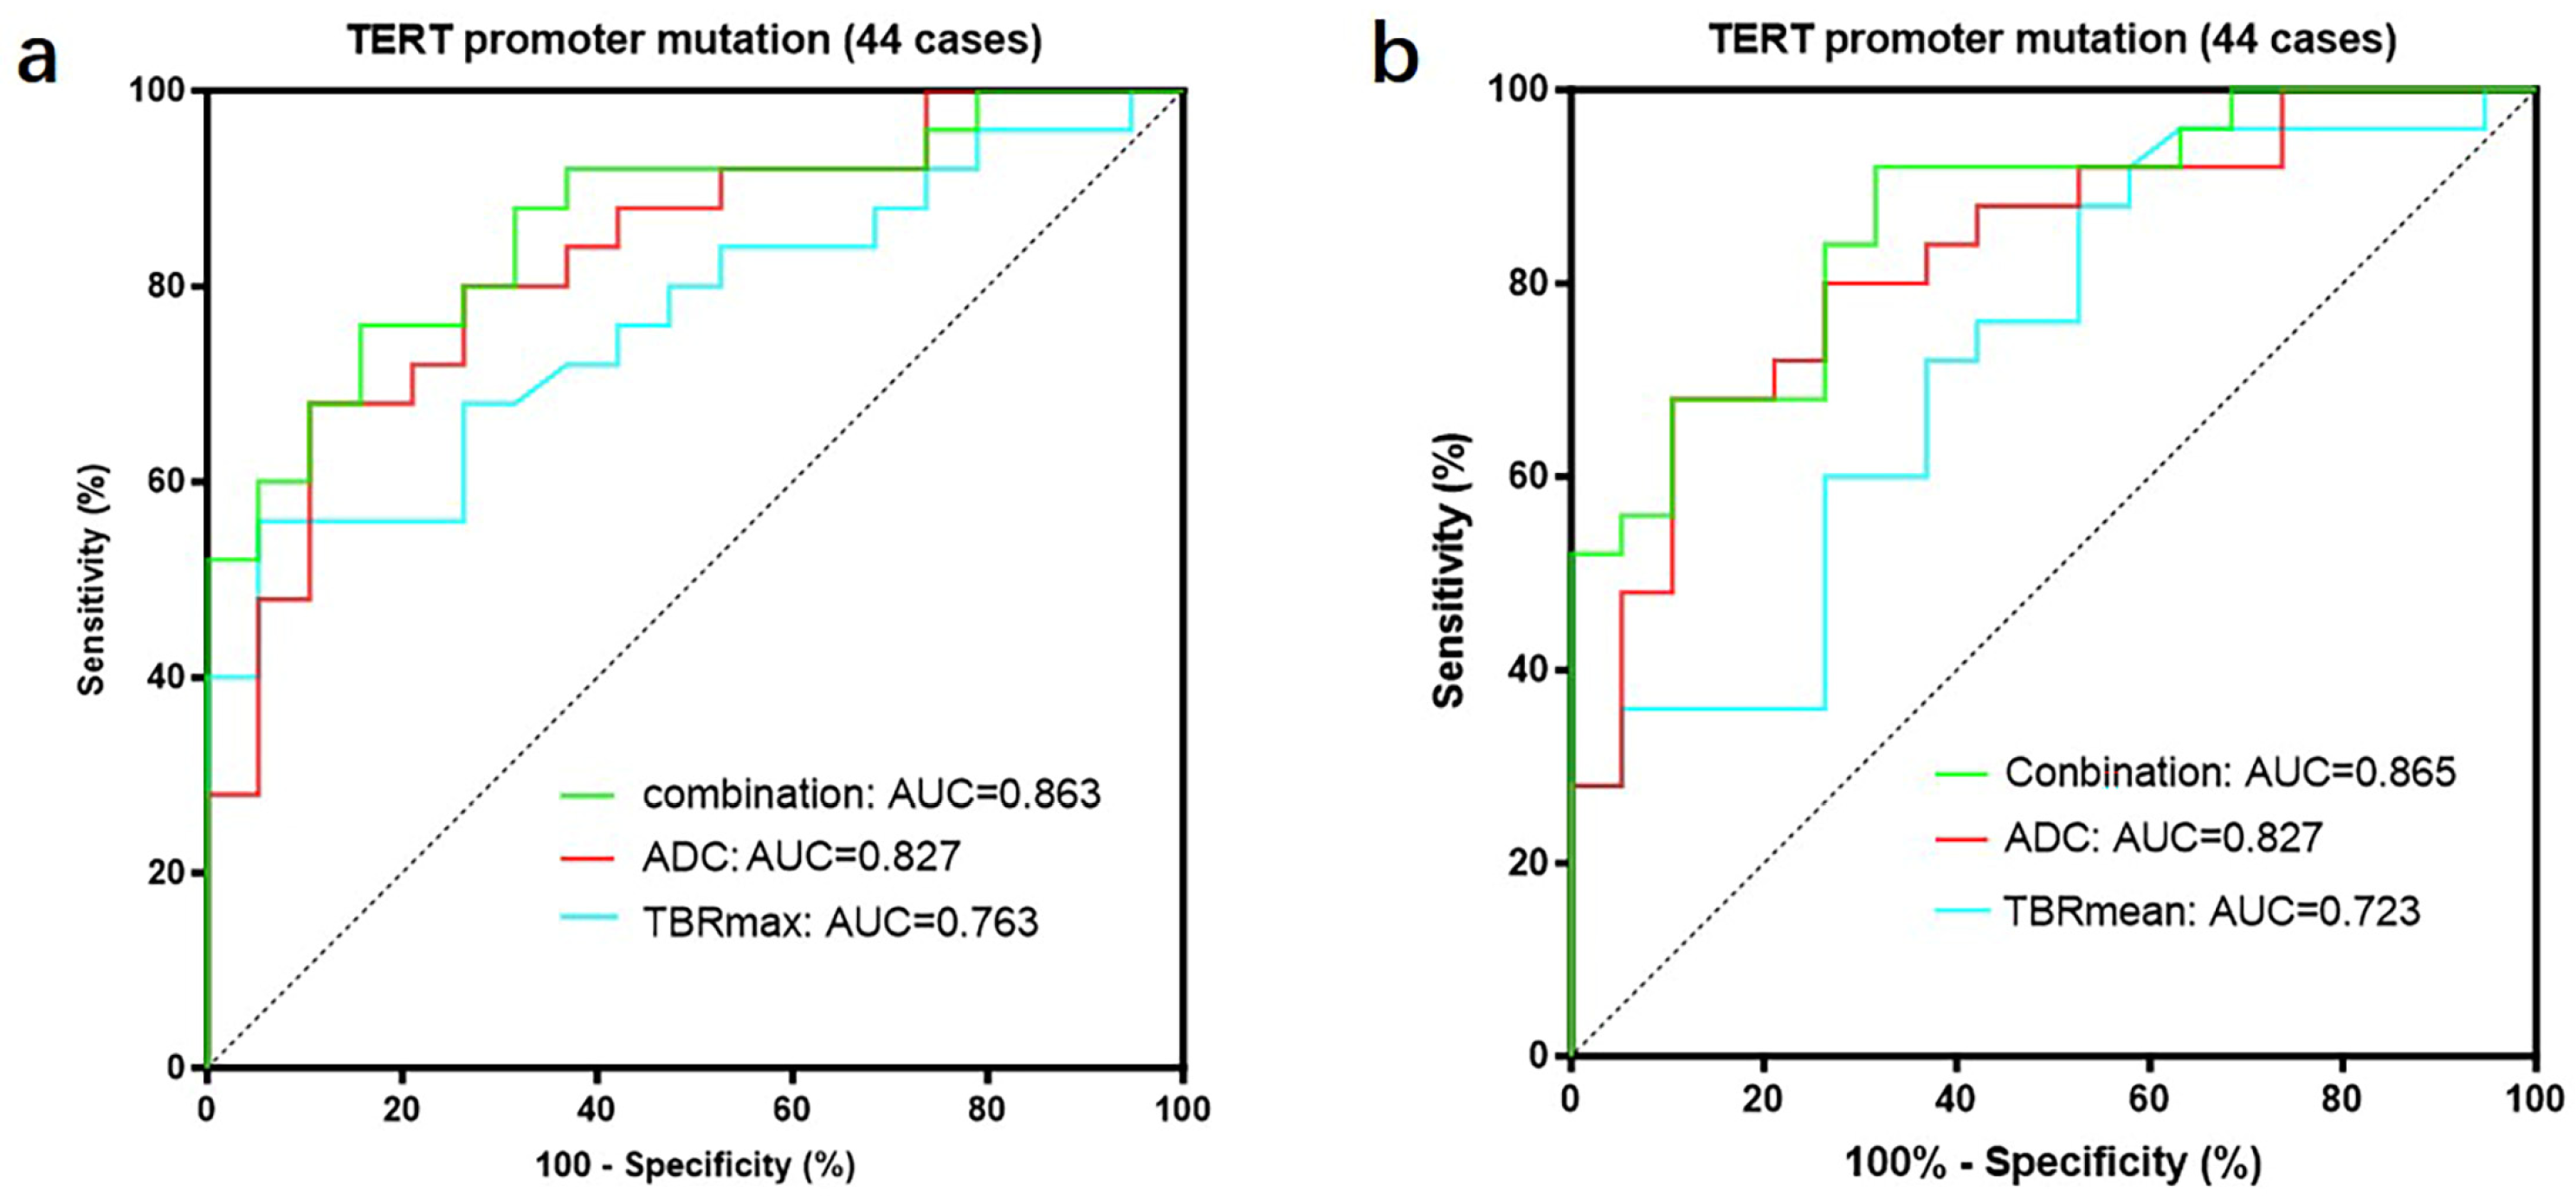
We further divided GBMs into two groups based on the status of the TERT promoter and compared the TBR values and prognosis between the two groups. The results showed that GBMs with TERT promoter mutations had higher TBR values (4.62 ± 1.65 vs. 3.39 ± 0.99 p < 0.01; 2.64 ± 0.75 vs. 2.12 ± 0.55 p < 0.01) and poorer prognosis (OS 18 months vs. 27 months p < 0.05; PFS 11 months vs. 15 months p < 0.05) compared to those with wild-type TERT promoters (Figure 5) (Table 6). Subsequently, we applied the same criteria to classify WHO grade 3 and WHO grade 2 gliomas. The results were consistent with those observed in glioblastomas, showing that gliomas with TERT promoter mutations exhibited higher metabolic activity than TERT wild-type gliomas (Supplementary Figure S2). Additionally, we conducted a correlation analysis between TBR values and Ki67 and found a positive correlation between them (Ki67 and TBRmax, R2 = 0.1318, p = 0.0001; Ki67 and TBRmean, R2 = 0.1482, p < 0.0001) (Supplementary Figure S3). Then, we used the receiver operating characteristic (ROC) curve for evaluation and obtained an area under the curve (AUC) of 0.763 (TBRmax) and 0.723 (TBRmean). Additionally, we found that the combination of TBR and ADC values yielded the highest AUC when predicting the status of the TERT promoter (TBRmax 0.763, meanADC 0.723, combination 0.863; TBRmean 0.723, meanADC 0.723, combination 0.865) (Figure 6).

Figure 5.
TBR values and clinical outcomes of GBMs divided into groups according to the status of TERT promoter. (a) Comparison of TBRmax and TBRmean values in GBMs with different TERT promoter status (Student’s t test, p < 0.01, p < 0.01) (**, p < 0.01). (b) Comparison of OS and PFS between GBMs with different TERT promoter status (Kaplan Maier). GBM, Glioblastoma; TERT, telomerase reverse transcriptase; TBR, tumor-to-background ratio; TBRmax, maximum tumor-to-background ratio; TBRmean, mean tumor-to-background ratio; OS, overall survival; PFS, progression-free survival.
Table 6.
TERT promoter status in GBM.
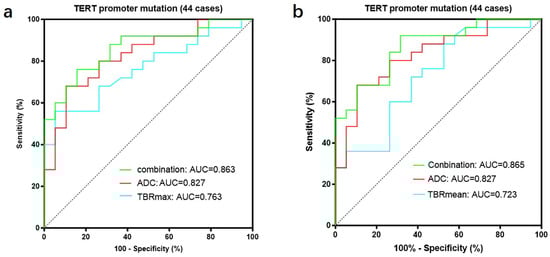
Figure 6.
A total of 44 patients had both FET-PET and DWI-ADC imaging data. (a) The accuracy of predicting the TERT promoter status was evaluated using receiver operating characteristic (ROC) curves for TBRmax, ADC values, and their combination. The results showed that the area under the ROC curve was largest when both parameters were combined, indicating the highest accuracy (TBRmax: AUC = 0.763, ADC: AUC = 0.827, Conbination: AUC = 0.863). (b) The accuracy of predicting the TERT promoter status was evaluated using receiver operating characteristic (ROC) curves for TBRmean, ADC values, and their combination. The results showed that the area under the ROC curve was largest when both parameters were combined, indicating the highest accuracy (TBRmean: AUC = 0.723, ADC: AUC = 0.827, Conbination: AUC = 0.865). ROC curve for TBRmax, TBRmean and meanADC, in differentiating TERT promoter mutation from wildtype in gliomas. TERT, telomerase reverse transcriptase; TBR, tumor-to-background ratio; TBRmax, maximum tumor-to-background ratio; TBRmean, mean tumor-to-background ratio; ADC, apparent diffusion coefficient; AUC, area under the curve.
We downloaded transcriptomic data of gliomas (WHO grade 2–4) from the TCGA database and divided the samples into two groups based on TERT promoter status. Comparing the two groups, we found that SLC7A5 (solute carrier family 7 member 5) expression was higher in gliomas with TERT promoter mutations (Supplementary Figure S4).
3.5. Metabolic Differences Between Neocortical and Mesocortical Gliomas
Finally, we analyzed the metabolic and molecular phenotypic differences between neocortical and mesocortical gliomas without stratifying by tumor grade. There were significant differences in TBR values and molecular testing results between gliomas originating from the two cortical regions. Gliomas originating from the neocortex had a significantly higher mean TBRmax and TBRmean value compared to those from the mesocortex (4.17 ± 1.53 vs. 2.54 ± 0.93, p < 0.001; 2.44 ± 0.71 vs. 1.72 ± 0.49, p < 0.001). Moreover, the proportions of IDH1 and TERT promoter mutations were higher in neocortical gliomas than in mesocortical gliomas (67.9% vs. 31.6%, p < 0.01 and 68.4% vs. 25.0%, p < 0.001, respectively). In addition, the Ki67 index was significantly higher in neocortical gliomas compared to mesocortical gliomas (30.8% ± 18.0% vs. 17.6% ± 14.2%, p < 0.001). These findings suggest that gliomas originating from the neocortex exhibit significantly higher metabolic activity compared to those from the mesocortex (Supplementary Figure S1) (Supplementary Table S1).
4. Discussion
In this study, we analyzed 107 glioma cases treated at our institution, which originated from the neocortex and meso-cortex. All patients underwent pre-operative FET-PET/MRI imaging. Similarly to a previous study [4], gliomas originating from the neocortex and mesocortex may differ in terms of age at onset, with patients having neocortical gliomas tending to be older. However, no significant difference was observed, and future studies should focus on larger sample sizes. Grade heterogeneity of gliomas originating from the neocortex and mesocortex was found in the current study. Approximately 68.35% of gliomas from the neocortex and 32.14% of gliomas from the mesocortex were GBM. The percentage of GBM in gliomas of the neocortex is similar to the results of a previous study, which found that about 60% gliomas from the neocortex were GBM [4]. Additionally, Mackintosh et al. reported that 84% of gliomas in the temporal lobe were GBM [15].
Our study findings were the first to confirm that different neocortical gliomas (including GBM, WHO grade 3 and 2 glioma) exhibited significantly higher TBRmax and TBRmean values, indicating higher metabolic activity. Additionally, neocortical gliomas (including GBM, WHO grade 3 glioma) had significantly higher TERT promoter mutation rates and Ki67. Accordingly, survival analysis showed that neocortical GBMs had worse clinical outcomes, with shorter OS and PFS, suggesting greater proliferative potential and aggressiveness. Similar results could be found in a previous study [4], which reported that the TERT mutation rate in neocortical high-grade gliomas (WHO grade 3–4) was higher than that in mesocortical and the gliomas originating from the neocortex had significantly shorter OS and PFS compared to those from the mesocortex. Notably, this study is the first to reveal that gliomas of the same grade originating from the neocortex have significantly higher TBR values compared to those of the same grade originating from the meso-cortex. Although the TBR value alone cannot determine the exact malignancy of gliomas and requires a comprehensive evaluation incorporating pathological and molecular analyses, studies have shown that a higher TBR value is generally associated with a higher degree of malignancy in gliomas [8,9,16,17]. This correlation is mainly reflected in the fact that gliomas with higher TBR values often exhibit increased metabolic activity, greater proliferative and invasive potential, and are associated with higher-grade gliomas and poorer survival outcomes [16]. Specifically, gliomas with higher TBR values tend to have higher Ki67 and TERT promoter mutation rates, indicating increased tumor proliferative activity [9], this may be related to a higher number of active tumor cells, leading to increased FET uptake. As an imaging biomarker, the TBR value serves as an important reference for the comprehensive assessment of glioma malignancy and the formulation of treatment strategies. This study revealed significant clinical, metabolic, and molecular differences between gliomas originating from the neocortex and mesocortex.
In most tumors, including gliomas, TERT expression is associated with poor prognosis [18,19,20]. Typically, TERT promoter mutations are predictive of GBM survival and serve as an independent prognostic factor for poor outcomes [21]. Therefore, the worse clinical outcomes observed in GBMs originating from the neocortex compared to those from the mesocortex may be explained by the higher TERT promoter mutation rate. L-type amino acid transporter 1 (LAT1) is an essential neutral amino acid transporter that is highly expressed in tissues with high metabolic demands, including cancer cells [7,8,16]. Studies have shown that LAT1 is overexpressed in various malignant tumors, including GBM, and is closely associated with tumor invasiveness, proliferation, and treatment response [16]. Compared to normal brain tissue, LAT1 expression is significantly elevated in glioma tissues, with expression levels increasing in correlation with tumor grade, indicating a positive association with tumor malignancy. Furthermore, tumors with high LAT1 expression typically exhibit higher Ki67, reflecting enhanced cellular proliferative capacity [16]. The high expression of LAT1 is also associated with increased metabolic activity in 18F-FET-PET (18F-fluoroethyl-L-tyrosine PET) imaging, suggesting that LAT1 may play a crucial role in mediating amino acid uptake and promoting tumor cell metabolism and growth. Kaplan–Meier survival analysis reveals that patients with high LAT1 expression have significantly shorter OS and PFS compared to those with low LAT1 expression, further indicating that LAT1 could serve as a potential prognostic marker for poor outcomes in gliomas [7,8,16]. The high expression of LAT1 is usually accompanied by a high accumulation of FET in tumor tissue. This accumulation is reflected in PET imaging as higher TBR values [7,8]. Therefore, based on previous research findings [7,16], it may be inferred that the higher the expression level of LAT1, the higher the corresponding TBR values in gliomas. In this study, the TBR values of gliomas of the same grade originating from the neocortex were significantly higher than those from the mesocortex, which seems to suggest that the expression levels of LAT1 in neocortical gliomas are significantly higher than those in mesocortical gliomas. In this research, we found that gliomas originating from the neocortex have a higher TERT promoter mutation rate and higher TBR values compared to those originating from the mesocortex. Additionally, our analysis of glioma transcriptomic data from the TCGA database revealed that gliomas with TERT promoter mutations exhibit higher expression levels of SLC7A5. Since LAT1 is the protein encoded by the SLC7A5 gene [22], we hypothesize that the higher TERT promoter mutation rate in neocortical gliomas may lead to increased LAT1 expression, which in turn enhances FET uptake and consequently increases metabolic activity. The high expression of LAT1 in tumor cells and its differential expression in gliomas of different cortical origins may become a key focus for future research.
Our study has preliminarily found some differences in clinical outcomes and molecular phenotypes between gliomas originating from the neocortex and mesocortex. In particular, it was found that patients with glioblastoma originating from the mesocortex had a better prognosis than those with tumors arising from the neocortex. Several mechanistic hypotheses can be considered to explain this phenomenon: First, During the development of the cerebral cortex, the mesocortex develops earlier and consists of three to six layers, mainly responsible for processing emotions and feelings. In contrast, the neocortex develops later and consists of six layers, primarily responsible for higher cognitive functions [23,24]. The complexity of the neocortex implies greater plasticity in its cellular composition and a higher likelihood of mutations, which may contribute to more aggressive tumor characteristics [25,26,27,28]. Secondly, neurons and glial cells in the neocortex originate from the neuroepithelium and undergo complex migration and layering processes, whereas the mesocortex develops earlier and maintains a more conserved structure. The high plasticity and neural stem cell reservoir in the neocortex may provide tumors with greater adaptability for rapid progression and treatment resistance [27,28,29]. In addition, the neocortex has a richer vascular supply and higher metabolic demand, which may explain why gliomas originating from the neocortex exhibit higher TBR values on 18F-FET PET. This hypermetabolic state may enable tumor cells to grow more rapidly and invade more aggressively, potentially influencing their response to treatments such as radiotherapy and chemotherapy [25,29,30]. Finally, neurons in the neocortex form extensive connections across multiple brain regions, whereas the mesocortex has more restricted connectivity. Since gliomas tend to infiltrate along white matter fiber tracts, the widespread connections of the neocortex may provide tumor cells with more efficient pathways for dissemination, accelerating disease progression [25,26,31]. Although speculative, these hypotheses are based on the previous literature regarding the anatomy of the cerebral cortex, structure–function relationships, brain networks, energy metabolism, and neuron–glia interactions, making them appear credible. Therefore, we speculate that the differences in tissue structure and microenvironment between the neocortex and mesocortex during development may contribute to the differences in molecular mutations and clinical outcomes. In future studies, we will integrate genomics, proteomics, and metabolomics to further explore the molecular mechanisms underlying the metabolic activity differences between the neocortex and mesocortex. Additionally, we plan to expand the sample size and strive to conduct large-scale, multicenter studies to enhance the generalizability and clinical applicability of our findings. On this basis, we aim to develop more precise radiotherapy, chemotherapy, and targeted therapy protocols based on metabolic imaging and molecular characteristics.
5. Conclusions
Gliomas originating from the neocortex and mesocortex exhibit differences in clinical prognosis, cellular metabolism, and molecular phenotypes, which may assist neurosurgeons in preoperative planning and treatment decision-making.
Supplementary Materials
The following supporting information can be downloaded at: https://www.mdpi.com/article/10.3390/biomedicines13030657/s1, Figure S1: TBR values of WHO grade 3 and 2 gliomas divided into groups according to the status of TERT promoter. (a). Comparison of TBRmax and TBRmean values in WHO grade 3 gilomas with different TERT promoter status (Student’s t test, p < 0.05, p < 0.05). (b) Comparison of TBRmax and TBRmean values in WHO grade 2 gilomas with different TERT promoter status (Student’s t test, p > 0.05, p < 0.01); Figure S2: Correlation analysis between TBR and Ki-67 (Simple linear regression, R2 = 0.1318, p = 0.0001; R2 = 0.1482, p < 0.0001); Figure S3: Comparison of SLC7A5 expression in gilomas with different TERT promoter status (Student’s t test, p < 0.05); Figure S4 Mutation landscapes, clinical and imaging characteristics of gliomas originating from the neocortex and mesocortex. (a) The 18F-FET metabolic range of gliomas determined by semi-automatically segmenting the 3D ROI with a TBR > 1.6. (b) Comparison of TBRmax and TBRmean values in gliomas originating from different cortices (Student’s t test, p < 0.0001, p < 0.0001). Ki-67 percentage in gliomas originating from the neocortex and mesocortex (Student’s t test, p < 0.001). (c) Comparison of mutation rates of key genes in gliomas originating from different cortices(chi-square test, p < 0.01, p > 0.05, p > 0.05, p < 0.001). (d) Comparison of OS and PFS between GBMs of neocortex and mesocortex origins (Kaplan Maier); Table S1: All neocortex vs. mesocortex.
Author Contributions
Conceptualization, J.T., J.L., Y.C. and H.D.; methodology, H.D., X.W. and X.L.; data curation, H.D., X.W., S.L., B.S. and Y.C.; writing—original draft preparation, H.D. and X.W.; writing—review and editing, all authors; visualization, H.D., X.W. and Y.C. All authors have read and agreed to the published version of the manuscript.
Funding
This study has received funding from the National Key Research and Development Program of China (No. 2022YFC2406905), the National Natural Science Foundation of China (No. 82373403 to Y.C.), and the Beijing Natural Science Foundation (No. L222022).
Institutional Review Board Statement
This study was conducted in accordance with the Declaration of Helsinki. This study was approved by the Medical Research Ethics Committee of Xuanwu Hospital, Capital Medical University (protocol number: [2023]044, 23 April 2023).
Informed Consent Statement
Written informed consent was obtained from all subjects (patients) in this study.
Data Availability Statement
Dates of this research are available from the corresponding author upon reasonable request.
Acknowledgments
This work was supported by Xiaoran Li and Leiming Wang. The writing of this English translation was supported by Jie Tang and Ye Cheng.
Conflicts of Interest
The authors declare no competing interests.
Abbreviations
The following abbreviations are used in this manuscript:
| 18F-FET PET | O-(2-18F-fluoroethyl)-L-tyrosine positron emission tomography |
| DWI | Diffusion weighted imaging |
| TERT | Telomerase Reverse Transcriptase |
| MGMT | O6-Methylguanine-DNA Methyltransferase |
| TBR | Tumor-to-brain ratio |
| ADC | Apparent diffusion coefficient |
| WHO | World Health Organization |
| GBM | Glioblastoma |
| EGFR | Epidermal growth factor receptor |
| TOF | Time-of-flight |
| T1 CE | Contrast-enhanced T1-weighted |
| T1 FLAIR | T1-weighted fluid-attenuated inversion recovery |
| T2 FLAIR | T2-weighted fluid-attenuated inversion recovery |
| SUV | Standardized uptake value |
| BTV | Biological tumor volume |
| VOI | Volume of interest |
| ROI | Region of interest |
| IDH | Isocitrate Dehydrogenase |
| NGS | next-generation sequencing |
| ROC | Receiver operating characteristic |
| OS | Overall survival |
| PFS | Progression-Free Survival |
| LAT1 | L-type amino acid transporter 1 |
References
- Louis, D.N.; Perry, A.; Wesseling, P.; Brat, D.J.; Cree, I.A.; Figarella-Branger, D.; Hawkins, C.; Ng, H.K.; Pfister, S.M.; Reifenberger, G.; et al. The 2021 WHO Classification of Tumors of the Central Nervous System: A summary. Neuro-Oncol. 2021, 23, 1231–1251. [Google Scholar] [CrossRef] [PubMed]
- Stupp, R.; Taillibert, S.; Kanner, A.; Read, W.; Steinberg, D.; Lhermitte, B.; Toms, S.; Idbaih, A.; Ahluwalia, M.S.; Fink, K.; et al. Effect of Tumor-Treating Fields Plus Maintenance Temozolomide vs Maintenance Temozolomide Alone on Survival in Patients With Glioblastoma: A Randomized Clinical Trial. JAMA 2017, 318, 2306–2316. [Google Scholar] [CrossRef] [PubMed]
- Bale, T.A.; Rosenblum, M.K. The 2021 WHO Classification of Tumors of the Central Nervous System: An update on pediatric low-grade gliomas and glioneuronal tumors. Brain Pathol. 2022, 32, e13060. [Google Scholar] [CrossRef] [PubMed]
- Cheng, Y.; Zhang, L.; Wu, X.; Wakimoto, H.; Geng, H.; Wei, Y.; Xu, G.; Xiao, X.; Bai, J.; Wang, Y.; et al. Distinct clinical profiles and mutation landscapes of gliomas originating from the neocortex, mesocortex, and cerebellum. Genes. Dis. 2024, 11, 53–56. [Google Scholar] [CrossRef]
- Sayegh, E.T.; Aranda, D.; Kim, J.M.; Oh, T.; Parsa, A.T.; Oh, M.C. Prognosis by tumor location in adults with intracranial ependymomas. J. Clin. Neurosci. 2014, 21, 2096–2101. [Google Scholar] [CrossRef]
- Lopci, E.; Riva, M.; Olivari, L.; Raneri, F.; Soffietti, R.; Piccardo, A.; Bizzi, A.; Navarria, P.; Ascolese, A.M.; Ruda, R.; et al. Prognostic value of molecular and imaging biomarkers in patients with supratentorial glioma. Eur. J. Nucl. Med. Mol. Imaging 2017, 44, 1155–1164. [Google Scholar] [CrossRef]
- Habermeier, A.; Graf, J.; Sandhöfer, B.F.; Boissel, J.P.; Roesch, F.; Closs, E.I. System L amino acid transporter LAT1 accumulates O-(2-fluoroethyl)-L-tyrosine (FET). Amino Acids 2015, 47, 335–344. [Google Scholar] [CrossRef]
- Langen, K.J.; Hamacher, K.; Weckesser, M.; Floeth, F.; Stoffels, G.; Bauer, D.; Coenen, H.H.; Pauleit, D. O-(2-[18F]fluoroethyl)-L-tyrosine: Uptake mechanisms and clinical applications. Nucl. Med. Biol. 2006, 33, 287–294. [Google Scholar] [CrossRef]
- Song, S.; Cheng, Y.; Ma, J.; Wang, L.; Dong, C.; Wei, Y.; Xu, G.; An, Y.; Qi, Z.; Lin, Q.; et al. Simultaneous FET-PET and contrast-enhanced MRI based on hybrid PET/MR improves delineation of tumor spatial biodistribution in gliomas: A biopsy validation study. Eur. J. Nucl. Med. Mol. Imaging 2020, 47, 1458–1467. [Google Scholar] [CrossRef]
- Li, X.; Cheng, Y.; Han, X.; Cui, B.; Li, J.; Yang, H.; Xu, G.; Lin, Q.; Xiao, X.; Tang, J.; et al. Exploring the association of glioma tumor residuals from incongruent [18F]FET PET/MR imaging with tumor proliferation using a multiparametric MRI radiomics nomogram. Eur. J. Nucl. Med. Mol. Imaging 2024, 51, 779–796. [Google Scholar] [CrossRef]
- Law, I.; Albert, N.L.; Arbizu, J.; Boellaard, R.; Drzezga, A.; Galldiks, N.; la Fougère, C.; Langen, K.J.; Lopci, E.; Lowe, V.; et al. Joint EANM/EANO/RANO practice guidelines/SNMMI procedure standards for imaging of gliomas using PET with radiolabelled amino acids and [18F]FDG: Version 1.0. Eur. J. Nucl. Med. Mol. Imaging 2019, 46, 540–557. [Google Scholar] [CrossRef] [PubMed]
- Spangler-Bickell, M.G.; Khalighi, M.M.; Hoo, C.; DiGiacomo, P.S.; Maclaren, J.; Aksoy, M.; Rettmann, D.; Bammer, R.; Zaharchuk, G.; Zeineh, M.; et al. Rigid Motion Correction for Brain PET/MR Imaging using Optical Tracking. IEEE Trans. Radiat. Plasma Med. Sci. 2019, 3, 498–503. [Google Scholar] [CrossRef] [PubMed]
- Pauleit, D.; Floeth, F.; Hamacher, K.; Riemenschneider, M.J.; Reifenberger, G.; Müller, H.W.; Zilles, K.; Coenen, H.H.; Langen, K.J. O-(2-[18F]fluoroethyl)-L-tyrosine PET combined with MRI improves the diagnostic assessment of cerebral gliomas. Brain 2005, 128 Pt 3, 678–687. [Google Scholar] [CrossRef]
- Caravan, I.; Ciortea, C.A.; Contis, A.; Lebovici, A. Diagnostic value of apparent diffusion coefficient in differentiating between high-grade gliomas and brain metastases. Acta Radiol. 2018, 59, 599–605. [Google Scholar] [CrossRef]
- Mackintosh, C.; Butterfield, R.; Zhang, N.; Lorence, J.; Zlomanczuk, P.; Bendok, B.R.; Zimmerman, R.S.; Swanson, K.; Porter, A.; Mrugala, M.M. Does location matter? Characterisation of the anatomic locations, molecular profiles, and clinical features of gliomas. Neurol. I Neurochir. Pol. 2020, 54, 456–465. [Google Scholar] [CrossRef]
- Nawashiro, H.; Otani, N.; Uozumi, Y.; Ooigawa, H.; Toyooka, T.; Suzuki, T.; Katoh, H.; Tsuzuki, N.; Ohnuki, A.; Shima, K.; et al. High expression of L-type amino acid transporter 1 in infiltrating glioma cells. Brain Tumor Pathol. 2005, 22, 89–91. [Google Scholar] [CrossRef]
- Cappoli, N.; Jenkinson, M.D.; Dello Russo, C.; Dickens, D. LAT1, a novel pharmacological target for the treatment of glioblastoma. Biochem. Pharmacol. 2022, 201, 115103. [Google Scholar] [CrossRef]
- Tabori, U.; Ma, J.; Carter, M.; Zielenska, M.; Rutka, J.; Bouffet, E.; Bartels, U.; Malkin, D.; Hawkins, C. Human telomere reverse transcriptase expression predicts progression and survival in pediatric intracranial ependymoma. J. Clin. Oncol. 2006, 24, 1522–1528. [Google Scholar] [CrossRef]
- Ducrest, A.L.; Szutorisz, H.; Lingner, J.; Nabholz, M. Regulation of the human telomerase reverse transcriptase gene. Oncogene 2002, 21, 541–552. [Google Scholar] [CrossRef]
- Mao, J.; Zhang, Q.; Wang, Y.; Zhuang, Y.; Xu, L.; Ma, X.; Guan, D.; Zhou, J.; Liu, J.; Wu, X.; et al. TERT activates endogenous retroviruses to promote an immunosuppressive tumour microenvironment. EMBO Rep. 2022, 23, e52984. [Google Scholar] [CrossRef]
- Aldape, K.; Zadeh, G.; Mansouri, S.; Reifenberger, G.; von Deimling, A. Glioblastoma: Pathology, molecular mechanisms and markers. Acta Neuropathol. 2015, 129, 829–848. [Google Scholar] [CrossRef] [PubMed]
- Fotiadis, D.; Kanai, Y.; Palacín, M. The SLC3 and SLC7 families of amino acid transporters. Mol. Asp. Med. 2013, 34, 139–158. [Google Scholar] [CrossRef] [PubMed]
- Patestas, M.A.; Gartner, L.P. A Textbook of Neuroanatomy; WILEY: Hoboken, NJ, USA, 2016. [Google Scholar]
- Gogolla, N. The insular cortex. Curr. Biol. 2017, 27, R580–R586. [Google Scholar] [CrossRef] [PubMed]
- Lui, J.H.; Hansen, D.V.; Kriegstein, A.R. Development and evolution of the human neocortex. Cell 2011, 146, 18–36. [Google Scholar] [CrossRef]
- Shura, R.D.; Hurley, R.A.; Taber, K.H. Insular cortex: Structural and functional neuroanatomy. J. Neuropsychiatry Clin. Neurosci. 2014, 26, 276–282. [Google Scholar] [CrossRef]
- Hatten, M.E. New directions in neuronal migration. Science 2002, 297, 1660–1663. [Google Scholar] [CrossRef]
- Granger, B.; Tekaia, F.; Le Sourd, A.M.; Rakic, P.; Bourgeois, J.P. Tempo of neurogenesis and synaptogenesis in the primate cingulate mesocortex: Comparison with the neocortex. J. Comp. Neurol. 1995, 360, 363–376. [Google Scholar] [CrossRef]
- Duffau, H.; Capelle, L. Preferential brain locations of low-grade gliomas. Cancer 2004, 100, 2622–2626. [Google Scholar] [CrossRef]
- Aubert, A.; Costalat, R.; Duffau, H.; Benali, H. Modeling of pathophysiological coupling between brain electrical activation, energy metabolism and hemodynamics: Insights for the interpretation of intracerebral tumor imaging. Acta Biotheor. 2002, 50, 281–295. [Google Scholar] [CrossRef]
- Fields, R.D.; Stevens-Graham, B. New insights into neuron-glia communication. Science 2002, 298, 556–562. [Google Scholar] [CrossRef]


Disclaimer/Publisher’s Note: The statements, opinions and data contained in all publications are solely those of the individual author(s) and contributor(s) and not of MDPI and/or the editor(s). MDPI and/or the editor(s) disclaim responsibility for any injury to people or property resulting from any ideas, methods, instructions or products referred to in the content. |
© 2025 by the authors. Licensee MDPI, Basel, Switzerland. This article is an open access article distributed under the terms and conditions of the Creative Commons Attribution (CC BY) license (https://creativecommons.org/licenses/by/4.0/).