Abstract
Analysis of RNA-sequencing (RNA-seq) data is an effective means to analyze the gene expression levels under specific conditions and discover new biological knowledge. More than 74,000 experimental series with RNA-seq have been stored in public databases as of 20 October 2021. Since this huge amount of expression data accumulated from past studies is a promising source of new biological insights, we focused on a meta-analysis of 1783 runs of RNA-seq data under the conditions of two types of stressors: oxidative stress (OS) and hypoxia. The collected RNA-seq data of OS were organized as the OS dataset to retrieve and analyze differentially expressed genes (DEGs). The OS-induced DEGs were compared with the hypoxia-induced DEGs retrieved from a previous study. The results from the meta-analysis of OS transcriptomes revealed two genes, CRIP1 and CRIP3, which were particularly downregulated, suggesting a relationship between OS and zinc homeostasis. The comparison between meta-analysis of OS and hypoxia showed that several genes were differentially expressed under both stress conditions, and it was inferred that the downregulation of cell cycle-related genes is a mutual biological process in both OS and hypoxia.
1. Introduction
Oxidative stress (OS) is characterized by an imbalance between oxidants and antioxidants, caused by an increase in the levels of reactive oxygen species (ROS) in a biological system. ROS comprise free radicals that can damage cellular molecules and disrupt homeostasis when antioxidants are downregulated, or ROS levels are upregulated. Chronic OS has been observed in various diseases such as Parkinson’s disease, hepatitis, and cancer [1,2,3,4,5].
Due to its strong relationship with human health, the mechanisms of OS have been extensively investigated to provide biological and medical knowledge. These include the mechanism of DNA damage by the highly reactive hydroxyl radicals, the role of OS in the appearance of carcinogenesis and the increase in OS-inducible inflammatory cells by activation of specific transcription factors such as NF-E2-related factor-2 (NRF2) [6,7]. The past studies have also resulted in 435 genes in Homo sapiens annotated with the term “GO:0006979 response to oxidative stress” in gene ontology (GO). On the other hand, the broadness of OS-inducible factors and the dynamics of ROS in biological systems make the OS studies challenging and complicated [8]. Despite attempts to list and categorize the OS-related compounds, contributing factors for OS involve an enormous range of both external and internal sources [1] and distinguishing oxidative and non-oxidative sources is challenging. Therefore, the present study focused on analyzing the common features among various sources of OS from the perspective of changes in gene expression. As for another underdeveloped area of OS studies, a clear line between other types of stresses and OS has not been defined. It is necessary to compare OS and other stresses such as hypoxia, which is also an oxygen-related stress condition.
Hypoxia is characterized by reduced oxygen availability in tissues and is known to increase ROS levels through changes in signaling cascades and protein expression [9]. A previous study has successfully attained the collective intelligence of public hypoxic transcriptomes by analyzing 944 runs of RNA-seq data [10]. This approach, a statistical analysis of combined results from multiple studies, called meta-analysis, has attracted attention. This is because the data-driven nature of meta-analysis makes it possible to obtain new findings that are difficult to achieve with traditional hypothesis-driven research methods [11]. The dataset and results obtained in the meta-analysis of hypoxia are valuable sources for both hypothesis- and data-driven research.
To discover novel areas by utilizing valuable open sources, we collected OS transcriptomes of human-cultured cells from public databases and performed a meta-analysis. This study aimed to investigate the key genes and characteristics for both OS and the comparison between OS and hypoxia by analyzing the differentially expressed genes (DEGs) from the meta-analysis of both OS and hypoxia. The investigation was based on 1783 sets of RNA-seq data (839 from this study and 944 from our previous study of meta-analysis in hypoxia [10]). These investigated genes, the curated dataset for OS, and the method described in this study to compare the results of multiple meta-analyses are expected to be valuable sources for promoting future studies.
2. Materials and Methods
2.1. Curation of Public Gene Expression Data
As a first step to access and view the integrated expression metadata from public databases, we initially used a graphical web tool, All Of gene Expression (AOE) [12]. AOE provides integrated information about gene expression data integrated from Gene Expression Omnibus (GEO) [13], ArrayExpress [14], Genomic Expression Archive [15], and RNA-seq data only archived in the Sequence Read Archive (SRA) [16]. Extensive keywords, including oxidative stress, rotenone, paraquat, hydrogen peroxide (H2O2), UV, lipopolysaccharide, arsenite, and deoxynivalenol, were searched in GEO to collect a list of experiment data series related to the RNA-seq data of OS in humans. Then, we manually curated the adequate data with four main criteria: total RNA or polyA-RNA for extracted molecules (sequencing library type), relation to the definition of oxidative stress, relation to an increase in the ROS level, and availability of the corresponding control data (normal state) to pair with the OS data.
2.2. RNA-seq Data Retrieval, Processing, and Quantification
We used Ikra for RNA-seq data retrieval, processing, and quantification. Ikra is an automated pipeline program for RNA-seq data of Homo sapiens and Mus musculus [17]. Ikra automates the following processes: conversion of the collected SRA format data to FASTQ formatted files using fasterq-dump (version.2.9.6) [18], quality control and trimming of transcript reads with trim-galore (version 0.6.6) [19], and quantification of the transcripts in a unit of transcripts per million (TPM) by salmon (version 1.4.0) [20] with reference transcript sets in GENCODE Release 31 (GRCh38.p12).
2.3. Calculation of ON_ratio and ON_score
We calculated the ratio of expression value of each gene in all pairs between Oxidative stress and Normal state (termed as ON_ratio) [10,11]. Biological replicates from the same data series were treated as individual experiments. The ON_ratio was calculated using Equation (1):
T corresponds to the expression value quantified in TPM. A small number (1 in this case) was added to the expression value to avoid the calculation of zero. ON_ratio values helped to classify each gene into three groups: upregulated, downregulated, and unchanged. When the ON_ratio was greater than the threshold, the gene was considered upregulated, and when the ON_ratio was less than the threshold, the gene was treated as downregulated, otherwise the gene was categorized as unchanged. We adopted 5- and 10-fold thresholds for upregulation and 0.2- and 0.1-fold thresholds for downregulation after testing several thresholds.
To take all the collected RNA-seq data pairs into account, we calculated an Oxidative stress Normal state score (termed as ON_score [11]) based on ON_ratio values using Equation (2):
ON_score = count numberupregulated – count numberdownregulated
ON_ratio and ON_score were previously introduced in the meta-analysis of OS transcriptome in insects [11] and the meta-analysis of hypoxic transcriptome [10] (termed as HN-ratio and HN-score in the meta-analysis of hypoxia).
2.4. Analysis and Comparison of Gene Sets
Differentially expressed gene sets were analyzed by using the web tool Metascape (https://metascape.org/, accessed on 20 September 2021) [21], which performs gene set enrichment analysis. We examined the corresponding terms and p-values obtained using the gene set enrichment analysis. We also used a web Venn diagram tool [22] to search and visualize the matched genes among different gene sets.
3. Results
3.1. Data Curation/Collection of Oxidative Stress Transcriptome Data
We collected 839 sets of RNA-seq data and curated them as the OS dataset with 386 pairs of OS and normal state transcriptome data. As OS is caused by various factors, sources of OS in the OS dataset include hydrogen peroxide (H2O2), UV, rotenone, lipopolysaccharide, arsenite, radiation, NRF2 knockdown/KO, BRD4 KO, deoxynivalenol, palmitate, cadmium, methylmercury, zinc dimethyldithiocarbamate, aging, paraquat, and others (Table 1). The proportion of the data pairs of hydrogen peroxide, UV, and rotenone against the total 386 pairs was as follows: 25%, 15%, and 12%, respectively. The percentage of the samples derived from cancer cells was 18% (71 pairs out of 386 pairs). Other metadata about the OS dataset such as each SRA project ID, SRR ID, cell type, concentration of treatment, hours of treatment, and library type of sequencing are shown in Figshare [23].

Table 1.
The number of data pairs retrieved for each source of OS.
3.2. Verifying the Characteristics of DEGs Using the OS Dataset
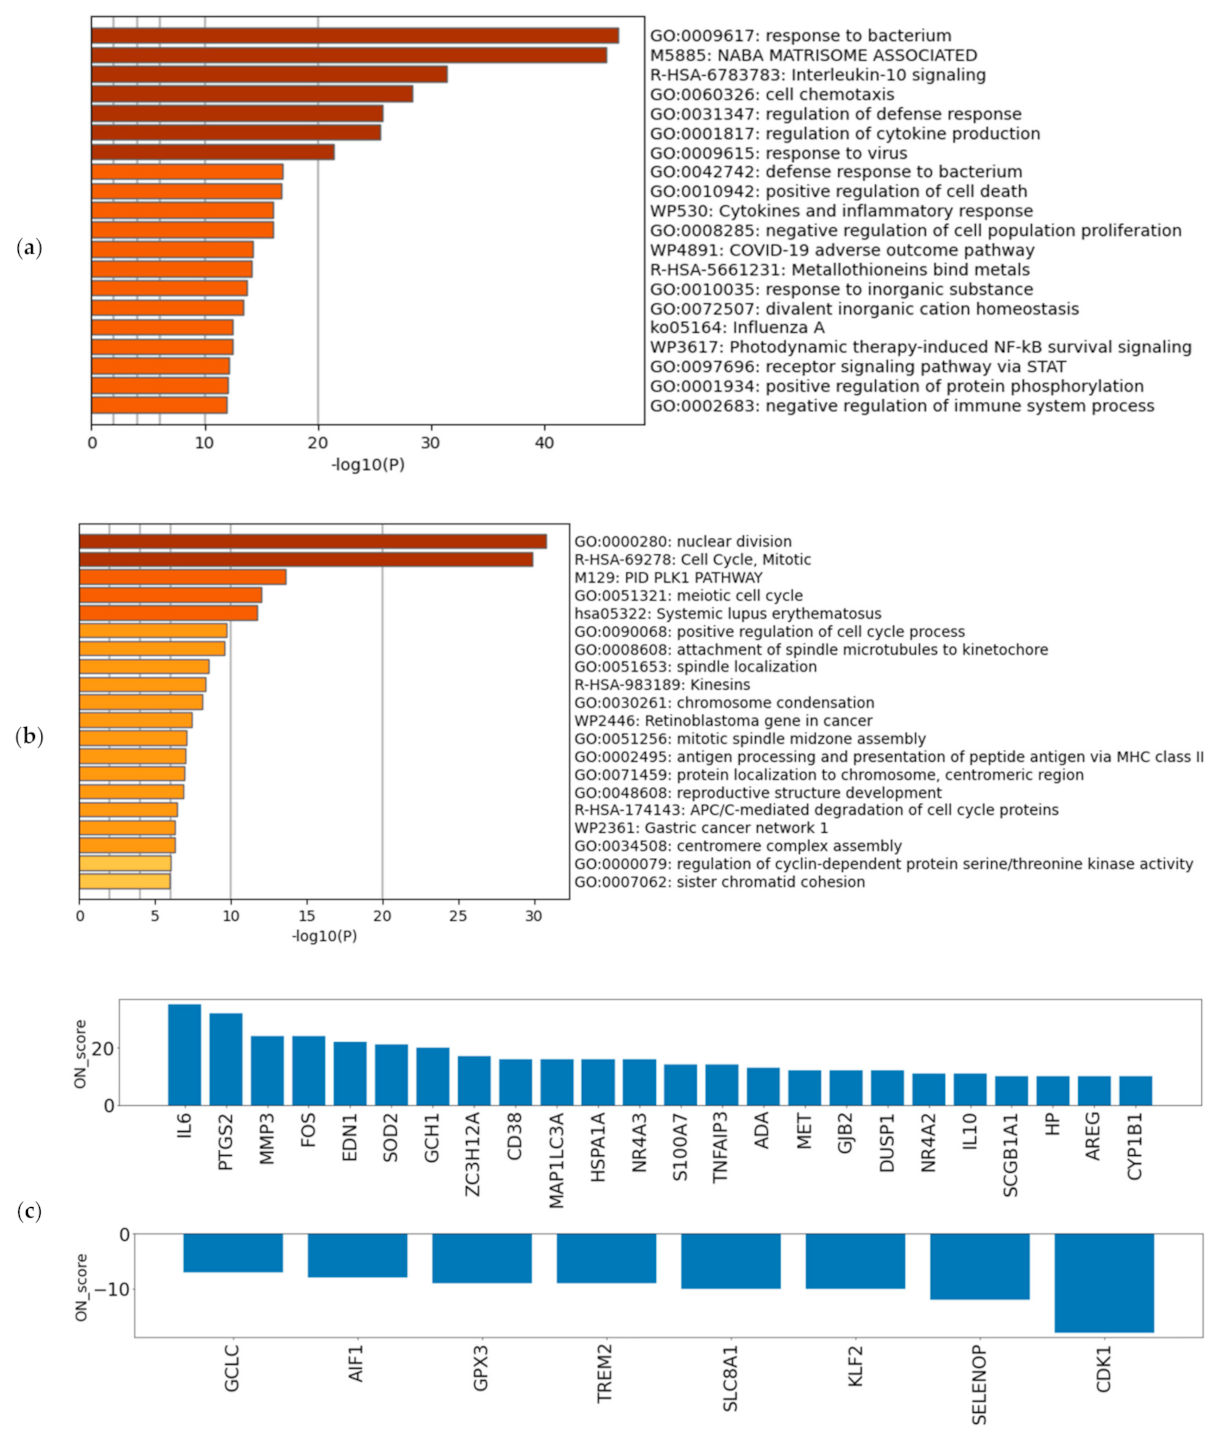
A schematic view of the analysis is shown in Figure 1. The most upregulated 493 genes and the most downregulated 492 genes, in a total of 985 genes (5% of the total coding genes in GENCODE Release 31 (GRCh38.p12)), were retrieved by ON_score 10 as DEGs. We performed gene set enrichment analysis using Metascape to visualize the characteristics of the DEGs. The analysis showed that the 493 most upregulated genes by OS were related to “GO:0009617: response to bacterium” and “M5885: NABA matrisome associated” (Figure 2a). The 492 most downregulated genes by OS were related to “GO:0000280 nuclear division” and “R-HAS-69278: Cell Cycle, Mitotic” (Figure 2b). We then found that 32 out of 985 genes were common to genes annotated with GO:0006979 (response to oxidative stress). The most upregulated genes common to GO annotation were IL6, PTGS2, and MMP3, and the most downregulated genes common to GO annotation were CDK1, SELENOP, and KLF2 (Figure 2c). The same procedure to verify the DEGs retrieved by ON_score 5 was also performed [23]. The use of ON_score 5 reveals a gene set that includes genes not as differentially expressed as ON_score 10. This shows the broader characteristics of the OS. We used ON_score 5 in the analysis of Section 3.4.
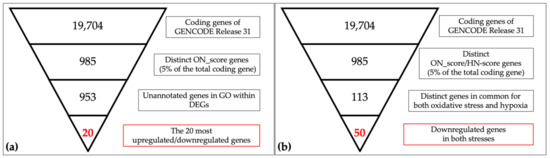
Figure 1.
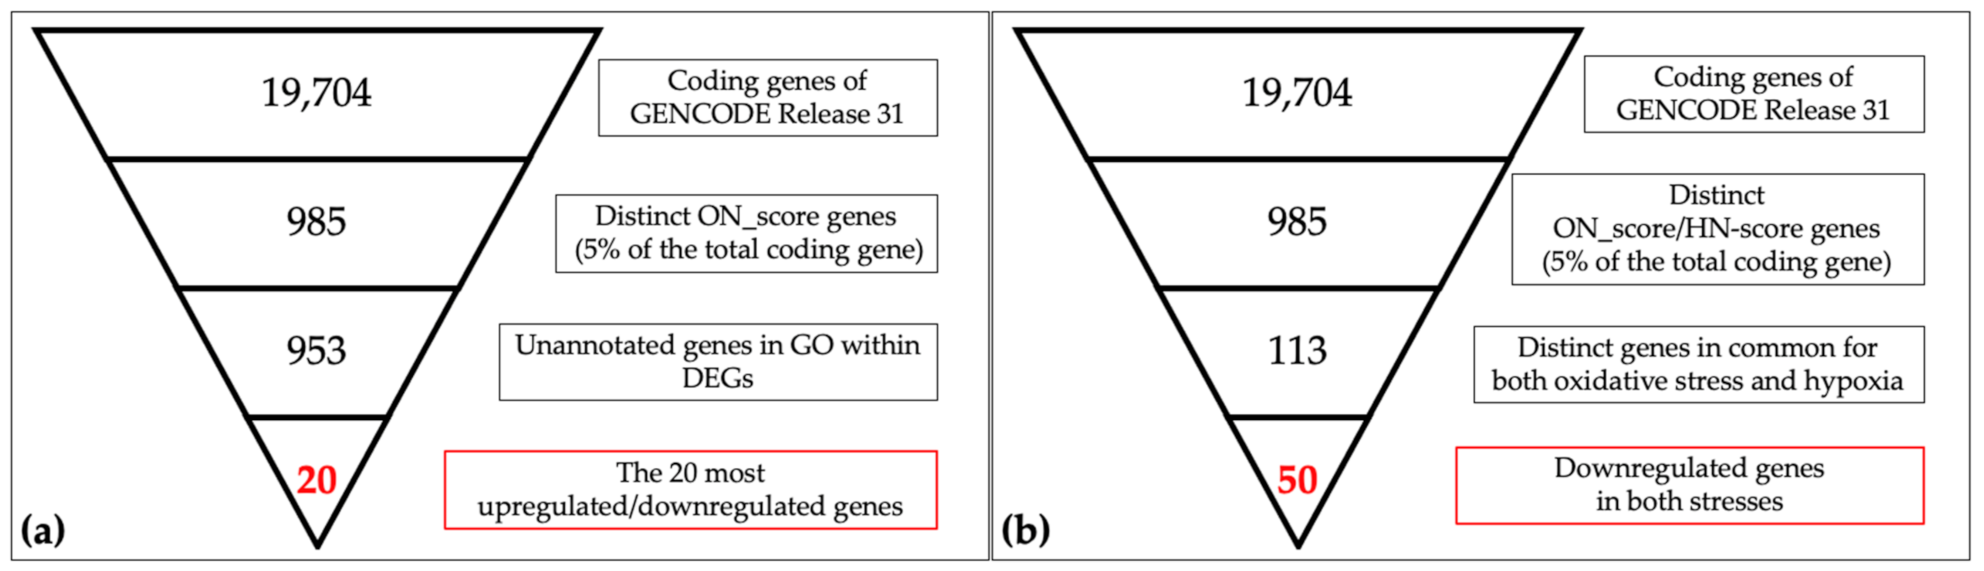
Schematic views of narrowing down the genes in oxidative/hypoxic transcriptome meta-analysis. (a) The 19,704 coding genes indexed for the reference genome were filtered by ON_score and by excluding Gene Ontology (GO) annotated genes to retrieve the 20 most differentially expressed genes (DEGs). (b) The number of genes downregulated in oxidative stress and hypoxia was then obtained as per the schematic in the figure.
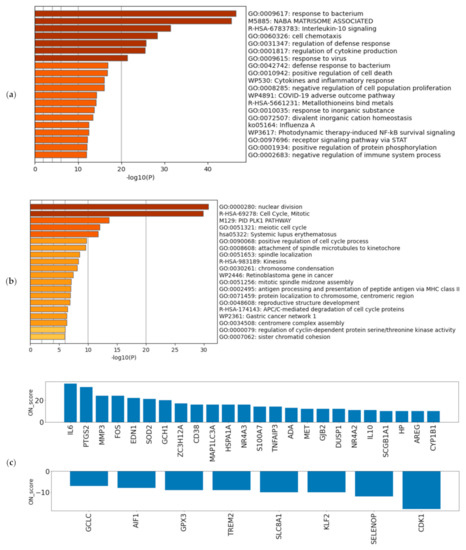
Figure 2.
Verifying the characteristics of differentially expressed genes (DEGs): Enrichment analysis for (a) the 493 most upregulated genes by oxidative stress (OS) and (b) the 492 most downregulated genes by OS. The darker the bar is colored, the more significant the p-value. (c) ON_score for 32 genes that were identified as DEGs and annotated as GO:0006979 (response to oxidative stress).
3.3. Evaluation of DEGs by Oxidative Stress
To evaluate the genes exceptionally expressed by OS, the parameter of ON_score 10 was applied to retrieve 985 DEGs. Thirty-two genes that were already annotated with GO:0006979 (response to oxidative stress) were excluded from the DEGs, thus revealing OS-related genes which had not yet attracted attention (Figure 1a). The most upregulated 10 genes and the most downregulated 10 genes were retrieved and analyzed (Figure 1a and Figure 3). Five out of the ten most downregulated genes (H2BC14, PIMREG, KIF20A, CDC20, and H2AC14) were related to the cell cycle. Two of them (H2BC14 and H2AC14) encode the core components of histones. In addition, two genes encoding zinc binding domains (CRIP1 and CRIP3) are included in the list of the ten most downregulated genes. In contrast, the three most upregulated genes were CCL20, CXCL8, and CXCL1, encoding C-C motif chemokine-20, interleukin-8, and growth-regulated alpha protein, respectively. Genes that respond to inflammation were included in the most upregulated genes.
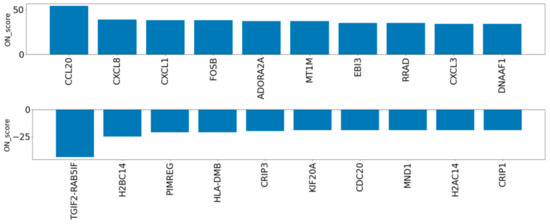
Figure 3.
ON_score for the ten most upregulated and downregulated genes after extraction of annotated genes with GO:0006979 (response to oxidative stress).
3.4. Comparison of the Meta-Analysis Results by OS and Hypoxia
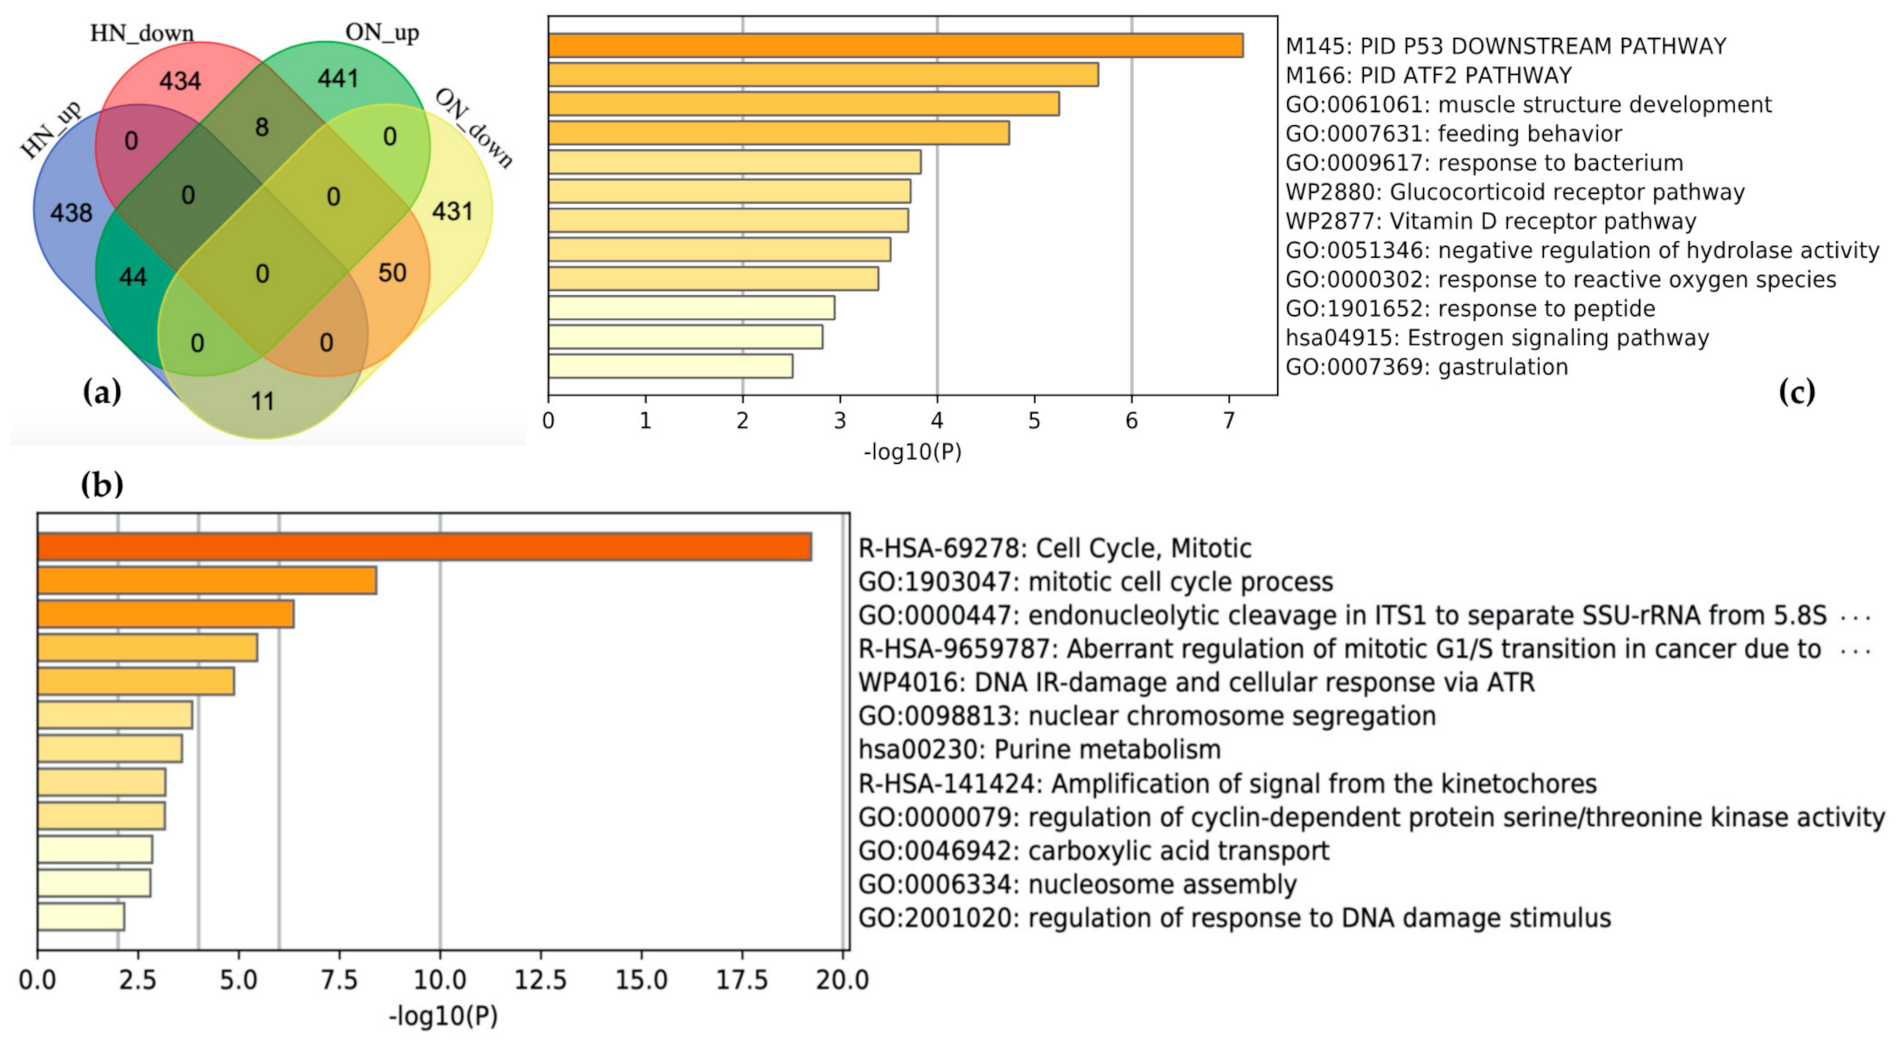
Schematic descriptions of the retrieval and analysis of the downregulated genes in both OS and hypoxia are shown in Figure 1b. We collected 985 DEGs of OS and hypoxia using the ON_score and HN-score. Each set of DEGs was divided into two gene sets: the 493 most upregulated genes and the 492 most downregulated genes. The four gene sets derived from the two types of stress conditions were compared using Venn diagrams to show the common differentially expressed genes (Figure 4a). We found that 44 genes were upregulated in both stress conditions (termed as HN_up ON_up), 50 genes were downregulated in both stress conditions (termed as HN_down ON_down), 11 genes were upregulated in hypoxia but downregulated in OS (termed as HN_up ON_down), and 8 genes were upregulated in OS but downregulated in hypoxia (termed as HN_down ON_up). The number of genes upregulated or downregulated in both stress conditions was greater than the number of genes upregulated or downregulated under either one of the stress conditions.

Figure 4.
Comparison of results from the meta-analysis in oxidative stress (OS) and hypoxia. (a) Visualization of comparison among gene sets. HN_up: the 493 most upregulated genes by hypoxia; HN_down: the 492 most downregulated genes by hypoxia; ON_up: the 493 most upregulated genes by OS; ON_down: the 492 most downregulated genes by OS. Enrichment analysis for (b) showed 50 genes downregulated in both stresses and (c) 44 genes upregulated in both stresses. The darker the bar is colored, the more significant the p-value.
The characteristics of each gene set in common were analyzed by performing gene set enrichment analysis using Metascape. “R-HAS-69278: Cell Cycle, Mitotic” and “GO:1903047: mitotic cell cycle process” are the most enriched terms with log10(p-value) of −19.21 and −18.93 for HN_down ON_down (Figure 4b). HN_up ON_up is related to the terms “M145: PID P53 Downstream pathway” and “M166: PID ATF2 pathway” (Figure 4c). HN_up ON_down and HN_down ON_up included 11 genes and 8 genes, respectively. A list of genes in each gene set is shown in Figshare [23].
4. Discussion
In this study, we curated the 386 pairs of OS-related RNA-seq data collected from public databases. The collected data were systematically processed and analyzed to identify the DEGs related to OS. Gene set enrichment analysis was performed to identify and confirm the characteristics of the DEGs. In addition, we implemented a new approach to analyze the relationship between the two types of stresses, OS and hypoxia, by comparing the results of both meta-analyses [10]. We compared the genes upregulated and downregulated by hypoxia and OS to obtain four new gene sets, HN_up ON_up, HN_down ON_down, HN_up ON_down, and HN_down ON_up. Each gene set was analyzed using gene set enrichment analysis.
Meta-analysis of the OS dataset revealed two interesting genes encoding cysteine-rich proteins (CRIP1 and CRIP3) that were the 10th and 5th most downregulated by OS, respectively. Each encoded protein contains zinc-binding domains, and the protein encoded by CRIP1 is considered to act as a zinc transporter and absorption agent [24,25]. Previous studies have reported several roles for zinc in antioxidant defense systems. For example, zinc inhibits the enzyme nicotinamide adenine dinucleotide phosphate oxidase (NADPH-Oxidase) and promotes the synthesis of metallothionein which contributes to the reduction in ROS [26]. Zinc is also known as a component of the enzyme superoxide dismutase (SOD) which acts to reduce and maintain ROS levels in cells [26]. On the other hand, excess zinc exhibits other toxicities leading to symptoms such as nausea, vomiting, fever, and headaches [27]. Therefore, zinc homeostasis is one of the key biological systems for preventing various types of stress. As the proteins encoded by CRIP1 and CRIP3 contain zinc-binding domains, we can assume that they participate in the regulation of zinc homeostasis. Based on this hypothesis and the results of this study, we suggest that the regulation of zinc homeostasis is impaired in OS due to decreased expression of CRIP1 and CRIP3. Since zinc deficiency is known to be a cause of OS [3,28], we speculate that the downregulation of CRIP1 and CRIP3 is affected by OS-induced pathways that contribute to the reduced availability of zinc in cells. Uncovering the functions of CRIP1 and CRIP3 could be a way to clarify some of the relationships between OS and zinc homeostasis, which may promote the development or the prevention of OS and zinc homeostasis-related diseases such as atherosclerosis [29], Parkinson’s disease [30], cancer, and hepatitis virus infection [31,32].
Comparing the meta-analysis results by two types of stresses, OS and hypoxia, revealed gene sets that were found to be differentially expressed in both stresses. Particularly the gene set downregulated in both stresses showed distinct characteristics with the cell cycle (Figure 4b). This result supports the previous biological findings that DNA damage induced by increased ROS levels causes cell cycle arrest or apoptosis [33,34]. In addition, an increase in ROS production in mitochondria is known to be a common event in both OS and hypoxia [35]; therefore, the downregulation of cell cycle-related genes was an expected result. Furthermore, a meta-analysis of the OS dataset revealed five cell cycle-related genes—H2BC14, PIMREG, KIF20A, CDC20, and H2AC14—that were, respectively, 2nd, 3rd, 6th, 7th, and 9th most downregulated by OS, supporting the above observation by showing that DEGs associated with OS are related to the cell cycle. As these ten OS-induced downregulated genes were not included in the genes common to hypoxia, further research is needed to clarify whether the expression of these genes is unique to OS or shared by types of stresses other than hypoxia.
The results of this study may play a role in elucidating the causative mechanisms and development of treatments for such diseases as atherosclerosis (OS- and zinc homeostasis-related), chronic kidney disease, and metabolic syndrome (both OS- and hypoxia-related) [36,37] through further studies on the functions of the important genes revealed here. Utilization of real-time reverse transcription polymerase chain reaction (RT-PCR) can be an effective way to confirm the results from the meta-analysis, to give an example of potential further studies [38]. As the quantity of public expression data increases, the more accurate and detailed information about genes that respond to OS can be obtained by updating the OS dataset in the future. We have also shown the possibility of revealing information about the relationships between the types of stresses by comparing the results from the meta-analysis. Thus, the use of collective intelligence, including the results of this study, which will continue to be produced in the future, makes it possible to efficiently promote studies on the search for key pathways, for causes of diseases, and treatments of diseases.
Author Contributions
Conceptualization, T.S., H.B.; methodology, T.S., Y.O., H.B.; software, T.S., Y.O., H.B.; validation, T.S., Y.O., H.B.; formal analysis, T.S., Y.O., H.B.; investigation, T.S.; resources, T.S., H.B.; data curation, T.S.; writing—original draft preparation, T.S.; writing—review and editing, Y.O., H.B.; visualization, T.S.; supervision, H.B.; project administration, H.B.; funding acquisition, H.B. All authors have read and agreed to the published version of the manuscript.
Funding
This research was supported by the Center of Innovation for Bio-Digital Transformation (BioDX), an open innovation platform for industry-academia co-creation (COI-NEXT), and the Japan Science and Technology Agency (JST, COI-NEXT, JPMJPF2010). This study was also supported by the ROIS-DS-JOINT (009RP2021).
Institutional Review Board Statement
Not applicable.
Informed Consent Statement
Not applicable.
Data Availability Statement
The data presented in this study are publicly available in Figshare [23].
Acknowledgments
Computations were performed on the computers at Hiroshima University Genome Editing Innovation Center.
Conflicts of Interest
The authors declare no conflict of interest. The funders had no role in the design of the study; in the collection, analyses, or interpretation of data; in the writing of the manuscript, or in the decision to publish the results.
References
- Sies, H.; Berndt, C.; Jones, D.P. Oxidative stress. Annu. Rev. Biochem. 2017, 86, 715–748. [Google Scholar] [CrossRef] [PubMed]
- Warraich, U.-E.-A.; Hussain, F.; Kayani, H.U.R. Aging—Oxidative stress, antioxidants and computational modeling. Heliyon 2020, 6, e04107. [Google Scholar] [CrossRef]
- Singh, A.; Kukreti, R.; Saso, L.; Kukreti, S. Oxidative stress: A key modulator in neurodegenerative diseases. Molecules 2019, 24, 1583. [Google Scholar] [CrossRef] [Green Version]
- Forman, H.J.; Zhang, H. Targeting oxidative stress in disease: Promise and limitations of antioxidant therapy. Nat. Rev. Drug Discov. 2021, 20, 689–709. [Google Scholar] [CrossRef]
- Li, S.; Hong, M.; Tan, H.-Y.; Wang, N.; Feng, Y. Insights into the role and interdependence of oxidative stress and inflammation in liver diseases. Oxid. Med. Cell. Longev. 2016, 2016, 4234061. [Google Scholar] [CrossRef]
- Cooke, M.S.; Evans, M.D.; Dizdaroglu, M.; Lunec, J. Oxidative DNA damage: Mechanisms, mutation, and disease. FASEB J. 2003, 17, 1195–1214. [Google Scholar] [CrossRef] [PubMed] [Green Version]
- Reuter, S.; Gupta, S.C.; Chaturvedi, M.M.; Aggarwal, B.B. Oxidative stress, inflammation, and cancer: How are they linked? Free Radic. Biol. Med. 2010, 49, 1603–1616. [Google Scholar] [CrossRef] [PubMed] [Green Version]
- Lushchak, V.I. Free radicals, reactive oxygen species, oxidative stress and its classification. Chem. Biol. Interact. 2014, 224, 164–175. [Google Scholar] [CrossRef]
- McGarry, T.; Biniecka, M.; Veale, D.J.; Fearon, U. Hypoxia, oxidative stress and inflammation. Free Radic. Biol. Med. 2018, 125, 15–24. [Google Scholar] [CrossRef] [PubMed]
- Ono, Y.; Bono, H. Multi-omic meta-analysis of transcriptomes and the bibliome uncovers novel hypoxia-inducible genes. Biomedicines 2021, 9, 582. [Google Scholar] [CrossRef]
- Bono, H. Meta-analysis of oxidative transcriptomes in insects. Antioxidants 2021, 10, 345. [Google Scholar] [CrossRef]
- Bono, H. All of Gene Expression (AOE): An integrated index for public gene expression databases. PLoS ONE 2020, 15, e0227076. [Google Scholar] [CrossRef] [Green Version]
- Barrett, T.; Wilhite, S.E.; Ledoux, P.; Evangelista, C.; Kim, I.F.; Tomashevsky, M.; Marshall, K.A.; Phillippy, K.H.; Sherman, P.M.; Holko, M.; et al. NCBI GEO: Archive for functional genomics data sets—Update. Nucleic Acids Res. 2013, 41, D991–D995. [Google Scholar] [CrossRef] [Green Version]
- Athar, A.; Füllgrabe, A.; George, N.; Iqbal, H.; Huerta, L.; Ali, A.; Snow, C.; Fonseca, N.A.; Petryszak, R.; Papatheodorou, I.; et al. Array express update–from bulk to single-cell expression data. Nucleic Acids Res. 2019, 47, D711–D715. [Google Scholar] [CrossRef]
- Kodama, Y.; Mashima, J.; Kosuge, T.; Ogasawara, O. DDBJ update: The Genomic Expression Archive (GEA) for functional genomics data. Nucleic Acids Res. 2019, 47, D69–D73. [Google Scholar] [CrossRef] [PubMed]
- Kodama, Y.; Shumway, M.; Leinonen, R. International nucleotide sequence database collaboration the sequence read archive: Explosive growth of sequencing data. Nucleic Acids Res. 2012, 40, D54–D56. [Google Scholar] [CrossRef] [Green Version]
- Yasumizu, Y. Ikra v2.0—RNAseq Pipeline Centered on Salmon. 2021. [Google Scholar] [CrossRef]
- The NCBI SRA (Sequence Read Archive); NCBI—National Center for Biotechnology Information/NLM/NIH: Bethesda, MD, USA, 2021.
- Babraham Bioinformatics—Trim Galore! Available online: https://www.bioinformatics.babraham.ac.uk/projects/trim_galore/ (accessed on 27 September 2021).
- Salmon Provides Fast and Bias-Aware Quantification of Transcript Expression|Nature Methods. Available online: https://www.nature.com/articles/nmeth.4197 (accessed on 27 September 2021).
- Zhou, Y.; Zhou, B.; Pache, L.; Chang, M.; Khodabakhshi, A.H.; Tanaseichuk, O.; Benner, C.; Chanda, S.K. Metascape provides a biologist-oriented resource for the analysis of systems-level datasets. Nat. Commun. 2019, 10, 1523. [Google Scholar] [CrossRef]
- Draw Venn Diagram. Available online: http://bioinformatics.psb.ugent.be/webtools/Venn/ (accessed on 27 September 2021).
- Suzuki, T. Meta-analysis of human oxidative transcriptomes from public databases. figshare. Collection. 2021. [Google Scholar] [CrossRef]
- Hempe, J.M.; Cousins, R.J. Cysteine-rich intestinal protein binds zinc during transmucosal zinc transport. Proc. Natl. Acad. Sci. USA 1991, 88, 9671–9674. [Google Scholar] [CrossRef] [PubMed] [Green Version]
- Liu, Y.; Li, W.; Luo, J.; Wu, Y.; Xu, Y.; Chen, T.; Zhang, W.; Fu, F. Cysteine-rich intestinal protein 1 served as an epithelial ovarian cancer marker via promoting wnt/β-catenin-mediated emt and tumour metastasis. Dis. Markers 2021, 2021, 3566749. [Google Scholar] [CrossRef] [PubMed]
- Marreiro, D.D.N.; Cruz, K.J.C.; Morais, J.B.S.; Beserra, J.B.; Severo, J.S.; De Oliveira, A.R.S. Zinc and oxidative stress: Current mechanisms. Antioxidants 2017, 6, 24. [Google Scholar] [CrossRef] [PubMed]
- Hara, T.; Takeda, T.-A.; Takagishi, T.; Fukue, K.; Kambe, T.; Fukada, T. Physiological roles of zinc transporters: Molecular and genetic importance in zinc homeostasis. J. Physiol. Sci. 2017, 67, 283–301. [Google Scholar] [CrossRef]
- Choi, S.; Liu, X.; Pan, Z. Zinc deficiency and cellular oxidative stress: Prognostic implications in cardiovascular diseases. Acta Pharmacol. Sin. 2018, 39, 1120–1132. [Google Scholar] [CrossRef] [PubMed] [Green Version]
- Gao, H.; Dai, W.; Zhao, L.; Min, J.; Wang, F. The role of zinc and zinc homeostasis in macrophage function. J. Immunol. Res. 2018, 2018, 6872621. [Google Scholar] [CrossRef] [PubMed]
- Du, K.; Liu, M.-Y.; Zhong, X.; Wei, M.-J. Decreased circulating zinc levels in parkinson’s disease: A meta-analysis study. Sci. Rep. 2017, 7, 3902. [Google Scholar] [CrossRef] [PubMed] [Green Version]
- Read, S.A.; Obeid, S.; Ahlenstiel, C.; Ahlenstiel, G. The role of zinc in antiviral immunity. Adv. Nutr. 2019, 10, 696–710. [Google Scholar] [CrossRef] [Green Version]
- Skrajnowska, D.; Bobrowska-Korczak, B. Role of zinc in immune system and anti-cancer defense mechanisms. Nutrients 2019, 11, 2273. [Google Scholar] [CrossRef] [Green Version]
- Shackelford, R.E.; Kaufmann, W.K.; Paules, R.S. Oxidative stress and cell cycle checkpoint function. Free Radic. Biol. Med. 2000, 28, 1387–1404. [Google Scholar] [CrossRef]
- Klein, J.A.; Ackerman, S.L. Oxidative stress, cell cycle, and neurodegeneration. J. Clin. Invest. 2003, 111, 785–793. [Google Scholar] [CrossRef] [PubMed] [Green Version]
- Fuhrmann, D.C.; Brüne, B. Mitochondrial composition and function under the control of hypoxia. Redox Biol. 2017, 12, 208–215. [Google Scholar] [CrossRef]
- Gerber, P.A.; Rutter, G.A. The role of oxidative stress and hypoxia in pancreatic beta-cell dysfunction in diabetes mellitus. Antioxid. Redox Signal. 2017, 26, 501–518. [Google Scholar] [CrossRef] [PubMed] [Green Version]
- Honda, T.; Hirakawa, Y.; Nangaku, M. The role of oxidative stress and hypoxia in renal disease. Kidney Res. Clin. Pract. 2019, 38, 414–426. [Google Scholar] [CrossRef] [PubMed] [Green Version]
- Yang, J.; Zhao, J.-J.; Zhu, Y.; Xiong, W.; Lin, J.-Y.; Ma, X. Identification of candidate cancer genes involved in human retinoblastoma by Data Mining. Childs Nerv. Syst. 2008, 24, 893–900. [Google Scholar] [CrossRef] [PubMed]

Publisher’s Note: MDPI stays neutral with regard to jurisdictional claims in published maps and institutional affiliations. |
© 2021 by the authors. Licensee MDPI, Basel, Switzerland. This article is an open access article distributed under the terms and conditions of the Creative Commons Attribution (CC BY) license (https://creativecommons.org/licenses/by/4.0/).