Abstract
In this study, we focused on the development of cooperation between partner countries, which may affect the reduction of inflationary risks for partnership participants in the context of global and urgent changes in the world. This article aims to identify the relationship between inflation indicators and various types of globalization (complex integration indices) of each of the member countries of the Shanghai Cooperation Organization (SCO) in order to develop measures to contain inflation risks in these countries. The authors used the methods of pairwise linear regression, correlation analysis, and multiple linear regression. As variables, the authors used complex indicators that characterize six types of globalization: Economic, financial, demographic, industrial, information, and political indices. The authors concluded that China and India more effectively curb inflation and are less prone to inflation risks. The inflation rate and the independent variables have a close negative correlation, which indicates a strong degree of mutual influence and has a downward effect on the consumer price index. The most significant variables that have a strong influence on the inflation rate are the factors of financial and information integration. The impact of other types of integration considered in this study is not significant. In order to reduce the level of inflationary risks, the SCO member countries most vulnerable to the price volatility of raw materials (Uzbekistan, Tajikistan, and Kyrgyzstan) are encouraged to develop trade cooperation more actively, for example, by reducing or eliminating import duties on raw materials from the SCO countries.
1. Introduction
Inflation rates, which have synchronously increased in different countries, especially over the past 2 years, have a significant impact on the structure of the world’s economy and the level of social well-being of the population. Supply and demand factors tend to be the main drivers of inflation (He and Wang 2022). Inflation is a multifactorial phenomenon, and against the background of the growing internationalization of commodity and financial markets, the impact of global factors, including integration factors, on inflation is of particular relevance. If the impact of supply and demand factors on the level of inflation is widely studied and documented in the scientific literature, the issues of the influence of global factors have not been studied enough and are of increased research interest.
To comprehend the research problem, first of all, we need to clarify that globalization represents the degree of integration of national economies, cultures, and political relations into a single geo-economic system with common information (Dokholyan et al. 2022), trade, and financial environments (Lochan et al. 2021). Economically globalized countries are those with low import tariffs and non-tariff barriers, a large number of free trade agreements (Svirin et al. 2021), and regulations that enable foreign investment (Voskovskaya et al. 2022).
For many decades, globalization, open trade, and the internationalization of commodity, service, and financial markets of developed economies allowed them to successfully contain inflation (Chen 2022). Due to the transfer of production from Europe, North America, and Japan to countries with low wages (for example, China, Vietnam, and Indonesia) using resources from third countries, prices for many consumer goods were kept at a fairly low level (Karashchuk et al. 2019; Lochan et al. 2021).
Factors such as deglobalization, rising protectionism, autarky, and the duplication of supply chains give an additional inflation impetus and can cause a strong negative shock to the global economy (Chupanova et al. 2021; Ramazanov et al. 2021).
Under these conditions, scholars have focused on finding new drivers of economic growth and mitigating inflation risks. Over the past two years, a situation has developed in which many members of the largest trans-regional organization in the world, the Shanghai Cooperation Organization (SCO), have found themselves in a zone of increased inflation.
Currently, eight states are SCO members: India, Kazakhstan, China, Kyrgyzstan, Russia, Tajikistan, Pakistan, and Uzbekistan. The SCO is a powerful organization with significant resources and the potential for intensifying trade and economic cooperation between its member countries. The association of partner countries initially focused on increasing the level of military security in the Asian region but now the goal of the organization is to fight terrorism, separatism, extremism, and drug trafficking, as well as the development of economic cooperation, energy partnership, and scientific and cultural interaction (Zhang et al. 2022; Shkvarya and Wang 2021).
According to the UN Population Division, in 2021, 41.4% of the world’s population lives in the SCO countries (Statistical Data Population, total n.d.), which makes the region the largest importer and exporter of consumer goods, as well as a large labor market. The SCO region contains 27.3% of the world’s natural gas reserves, 9.1% of the world’s oil reserves (Annual Statistical Bulletin 2022), 22.5% of the world’s agricultural land (FAO 2021c), and 27.6% of the world’s forest resources (FAO 2021b). Significant reserves of natural and energy resources allow SCO countries to actively develop the real sector of the economy and agriculture, opening up prospects for the implementation of joint projects in trade, financial, technological, and other areas (Sun et al. 2021).
Optimizing regional trade links with these countries and strengthening regional trade integration could help the Central Asian economies cope with the challenges of reducing global inflation pressures and sustaining trade growth (Sadovnikova et al. 2021).
2. Literature Review
Currently, there is a wide range of scientific works studying inflation as a global phenomenon (Kabukçuoğlu and Martinez-Garcia 2018; Parker 2018).
The relevant scientific literature considers the impact of various (economic, social, and informational) factors on inflation indicators.
A significant part of theoretical and empirical research is concerned with the relationship between inflation processes and economic growth indicators whose results are quite contradictory (Tsenina et al. 2022; Zhilenko et al. 2021). However, indicators of economic development such as GDP and industrial productivity act as the main variables.
One of the most controversial issues is the type of relationship between inflation and these factors of economic growth: Positive, negative, or neither (Kosorukova et al. 2021).
For example, earlier works reflected a positive relationship and concluded that inflation stimulated economic growth (Behera 2014; Behera and Mishra 2015; Kryeziu and Durguti 2019; Mallik and Chowdhury 2001; Osuala et al. 2013; Paudyal 2011).
Another group of studies found a negative and statistically significant relationship between economic performance and inflation, indicating a restrictive and negative effect of inflation on economic and industrial growth (Bans-Akutey et al. 2016; Barro 2013; Oduor et al. 2021).
Yet another group of scholars recognize a non-linear relationship between economic growth and inflation but determine the threshold level of inflation (Hasanov 2011; Tien 2021; Wollie 2018). The results of these studies prove the hypothesis that GDP growth is negatively affected by both hyperinflation above the threshold and too-low inflation below the threshold.
The ambiguity of scientific results suggests that inflation has an impact on economic growth, not directly but through indirect influence through other parameters, such as the structure and level of the money supply, the exchange rate, the deficit of the budget system, etc. Some empirical studies show that inflation growth is also affected by the real exchange rate and conclude that when the real effective exchange rate is adjusted with the nominal effective exchange rate, inflation decreases, and when they both move in different directions, inflation increases.
A significant number of studies have been devoted to the relationship between inflation and global commodity prices (Choi et al. 2018; Ciner 2011; Lapinskaitė and Miečinskienė 2020; Saleuddin and Coffman 2018; Sekine and Tsuruga 2018; Zakaria et al. 2021). K.L. Kliesen’s findings show that commodity prices, which have a relatively high energy component, are more correlated with headline inflation than commodity price indices, a fortune that is mostly made of metals (Kliesen 2021) or agricultural commodities (Krasnovskiy et al. 2022).
The financial aspects of inflation processes are considered in the context of monetary policy and inflation targeting (Chugunov et al. 2021; Ojo and Dierker 2021; Samarina and de Haan 2014; Vedala and Vedala 2018).
Thus, the soft monetary policy of some states (above all, the United States) has become one of the reasons for the growth in consumer prices around the world. The ongoing policy of zero rates and unprecedented anti-crisis measures related to the pandemic, combined with the growth of public debt, led to a massive emission of money and a significant increase in global inflation.
A limited part of scientific literature considers the relationship between inflation and imports of goods and services. The empirical results achieved by Muktadir-Al-Mukit et al. (2013), Kiganda and Omondi (2020), and Taylor and Barbosa-Filho (2021) show a stable, positive, and significant relationship between inflation and imports.
Some authors have also concluded that in addition to economic, trade, and financial factors, the labor market and the influence of social factors such as unemployment, income inequality, migration, etc., play a significant role in inflationary phenomena (Attiya Mohammed Omran and Bilan 2021; Law and Soon 2020; Selvanayagama and Mustafa 2019).
Convincing evidence in favor of a long-term positive relationship between inflation and demographic indicators is presented in the works of Bobeyca et al. (2017), Juselius and Takáts (2018), Bullard et al. (2012), Summers (2014), and Anderson et al. (2014). They argue that shifts towards population aging lead to lower inflation.
Some empirical literature, examining the potential link between inflation and social inequality, concludes that countries with more unequal distribution of income have higher inflation (Monnin 2014), and rising inflation causes an increase in the number of people with low incomes and, as a result, worsens the quality of life (Adams and Levell 2014; Monnin 2014; Suhendra et al. 2020).
At the same time, a number of recent studies show the opposite results. According to Siami-Namini and Hudson (2019), reducing inflation to the target does not always help to mitigate inequality but, according to Kartaev et al. (2020), exacerbates it. Siami-Namini and Hudson (2019) found a non-linear relationship between inflation and income inequality, implying that, as inflation rises, income inequality decreases. Then, income inequality reaches a minimum and starts to rise again.
The impact of an important variable such as unemployment on inflation is often used and is quite controversial in theoretical studies. Many authors using the Phillips curve reveal an inverse relationship between inflation and unemployment but note that this correlation is valid only in the short term (Mustafa 2021; Pratinidhi and Verma 2020). However, the relationship between inflation and unemployment broke down during certain periods of stagflation (the 1970s and 1990s) when unemployment inflation rates were high. A limited number of empirical studies examine the nature and strength of the relationship between inflation and the level of informational globalization. A number of studies have revealed that increasing the digitalization of the economy (measured by various indicators) reduces the annual inflation rate (Csonto et al. 2019; Lorenzani and Varga 2014; Yi and Choi 2005).
The study of the impact of globalization on inflation processes deserves special attention. Thus, several empirical studies have confirmed the existence of a relationship between globalization and inflation (Bianchi and Civelli 2015; Chang and Tsai 2015; Zhang 2017). However, other research shows that globalization has had little effect on inflation in the developed world, a claim that is further supported (Ihrig et al. 2007).
The scientific results indicate the growing role of global factors in changing inflation rates (Ali et al. 2019; Feldkircher and Tondl 2020; Mumtaz and Surico 2012; Shin and Kang 2021). Ciccarelli and Mojon (2010) argue that the inclusion of global factors in models significantly improves inflation forecasting.
Having studied the relevant scientific literature on this topic, we have concluded that the main part of the work studies the relationship between inflation and economic, financial, and trade factors of integration. At the same time, indicators such as the value of GDP, the exchange rate, the key bank rate, world prices for raw materials, and the volume of imports of goods and services are widely used as variables. There are practically no works that consider factors such as the level of gold and foreign exchange reserves and the country’s existing obligations.
A limited number of scientific works (Rehman et al. 2022; Koohi Lai et al. 2020) study the impact of social factors on inflation, using variables such as unemployment, income inequality, and shifts in the age structure of the population. The influence of a social factor such as international migration is rarely included in research models.
There are very few works concerned with the study of the relationship between inflation and the level of information integration in the country (Kozhamzharova et al. 2022). Authors mainly use variables that, in our opinion, do not adequately reflect the essence of integration, for example, the number of international patents, freedom of the press, etc. However, the influence of important factors of information integration such as the number of Internet users and social networks and the average speed of Internet connections is misunderstood.
These authors neglect the relationship between inflation and the level of political globalization of a particular country. The current development of the global economy indicates the importance of considering factors that reflect the country’s potential for international influence and the ability to influence the external environment to change the level of global inflation.
There are few works (Pham and Sala 2022) that use an integrated approach to consider the impact of a set of indicators united by integration directions on the level of inflation, which will allow one to determine the most important factors and build a model for predicting the level of inflation in individual countries within some integration association.
This paper poses several research questions:
- Is there a dependence of inflation indicators on the level of integration of the SCO member states into the globalization process?
- What is the relationship between inflation rates and integration factors in each of the SCO member states?
- How can cooperation between the SCO member states affect the reduction of inflationary risks?
As a research hypothesis, the statement is accepted that integration has a disinflationary effect but not all integration factors are significant for curbing inflation.
3. Methods
We conducted this study in January 2022. In our study, we used a mixed approach based on qualitative and quantitative methods of collecting and analyzing information.
The main qualitative method of collecting information was the analysis of the indicators of the SCO countries for 2021. The indicators in the form of documents, reports, and statistics were published on the official websites of the SCO countries. Quantitative methods (paired linear regression method, correlation analysis, and the multiple linear regression method) were used to study the relationship between the inflation rate and the types of globalization (complex integration indices) of the participating countries in the process of globalization. The choice of these methods of analysis is due to the fact that they make it possible to test the research hypothesis of this study and identify the relationship between inflation rates and integration factors in each of the SCO member countries.
3.1. Collection and Grouping of Received Data
First, we collected the data necessary for the calculation of individual integration indices. Primary sources were statistical databases of international organizations, including the WTO, IMF, UNIDO, FAO, World Bank, DIGITAL 2022: Global Report, EmbassyPages.com, and the UN Official Document System.
Next, the level of inflation risk was assessed for each of the SCO member states.
To assess the level of inflation risk, a scale was used, according to which the risk is defined as the level of deviation from the inflation thresholds adopted at the legislative level in each country (Garcia and Werner 2010):
- The actual inflation is lower than the threshold rate and there is a risk of deflation.
- The actual value of inflation is within the established threshold values and there are no risks of deflation and inflation risks.
- The actual value of inflation exceeds the maximum threshold rate by no more than 5 p.p. and the inflation risk is acceptable.
- The actual value of inflation exceeds the maximum threshold rate by more than 5 p.p. and there is a high inflation risk.
Based on the grouping presented in the KOF Globalization Index, six areas of globalization were identified (Table 1). The tools we chose, in our opinion, are the most objective. However, some components used in the calculation of the combined KOF indicator raise doubts among researchers in terms of their objectivity and significance in assessing the level of globalization.

Table 1.
Indicators of the country’s globalization.
The collected statistical data were processed by normalizing heterovarious variables. The study determined the methodology and generalization of the logic for calculating the globalization indices KOF, CSGR, and A.T. The Kearney/Foreign Policy Globalization Index shows that normalization is one of the necessary methodological steps. Of the most common normalization methods, such as Z-, scaling, minimum and maximum normalization, and decimal scaling, we chose the MinMax method, which allows us to reduce data to a simpler form for cross-country comparisons and the calculation of integration indices with relatively low labor intensity of analytical work.
These indicators were brought to a comparable form according to the following formulas:
where Vi is an indicator value for a specific country.
Х = (Vi − Vmin)/(Vmax − Vmin)
X = (Vmax − Vi )/(Vmax − Vmin)
- Vmax is the highest value among countries in the world.
- Vmin is the lowest value among countries in the world.
Formula (1) was used to normalize indicators whose high values reflect a high degree of globalization.
Formula (2) was used to normalize indicators whose low values reflect a high degree of globalization in a country. The fifth stage of the study included the calculation of integration indices for individual areas and composite indices of the integration of individual countries.
3.2. Calculation of Integration Indices
The indices of the country’s integration into a certain geo-economic sphere were calculated by the following formula:
where X1, X2, and X3 are normalized values of indicators characterizing the degree of globalization and N is the number of variables.
It = (X1 + X2 + X3….n)/N
The composite country integration index is calculated as a weighted average of the sub-indices for each direction of integration processes (trade, industrial, financial, informational, demographic, and political).
Since the identified integration sub-indices are related and have the same importance, the same integration sub-index weights are used to calculate the overall index.
where Ig is the composite index of globalization of the country.
Ig = 0.167*Ie + 0.167*If + 0.167*Id + 0.167*Iv + 0.167*Ii + 0.167*Ip
- Ie is the economic globalization index of the country.
- If is the financial globalization index of the country.
- Id is the demographic integration index of the country.
- Iv is the industrial integration index of the country.
- Ii is the information integration index of the country.
- Ip is the political integration index of the country.
- n is the number of sub-indices.
3.3. Method of Statistical Analysis
To determine the presence of a relationship between the inflation rate and the country’s composite integration index, a linear pair regression with a scatter plot was chosen.
By means of correlation analysis in the EXCEL environment, we identified the influence of individual factors on the level of inflation within each of the considered complex indices of the country’s integration.
Since correlation analysis relies only on spatial data, in order to objectively assess the strength (tightness) of the influence of integration factors on inflation indicators, we considered it necessary to conduct an in-depth panel study based on the analysis of both spatial and temporal indicators using the GRETL software tool.
The model was built based on the least-squares method. The dependent variable (Y) is the level of inflation in countries with high inflation risks. The variables are indices of the country’s integration into a certain area of the globalization process.
The panel of initial data included eight countries with a time series length of 5 years, thus the sample size was 40 observations for six integration sub-indices.
Testing the normality of the residuals of the linear regression model was carried out based on the chi-square test, which is determined by the formula (Singhal and Rana 2015):
where i is the line number (from 1 to r).
- J is the column number (from 1 to с).
- Oij is the actual number of observations in cell ij.
- Eij is the expected number of observations in cell ij.
The main condition for the applicability of the chi-square test is a sufficiently large sample size, and in our case, the sample is small (N = 40). Therefore, to test the normality, we additionally used the Doornik–Hansen, Lilliefors, Shapiro–Wilk, and Jarque–Bera (Ghasemi and Zahediasl 2012; Mishra et al. 2019) tests. If these criteria exceed the accepted significance level (0.05), then the regression residuals have a normal distribution.
The adequacy of the model was tested using Fisher’s F-criterion. If Fcrit < Fobs, then the model is recognized as adequate (Banek et al. 2009).
When checking the significance of the obtained regression coefficients for each of them, a hypothesis was put forward: H0—the coefficient is not significantly different from zero and X does not affect Y; H1—the coefficient is significantly different from zero and X affects Y.
To confirm or refute the null hypothesis, which states that the integration indices are insignificant and do not affect the level of inflation, the statistics of Student’s distribution with a degree of freedom tcr = 33 (40−6−1) and a significance level of 0.05 were used.
The following statistics were used to test the null hypothesis H0:
which, if H0 is true, has Student’s distribution with v = n − k − 1 degrees of freedom. Further, |ttable| was compared with tcr(α). When diagnosing the multicollinearity of the model, the method of inflation factors was used, the essence of which is to analyze the VIF indicator according to the formula: VIF(j) = 1/(1 − R(j)^2), where R(j) is the coefficient of multiple correlations between variable j and other independent variables. The minimum possible VIF value = 1.0 VIF values > 10.0 may indicate the presence of multicollinearity.
4. Results
4.1. Results of Inflation Risk Assessment
In 2021, the inflation rate in SCO member states moved in line with the global trend and increased in all the countries. According to the IMF, the average annual inflation accelerated to the greatest extent in developed economies (from 0.7% in 2020 to 3.1% in 2021) and developing countries (from 5.0% to 5.7%) (International Monetary Fund 2022).
Among the SCO member countries, the highest level of inflation is in Kyrgyzstan (11.9%) and Uzbekistan (10.7%). In these countries, there is a significant excess of target indicators by 6.9 p.p. and 5.7 p.p., respectively. Inflation rates for the SCO countries are presented in Table 2.
Table 2.
Inflation rates in the SCO member countries in 2021.
For Russia, Tajikistan, Pakistan, and Kazakhstan, inflation risks did not become critical and were within acceptable limits since inflation was successfully contained by the governments of these countries.
The governments of India and China also managed to keep inflation low. Moreover, the inflation rate in China amounted to 0.9% at the end of 2021, which is below the minimum value and might indicate deflation risks and a deterioration in the economic conditions for entrepreneurship.
4.2. Results of Evaluation of Integration Indices
Then we assessed the degree of globalization of the SCO member countries. The initial data for analysis are presented in Table 3.
Table 3.
The initial data for assessing the level of globalization of the SCO members.
Based on the collected statistical data (Table 3), normalized values were calculated for each direction of integration process (Table 4).
Table 4.
The results of normalized indicators.
Based on the data obtained, a composite integration index for the SCO countries was calculated (Table 5).
Table 5.
Calculation of the composite integration index for the SCO countries.
The results of the study show that countries that are the least integrated into the processes of globalization, such as Kyrgyzstan and Uzbekistan, demonstrate the highest levels of inflation and are in the zone of high inflation risks. At the same time, China, which is the most deeply integrated into the world’s economic system, in contrast, has the lowest inflation rates, the level of which is close to deflation.
4.3. Results of Assessing the Presence and Nature of the Relationship between Inflation and the Level of Integration
The dependence of inflation indicators and the level of integration of the country in the world’s economy are shown in Figure 1.
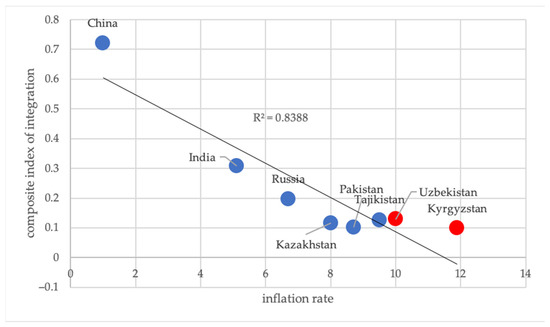
Figure 1.
Dependence of inflation and the level of integration of countries into the world system.
Thus, we can talk about the existence of a relationship between the level of inflation and the level of integration of SCO countries into the world space. Conducting a correlation analysis allowed us to assess the nature of the influence of factors of individual sub-indices on inflation (Table 6, Table 7, Table 8, Table 9, Table 10, Table 11, Table 12, Table 13 and Table 14).
Table 6.
Results of correlation analysis of inflation and trade integration factors.
Table 7.
Results of correlation analysis of inflation and financial integration factors.
Table 8.
Results of correlation analysis of inflation and industrial integration factors.
Table 9.
Results of correlation analysis of inflation and factors of demographic integration.
Table 10.
Results of correlation analysis of inflation and factors of information integration.
Table 11.
Results of correlation analysis of inflation and factors of political integration.
The results of the study show that the vast majority of the factors under consideration have an inverse correlation with the inflation rate. This means that they have a downward effect on inflation, which means that the growth of integration of countries into the process of globalization contributes to a decrease in inflation rates. A positive correlation with the inflation rate is observed only with factors such as the number of sanitary measures in foreign trade and the growth of the money supply. The growth of these indicators leads to an increase in inflation indicators.
4.4. The Results of the Analysis of the Strength (Density) of the Influence of the Level of Integration on Inflation
Based on the original panel, an OLS regression model was built, the statistical characteristics of which are presented in Table 12.
Table 12.
Statistical characteristic of model 1.
Table 12.
Statistical characteristic of model 1.
| Coefficient | St. Error | t-Statistic | p-Value | ||
|---|---|---|---|---|---|
| const | 9.52421 | 2.39014 | 3.985 | 0.0004 | *** |
| D1 | 1.10138 | 6.07060 | 0.1814 | 0.8571 | |
| D2 | −29.7834 | 8.25486 | −3.608 | 0.0010 | *** |
| D3 | 3.85862 | 6.90234 | 0.5590 | 0.5799 | |
| D4 | −2.80276 | 3.96285 | −0.7073 | 0.4844 | |
| D5 | 9.01607 | 7.15487 | 1.260 | 0.2165 | |
| D6 | −2.98335 | 8.01247 | −0.3723 | 0.7120 | |
| Average dependent variable | 6.321750 | St. deviation of dependent variable | 3.783381 | ||
| Sum of sq. residuals | 184.3893 | Model st. error | 2.363801 | ||
| R-square | 0.669698 | Correct. R-square | 0.609643 | ||
| F(6, 33) | 11.15143 | Р-value (F) | 8.86 × 10⁻⁷ | ||
| Log. plausibility | −87.32094 | Akaike criterion | 188.6419 | ||
| Schwarz criterion | 200.4640 | Hannan–Quinn criterion | 192.9164 | ||
| rho parameter | 0.547840 | Durbin–Watson statistic | 0.899456 | ||
Based on the data obtained, the regression equation is as follows:
9.524 + 1.101X1 − 29.783X2 + 3.859X3 − 2.803*X4 + 9.016*X5 − 2.983*X6
To test the significance of the model and its coefficients, we tested the normal distribution of the residuals. Normality testing of model residuals is graphically represented on a histogram of regression residuals and frequency distributions (Figure 2).
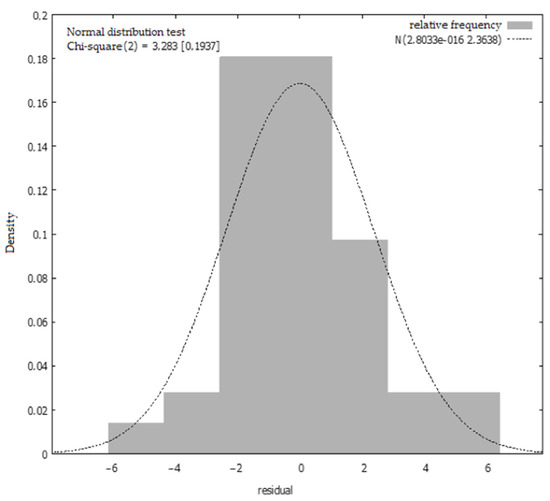
Figure 2.
Histogram of regression residuals and frequency distributions.
Frequency distribution statistics for the resulting model are presented in Table 13.
Table 13.
Model frequency distribution statistics.
Table 13.
Model frequency distribution statistics.
| number of columns = 7, mean = 2.80331 × 10⁻¹⁶, std. deviation = 2.3638 | |||||
| Interval | Midpoint | Frequency | Rel. | Int. | |
| <4.3620 | −5.2609 | 1 | 2.50% | 2.50% | |
| −4.3620 | −2.5641 | −3.4631 | 2 | 5.00% | 7.50% |
| −2.5641 | −0.76626 | −1.6652 | 13 | 32.50% | 40.00% |
| −0.76626 | 1.0316 | 0.13267 | 13 | 32.50% | 72.50% |
| 1.0316 | 2.8295 | 1.9305 | 7 | 17.50% | 90.00% |
| 2.8295 | 4.6273 | 3.7284 | 2 | 5.00% | 95.00% |
| ≥4.6273 | 5.5263 | 2 | 5.00% | 100.00% | |
| Null hypothesis—normal distribution: | |||||
| Chi-square (2) = 3.283, p-value 0.19372 | |||||
Thus, the observed value of the chi-square statistic was 3.283, and the probability that such a value was obtained by chance, if the hypothesis H0 is true, is 0.19372. If we accept the significance level α = 0.05 then we must accept H0 about the normal distribution of the regression residuals, since the p= value of 0.19372 is greater than 0.05.
The results of additional tests of normality of distribution are as follows:
Doornik–Hansen test = 3.28273, p-value 0.193716.
Shapiro–Wilk test (Shapiro–Wilk W) = 0.964552, p-value 0.238893.
Lilliefors test = 0.0977886, p-value ~ = 0.43.
Jarque–Bera test = 1.82575, p-value 0.401369.
4.5. Model Adequacy Test Results
Based on the resulting model, the observed value of the F statistic was 11.151.
To assess the adequacy of the model, we calculated the critical value F, for which two degrees of freedom are given:
Degree of freedom 1: v1 = k = 6.
Degree of freedom 2: v2 = 40−6−1 = 33.
Significance level: 0.05.
Critical values Fcr (6;3) = 2.389 < Fob. = 11.151 Thus, with an error probability of 5%, H0 is rejected and the model is recognized as adequate for the sample data.
4.6. Significance Test Results for Multiple Regression Coefficients
Checking the significance of the regression coefficients showed that H0 can be rejected since there is a coefficient (X2) that exceeds the critical value of Student’s distribution (2.035) (Table 14, compiled based on Table 12 data for a visual comparison of t-statistics for variables with the critical value of Student’s t-distribution).
Table 14.
Checking the significance of regression coefficients.
Table 14.
Checking the significance of regression coefficients.
| Independent Variables | t-Statistic | Critical Student’s Value |
|---|---|---|
| X1 | 0.1814 | 2.03452 |
| X2 | −3.608 | |
| X3 | 0.5590 | |
| X4 | −0.7073 | |
| X5 | 1.260 | |
| X6 | −0.3723 |
Thus, the model we obtained turned out to be significant, but out of six complex integration indices, only one was significant—X2 “Financial Integration”. One of the possible reasons may be the multicollinearity of the model, i.e., the presence of a close relationship between the independent variables. Therefore, we decided to test the model for multicollinearity, the results of which are presented in Table 15.
Table 15.
Results of checking model 1 for multicollinearity.
According to the obtained data, four out of six values of VIF > 10, which indicates the presence of clear signs of multicollinearity in the model. Thus, the problem associated with the insignificant significance of the coefficients in the resulting model is a consequence of its multicollinearity. The elimination of the multicollinearity of the linear model was carried out by the sequential elimination of insignificant variables. As a result, another OLS regression model with two variables was obtained (Table 16).
Table 16.
Regression model 2 statistics.
As can be seen from the table, after the elimination of redundant variables, the adjusted coefficient of determination (corrected R2) increased, and the values of the information criteria of Schwartz, Akaike, and Hennan–Quinn are lower than those presented in our basic model. The test confirmed the normal nature of the distribution of the regression residuals of the model (Table 17).
Table 17.
Frequency allocation for model 2.
The normal distribution is confirmed by tests whose p-values are greater than 0.05:
Doornik–Hansen test = 3.93726, p-value 0.139648.
Shapiro–Wilk W test = 0.959101, p-value 0.156044.
Lilliefors test = 0.112186, p-value ~ = 0.23..
Jarque–Bera test = 2.70583, p-value 0.258486.
The obtained results of the critical value of the Fisher distribution Fcr = 4.08237 are significantly lower than the observed Fob. =35.89221, which confirms the adequacy of the obtained model for the sample data.
The observed value of Student’s distribution (t-statistic) for the selected variables was 2.026, which is higher than the calculated critical value tcr:
tcr = 2.026 < |−5.979| \
tcr = 2.026 < 2.220
This indicates the significance of the chosen regression coefficients X2 and X5.
Thus, the resulting linear two-factor regression model took the form:
Y = 9.26724 − 27.1553X2 + 8.33192*X5
With an increase of 0.01 units in the financial integration index, with the country’s information integration index unchanged, inflation will decrease by 9.26 p.p. With an increase in the country’s information integration index of 0.01 units, while maintaining the existing financial integration index, the inflation rate will increase by 8.22 percentage points.
5. Discussion and Conclusions
5.1. Comparison of the Obtained Results with Earlier Studies
The factors influencing inflation dynamics are becoming increasingly global (Attinasi and Bolatti 2021). Our study shows that there is a stable relationship between inflation and the level of a country’s integration into globalization processes. The results show that countries with a high level of integration, such as China and India, have lower inflation rates.
The results of our study cast doubt on the claim that globalization can affect inflation in a more fundamental way (Forbes 2019). The null hypothesis of our study, regarding the insignificant effect of integration, was confirmed with respect to most factors. At the same time, we cannot accept the null hypothesis regarding two types of integration—financial and informational. Our results are consistent with the results of the previous studies by Barro (2013) and Oduor et al. (2021), which proved a negative statistically significant relationship between globalization indicators and inflation. In our study, we expanded the range of integration factors by including in the model indicators such as the number of applied sanitary and phytosanitary measures in foreign trade and the amount of money supply, which have a positive correlation with inflation.
The results of our study support the findings of Attinasi and Bolatti (2021) that the desire for trade liberalization exerts downward pressure on prices in all sectors by reducing average tariff rates and trade rules. Moreover, we agree with Bernanke’s (2003) conclusions that deepening trade integration leads to a slowdown in the growth of prices for imported goods, thereby reducing the overall inflation rate in the country. However, our results raise doubts about the existence of a very close relationship between trade integration and inflation. According to the results obtained, the most significant indicator influencing inflation is the level of financial integration of the country. Our study found an inverse relationship between inflation and certain indicators of financial globalization, including FDI, portfolio investment and reserves, and the share of the country’s GDP in the global volume. These results are consistent with the results of empirical studies by Mustafa (2019), Valli and Masih (2014), Vasileva (2018), and Yusof et al. (2021).
According to our results, one of the indicators of financial globalization, which has a strong positive relationship with the level of inflation, is the value of the money supply. Our study confirms the earlier findings of Sinah (2018) and Denbel et al. (2016) that an increase in the money supply leads to an increase in the consumer price index.
When examining the influence of types of globalization (complex integration indices) on the level of inflation, we did not find any significant sensitivity of inflation to demographic factors. We did not find strong evidence to support the findings of Bobeyca et al. (2017) and Juselius and Takáts (2018), regarding the fact that demographic indicators can have a significant disinflationary effect on the economy in SCO member countries.
Within the framework of this study, the variables reflecting the level of demographic integration are indicators such as the total population of the country, the size of the labor force, and the share of international working-age migrants. This study shows a very high dependence of inflation on the labor force and the population as a whole. It is worth mentioning that the integration of the SCO member countries into the global labor market is quite high. Approximately 45% of the world’s population lives in the territory of this association, i.e., China and India occupy leading positions in terms of the labor force, which allowed developed economies to transfer most of their production to these countries. Consequently, this lets these countries successfully use their labor force and achieve a high level of demographic globalization, which helps them control inflation and keep it within the target values.
Our study has revealed that the dynamics of inflation are significantly influenced by demographic factors such as international migration flows. According to the relevant model, the number of migrants also reduces labor costs and exerts downward pressure on inflation, confirming the findings of Lozej (2019) and Bentolila et al. (2008). However, a decrease in cheap labor can lead to the transfer of production by large corporations to other countries, which will lead to a reduction in the level of demographic globalization and cause additional inflationary pressure on the economies of these countries.
Deflationary factors include all indicators of industrial globalization considered in this paper, i.e., the volume of value added in the manufacturing sector and industry as a whole, the volume of energy resources produced, and the production of grain as the main raw material resource in the world market. The results obtained show a close negative relationship between inflation and the production of grain and electricity resources. An increase in the production of these goods may lead to a reduction in inflationary pressure.
At the same time, a significant reduction in the supply of grain and energy resources on the world market can lead to a significant increase in inflation and cause a food and energy crisis. Countries that are most vulnerable to commodity price volatility, such as Uzbekistan, Tajikistan, and Kyrgyzstan, are encouraged to develop trade cooperation with SCO member states, for example, by reducing or eliminating import duties on commodities.
The study results show a major impact of the level of information integration of the country on its inflation, which was calculated using indicators such as the number of Internet and social network users and the average speed of Internet connection.
The results obtained during the study are consistent with the conclusions of experts such as Chiacchio et al. (2018), who believe that there is a statistically significant negative relationship between the use of the Internet and social networks with inflation. Three out of eight SCO member states (India, Pakistan, and Tajikistan) have Internet coverage below 50%. Thus, these countries have significant potential for further integration into the global digital economy, which will help curb inflation for a long period (Magomedov 2019).
The empirical results of our study revealed an inverse relationship between the level of a country’s political integration and inflation.
The political integration index includes variables that, in our opinion, characterize the state’s ability to influence external economic challenges: The country’s share in the UN budget, the country’s share of votes in the IMF decision-making, the number of diplomatic missions in other countries, the number of foreign embassies in the country, and the number of international organizations of which the country is a member.
The results show high dependence of inflation on indicators such as the country’s participation in the largest international organizations, the UN and the IMF, which have a significant impact on global politics and the economy (Rim et al. 2020). In addition, components of the political integration index such as the number of diplomatic missions and the country’s participation in other international and regional organizations and integration blocs have a significant impact on the inflation rate.
The deeper the degree of political globalization of a country in the world economy, the stronger its influence on decision-making that forms inflationary trends (Abu Asab et al. 2018). At the end of 2021, China, India, and Russia were the countries with the highest level of political globalization and lowest inflation rates among the SCO member countries.
At the same time, the political decisions of the most influential countries in the world can unleash sanctions and trade wars, which will undoubtedly change the global balance and contribute to the trends of regionalization, globalization, and localization of production. Thus, the growth of deglobalization processes and the reduced integration of countries into the geo-economic system will entail a strong increase in inflation risks.
5.2. Theoretical and Practical Significance of the Research in Studying the Influence of Global Factors of Country Integration on the Level of Inflation
This article contributes to the scientific literature by offering a fairly easy-to-calculate, universal indicator for measuring the degree of integration, covering a wide data set and reflecting all significant aspects of globalization (economic, financial, demographic, industrial, information, and political).
These groupings were selected based on the methodology for constructing the KOF index. It should be noted that the KOF index (Haelg 2020) used worldwide to assess the level of globalization, in our opinion, is based on serious inaccuracies, and the data set included in the KOF does not allow for an objective assessment of the level of integration of individual countries into global processes. In addition, when calculating the KOF index, the initial data from two years ago are used, and by the date of publication of the report, they are no longer relevant.
In our study, the selection of KOF indicators was carried out and the optimal set of data was determined, which, in our opinion, most objectively and fairly reflects the level of integration of the country into the world space. The indicators used to calculate the integration index are easily accessible because they are freely available and updated annually, which allows the researcher to obtain up-to-date data. This enables researchers to quickly analyze and conduct a comparative analysis of the level of integration of individual countries.
In addition, to calculate the integration indices, we relied on simple averages, since the importance of all factors is assumed to be the same, and the calculation of the index is understandable and not particularly difficult.
One of the significant results is the contribution to the development of scientific and methodological literature on modeling the relationship between inflation and the country’s political influence index. The methodology presented in this study allows us to identify a causal relationship between various factors of globalization and the level of inflation and model the level of inflation depending on the degree of change in the level of global integration.
The results obtained can answer the first research question since the results of our study showed that countries with deep integration into the geo-economic system are more successful in containing inflation growth and are less exposed to inflationary risks.
To build statistical models, as variables we used complex indices based on indicators that characterize six types of globalization: Economic, financial, demographic, industrial, information, and political indices.
The factors of economic, financial, demographic, and industrial globalization of the country as dependent variables are used by the relevant literature that studies the determinants of inflation. This allows comparing our results and the results of earlier studies. However, we included two additional indicators as variables in our model, whose relationship with inflation is poorly studied in the scientific literature: The level of inflation globalization and the level of political globalization.
This study has revealed a statistical relationship between the selected variables for data from six SCO member countries through correlation analysis models. The results of this analysis allowed us to answer the second research question and argue that integration factors are disinflationary, i.e., the growth of the country’s integration into the processes of globalization contributes to a decrease in inflation rates.
Based on an in-depth analysis of spatial and temporal indicators, a regression model was built that allows us to assess the strength (tightness) of the influence of certain types of integration on the level of inflation and answer the third research question posed to us. Our results showed that the factors of financial and information integration of the country have the most significant impact on inflation. Therefore, we rejected the null hypothesis regarding these variables. At the same time, for the rest of the variables, we accept the null hypothesis, i.e., they do not have q significant influence on inflation indicators.
The results of the research can be used in updating inflation forecasting models, which determine the theoretical significance of this work and identify the directions of new research in the field of forecasting inflation risks, with due regard to global trends such as the growth of geopolitical influence on the world economy and increased inflationary pressure.
The practical significance of our study can be divided into two components:
I. The obtained results show that the level of the country’s integration into the processes of globalization and inflation are closely interconnected. At the same time, the integration of the country into global processes can be considered a factor in disinflation. Among the SCO member countries, countries with a deeper degree of integration into the globalization process demonstrate lower inflation growth rates (China, India, and Russia). Conversely, countries with a low level of globalization are in a zone of increased inflationary risk (Kyrgyzstan, Uzbekistan, and Tajikistan).
II. The results obtained allow decision-makers, researchers, and persons participating in discussions on the possibilities of cooperation between SCO member states to identify promising areas for this cooperation and assess the possibility of deepening regional integration to stabilize inflation and reduce inflation risks.
One of the main problems that we encountered while applying the quantitative method in our comparative study, whose objects are independent countries of the world, is associated with a number of limitations inherent in this approach. These include the identification of adequate variables that reflect the globalization of the country and the issue of ensuring the consistency of indicators for international comparison.
At the same time, the choice of variables for analysis was limited by the lack of additional data, which could affect the requirements for accuracy and relevance.
The object of further research might be a modification of the presented model in order to deepen the analysis and improve the forecast of inflation risks, taking into account changes in global trends, including geopolitical factors.
Author Contributions
Supervision, V.V.B.; conceptualization, V.V.B. and S.A.L.; methodology, V.V.B. and S.A.L.; investigation, V.V.B. and D.V.F.; writing—original draft, V.V.B. and D.V.F.; formal analysis, V.V.B. and I.V.P.; visualization, V.V.B. and I.V.P.; data curation, V.V.B. and T.V.G.; software, V.V.B. and T.V.G. All authors have read and agreed to the published version of the manuscript.
Funding
This research received no external funding.
Data Availability Statement
The data used to support the findings of this study are included in the article.
Acknowledgments
This article was prepared as part of the government contract as requested by the Ministry of Science and Higher Education of the Russian Federation on the subject formulated as «Structural changes in economy and society as a result of achieving the target indicators of National projects, which provide opportunities to organize new areas of social and economic activity, including commercial, both in Russia and abroad». № FSSW2020-0010. The article was prepared within the framework of the research project “Development of the concept of modeling the Russian tourism services market using methods of economic and mathematical modeling and modern digital technologies”.
Conflicts of Interest
The authors declare no conflict of interest.
References
- Abu Asab, Nora, Juan Carlos Cuestas, and Alberto Montagnoli. 2018. Inflation targeting or exchange rate targeting: Which framework supports the goal of price stability in emerging market economies? PLoS ONE 13: e0201798. [Google Scholar] [CrossRef] [PubMed]
- Adams, Аbi, and Peter Levell. 2014. Measuring Poverty When Inflation Varies across Households. Institute of Fiscal Studies Report. Joseph Rowntree Foundation. Available online: https://www.jrf.org.uk/sites/default/files/jrf/migrated/files/poverty-inflation-households-full.pdf (accessed on 8 September 2022).
- Ali, Sher, Abid Ali, and Saleem Khan. 2019. Impact of globalization on inflation in selected South Asian countries: Using panel data techniques. Global Social Sciences Review 4: 339–51. [Google Scholar] [CrossRef]
- Anderson, Derek, Dennis Botman, and Benjamin Hunt. 2014. Is Japan’s Population Aging Deflationary? International Monetary Fund Working Papers No. 14/139. Washington, DC: International Monetary Fund. [Google Scholar] [CrossRef]
- Annual Statistical Bulletin. 2022. OPEC. Available online: https://asb.opec.org/data/ASB_Data.php (accessed on 8 September 2022).
- Attinasi, Maria Grazia, and Mirco Bolatti. 2021. Globalization and its implications for inflation in advanced economies. ECB Economic Bulletin 4. Available online: https://www.ecb.europa.eu/pub/economic-bulletin/articles/2021/html/ecb.ebart202104_01~ae13f7fe4c.en.html (accessed on 8 September 2022).
- Attiya Mohammed Omran, Emad, and Yuriy Bilan. 2021. The impact of inflation on the unemployment rate in Egypt: The VAR approach. SHS Web of Conferences 107: 06009. [Google Scholar] [CrossRef]
- Banek, Tadeusz, Przemysław Kowalik, and Edward Kozłowski. 2009. Fisher Information Criterion in Stopped Self-Learning of Linear Systems. In Process Control in Management. Edited by Tadeusz Banek. Torun: Wydawnictwo “Dom Organizatora”, pp. 41–51. [Google Scholar]
- Bans-Akutey, Mawufemor, Isaac Yaw Deh, and Faisal Mohammed. 2016. What Is the Effect of Inflation on Manufacturing Sector Productivity in Ghana? MPRA Paper No. 75145. Munich: University Library of Munich. Available online: https://mpra.ub.uni-muenchen.de/75145/ (accessed on 8 September 2022).
- Barro, Robert. J. 2013. Inflation and economic growth. Annals of Economics and Finance 14: 121–44. [Google Scholar]
- Behera, Jaganath. 2014. Inflation and its impact on economic growth: Evidence from six South Asian countries. Journal of Economics and Sustainable Development 5: 145–54. [Google Scholar]
- Behera, Jaganath, and Alok Kumar Mishra. 2015. Inflation and economic growth nexus in BRICS: Evidence from ARDL bound testing approach. Asian Journal of Economic Modelling 4: 1–17. [Google Scholar] [CrossRef]
- Bentolila, Samuel, Juan J. Dolado, and Juan F. Jimeno. 2008. Does immigration affect the Phillips curve? Some evidence for Spain. European Economic Review 52: 1398–420. [Google Scholar] [CrossRef]
- Bernanke, Ben S. 2003. An Unwelcome Fall in Inflation? Remarks before the Economics Roundtable; San Diego: University of California. Available online: http://www.federalreserve.gov/boarddocs/speeches/2003/20030723/default.htm (accessed on 8 September 2022).
- Bianchi, Francesco, and Andrea Civelli. 2015. Globalization and inflation: Evidence from a time-varying VAR. Review of Economic Dynamics 18: 406–33. [Google Scholar] [CrossRef]
- Bobeyca, Elena, Eliza Lis, Christiane Nickel, and Yiqiao Sun. 2017. Demographics and Inflation. European Central Bank Working Paper No. 2006. Available online: https://www.ecb.europa.eu/pub/pdf/scpwps/ecbwp2006.en.pdf (accessed on 8 September 2022).
- Bullard, James, Carlos Garriga, and Christopher J. Waller. 2012. Demographics, redistribution and optimal inflation. Federal Reserve Bank of St. Louis Review 94: 419–40. [Google Scholar] [CrossRef]
- Chang, Tsangyao, and Chia-Fen Tsai. 2015. Globalization and inflation nexus: Further evidence based on bootstrap panel causality. Quality and Quantity 49: 867–77. [Google Scholar] [CrossRef]
- Chen, Zhe. 2022. The impact of trade and financial expansion on volatility of real exchange rate. PLoS ONE 17: e0262230. [Google Scholar] [CrossRef] [PubMed]
- Chiacchio, Francesco, Katerina Gradeva, and Paloma Lopez-Garcia. 2018. The Post-Crisis TFP Growth Slowdown in CEE Countries: Exploring the Role of Global Value Chains. ECB Working Paper No. 2143. Available online: https://ssrn.com/abstract=3161312 (accessed on 8 September 2022).
- Choi, Sangyup, Davide Furceri, Prakash Loungani, Saurabh Mishra, and Marcos Poplavski-Ribeiro. 2018. Oil prices and inflation dynamics: Evidence from advanced and developing economies. Journal of International Money and Finance 82: 71–96. [Google Scholar] [CrossRef]
- Chugunov, Igor, Mykola Pasichnyi, Tetiana Kaneva, Anton Nepytaliuk, and Valeriy Koroviy. 2021. The influence of inflation targeting on economic growth in the OECD and developing countries. Montenegrin Journal of Economics 17: 173–86. [Google Scholar] [CrossRef]
- Chupanova, Khadizhat Alibekovna, Oleg Yuryevich Otrokov, Natalia Vladimirovna Mosina, Vladimir Dmitrievich Sekerin, Andrey Nikolaevich Zharov, and Sergey Valentinovich Garnik. 2021. Supply chain management concept and digital economy: Digital supply chain technological innovation. Indian Journal of Economics and Development 17: 928–33. [Google Scholar]
- Ciccarelli, Matteo, and Benoit Mojon. 2010. Global inflation. The Review of Economics and Statistics 92: 524–35. [Google Scholar] [CrossRef]
- Ciner, Cetin. 2011. Commodity prices and inflation: Testing in the frequency domain. Research in International Business and Finance 25: 229–37. [Google Scholar] [CrossRef]
- Csonto, Balazs, Yuxuan Huang, and Camilo E. Tovar. 2019. Is Digitalization Driving Domestic Inflation? International Monetary Fund Working Paper No. 19/271. December. Available online: https://www.imf.org/en/Publications/WP/Issues/2019/12/06/Is-Digitalization-Driving-Domestic-Inflation-48786 (accessed on 8 September 2022).
- Denbel, Fitsum Sharew, Yilkal Wassie Ayen, and Teshome Adugna Regasa. 2016. The relationship between inflation, money supply and Economic growth in Ethiopia: Integration and causal analysis. International Scientific Journal and Research Publications 6: 556–65. [Google Scholar]
- Dokholyan, Sergey, Evgeniya Olegovna Ermolaeva, Alexander Sergeyevich Verkhovod, Elena Vladimirovna Dupliy, Anna Evgenievna Gorokhova, Vyacheslav Aleksandrovich Ivanov, and Vladimir Dmitrievich Sekerin. 2022. Influence of Management Automation on Managerial Decision-making in the Agro-Industrial Complex. International Journal of Advanced Computer Science and Applications(IJACSA) 13: 597–603. [Google Scholar] [CrossRef]
- FAO. 2021a. Food Outlook—Biannual Report on Global Food Markets. Food Outlook. Rome: Food and Agriculture Organization of the United Nations. [Google Scholar] [CrossRef]
- FAO. 2021b. Global Forest Resources Assessment 2020—Main Report. Rome: FAO. [Google Scholar] [CrossRef]
- FAO. 2021c. World Food and Agriculture—Statistical Yearbook. Rome: FAO. [Google Scholar] [CrossRef]
- Feldkircher, M., and G. Tondl. 2020. Global factors driving inflation and monetary policy: A global VAR assessment. International Advances in Economic Research 26: 225–47. [Google Scholar] [CrossRef]
- Forbes, Kristin J. 2019. Inflation Dynamics: Dead, Dormant or Determined Abroad? Brookings Papers on Economic Activity Fall: 257–338. Available online: https://www.brookings.edu/bpea-articles/inflation-dynamics-dead-dormant-or-determined-abroad/ (accessed on 1 November 2022).
- Garcia, Juan Angel, and Thomas Werner. 2010. Inflation Risk and Inflation risk Premia. European Central Bank paper series N1162; Available online: https://www.ecb.europa.eu/pub/pdf/scpwps/ecbwp1162.pdf (accessed on 8 September 2022).
- Ghasemi, Asghar, and Saleh Zahediasl. 2012. Normality tests for statistical analysis: A guide for non-statisticians. International Journal of Endocrinology and Metabolism 10: 486–89. [Google Scholar] [CrossRef] [PubMed]
- Haelg, Florian. 2020. The KOF Globalisation Index—A Multidimensional Approach to Globalisation. Jahrbücher für Nationalökonomie und Statistik 240: 691–96. [Google Scholar] [CrossRef]
- Hasanov, Fakhri. 2011. Relationship between inflation and economic growth in Azerbaijani economy: Is there any threshold effect? Asian Journal of Business and Management Sciences 1: 1–11. [Google Scholar]
- He, Yugang, and Yinhui Wang. 2022. Macroeconomic Effects of COVID-19 Pandemic: Fresh Evidence from Korea. Sustainability 14: 5100. [Google Scholar] [CrossRef]
- Ihrig, Jane, Steven Kamin, Deborah Lindner, and Jaime Marquez. 2007. Some Simple Tests of the Globalization and Inflation Hypothesis; International Finance Discussion Papers No. 891. Washington, DC: Board of Governors of the Federal Reserve System. Available online: https://www.federalreserve.gov/pubs/ifdp/2007/891/ifdp891.pdf (accessed on 8 September 2022).
- International Monetary Fund. 2022. The Increase in Morbidity and the Increase in Inflation. Available online: https://www.imf.org/ru/Publications/WEO/Issues/2022/01/25/world-economic-outlook-update-january-2022 (accessed on 8 September 2022).
- International Monetary Fund. n.d. IMF Members’ Quotas and Voting Power, and IMF Board of Governors. Available online: https://www.imf.org/en/About/executive-board/members-quotas (accessed on 8 September 2022).
- Juselius, Мikael, and Előd Takáts. 2018. The Enduring Link between Demography and Inflation. BIS Working Paper No. 722. Available online: https://www.bis.org/publ/work722.pdf (accessed on 8 September 2022).
- Kabukçuoğlu, Ayşe, and Enrique Martinez-Garcia. 2018. Inflation as a global phenomenon—Some implications for inflation modeling and forecasting. Journal of Economic Dynamics and Control 87: 46–73. [Google Scholar] [CrossRef]
- Karashchuk, Oksana, Elena Mayorova, Alexander Nikishin, and Tatyana Pankina. 2019. Factors hindering retail development in Russia. In Proceedings of the 34th International-Business-Information-Management-Association (IBIMA) Conference. Vision 2025: Education Excellence and Management of Innovations through Sustainable Economic Competitive Advantage. Madrid: International Business Information Management Association, pp. 7819–24. [Google Scholar]
- Kartaev, Philipp. S., Olga A. Klachkova, and Anna S. Lukianova. 2020. How does inflation influence income inequality in Russia? Voprosy Ekonomiki 4: 54–66. [Google Scholar] [CrossRef]
- Kemp, Simon. 2022. Digital 2022: Global Overview Report. Available online: https://datareportal.com/reports/digital-2022-global-overview-report (accessed on 8 September 2022).
- Kiganda, Evans Ovamba, and Margaret Atieno Omondi. 2020. Total imports and its components influence on inflation in Kenya. Journal of Economics, Management and Trade 26: 54–62. [Google Scholar] [CrossRef]
- Kliesen, Kevin L. 2021. The link between higher commodity prices and inflation. Economic Synopses 22: 1–3. [Google Scholar] [CrossRef]
- Koohi Lai, Zahra, Ali Namaki, Ali Hosseiny, Gholamreza Jafari, and Marcel Ausloos. 2020. Coupled Criticality Analysis of Inflation and Unemployment. Entropy 23: 42. [Google Scholar] [CrossRef]
- Kosorukova, Irina Vyacheslavovna, Olesya Gennadievna Kukharenko, Victor Dmitrievich Orekhov, Helena Piel, and Elena Sergeevna Shchennikova. 2021. Forecasting the strategic economic potential of the world’s leading economies until the end of the 21st century. Academy of Strategic Management Journal 20: 1–9. [Google Scholar]
- Kozhamzharova, Gulnura, Lutpulla Omarbakiyev, Oksana Kogut, Saule Zhumasheva, Anelya Saulembekova, and Gulnur Abdrakhmanova. 2022. Banking Risks and Lending to Tourism and Hotel Businesses amid the COVID-19 Pandemic. Journal of Environmental Management and Tourism 13: 427–37. [Google Scholar] [CrossRef] [PubMed]
- Krasnovskiy, Evgeny, Elena Nemtchinova, Olga Mityakova, Sergey Garnik, Sergey Gasanbekov, Anatoly Ten, and Dmitry Mardas. 2022. Estimating the Volatility of Commodity Prices Indices for Agricultural Raw Materials Using the GARCH Model. Indian Journal of Economics and Development 18: 742–747. [Google Scholar] [CrossRef]
- Kryeziu, Nexhat, and Esat Durguti. 2019. The impact of inflation on economic growth: The case of Eurozone. International Journal of Financial and Banking Research (2147–4486) 8: 1–9. [Google Scholar] [CrossRef]
- Lapinskaitė, Indrė, and Algita Miečinskienė. 2020. Assessment of the impact of hard commodity prices changes on inflation in European Union countries. Central European Business Review 8: 18–35. [Google Scholar] [CrossRef]
- Law, Chee-Hong, and Siew-Voon Soon. 2020. The impact of inflation on income inequality: The role of institutional quality. Letters on Applied Economics 27: 1735–38. [Google Scholar] [CrossRef]
- Lochan, Sergey A., Tatiana P. Rozanova, Valery V. Bezpalov, and Dmitry V. Fedyunin. 2021. Supply chain management and risk management in an environment of stochastic uncertainty (Retail). Risks 9: 197. [Google Scholar] [CrossRef]
- Lorenzani, Dimitri, and Janos Varga. 2014. The Economic Impact of Digital Structural Reforms. Economic Paper No. 529. Brussels: European Commission. Available online: https://ec.europa.eu/economy_finance/publications/economic_paper/2014/pdf/ecp529_en.pdf (accessed on 8 September 2022).
- Lozej, Matija. 2019. Economic migration and business cycles in a small open economy with matching frictions. Economic Modeling 81: 604–20. [Google Scholar] [CrossRef]
- Magomedov, Ramazan M. 2019. Digital technologies for competitive analysis and evaluation of competitive capacity of a business entity. International Journal of Innovative Technology and Exploring Engineering 9: 1184–89. [Google Scholar] [CrossRef]
- Mallik, Girijasankar, and Anis Chowdhury. 2001. Inflation and economic growth: Evidence from four South Asian countries. Asia-Pacific Development Journal 8: 123–35. [Google Scholar]
- Mishra, Prabhaker, Chandra M. Pandey, Uttam Singh, Anshul Gupta, Chinmoy Sahu, and Amit Keshri. 2019. Descriptive statistics and normality tests for statistical data. Annals of Cardiac Anaesthesia 22: 67–72. [Google Scholar] [CrossRef]
- Monnin, Pierre. 2014. Inflation and Income Inequality in Developed Economies. CEP Working Paper No. 2014/1. Available online: https://www.cepweb.org/wp-content/uploads/2014/05/CEP_WP_Inflation_and_Income_Inequality.pdf (accessed on 8 September 2022).
- Muktadir-Al-Mukit, Dewan, A. Z. M. Shafiullah, and Md. Rizvy Ahmed. 2013. Inflation led import or import led inflation: Evidence from Bangladesh. Asian Business Review 2: 65–69. [Google Scholar] [CrossRef]
- Mumtaz, Haroon, and Paolo Surico. 2012. Evolving international inflation dynamics: World and country—specific factors. Journal of the European Economic Association 10: 716–34. [Google Scholar] [CrossRef]
- Mustafa, Abdul Majeed Mohamed. 2019. The relationship between foreign direct investment and inflation: Econometric analysis and forecasts in the case of Sri Lanka. Journal of Politics and Law 12: 44–52. [Google Scholar] [CrossRef]
- Mustafa, Omer Allagabo Omer. 2021. Inflation and unemployment trade-off: Is Phillips curve true for African developing countries? Evidence from Sudan. Journal of Economic Science Research 4: 35–43. [Google Scholar] [CrossRef]
- Oduor, Julius Wesonga, Consolata Ngala, Reuben Ruto, and Umulkher Ali Abdillahi. 2021. Effect of inflation on growth of manufacturing sector in Kenya (2008–2017). Asian Journal of Economics, Business and Accounting 21: 17–34. [Google Scholar] [CrossRef]
- Official Document System of the United Nations. n.d. Available online: https://documents-dds-ny.un.org/doc/UNDOC/GEN/N18/461/93/PDF/N1846193.pdf?OpenElement (accessed on 8 September 2022).
- Ojo, Marianne, and Theodore Dierker. 2021. Monetary Policy Implications of Deviations in Inflation Targeting: The Need for a Global Cooperative, Coordinated and Correlated Response. MPRA Paper No. 110935. Available online: https://mpra.ub.uni-muenchen.de/110935/ (accessed on 8 September 2022).
- Osuala, A. E., K. I. Osuala, and S. C. Onyeike. 2013. Impact of inflation on economic growth in Nigeria—A causality test. Journal of Research in National Development 11: 206–16. [Google Scholar]
- Parker, Miles. 2018. How global is “Global inflation”? Journal of Macroeconomics 58: 174–97. [Google Scholar] [CrossRef]
- Paudyal, Shoora B. 2011. Determinants of inflation in Nepal: An empirical assessment. NRB Economic Review 26: 61–82. [Google Scholar]
- Pham, Binh Thai, and Hector Sala. 2022. Cross-country connectedness in inflation and unemployment: Measurement and macroeconomic consequences. Empirical Economics 62: 1123–46. [Google Scholar] [CrossRef]
- Pratinidhi, P., and N. M. P. Verma. 2020. Theoretical relationship between inflation and unemployment: A macro study. International Journal of Humanities and Social Sciences 9: 17–26. [Google Scholar]
- Ramazanov, Ibragim Agaevich, Svetlana Viktorovna Panasenko, Vyacheslav Petrovich Cheglov, Elena Anatol’evna Krasilnikova, and Alexander Fedorovich Nikishin. 2021. Study of innovative activity of the distributive industries of the Russian Federation in the context of the world economy digitalization and globalization. Nexo Revista Científica 34: 926–41. [Google Scholar] [CrossRef]
- Rehman, Abdul, Laura Mariana Cismas, and Ioana Anda Milin. 2022. “The Three Evils”: Inflation, Poverty and Unemployment’s Shadow on Economic Progress—A Novel Exploration from the Asymmetric Technique. Sustainability 14: 8642. [Google Scholar] [CrossRef]
- Rim, Gwang-Nam, Sun-Nam Jang, Chol-Ju An, Sun-Hui Hwang, and Son-Hui Ri. 2020. State Economic Strength and Some Methodological Issues on Its Assessment. Social Indicators Research 152: 607–36. [Google Scholar] [CrossRef] [PubMed]
- Sadovnikova, Natalia Alekseevna, Olga Gurievna Lebedinskaya, Alexander Valerievich Bezrukov, and Leysan Anvarovna Davletshina. 2021. The indicator system of regional socio-economic situation based on harmonized information resources. Journal of Advanced Pharmacy Education and Research 11: 147–55. [Google Scholar] [CrossRef]
- Saleuddin, Rasheed, and D’Maris Coffman. 2018. Can inflation expectations be measured using commodity futures prices? Structural Change and Economic Dynamics 45: 37–48. [Google Scholar] [CrossRef]
- Samarina, Anna, and Jakob de Haan. 2014. Right on target: Exploring the factors leading to inflation targeting adoption. Contemporary Economic Policy 32: 372–89. [Google Scholar] [CrossRef]
- Sekine, Atsushi, and Takayuki Tsuruga. 2018. Effects of commodity price shocks on inflation: A cross-country analysis. Oxford Economic Papers 70: 1108–35. [Google Scholar] [CrossRef]
- Selvanayagam, Sivajothy, and Abdul Majeed Mohamed Mustafa. 2019. The impact of unemployment and interest rate on inflation in Sri Lanka. Journal of Management 14: 1–12. [Google Scholar] [CrossRef]
- Shin, Inseok, and Kyu Ho Kang. 2021. Has international CPI inflation comovement strengthened since the global financial crisis? Macroeconomic Dynamics 1–30. [Google Scholar] [CrossRef]
- Shkvarya, Lyudmila V., and Xizhe Wang. 2021. SCO 20 Years: Key Achievements and The Role of China. Vostok (Oriens) 2021: 153–67. [Google Scholar] [CrossRef]
- Siami-Namini, Sima, and Darren Hudson. 2019. Inflation and income inequality in developed and developing countries. Journal of Economic Studies 46: 611–32. [Google Scholar] [CrossRef]
- Sinah, Satrugan. 2018. Empirical study of relationship between money supply and inflation based on data from new standardised reporting format. International Journal of Economics and Finance 10: 213–19. [Google Scholar] [CrossRef]
- Singhal, Richa, and Rakesh Rana. 2015. Chi-square test and its application in hypothesis testing. Journal of the Practice of Cardiovascular Sciences 1: 69–71. [Google Scholar] [CrossRef]
- Statistical Data Population, total. n.d. The World Bank. Available online: https://data.worldbank.org/indicator/SP.POP.TOTL?view=chart (accessed on 8 September 2022).
- Suhendra, Indra, Navik Istikomah, Rah Adi Fahmi Ginanjar, and Cep Jandi Anwar. 2020. Human capital, income inequality and economic variables: A panel data estimation from a region in Indonesia. Journal of Asian Finance Economics and Business 7: 571–79. [Google Scholar] [CrossRef]
- Summers, Lawrence. 2014. Reactions to the new hypothesis of secular stagnation. In Secular Stagnation: Facts, Causes and Cures. Edited by Teulings Coen and Richard Baldwin. London: CERP Press, pp. 27–40. [Google Scholar]
- Sun, Huiqing, Qingrou Zhong, and Ling Yang. 2021. Analysis of Influencing Factors of China’s Agricultural Products Exports to SCO Based on CMS Model. E3S Web of Conferences 253: 01044. [Google Scholar] [CrossRef]
- Svirin, Yury Alexandrovich, Anatoly Aleksandrovich Vlasov, Vladislav Petrovich Sorokin, Marina Andreevna Simanova, and Catherina Aleksandrovna Kukhturskaya. 2021. Civil Mechanism Preventing and Resolving a Conflict of Interest in the Russian Private Law. JURÍDICAS CUC 17: 153–72. [Google Scholar] [CrossRef]
- Taylor, Lance, and Nelson Barbosa-Filho. 2021. Inflation? It’s Import Prices and the Labor Share! Institute for New Economic Thinking Working Paper Series No. 145. pp. 1–39. Available online: https://ssrn.com/abstract=3812809 (accessed on 8 September 2022).
- The Global Embassy Resource. n.d. Available online: https://www.embassypages.com/about (accessed on 8 September 2022).
- The International Monetary Fund Financial Sector Statistics. n.d. Available online: https://data.imf.org/ (accessed on 8 September 2022).
- The Migration Data Portal. n.d. Available online: https://www.migrationdataportal.org/themes/international-migrant-stocks (accessed on 8 September 2022).
- The UNIDO National Accounts Database. n.d. Available online: https://stat.unido.org/content/dataset_description/national-accounts-database (accessed on 8 September 2022).
- The US Energy Information Administration (EIA) Database. n.d. Available online: https://www.eia.gov (accessed on 8 September 2022).
- The World Bank Open Data. n.d. Available online: https://data.worldbank.org/indicator (accessed on 8 September 2022).
- The World Trade Organization (WTO) Statistics Portal. n.d. Available online: https://stats.wto.org (accessed on 8 September 2022).
- Tien, Nguyen Hoang. 2021. Relationship between inflation and economic growth in Vietnam. Turkish Journal of Computer and Mathematics Education 12: 5134–39. [Google Scholar]
- Tsenina, Ekaterina Vladimirovna, Tamara Petrovna Danko, Vladimir Mikhailovich Kiselev, Lyubov Alexandrovna Chaykovskaya, Nikita Dmitrievich Epstein, Ona Rauskiene, and Vladimir Dmitriyevich Sekerin. 2022. Cluster analysis of the expenditures for environmental and technological innovations in sustainable development policy formation. Journal of Environmental Management and Tourism 13: 63–74. [Google Scholar]
- Valli, Mohammed, and Mansur Masih. 2014. Is There Any Causality between Inflation and FDI in an ‘Inflation Targeting’ Regime? Evidence from South Africa. MPRA Paper No. 60246. Available online: https://mpra.ub.uni-muenchen.de/60246/ (accessed on 8 September 2022).
- Vasileva, Iuliia. 2018. The effect of inflation targeting on foreign direct investment flows to developing countries. Atlantic Economic Journal 46: 459–70. [Google Scholar] [CrossRef]
- Vedala, Naga, and Sailaja Vedala. 2018. A study on impact of monetary policy on GDP and inflation. Journal of Advanced Research in Dynamical and Control Systems 10: 197–203. [Google Scholar]
- Voskovskaya, Anzhela Sergeevna, Tatiana Anatolievna Karpova, Tatiana Anatolievna Tantsura, Anna Yurievna Shirokih, Olga Yevgenievna Lebedeva, and Kostyantyn Anatol’evich Lebedev. 2022. The Risk Management System as an Enhancement Factor for Investment Attractiveness of Russian Enterprises. Risks 10: 179. [Google Scholar] [CrossRef]
- Wollie, Getachew. 2018. The relationship between inflation and economic growth in Ethiopia. Budapest International Research and Critics Institute (BIRCI-Journal): Humanities and Social Sciences 1: 264–71. [Google Scholar] [CrossRef]
- Yi, Myung Hoon, and Changkyu Choi. 2005. The effect of the internet on inflation: Panel data evidence. Journal of Policy Modeling 27: 885–89. [Google Scholar] [CrossRef]
- Yusof, Najihah, Liya Fitrya Nin, Haida Kamelia Md Kamal, Jamilyn Rasyeeda Ahmad Taslim, and Amir Imran Zeynoddin. 2021. Factors that influence the inflation rate in Malaysia. International Journal of Academic Research in Business and Social Sciences 11: 626–37. [Google Scholar] [CrossRef] [PubMed]
- Zakaria, Muhammad, Shahzeb Khiam, and Hamid Mahmood. 2021. Influence of oil prices on inflation in South Asia: Some new evidence. Resources Policy 71: 102014. [Google Scholar] [CrossRef]
- Zhang, Ch. 2017. The great globalization and changing inflation dynamics. International Journal of the Central Bank 13: 191–226. [Google Scholar]
- Zhang, Ya-Ting, Buwajian Abula, and Bin Wang. 2022. Research on Influencing Factors of High-Quality Development of Agricultural Trade between China and SCO Member States in the Context of Industrial Internet of Things. Mobile Information Systems 2022: 9410605. [Google Scholar] [CrossRef]
- Zhilenko, Vilena Yurievna, Elmira Faylovna Amirova, Denis Evgenevich Lomakin, Nikolai Nikolaevich Smoktal, and Fatima Yakhievna Khamkhoeva. 2021. The impact of COVID-19 pandemic on the global economy and environment. Journal of Environmental Management and Tourism 12: 1236–41. [Google Scholar] [CrossRef] [PubMed]


Disclaimer/Publisher’s Note: The statements, opinions and data contained in all publications are solely those of the individual author(s) and contributor(s) and not of MDPI and/or the editor(s). MDPI and/or the editor(s) disclaim responsibility for any injury to people or property resulting from any ideas, methods, instructions or products referred to in the content. |
© 2022 by the authors. Licensee MDPI, Basel, Switzerland. This article is an open access article distributed under the terms and conditions of the Creative Commons Attribution (CC BY) license (https://creativecommons.org/licenses/by/4.0/).