1. Introduction
Modelling claim frequency and claim severity are topics of great interest in property-casualty insurance (e.g., Third Party Liability (TPL) Motor Insurance) and a crucial step for making appropriate underwriting, ratemaking, and reserving actuarial decisions. To this end, insurers tend to model separately the claim frequency and average claim severity using GLMs, in which the response variable—claim counts and claim amounts—is expressed through specific link transforms as linear combinations of feature (rating) variables such as the driver’s age, car brand, education, or distance driven (
Garrido et al. 2016;
Renshaw 1994).
The standard frequency–severity model has, however, some limitations. First, the model assumes a linear relationship between the response variable and the predictors, with empirical studies documenting nonlinear effects between, e.g., claim severity and the insured’s age (
Cunha and Bravo 2022;
Frees and Valdez 2009). Alternative approaches using Generalized Additive Models (GAM) can overcome the linear predictor constraint of GLMs but have difficulty capturing the complex interactions among feature variables (
Verbelen et al. 2018).
Second, the standard model assumes claim frequency and claim severity are independent. In practice, empirical studies show that claim counts and amounts are often dependent and negatively correlated in auto and health insurance (see, e.g.,
Frees et al. 2011;
Garrido et al. 2016;
Gschlößl and Czado 2007;
Shi et al. 2015). Several authors have proposed mixed copula-based models linking the discrete distribution of claim counts and the continuous distribution of average claim size to deal with the dependencies (see, e.g.,
Czado et al. 2012;
Frees and Wang 2006;
Gao and Li 2023;
Krämer et al. 2013;
Shi 2016;
Shi et al. 2015;
Shi and Zhao 2020). An alternative modelling strategy is a conditional approach in which the number of claims is used as a feature variable in the GLM for the average claim size (see, e.g.,
Frees et al. 2011;
Garrido et al. 2016;
Jeong and Valdez 2020). Another approach is the multivariate conditional auto-regressive model and the multivariate Tobit model, which incorporates the correlation between the claim frequency and severity by modelling claim frequencies or accident rates at different severity levels (see, e.g.,
Aguero-Valverde 2013;
Zeng et al. 2017).
Third, GLMs assign full credibility to the data, i.e., they assume the dataset contains enough observations for the parameter estimates to be considered fully credible. In practice, in segmented property-casualty insurance portfolios such as vehicle insurance, the issue of credibility must be addressed by considering, e.g., Generalized Linear Mixed Models (GLMMs) or Elastic Net GLMs (
Katrien and Valdez 2011;
Qian et al. 2016). Fourth, GLMs belittle conceptual uncertainty in empirical modelling, with recent literature highlighting the advantages of model ensembles in risk management (see, e.g.,
Bravo 2021).
The failure to flexibly capture the nonlinear relation between the claim frequency (severity) and often overlapping risk factors in GLMs and GAMs and the availability of larger datasets, including non-conventional data, shifted the attention towards the use of machine learning and deep learning methods in motor insurance modelling.
Paefgen et al. (
2013) and
Baecke and Bocca (
2017) used, respectively, Decision Trees (DT), Artificial Neural Networks (ANN), and Random Forests (RF) to predict claim counts in Usage-based Insurance (UBI) products such as pay-as-you-drive and pay-how-you-drive.
Quan and Valdez (
2018) compared the usage of univariate and multivariate response variables when predicting frequency in several non-auto coverages using the Classification and Regression Trees (CART), RF and Gradient Boosting (GB) models.
Pesantez-Narvaez et al. (
2019) and
Meng et al. (
2022) examined the use of boosting machines in UBI claim probability prediction. The former concluded that the performance of boosting is less robust than classical logistic regression but attributed this to the small number of covariates considered in the study and the absence of hyperparameter tuning.
Fauzan and Murfi (
2018) analyse the accuracy of XGBoost in auto-insurance claim prediction and conclude that XGBoost shows increased accuracy in terms of normalised Gini when compared to the alternative methods AdaBoost, Stochastic GB, RF, and ANN.
Su and Bai (
2020) investigated the use of a stochastic gradient boosting algorithm and a profile likelihood approach to estimate parameters for both the claim frequency and average claim severity distributions in a French auto insurance dataset and concluded that the approach outperforms standard models.
To develop a full tariff plan for a Belgian TPL motor cover,
Henckaerts et al. (
2021) investigated the performance of simple regression trees, random forest, and boosted trees using the GLM as a benchmark and concluded that boosted trees outperformed GLMs. Similarly,
Noll et al. (
2020) predicted the claim frequency in a French motor TPL dataset using regression trees, GB, ANN and GLMs and concluded that GB and ANN outperformed the GLM, but also stated that the development of the benchmark model could have been improved.
Su and Bai (
2020) predicted the frequency and severity of the TPL motor cover, combining the stochastic gradient boost and a profile likelihood approach to estimate the parameters of the distributions. This work adds to previous literature by introducing the dependence between claim frequency and claim average cost using the claim frequency as a predictor in the regression model for the severity. The authors concluded that abandoning the independence assumption contributes to increasing the model performance when compared to state-of-the-art models.
Some studies focus on other covers with great exposure, such as Collision.
Staudt and Wagner (
2021) developed frequency prediction on a Swiss motor portfolio, using GLM and GAM as reference models and two random forest models, one for claim severity and the other for log-transformed claim severity. The usage of the log-normal transformation of severity did not lead to any performance gains when the random forest was applied; however, it was still the favourite choice for explaining the right-skewed claims. Globally, GAM has a better performance.
Against this background, following and summarising the obtained results in
Clemente (
2023), this paper investigates the performance of Gradient Boosting with Decision Trees as base learners to separately model the claim frequency and the claim severity distributions of an international insurer auto insurance big dataset and compare it with that obtained using a standard GLM model. Boosting is one of the most popular ensemble learning methods, in some cases complemented with a model selection from a larger model space before aggregation. The method consecutively combines a large number of base weak learners in an additive form to tackle conceptual uncertainty in empirical research, capturing the nonlinear relation between the claim counts and amounts and feature variables and their complex interactions. First, our work contributes to the recent literature (see, e.g.,
Noll et al. 2020;
Su and Bai 2020) by empirically investigating the performance of GBM and other machine learning methods to model claim frequency and severity of the TPL motor cover. In the risk management and insurance literature,
Yang et al. (
2018) developed a gradient-boosting Tweedie compound Poisson model and concluded that the model makes a more accurate premium prediction than GLM and GAM Tweedie compound Poisson models.
Zhou et al. (
2022) propose a boosting-assisted zero-inflated Tweedie model, called EMTboost, to cope with extremely unbalanced zero-inflated data.
Contrary to other machine learning methods with similar predictive accuracy, GB provides interpretable results, which makes it particularly attractive for modelling motor insurance losses. In GB models, complex interactions are simply modelled and may be included in the pricing structure. The feature selection is performed as an integral part of the application of the model, and this allows for a flexible approach when using GB models for insurance pricing. Actuaries may choose between different ways of using the potential of GB models: (a) adopt the GB model as the modelling tool to produce a new pricing structure or (b) identify statistically significant variables and interactions from the GB approach and include them on a GLM model, to improve the accuracy and prediction power of the model.
Second, our work uses a proprietary large, rich auto insurance database consisting of 0.8 million TPL vehicle insurance policies in force between 1 January 2016 and 31 December 2019, covering individuals against property damage, corresponding to 2.46 million observation duration (exposure to risk). Besides the response variables, the dataset includes 36 feature variables characterising the policyholder, the insurance policy, and the insured vehicle. This differentiates from most previous research, often using small (and selected) publicly available datasets made available for illustration purposes and research (e.g., the French Motor TPL Insurance Claims Data available in the Kaggle data repository). Third, we have implemented an extensive data pre-processing framework, including data cleaning, feature selection and engineering, outlier treatment and dimensionality reduction, as well as a detailed hyperparameter tuning approach using a nested
k-fold cross-validation resampling procedure. In TPL motor insurance, the raw data often contain missing values or inconsistent data values resulting from human or computer error or the combination of multiple databases, outliers, irrelevant or redundant information, or inconsistent formats that can negatively impact the precision and reliability of data-driven models. Previous research in multiple scientific domains concluded that data pre-processing and hyperparameter tuning positively contribute to improving the performance of machine learning and deep learning models (see, e.g.,
Chollet 2021).
A key requirement in the insurance (and financial) industry is the need for transparent and interpretable pricing models which are easily explainable to all stakeholders (e.g., managers, customers, shareholders, regulators, auditors), see, e.g.,
Kuo and Lupton (
2023). Insurance ratemaking models are highly regulated, and they must meet specific requirements (see, e.g., the regime “algorithmic accountability” of decision-making machine algorithms imposed by the European Union’s General Data Protection Regulation (
European Parliament 2016, effective 25 May 2018, in which insurers are held accountable for their pricing models in terms of transparency, fairness, and solidarity) before being deployed in practice. To respond to that requirement, in this paper, we estimate two important tools to interpret the GB model, namely, variable importance measures and partial dependence plots.
The remainder of the paper is structured as follows.
Section 2 summarises the GBM model used in the paper.
Section 3 details the empirical strategy adopted, including the dataset information, the data pre-processing framework, and the hyperparameter tuning approach.
Section 4 presents and discusses the main results.
Section 5 concludes and sets out the agenda for further research.
2. Gradient Boosting Machines
A common task in the application of statistical learning, machine learning and deep learning methods in finance, insurance, and risk management is to develop a parametric or non-parametric classification, regression, or ranking model from the data. Empirical work in these domain-specific areas is subject to significant uncertainty about model specification. This may be the consequence of the lack of a universally accepted theory that has been empirically verified as a (near) perfect explanation of reality (theory uncertainty), the multiple ways in which theories can be empirically tested (specification uncertainty), heterogeneity uncertainty and variable independence (
Steel 2020).
One way to circumvent model uncertainty is to pursue a data-driven approach, learning the model directly from the data. The customary approach to data-driven modelling is to neglect model risk and pursue a “winner-takes-all” perspective by which, for each dataset, a unique believed to be the “best” model is selected from a set of candidate (weak) learners using some method or statistical criteria (goodness-of-fit, predictive), see
Bravo and Ayuso (
2021). The statistical inference then proceeds conditionally upon the assumption that the selected model happens to be a good approximation to the true data generating process.
To tackle conceptual uncertainty and overcome the shortcomings of individual learners, an alternative approach is model combination, i.e., building an ensemble of (homogeneous or diverse) classifiers (e.g., artificial neural networks, support vector regressions, GLMs, recurrent neural networks), often complemented with a model selection from a larger model space before aggregation
Jose and Winkler (
2008). Ensemble methods aim at finding a static or dynamic composite model that better approximates the actual data generation process and its multiple sources of uncertainty. Empirical studies show that they can provide superior predictive accuracy relative to single learners in several domain-specific areas (
Ashofteh et al. 2022;
Ayuso et al. 2021;
Bravo 2021;
Kim and Baek 2022). Examples of successful applications of machine-learning ensemble techniques in different domains include random forests (
Breiman 2001), artificial neural network ensembles (
Hansen and Salamon 1990;
Shu and Burn 2004), Bayesian model ensembles (
Bravo and Ayuso 2021;
Raftery et al. 1997), bootstrap aggregating (bagging), boosting and meta-learning strategies for expert combination such as stacking (
Ashofteh and Bravo 2021;
Wolpert 1992), arbitrating (
Ortega et al. 2001), dynamic combiners (
Sergio et al. 2016) or mixture of experts (
Jacobs et al. 1991).
In gradient boosting machines, the learning process proceeds by consecutively building an ensemble of shallow and weak base-learners (e.g., linear models, smooth models, or decision trees), with each step learning and improving on the previous one to form a committee that is capable of accurate estimating the response variable. The algorithm is constructed such that the new base learners are maximally correlated with the negative gradient of the loss function (e.g., squared-error loss, Adaboost) of the whole ensemble (
Friedman 2001). The approach is quite flexible and can be customised to any data-driven task and has proven considerable achievement in real-world applications (
Hanafy and Ming 2021;
Henckaerts et al. 2021).
Formally, let
y denote a random response variable and
a set of input or predictor variables
. Using a training sample
of known
-values, the goal is to obtain an estimate of the approximation
of the function
mapping the unknown functional dependence
, that minimises the expected value of some specified loss function
over the joint distribution of all
-values,
possibly complemented by a weights function
. For instance, for claim frequency modelling, the weight is the exposure to risk, typically the number of policy years, and the response variable is the number of claims divided by
. In claim severity modelling exercises, the weight is the number of claims, with the average claim size (claims cost divided by the number of claims) as the response variable.
To make the estimation problem tractable, a common procedure is to restrict the function search space to a member of a parametric family of functions
, where
is a finite set of parameters whose joint values identify the individual learners. Following
Friedman (
2001), in this paper, we focus on a class of additive expansions of the form
where
is a base or weak learner function of the input variables with parameters
. Choosing a parametric model transforms the function optimisation problem into a parameter optimisation problem:
Given
M iteration steps, the parameter estimates can be written in the incremental form. For
, we can write
with incremental steps or “boosts” defined by the optimisation method
The numerical optimisation is resolved by GBM through a two-step process using the steepest-descent algorithm, which is based on consecutive improvements along the direction of the gradient of the loss function in which, for each interaction, the pseudo-residuals are used to assess the regions of the predictor space for which the model does not have a good performance, and therefore improve the fit in the direction of better overall performance. In this paper, we consider decision trees as base learners
. This means parameters
are the splitting variables and splitting points that define the tree, and the base learner is of the following form:
where
is the mean of the pseudo-residuals
for observation
i in iteration
m over the region
, forming a subdivision of the space
R where the vector
takes its values. Decision trees are commonly selected as base learners in gradient boosting because: (i) of their ability to capture complex interactions and nonlinear relationships in the data, creating splits and branches to signify intricate decision boundaries, which are crucial when dealing with datasets containing nontrivial patterns, (ii) they inherently provide feature importances, helping the algorithm to identify and focus on the features which contribute the most to reducing the prediction error, (iii) of their flexibility and adaptability, since they can fit both micro and macro trends in the data and error correction mechanisms, (iv) of their interpretability, since single decision trees are relatively easy to read and visualize, helping in understanding the model’s decision-making process, a crucial element in insurance pricing and risk management, (v) of their robustness to outliers and capacity to handle missing data, (vi) of is capacity to generate ensemble diversity through feature selection, alternative splitting criteria and different depth levels, (vii) of their computational tractability when compared to some other machine learning algorithms, making it feasible to work with large datasets such as in this study. Since the value of the base learners
is constant for each region of the tree,
can be simplified to
and Equation (
4) re-written as:
with incremental boosts for each region
updated using
with
the learning rate (also known as the shrinking parameter) determining the learning pace of the algorithm by shrinking updates for
. A lower value of
outputs a better performance, reducing overfitting but also increasing the computational power required because more trees are necessary for the algorithm to minimise the pseudo-residuals and to converge. Usually,
is fixed at the lowest value possible within the computational restraints (
Henckaerts et al. 2021). The performance of the GBM model investigated in this paper is tested against the results provided by the benchmark GLM approach. The model fitting, forecasting, simulation procedures, and additional computations have been implemented using an R (version 4.2.0) software routine.
5. Conclusions
Modelling claim frequency and claim severity is a critical task in ratemaking in property-casualty insurance. The type of data available for this exercise typically includes risk factors (policy details, policyholder information, insured vehicle characteristics, driving records) and numerical response variables, making statistical learning and supervised machine learning methods particularly suitable for this task. Generalised Linear Models are the industry benchmark for developing analytic insurance pricing models. The standard GLM and GAM frequency–severity models assume a linear or additive relationship between the response variable and the feature variables, that the claim risk and claim severity are independent, and tend to assign full credibility to the data.
To overcome these restrictions, this paper investigates the predictive performance of Gradient Boosting with decision trees as base learners to model the claim frequency and the claim severity distributions of an auto insurance big dataset and compare it with that obtained using a standard GLM model. The gradient boosting algorithm is a machine learning method for optimising prediction accuracy carrying out variable selection, particularly useful in the context of high-dimensional data. The model results in prediction rules which share some interpretability characteristics as the standard statistical model fits. The gradient boosting algorithm combines learners with “poor” performance (high prediction error) as regression or classification trees to produce a highly accurate prediction rule with easily interpretable results.
The use of gradient boosting models with decision trees as base learners in auto insurance ratemaking permits the segmentation of a portfolio of policyholders into groups of homogeneous risk profiles based on some feature variables, inducing transparency and intra-group risk pooling under common asymptotic (group size) conditions. The use of ensemble (model combination) techniques combining multiple decision trees instead of selecting single learners addresses conceptual uncertainty concerns in responsible insurance pricing and provides a sounder basis for statistical inference. Ensemble models aim to find a composite model that better approximates the actual data generation process and its multiple sources of uncertainty. They have a long tradition in the statistical and forecasting literature, yet they are relatively underexplored in insurance pricing (
Bravo 2021). A fundamental part of successfully training machine learning models is to control model complexity and overfitting, considering the bias-variance trade-off. Instead of relying on built-in tuning strategies, we performed an extensive grid search procedure using nested cross-validation among a predefined tuning grid for evaluating and comparing the performance of the learning algorithms and tuning machine learning hyperparameters and for analysing the stability of the results across multiple data folds.
The results of the out-of-sample performance measure show that the predictive performance of the Gradient Boosting model is superior to that of the standard GLM model in the Poisson claim frequency model. On the contrary, in the claim severity model, the classical GLM significantly outperformed the GBM. The findings for the claim frequency model suggest gradient boosting models can capture the nonlinear relation between the response variable and risk variables and their complex interactions and are thus a valuable tool for feature engineering and the development of a data-driven approach to auto insurance ratemaking and risk management. The poorer performance of the GBM model in the claim severity model may be explained by the small sample size available for training the model and the significant volatility of the claim amount distribution.
Regarding model interpretation, the variable importance measures allowed us to identify the most relevant variables in the frequency and severity models. The finding also shows that the variable importance scores can fluctuate according to the cross-validation number of folds used in tuning the GBM model. An interesting result for both the claim frequency and the claim severity model is that the most important risk factors in the gradient boosting machines are those selected in the corresponding GLMs. A similar conclusion was obtained by
Henckaerts et al. (
2021) using a portfolio of motor Third Party Liability from a Belgian insurer in 1997. The results suggest, however, that the GBM approach has a slightly higher capability of selecting the feature variables that best differentiate claim frequency and claim severity risks in TPL auto insurance. The fact that both models include a similar selection of risk factors means gradient boosting models can assist in the selection of the candidate feature variables (and their complex interactions) to consider in the tuning of the GLM to be used in pricing and risk management.
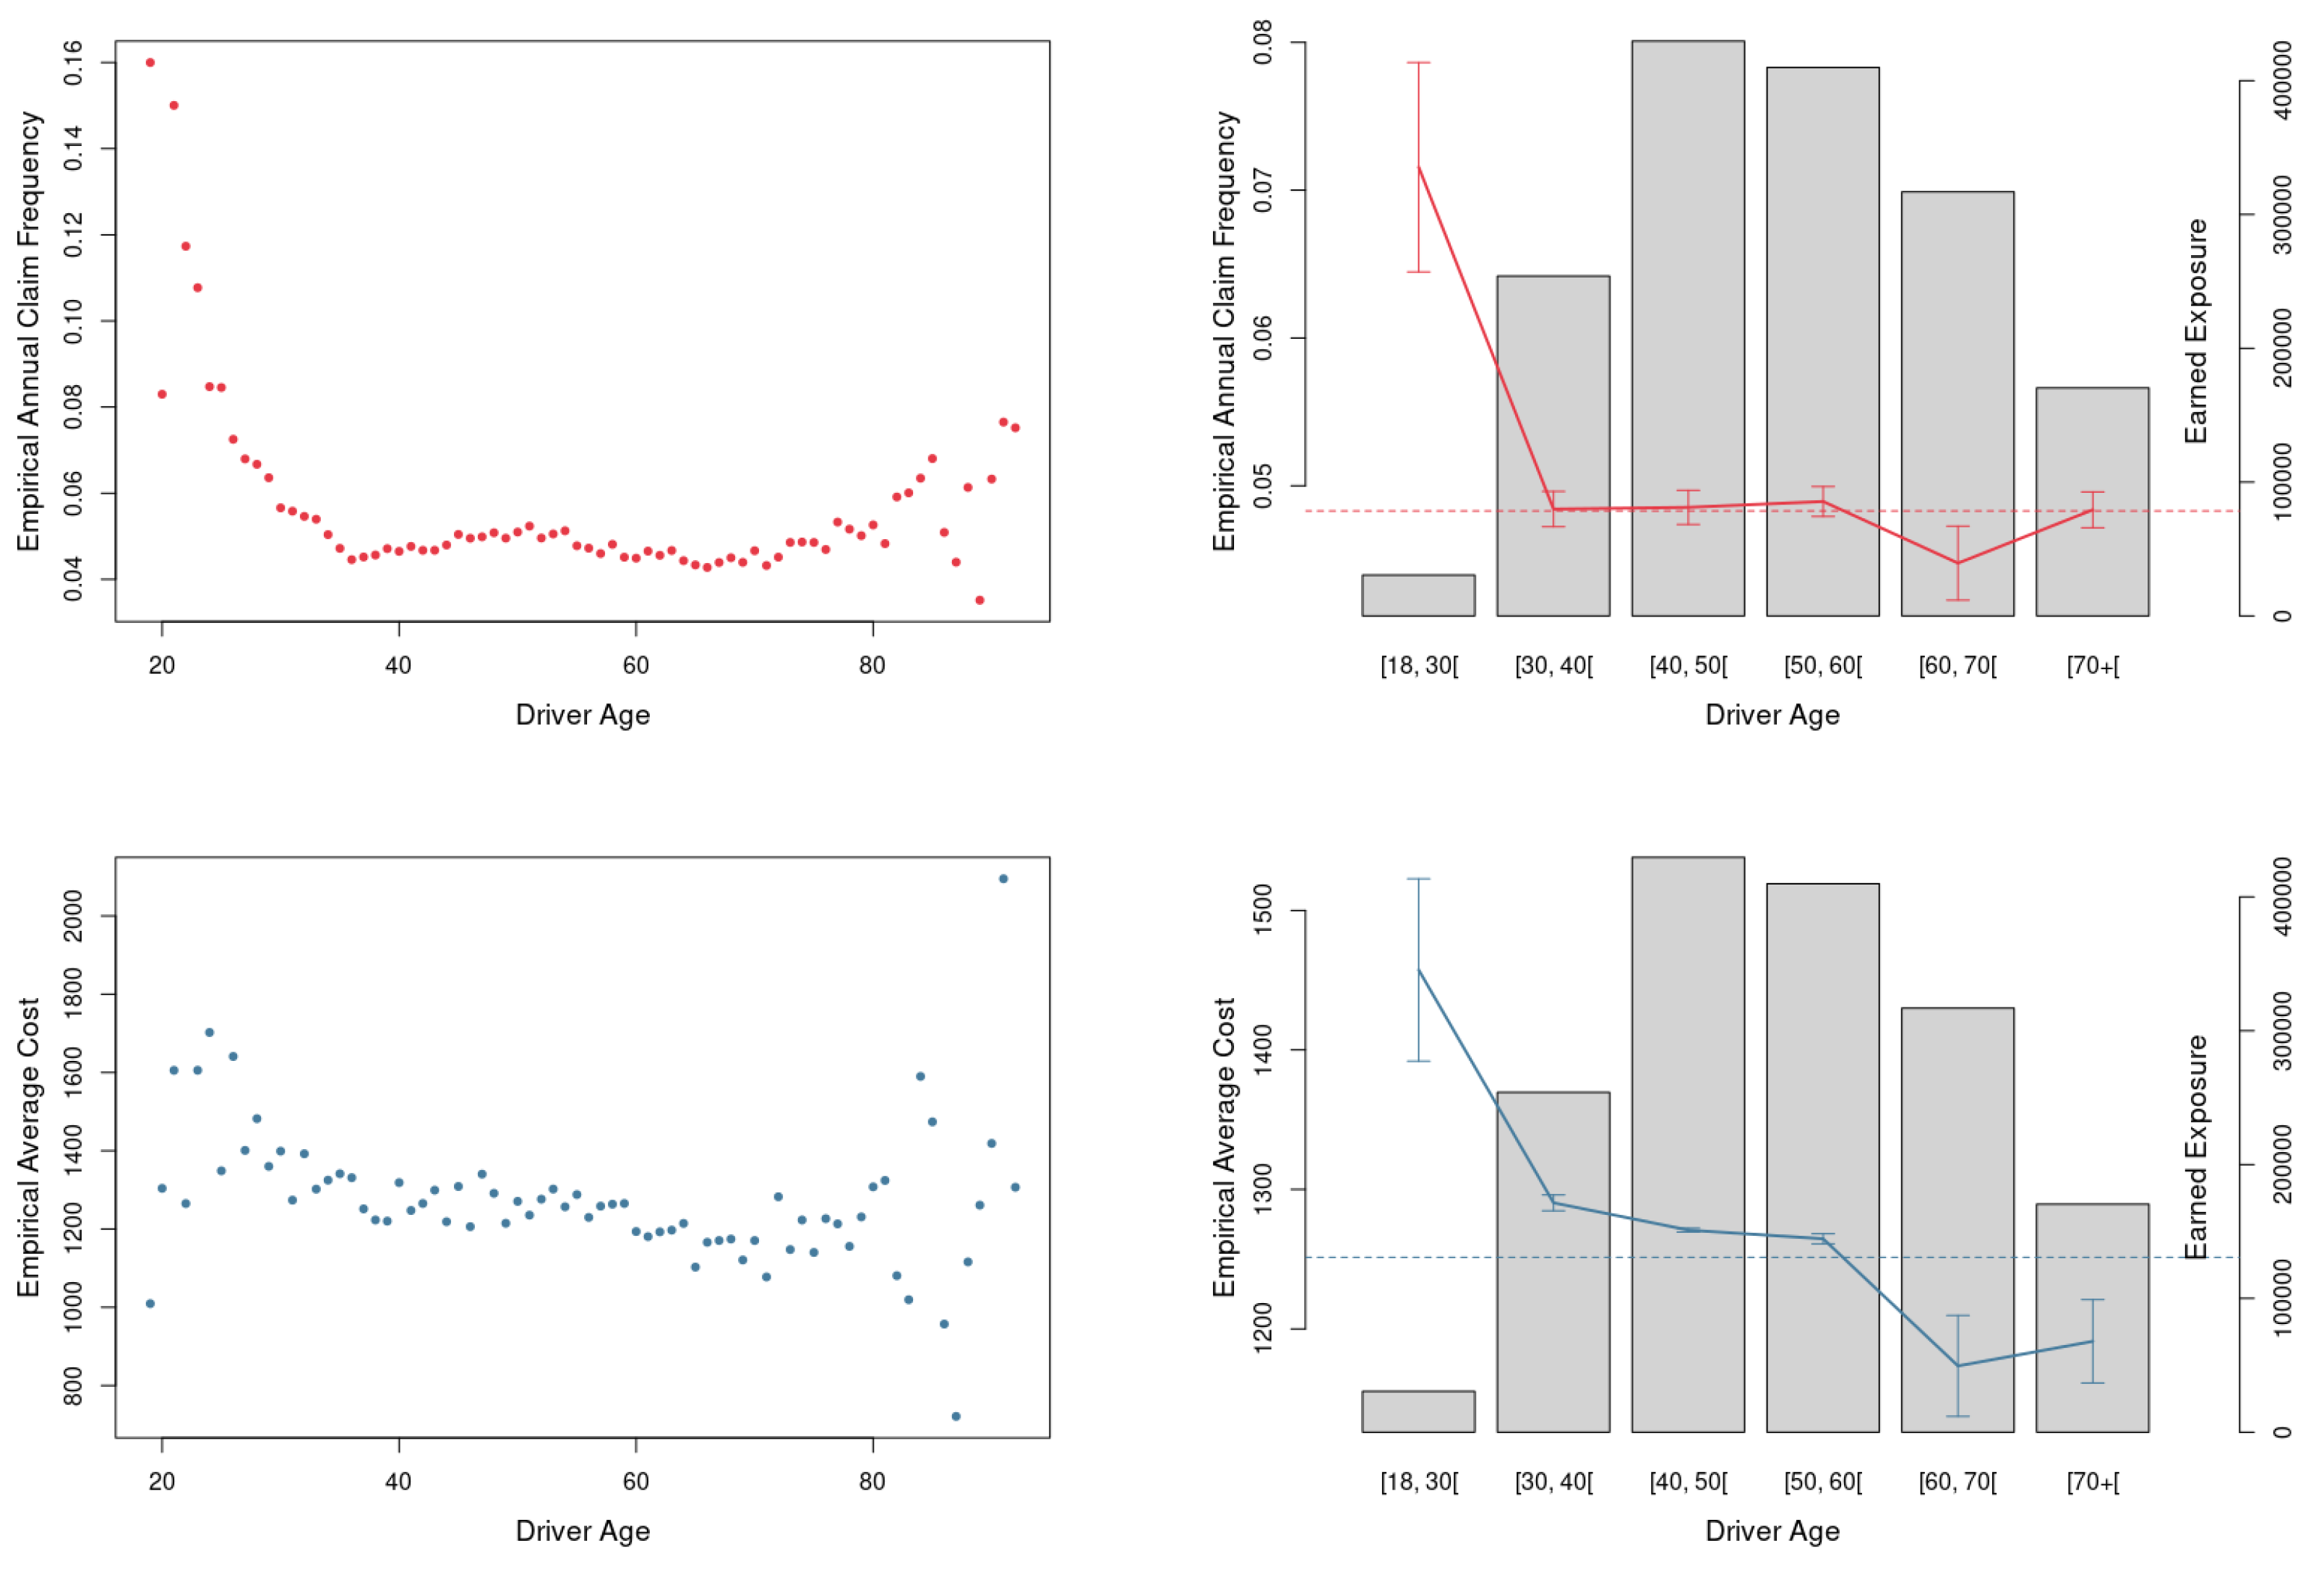
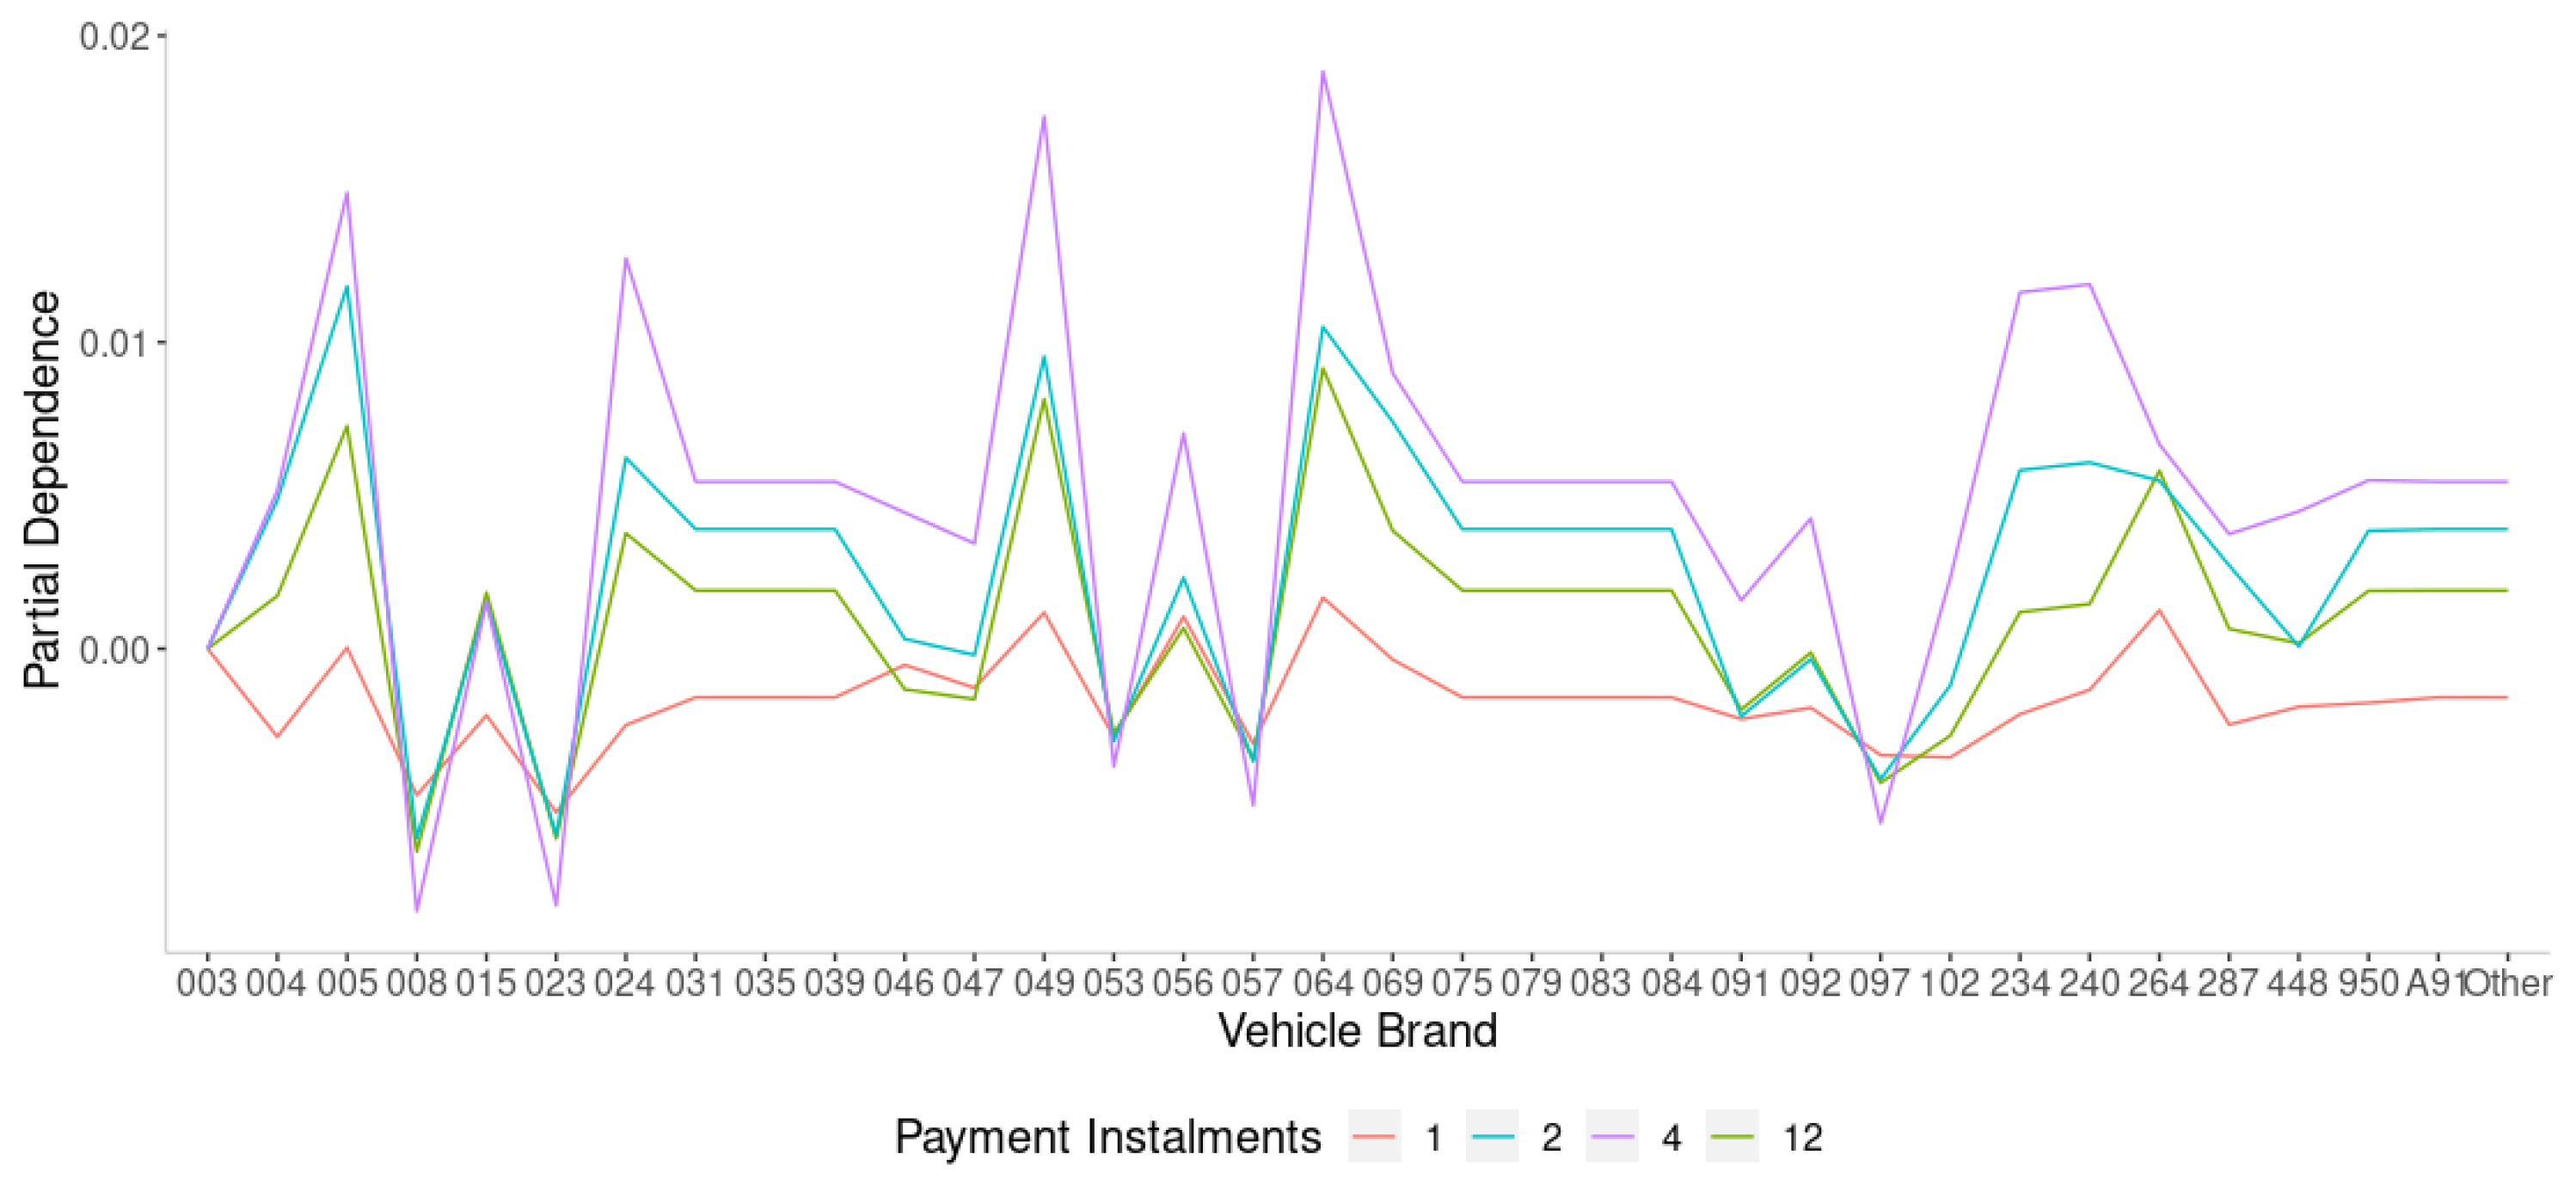
The partial dependence plots and individual conditional expectation plots provide additional insight into a selection of noteworthy effects for the claim risk model. An important and well-known effect in auto insurance pricing detected by PDP and ICE plots is the interaction between driver age and driving experience and claim frequency and severity. The results highlight a clear inverse relationship between driver age and claim severity, with younger drivers more likely to have a serious accident. Further research should investigate the performance of GBM against other supervised machine learning methods (e.g., Random Forest, Classification and Regression Tree, K-Nearest Neighbours, and Artificial Neural Networks-based models).


