Article

External Wetting Efficiency in a Three-Phase Fixed Bed Loaded with Porous and Non-Porous Packings

1
State Key Laboratory of Chemical Engineering, East China University of Science and Technology, Shanghai 200237, China
2
State Key Laboratory of Molecular Engineering of Polymers, Department of Macromolecular Science, Fudan University, Shanghai 200438, China
*
Author to whom correspondence should be addressed.
Processes 2022, 10(1), 135; https://doi.org/10.3390/pr10010135
Submission received: 12 December 2021 / Revised: 25 December 2021 / Accepted: 6 January 2022 / Published: 10 January 2022
(This article belongs to the Special Issue Electroreduction of CO2: Novel Device and Engineering Innovation)

Abstract

:
Films and rivulets are the two basic forms of dynamic liquid in a three-phase fixed bed (trickle bed), which determines the wetting efficiency of the catalyst. This paper is devoted to the conflicting wetting performance observed between non-porous glass beads and less wettable porous alumina, and a parallel zone model is applied to resolve the complex liquid flow texture. It shows in both cases of glass beads and aluminium pellets, the pressure drop, film flow and rivulet flow fractions all display pronounced multiplicities along with the liquid flow rates in increasing and decreasing branches, although the rivulet flow fraction is reduced to 0 in the liquid decreasing branch started from pulsing flow in both cases. Different from the glass beads, there is almost no wetting efficiency difference for the alumina pellets with respect to liquid flow rate increasing or decreasing, which is in agreement with the dynamic liquid holdup measurements. The liquid is significantly more uniformly distributed over the crosssection in the Al2O3 bed since rivulet flow is much reduced than in the case of glass beads.

1. Introduction

A three-phase fixed-bed or trickle-bed reactor has been successfully applied in the traditional field of hydrogenation of petroleum fractions [1,2], waste organics oxidation [3,4], etc., and its application in the new area of biomass conversion is growing rapidly, as is shown in sugar hydrogenation [5,6], the hydrodeoxygenation of palm oil [7], aqueous phase reforming [8] and biological methanation [9]. In designing a trickle-bed reactor, the liquid–solid contacting condition, which is characterized by the external wetting efficiency, η ce , is of central importance for the safe and efficient operation of the reactor [10,11]. Since η ce is generally defined as the fraction of catalyst surface covered by flowing liquid, while according to Zimmerman and Ng [12], the flowing liquid includes the film and rivulet, decomposition of the complex liquid flow texture into individual components is key to the determination of wetting efficiency.
In the past few decades, visualization techniques have been developed to provide direct observation of liquid wetting morphology. Lutran et al. [13] reported that the rivulet flow shape varied because of splitting and coalescence with computer-assisted tomography (CAT). The film flow, rather than rivulet flow, prevails in a prewetted bed. Similar results were also observed by Sederman and Gladden [14]; they found the number of rivulets significantly increased with the increase in liquid velocities by using magnetic resonance imaging (MRI). With the high spatial resolution of X-ray CT, van der Merwe et al. [15] proved the dynamic liquid was randomly distributed in the trickle bed in the form of films and rivulets. Recently, Salleh et al. [16] measured the interstitial liquid velocity in a trickle bed reactor by combination of the X-ray Digital Industrial Radiography (DIR) and Particle Tracking Velocimetry (PTV) techniques. The measured maximum local liquid velocity ranges between 4 and 4.7 times its superficial value, which means different patterns of liquid flow coexist. This shows that despite the complex liquid flow texture being detected qualitatively by the current experimental technology, a quantitative description is not available.
In addition to experimental studies, computational fluid dynamics (CFD) is also widely used to investigate the hydrodynamic characteristics of trickle beds. The film and rivulets can easily be distinguished with fine mesh resolution with the VOF method [17,18]. However, the computational resources required for a VOF method are enormous; therefore, almost all studies are conducted at the micro and mesoscopic scales, and it is difficult to predict the liquid flow texture on the bed scale. As for the Euler–Euler method, which disregards the phase interface of two or more immiscible fluids, it can only be used in pressure drop, liquid holdup, and liquid distribution predictions in a trickle bed [19,20].
As a result, up to now, catalyst external wetting efficiencies are all determined from indirect methods, rather than from the liquid flow texture modeling approach:
(1)
The tracer method [21,22,23,24,25]. The wetting efficiency is defined as the square root of the ratio of the apparent diffusivity of the tracer in a porous particle in a trickle-bed reactor to the diffusivity obtained in a liquid-full reactor. Diffusivities are obtained from the variance of the impulse response of the tracer. Based on a comprehensive theoretical analysis, Julcour-Lebigue et al. [26] demonstrated that under the usual low axial dispersion conditions, factors including the external mass transfer resistance, adsorption of the tracer, flow pattern of the wetted zone, and heterogeneity of wetting on the reactor scale have only a slight effect on the wetting efficiency and, therefore, wetting efficiency can accurately be evaluated from RTD data. The tracer technique has been compared satisfactorily to the direct measurements of partial wetting obtained by dye adsorption [27,28]. In another work by Lappalainen et al. [29], in a hydrodynamic model establishment for wetting efficiency, all wetting efficiency data points were recommended to be obtained from the tracer method, in view of the high reliability of this method.
(2)
The dye adsorption method [27,28,30,31]. Wetting efficiency can be obtained at the pellet scale using this method by colorimetric tracing via dye adsorption. However, this method requires tedious experimental work, since the packing can only be used once and needs to be replaced by a fresh one for the next run. The reactor should be disassembled several times to obtain cross-sectional photographs of the packing.
(3)
The hydrodynamic method. Pironti et al. [32] and Kundu et al. [33] applied the shear stress method for wetting efficiency evaluation by comparing the liquid–solid shear stress times of the specific area in the two-phase flow to that in a liquid-full bed at the same intrinsic liquid and gas velocities. The advantage of this method is that the wetting efficiency can be determined directly from the pressure drop and liquid holdup measurements, which is quite convenient compared to the tracer and colorimetric methods. Its accuracy needs to be improved in view of the remarkable discrepancy from the literature reports. On the other hand, the liquid morphology observation has also been used for the wetting efficiency estimation, as shown in the work of Sederman and Gladden [14]. The authors attempted to obtain the wetting efficiency from the fraction of surface voxels that contain liquid. A wetting efficiency of 0.56 was obtained at a liquid flow rate of 5.8 mm·s−1 and gas superficial velocity of 66 mm/s. This shows that the MRI method appears to be a very promising tool for obtaining flow features and quantitative analysis.
(4)
The reaction method. This method was initially proposed by comparison of reaction rates in a two-phase operation and in a reactor completely filled with liquid [34,35]. An innovative parallel hydrogenation for the quantification of wetting efficiency in a trickle-bed reactor was introduced by van Houwelingen and Nicol [36]. In this method, the reaction rates of two first-order liquid-limited hydrogenation reactions occurring in parallel were measured under upflow and trickle flow conditions. The higher conversion in the upflow operation was explained by the complete wetting and better liquid–solid mass transfer characteristics.
The purpose of this work is to clarify the long-held confusion on the conflicting wetting performance observed in non-porous glass beads and porous alumina pellets. It is known that the advancing contact angle of water in the presence of air over glass beads is less than 15° [37], whereas it is more than 70° [38] or 65° [28] over porous alumina pellets. Despite the lower contact angle of water over non-porous glass beads and, thus, greater expected wettability and stronger liquid spreading, contrary results are observed. The less wettable alumina pellets show a better liquid spreading than the glass beads in a non-prewetted bed, and the prewetted bed behaves in the same fashion for these two pellets [39]. To explain this extraordinary phenomenon, Khanna and Nigam [40] and Maiti et al. [38,41] modeled the alumina pellet surface as alternating patches of pores and solid surface. As liquid spreads over the alumina pellets surface, the spreading over the solid surface is very similar to the spreading on a non-porous surface and is governed by the contact angle of the liquid. On the other hand, a liquid-filled pore acts as a completely wetted surface; the saturated pores are thought to act as “attractors” for the moving liquid flow. Consequently, the spreading over the alumina pellets surface is governed by the pore of the surface rather than by the contact angle of the liquid. More recently, with high-resolution gamma ray tomography at a spatial resolution of about 2 mm, Schubert et al. [42] also observed very different hydrodynamic behavior for the non-porous glass beads and porous Al2O3 support, that at 100 mm downstream below the top of the packing the dynamic liquid was significantly more uniformly distributed over the cross-section in the Al2O3 bed than in the glass bed, which indicates that there is no liquid rivulets in Al2O3 bed. It can be assumed that only film flow prevails over the Al2O3 packing in the prewetted porous bed. Their finding is consistent with the conclusion of Maiti et al. [38] that the external wetting of the porous catalyst surface can lead to internal wetting due to capillary forces, and the internal wetting further leads to more enhanced external wetting. However, there is no further investigation on this subject. In this work, the assumption of Schubert et al. [42] will be evaluated from the calculation of film flow fractions for the two kinds of packing.

2. Liquid Flow Texture Modeling

Pressure drop and liquid holdup hysteresis indicate the existence of multiple hydrodynamic states in the liquid flow rate’s increasing and decreasing branches. In the liquid flow rate’s increasing branch, it is difficult to realize uniform gas–liquid distribution at low liquid velocity, and the single-phase flow may occur in some parts of bed cross-section. The trickle bed can be classified into a gas zone, a liquid zone, and a two-phase flow zone with the same pressure drop [43]. However, uniform distribution of gas–liquid flow is observed when reaching pulsing flow and tends to persist in the liquid flow’s decreasing branch. The reason is that compared to the dry bed, a smaller liquid velocity is required to maintain the film flow on the already wetted bed.
To predict the liquid flow texture, the parallel zone model by Wang et al. [43] was further developed into a liquid flow texture model by Cheng et al. [44], which is shown in Figure 1.
The volumetric fractions of the three liquids are denoted as Φ stag , Φ   film and Φ   riv , with the total of them equaling 1. In addition, the liquid film zone is controlled by a two-phase flow equation, the stagnant liquid zone by a gas-phase flow equation, and the rivulet zone by a liquid-phase flow equation. Equation (1) is proposed for the prediction of η ce , since it is believed that the contribution of the film is different from the rivulet due to their different morphologies:
η ce = Φ film 2 3 + Φ riv
It was shown that Equation (1) has much better agreement with the empirical correlation of Mills and Duduković [24] than the form of η ce = Φ film + Φ riv .
The variables Φ   film and Φ   riv are obtained as below:
Φ   film = ε   film ε L , d *
where ε L , d * is the dynamic liquid holdup at the pulsing flow inception point, under which conditions, the bed is completely wetted.
Similar to Equation (2), the fraction of rivulet flow is written as:
Φ   riv = ε   L , d ε   film , ε L , d *
where ε L , d denotes the dynamic liquid holdup, which is composed of the contributions from the liquid film and rivulet.
In view of the volumetric conservation of the liquid phase, the fraction of stagnant liquid is therefore obtained:
Φ stag = 1 Φ film Φ riv
The above definition guarantees that Φ   film + Φ   riv = 1.0 and Φ stag = 0 under pulsing flow, since ε L , d = ε L , d * .
In the following steps, the liquid holdup in the film flow, ε   film ,   L , will be firstly determined, and the two-phase flow equation can be resorted to, as suggested by Sáez and Carbonell [46]:
ψ G = 1 k G A Re G Ga G + B Re G 2 Ga G
where ψ G is the dimensionless pressure drop:
ψ G = 1 ρ G g Δ P G Δ Z
k G is the gas phase permeability coefficient; Re G is a modified Reynolds number for the gas defined as ρ G u G d p / μ G 1 ε b ; A = 180 and B = 1.8 are the Ergun equation coefficients.
From ψ G , k G can be obtained from Equation (5). In general, k G can be correlated with the gas phase saturation S G according to Equation (7):
k G = α S G β
with
S G = 1 ε L ε b
The coefficient α and power β in Equation (7) are estimated from a logarithmic plot of k G against S G . S G is the obtained liquid holdup measurements according to Equation (8).
In Equation (7), it is anticipated that as S G approaches 1.0, k G should be 1.0 as well. Hence, a large deviation of α from 1 would suggest a poor physical relationship between k G and S G . In gas–liquid flow, α = 1 means the flow texture is completely in film flow, while a large deviation from 1 means the liquid flow is a mixture of several flow patterns, and the two-phase pressure drop cannot be accurately predicted with the permeability concept of Equation (1).
It should be noted that Equations (5)–(8) are only valid for film flow; therefore, if the correlation Equation (7) is established, S G will be obtained from k G , and then ε   L is known from Equation (8). Furthermore, if Equation (7) is obtained under the complete film flow condition, ε   L will be equal to ε   film . On the other hand, if the experiments were conducted under a complex flow texture condition with both the film and rivulet in parallel, the specific ε   L obtained from Equations (7) and (8) will also be equal to ε   film . In this way, ε   film will be firstly discriminated from the total dynamic liquid holdup ε   L .
In this work, to check the validity of the liquid flow texture-based wetting efficiency formula of Equation (1), the correlation of Mills and Duduković [24] is used as a criterion:
η ce = tanh 0.664 Re L 0.333 F r L 0.195 W e L 0.171 a t d p ε b 2 0.0615
This correlation was established for the Al2O3 pellets, comprehensively correlated by four well-defined dimensionless groups accounting for different properties of the system. The correlation was reported to have a high accuracy with an average error of 0.3% and a standard deviation of 3.5% in a large interval of superficial liquid mass velocity of 0.1 to 1.0 kg/(m2·s).

3. Experimental Work

The trickle bed reactor was made of a transparent Plexiglass column of 14 cm for the inside diameter and was packed to a height of 1 m. Glass beads of 1.9 mm and alumina pellets of 1.6 mm are used as the packing, with their properties shown in Table 1. Air and deionized water were used as the gas–liquid fluids and all the experiments were conducted under ambient pressure and temperature.
According to the theoretical analysis of Equation (7), liquid flow texture with only a pure film is required. It is known that pure film flow cannot be achieved with liquid flow rate starting from low to high. However, when the liquid flow rate is reduced from the pulsing flow transition point, i.e., the upper endpoint of the hysteresis loop, the liquid will be primarily in the form of film due to the vigorous gas–liquid mixing. This leads to a larger amount of gas–liquid interfacial interactions than the rivulet flow and results in a higher pressure gradient, in turn, sustaining the films and preventing them from reverting back to rivulets [13,47,48,49].
To make the pressure drop and liquid holdup data reproducible, the bed was first prewetted under gas–liquid pulsing flow conditions for 15 min. After that, the gas and liquid were stopped simultaneously, and the bed was left to drain for 30 min. In each run, the gas flow rate was kept constant, while the liquid flow rate was varied in an increasing mode from 0 to pulsing flow and was then decreased to 0. The liquid holdup under each pair of gas and liquid flow rates was measured by draining the bed, and the pressure drop was measured by pressure transducers.

4. Results and Discussion

4.1. Experimental Results

4.1.1. The Static Liquid Holdup

The measured static liquid holdups for glass and alumina pellets are shown in Table 1, which are 0.0499 for glass and 0.0745 for alumina pellets. Compared with the correlation of Sáez and Carbonell [46], as shown in Equations (10) and (11), the agreement is excellent for the glass beads, while the discrepancy for alumina pellets is up to 50.1% higher than the prediction of Equation (10).
ε s = 1 20 + 0.9 E o ¨
with
E o ¨ = ρ L g d p 2 ε b 2 σ 1 ε b
Normally, the static liquid holdup is around 0.05. Although, this can decrease from 0.05 to 0 when E o ¨ is varied from 0 to 103, according to Kramer [50].
Nevertheless, a much higher static liquid holdup can be predicted by a different correlation proposed by Sáez et al. [51], which is derived from a system of glass beads from 0.5 to 4 mm in diameter, with water, methanol and kerosene as the liquid phase:
ε s = 0.11 1 + E o ¨
This correlation is established for E o ¨ from 0.01 to 10, and ε s up to 0.11 can be obtained if E o ¨ is close to 0. Since ρ L , ε b and σ do not vary too much, a very low E o ¨ can only be obtained in the case of a very small packing diameter. In explaining the packing size effect, Sáez et al. [51] proposed that if the pellets are small enough, the liquid retained in the bed is no longer in the pendular menisci formed at the contact point between the pellets, but in the form of liquid blobs that engulf several pellets. Essentially, a static holdup equal to the bed porosity can be obtained by this mechanism of liquid retention. The packing size effect is also reported by Ortiz-Arroyo et al. [52], who shows that among factors including pellet size, surface tension, liquid density, bed porosity, and sphericity, only pellet size can be regarded as a sensitive one, which would give rise to a high static liquid holdup. As shown in Figure 6a in their paper, ε s may increase rapidly to 0.14 with the decrease in pellet size in the region of less than 1 mm.
Based on the above analysis, it may be interesting to guess whether the high static liquid holdup for alumina pellets is due to packing size effect. From Equation (12), E o ¨ = 0.476 is predicted to correspond to ε s = 0.0745, and the packing diameter d p is predicted to be 3.32 mm according to Equation (11). Since the actual diameter of 1.6 mm is much smaller than the theoretically predicted packing diameter, packing size is not the reason for the difference between alumina and glass packings. Therefore, the only reasonable reason for the larger static liquid holdup for the alumina pellets is due to the numerous liquid-filled pores over the external surface of the alumina pellets, which provide much stronger adhesive forces than the glass surface to the liquid.

4.1.2. Hysteresis in Dynamic Liquid Holdup

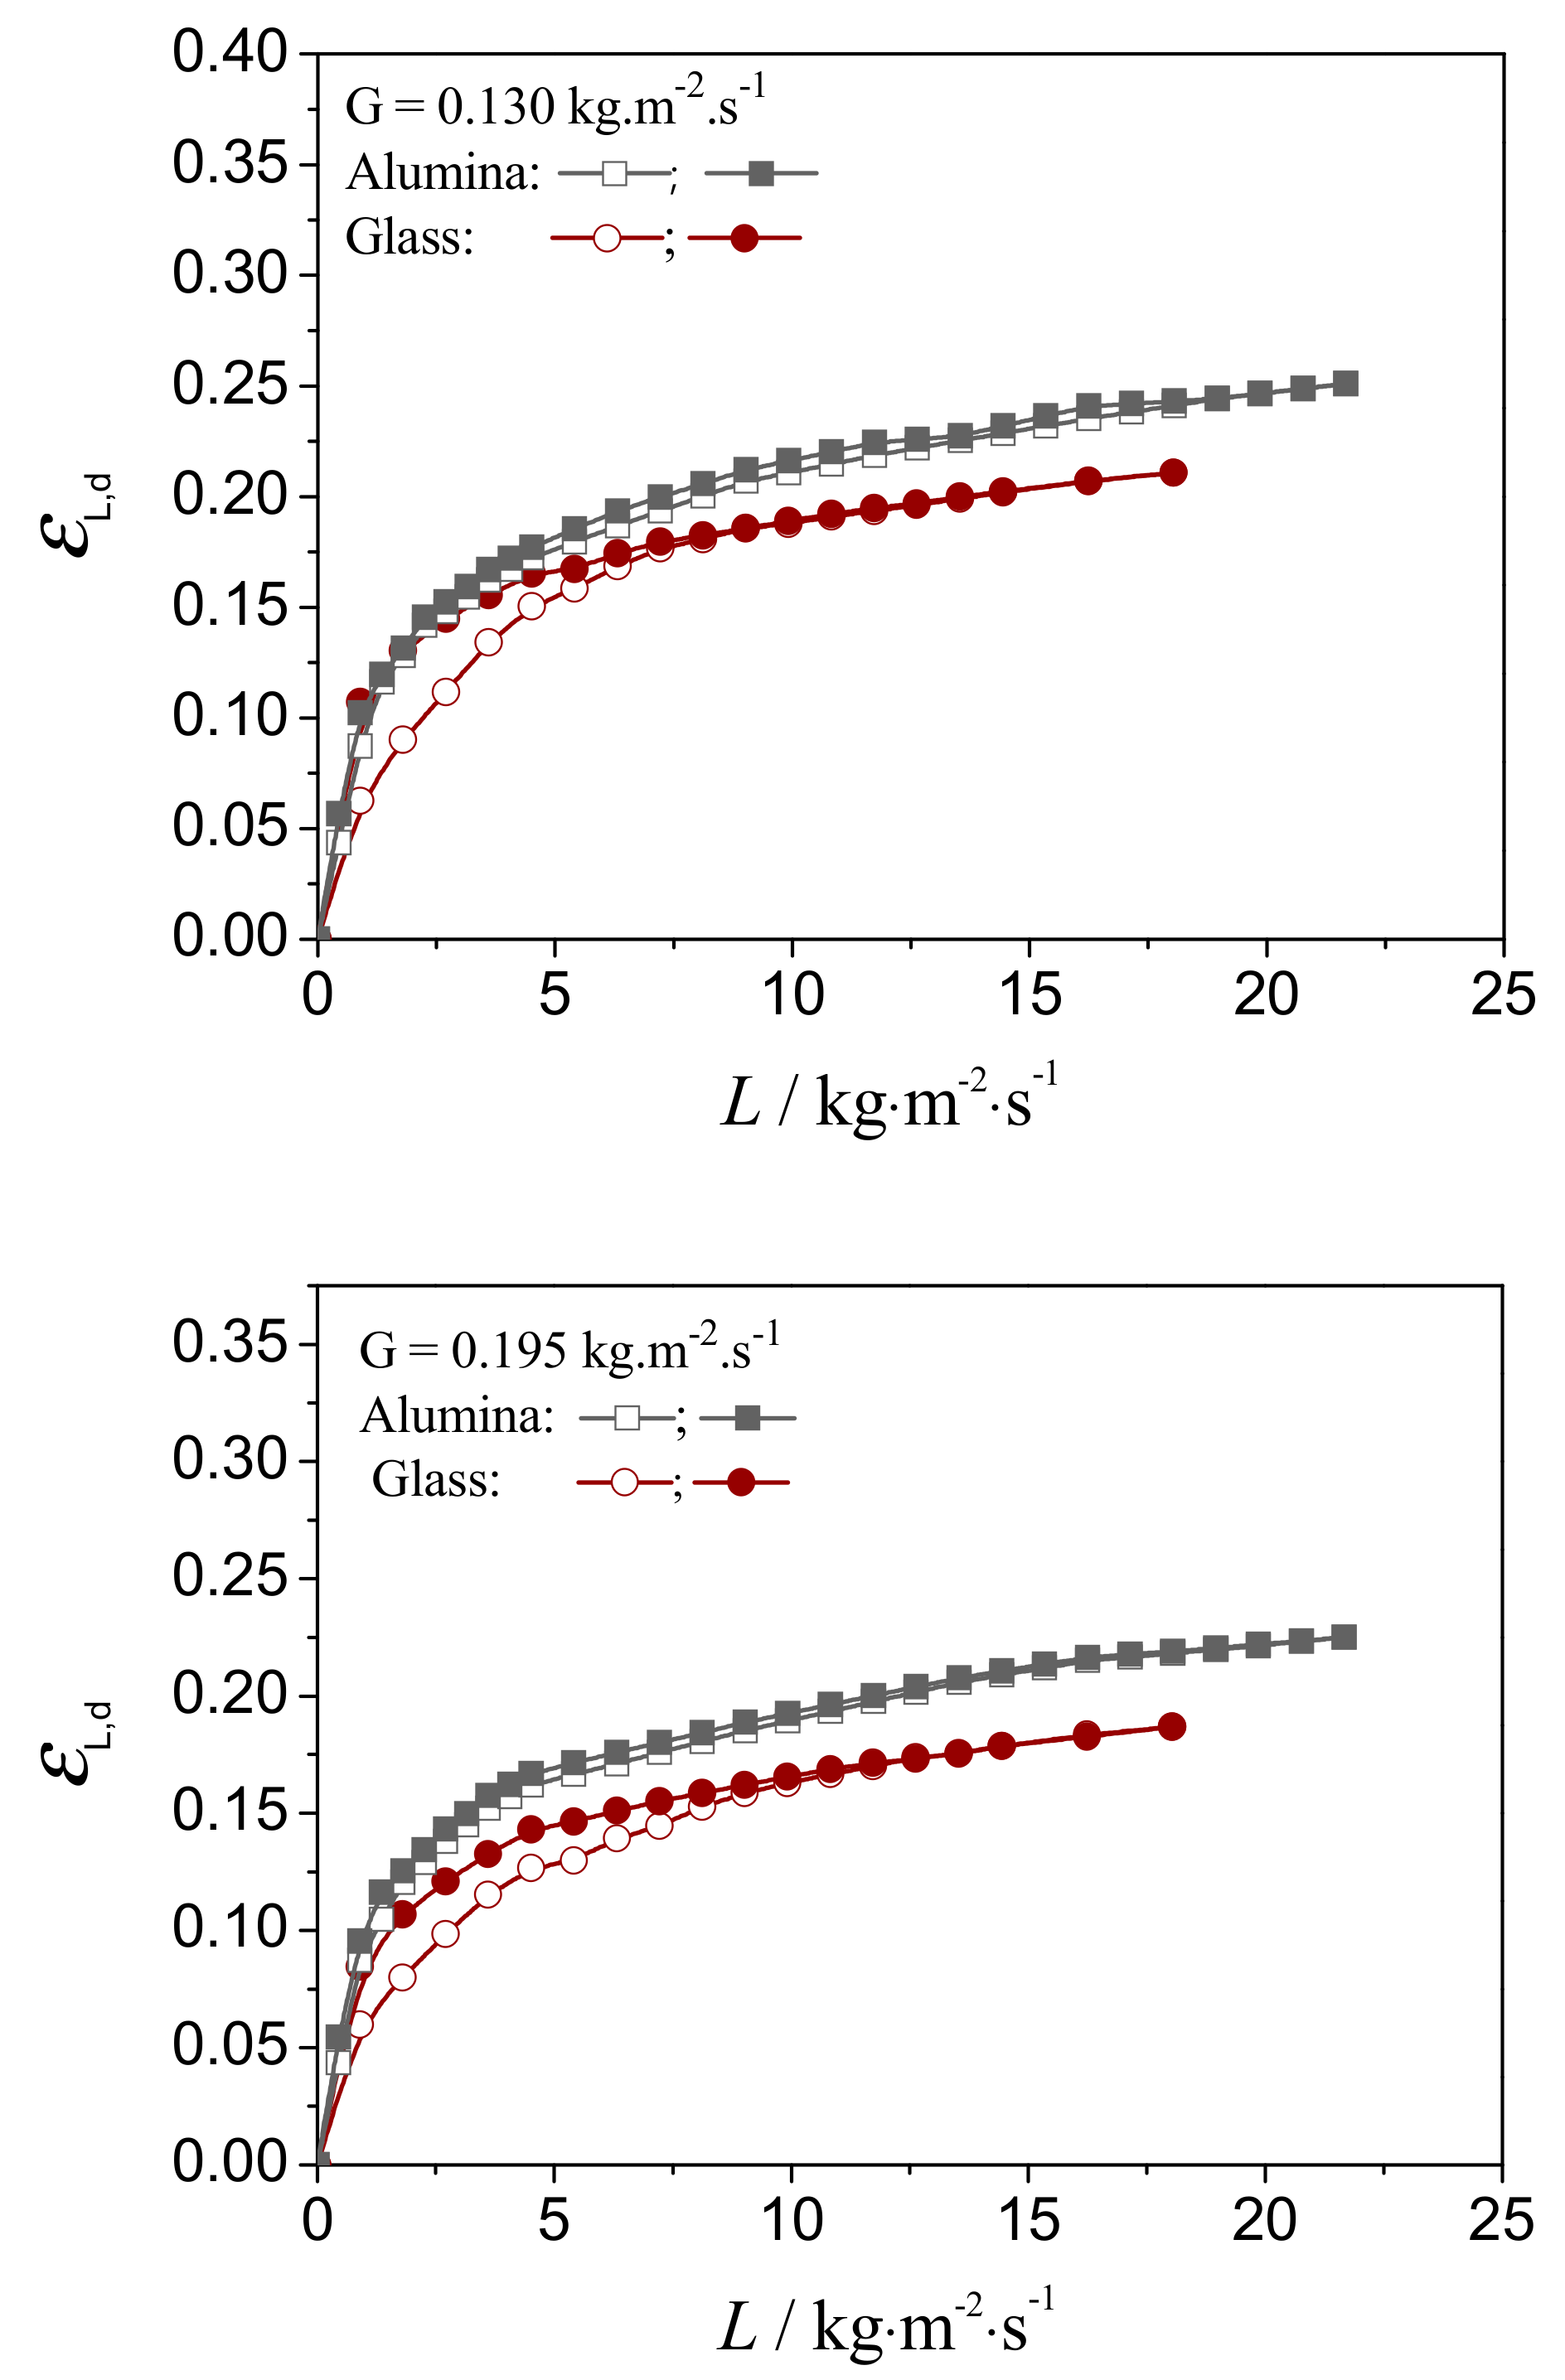
The dynamic liquid holdup ε L , d was measured for these two pellets under three gas flow rates of 0.065, 0.130 and 0.195 kg·m−2·s−1, while the liquid flow rate was varied from 0 to 21.67 kg·m−2·s−1 and then decreased to 0. As shown in Figure 2, in all the experimental runs, ε L , d for the alumina pellets bed is higher by 8% in absolute value than that for the glass spheres. A more obvious difference is found in the hysteresis loops of ε L , d . There is almost no discrepancy between the two branches for the alumina pellets, while it is obvious for the glass spheres at liquid flow rates from 0 to 6.3 kg·m−2·s−1, which means the wetting of the glass beads in the liquid flow rate’s increasing branch is not as good as that in the decreasing branch, while it is the same for the alumina pellets.

4.1.3. Hysteresis in Pressure Drop

Hysteresis loops of pressure drop gradient Δ P / Δ Z at three gas flow rates versus different liquid flow rate changing paths are shown in Figure 3. The larger pressure drop gradient in the liquid flow rate’s decreasing path is due to a larger gas–liquid interfacial area over the packing, since the liquid–solid contacting angle in the two manners of operation is different [48], as a result of the transformation of rivulet flow into film flow [47]. In this work, to transform the rivulet flow entirely into the film flow, the liquid flow rate was increased first to pulsing flow and then decreased inversely.
It is interesting to find that the lower branch of Δ P / Δ Z   profiles in the liquid flow rate’s increasing runs coincide with each other for the two packings, which means similar gas–liquid and liquid–solid contacting conditions from trickling to pulsing flow are encountered in the two beds. However, the upper branch of Δ P / Δ Z   in the liquid flow rate’s decreasing runs for alumina pellets is shown to be lower than that of glass spheres, which means a reduction in two-phase interaction. Moreover, the shapes of the two profiles are also different: the one for the glass sphere is close to a straight line, while the one for the alumina pellets is much more complicated. The above difference implies that in the glass spheres bed, the liquid–solid contacting state keeps constant, since pressure drop varies linearly with the liquid flow rate, while in the alumina pellets bed, it undergoes a series of changes from film flow in the high interaction region to a mixed flow texture in the low interaction region. Nevertheless, it is shown that an increase in gas flow rate can reduce this trend.

4.2. Modeling Results

4.2.1. Liquid Flow Texture Characterization

It is known that in the trickling flow regime, the solid is contacted with two forms of dynamic liquid: the liquid film and the rivulet. Corresponding to the flow regime transition from trickling flow to pulsing flow, the complex liquid flow texture will be reduced completely into film flow, which provides the opportunity to establish the unique pressure drop relationship with respect to the gas saturation for the film flow, as suggested from Equations (5)–(7).
In Table 2, the parameters of the correlation between k G and S G are estimated for the two packings in the liquid flow rate’s decreasing loop. This shows that the coefficients are only slightly deviating from 1.0. In comparison, the coefficients for glass beads in the liquid flow rate’s increasing branch are in the range of 1.55 to 2.48 [44], which deviates substantially from 1.0.
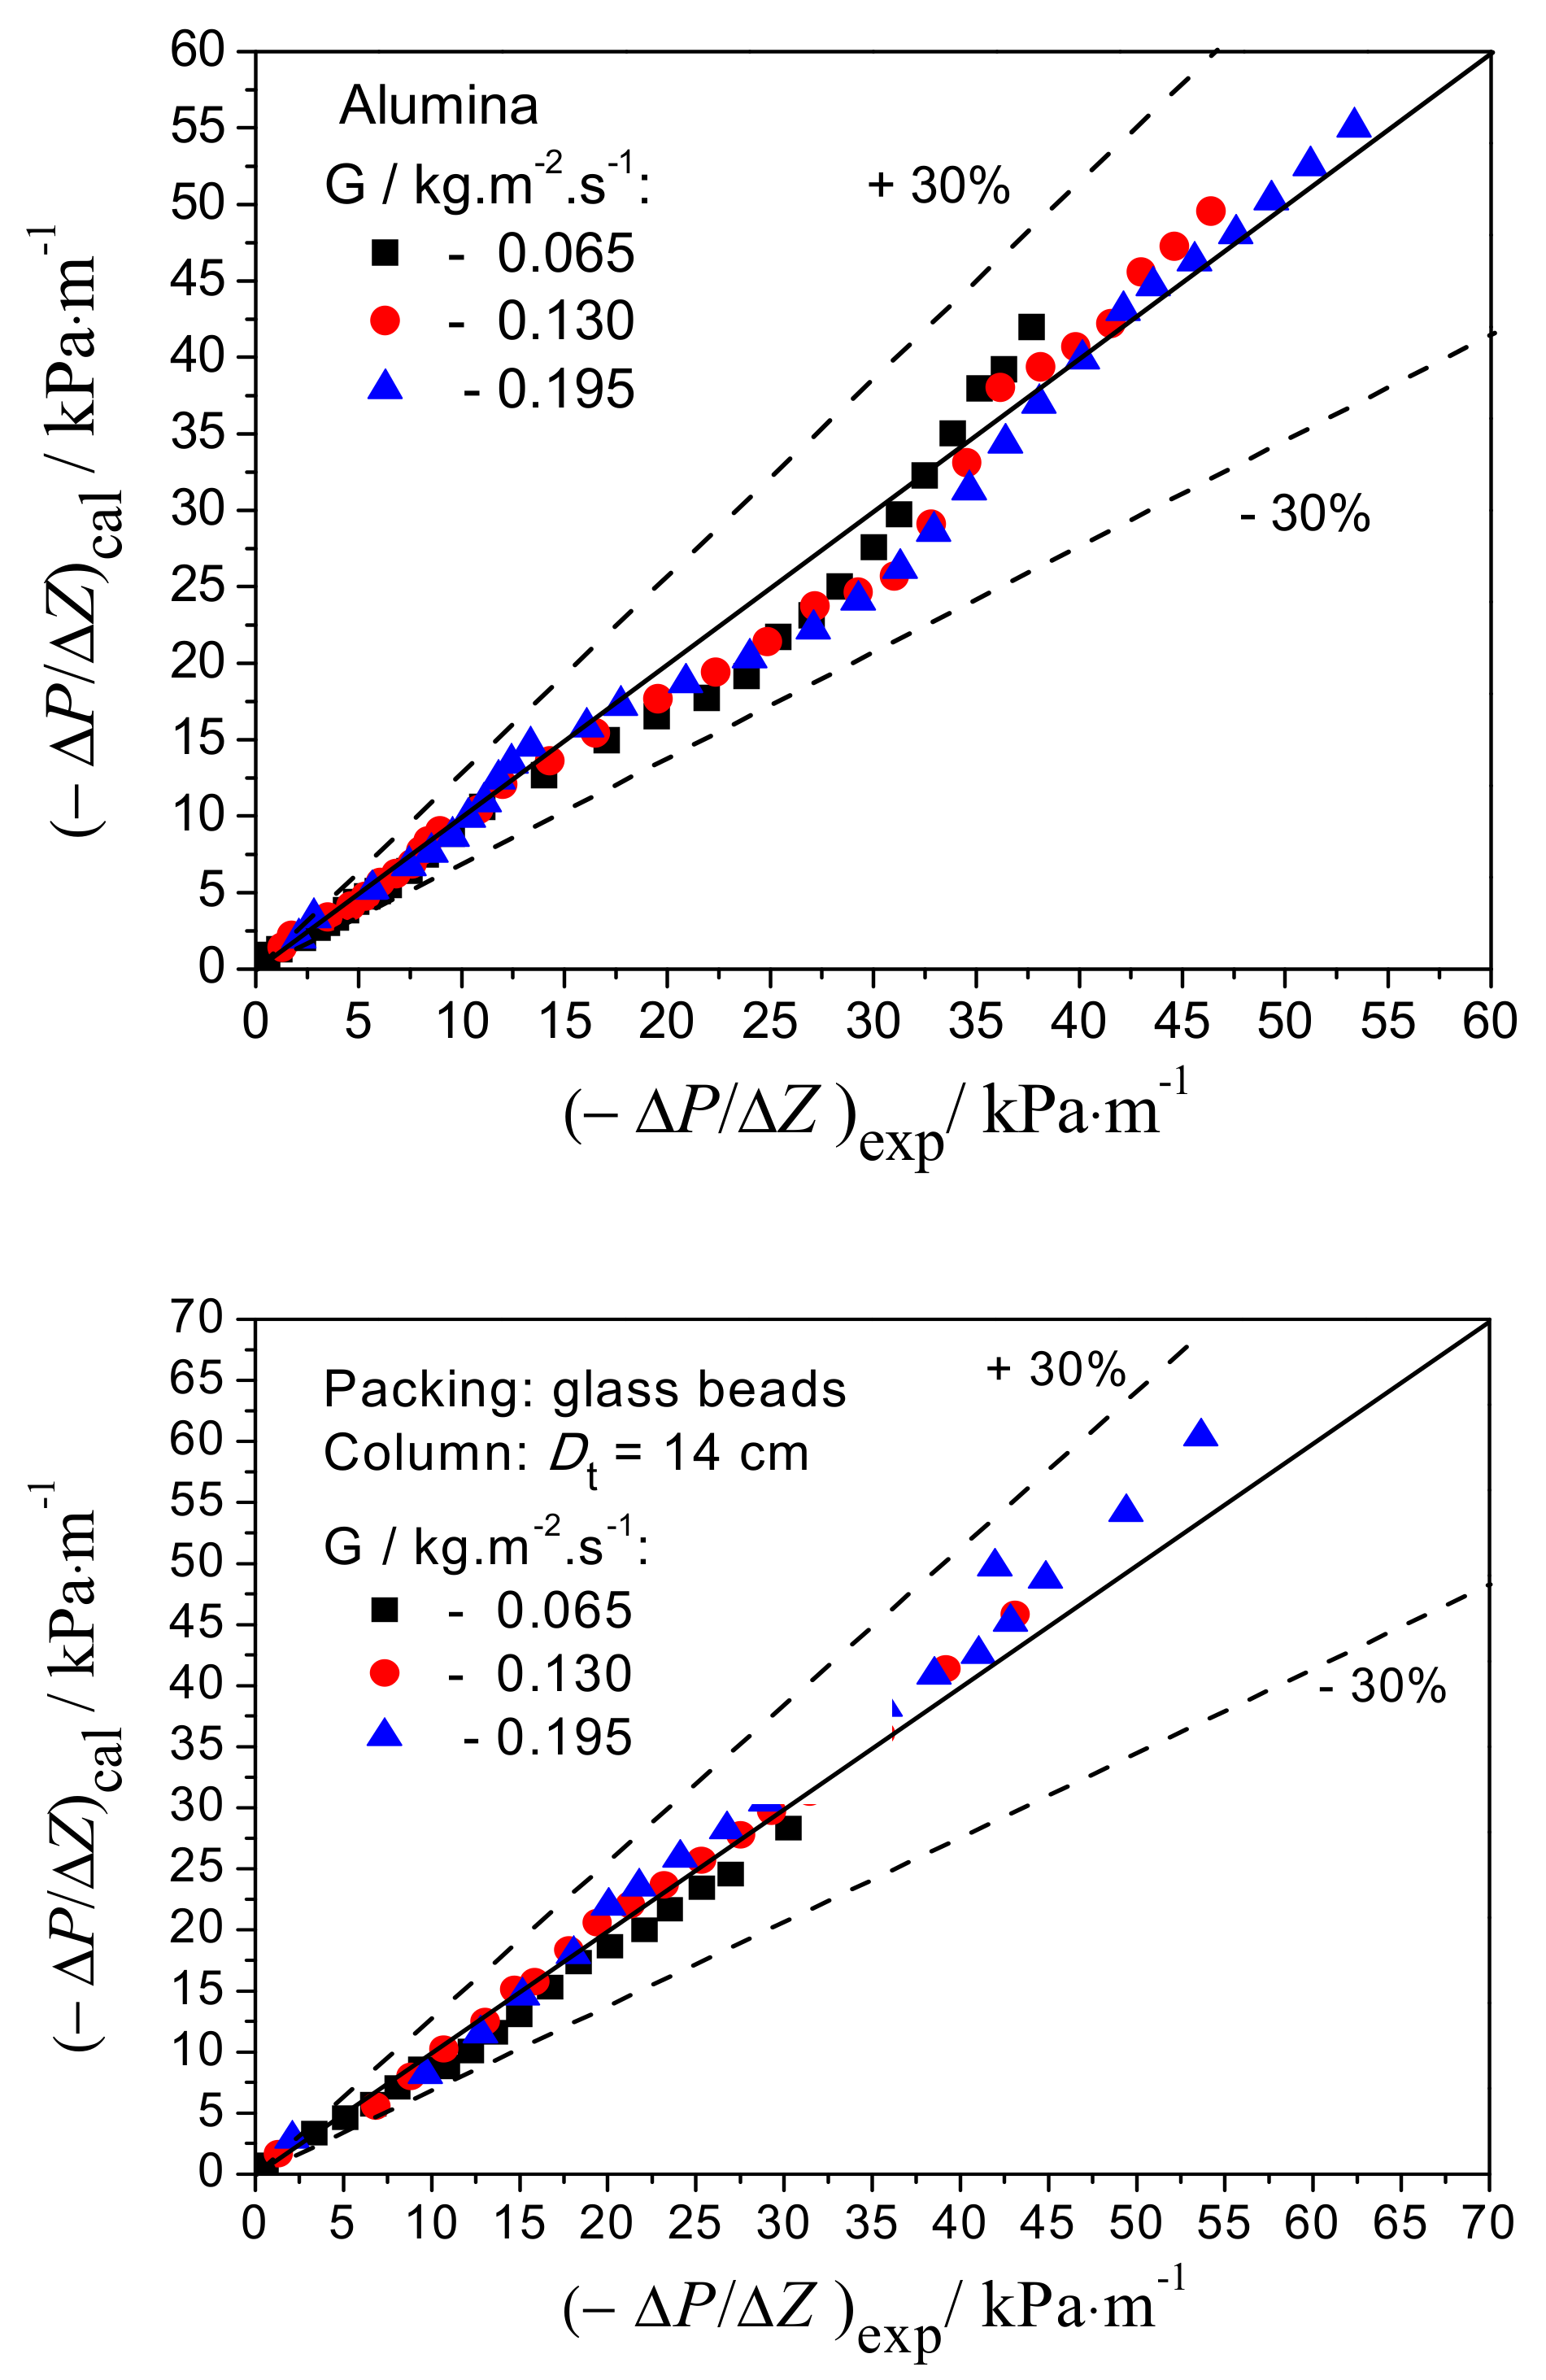
To check the accuracy of the pressure drop prediction in the film flow regime, the pressure drops in the liquid flow rate’s decreasing branch are predicted from the relative permeability correlation given in Table 2. Parity plots of measurements versus the predictions are compared in Figure 4. This shows that the accuracy of the pressure drop prediction is within the ±30% interval, which means the correlation satisfies the liquid film fraction prediction.
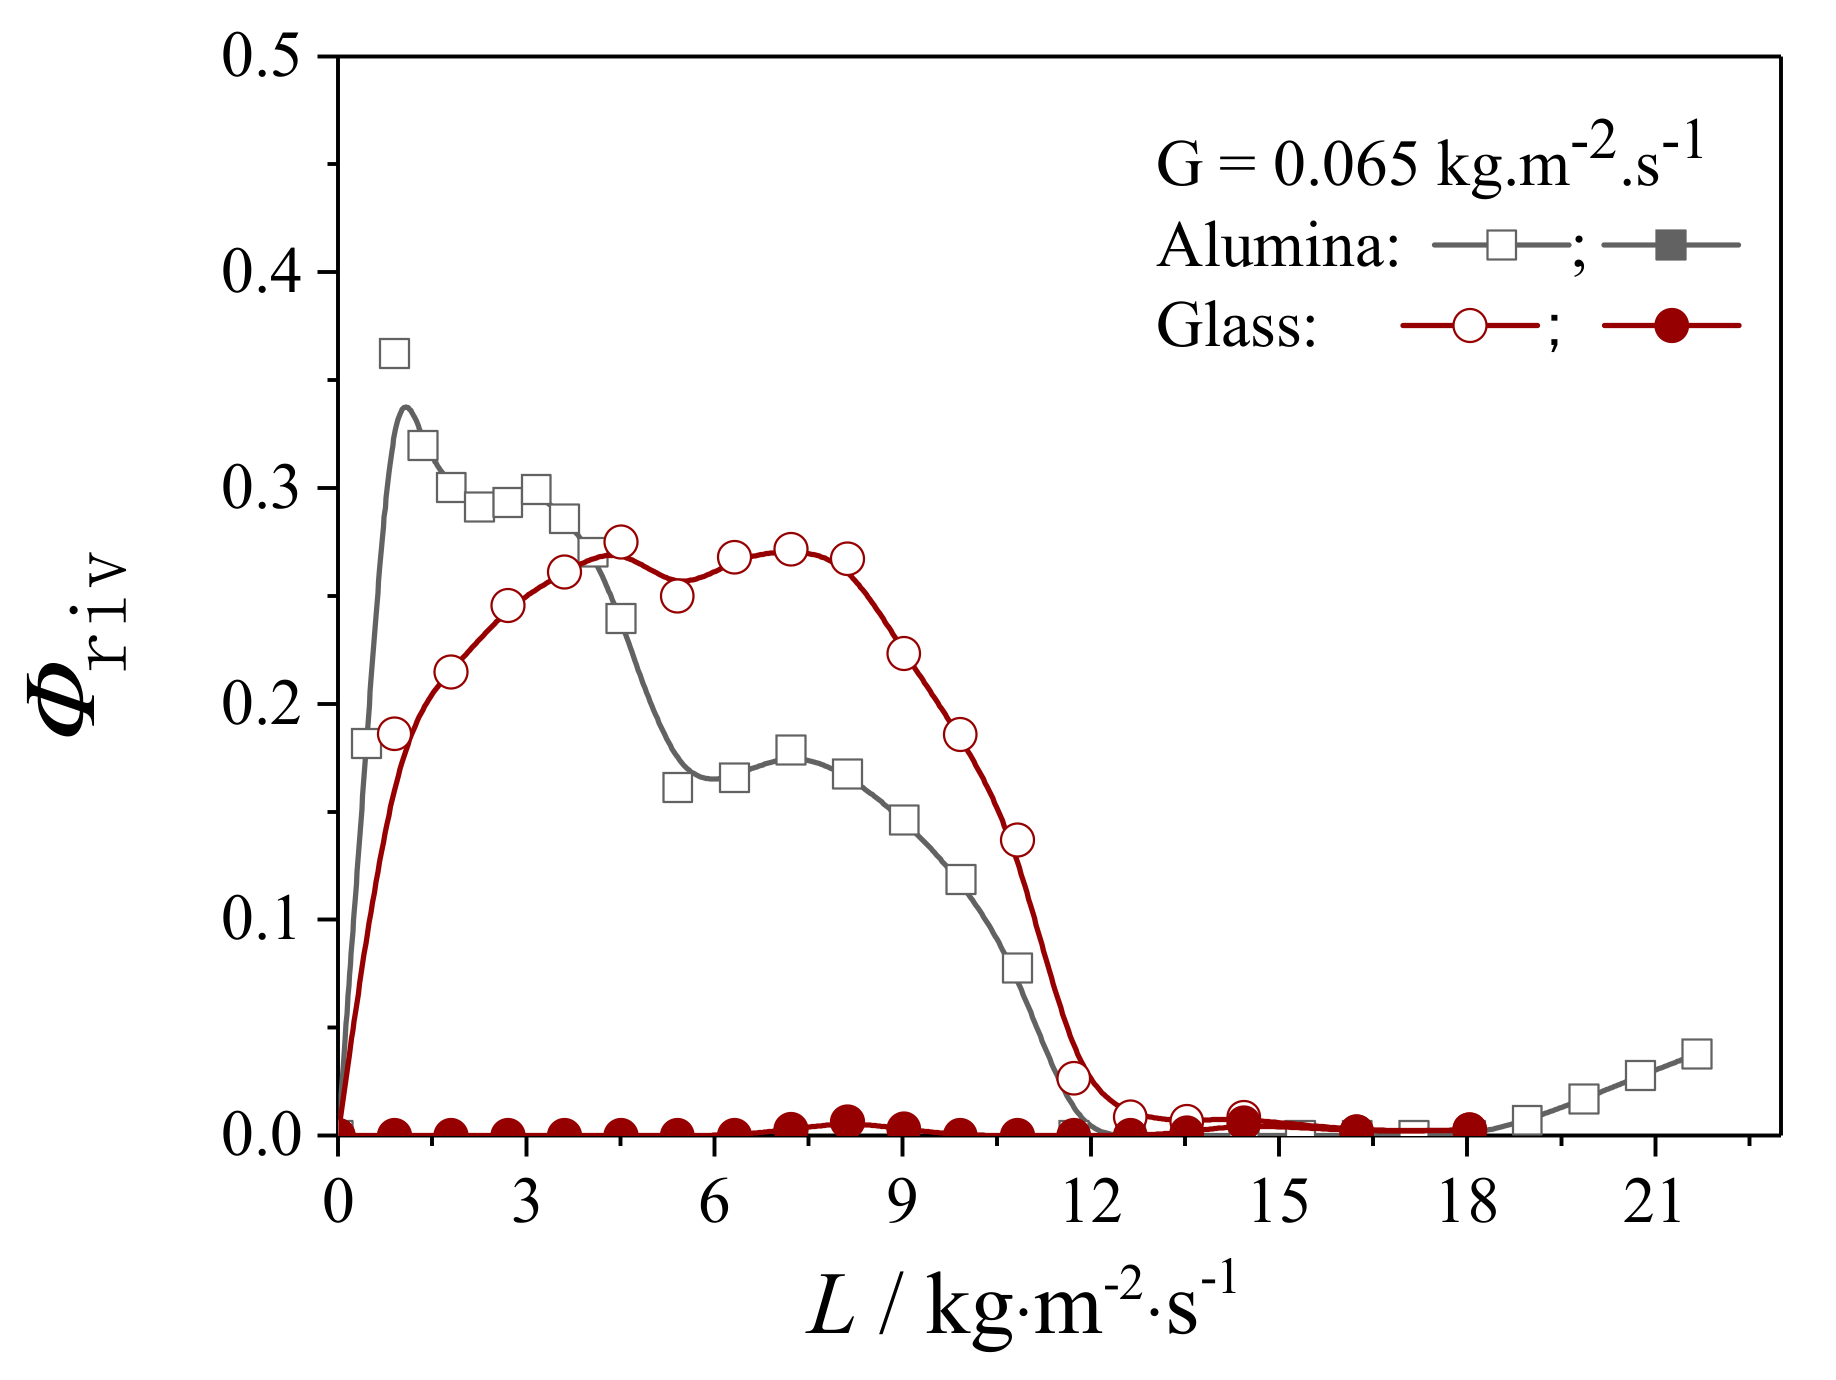
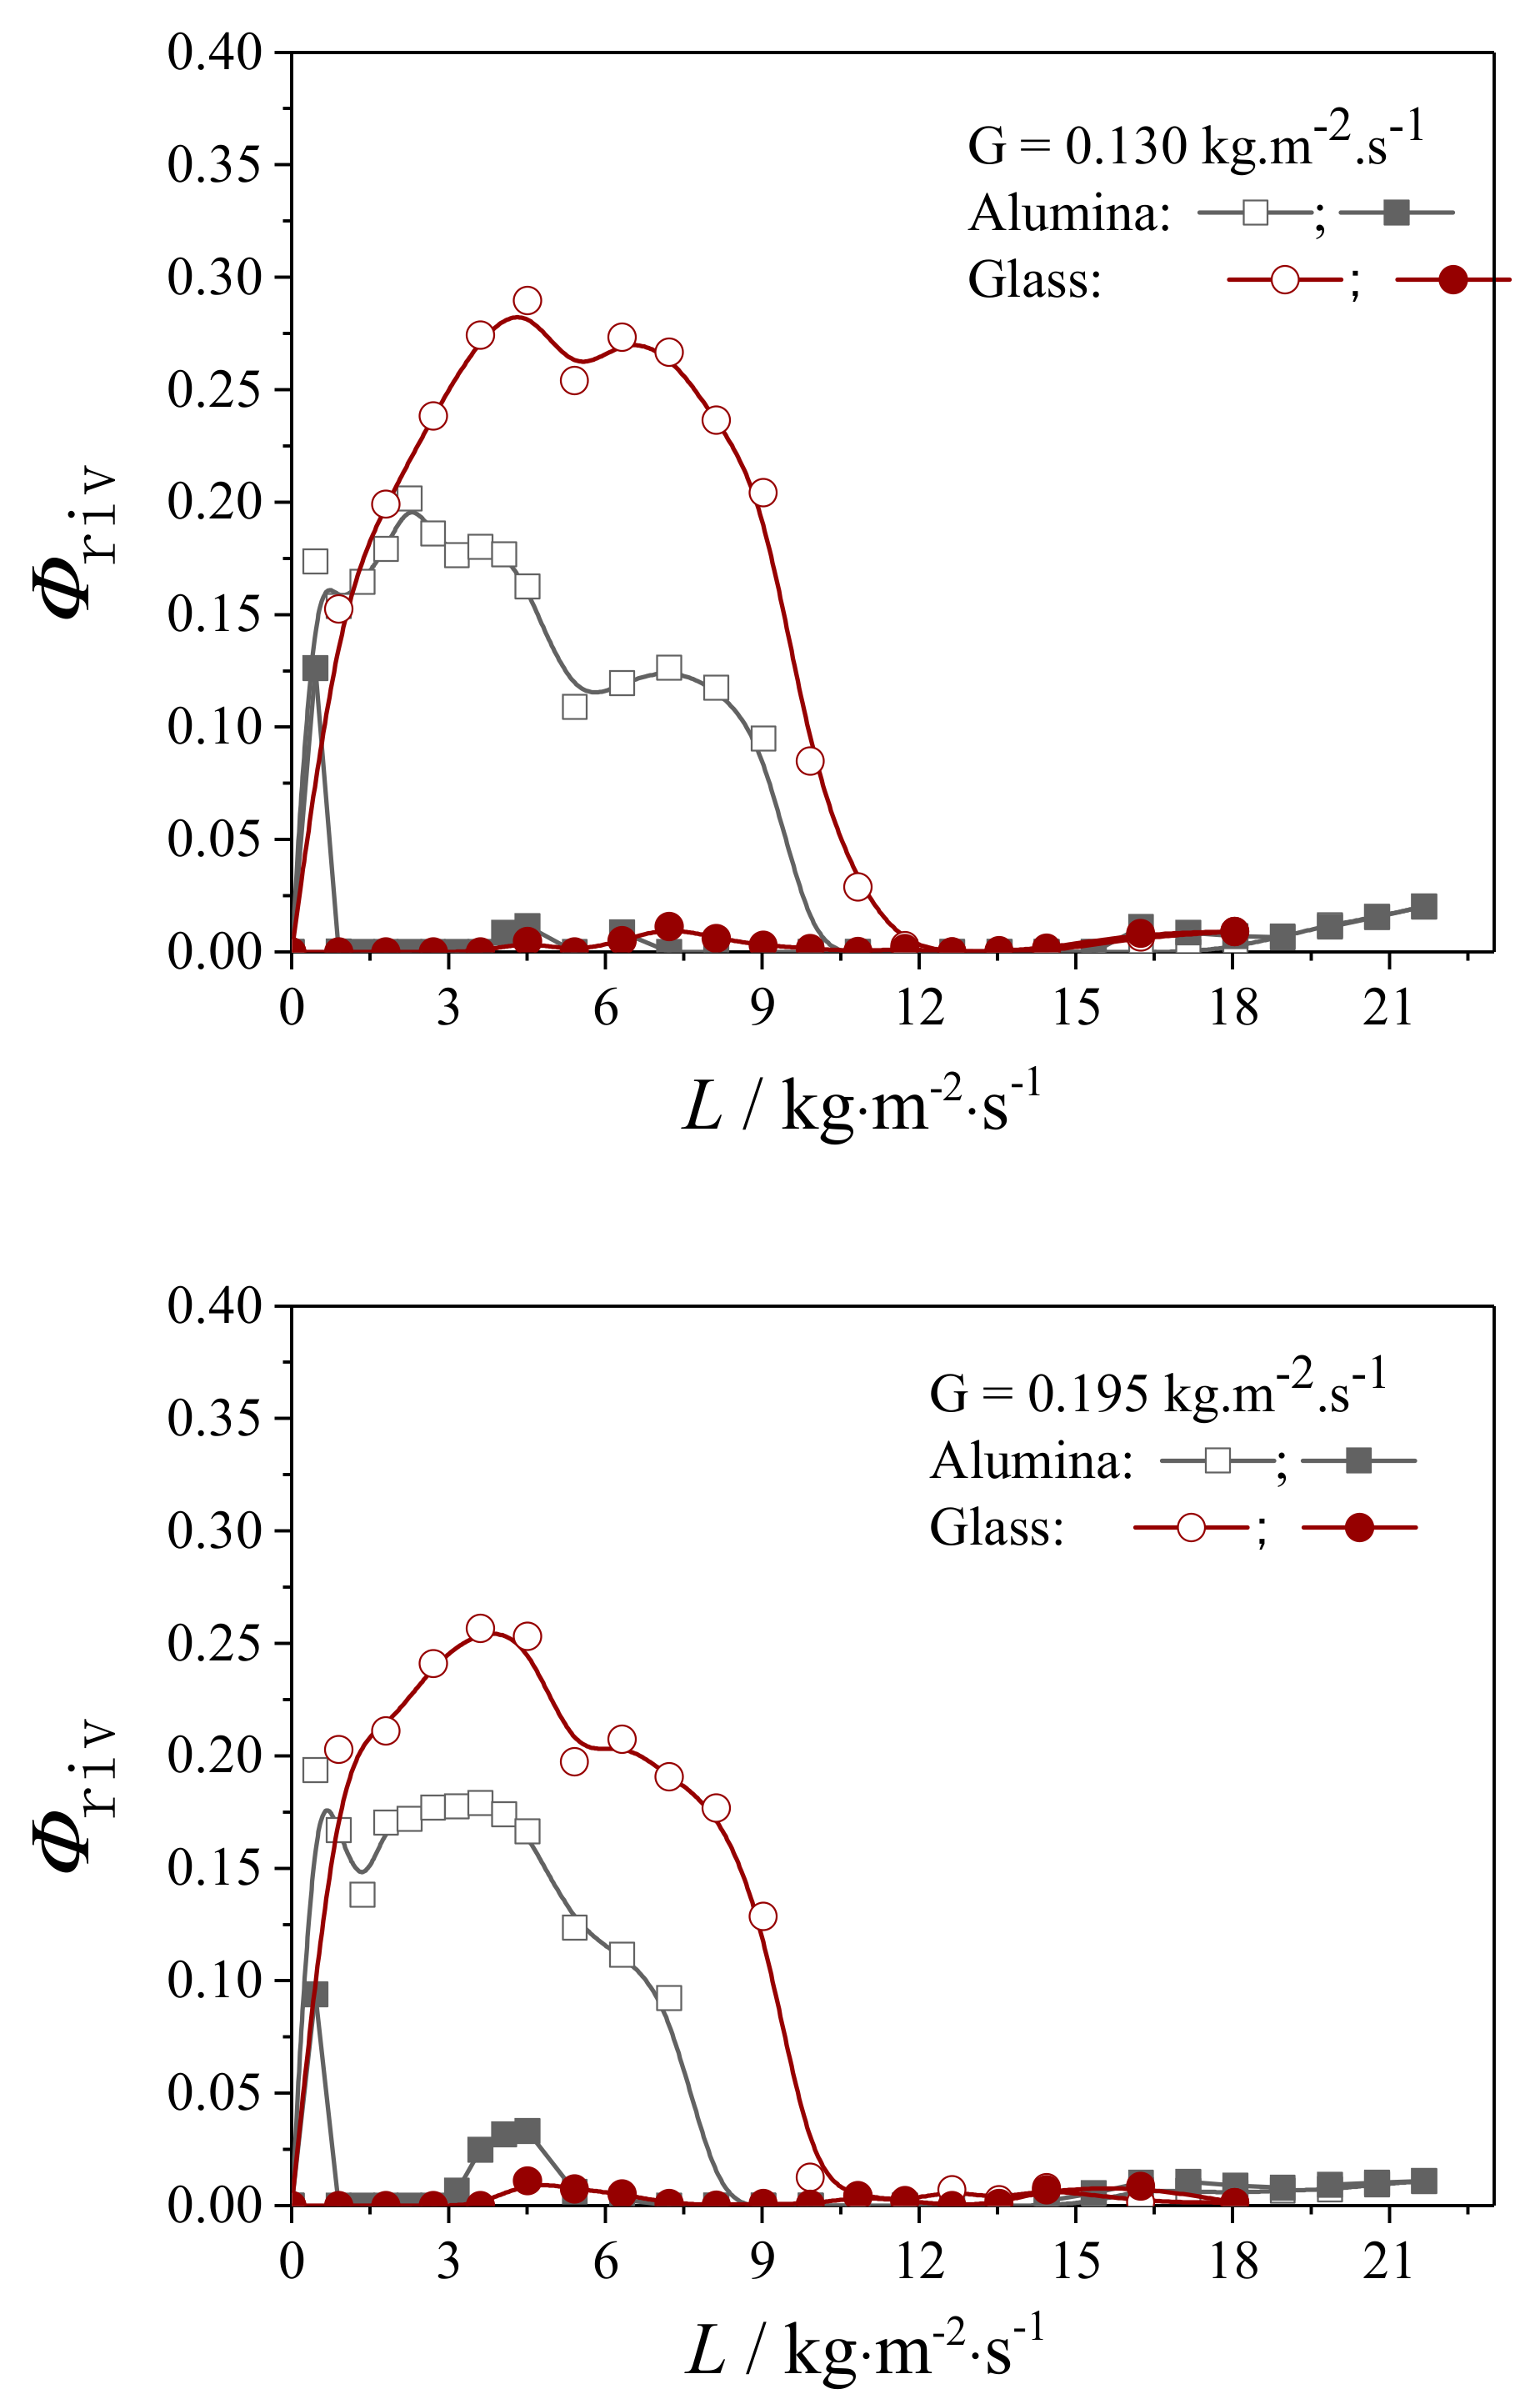
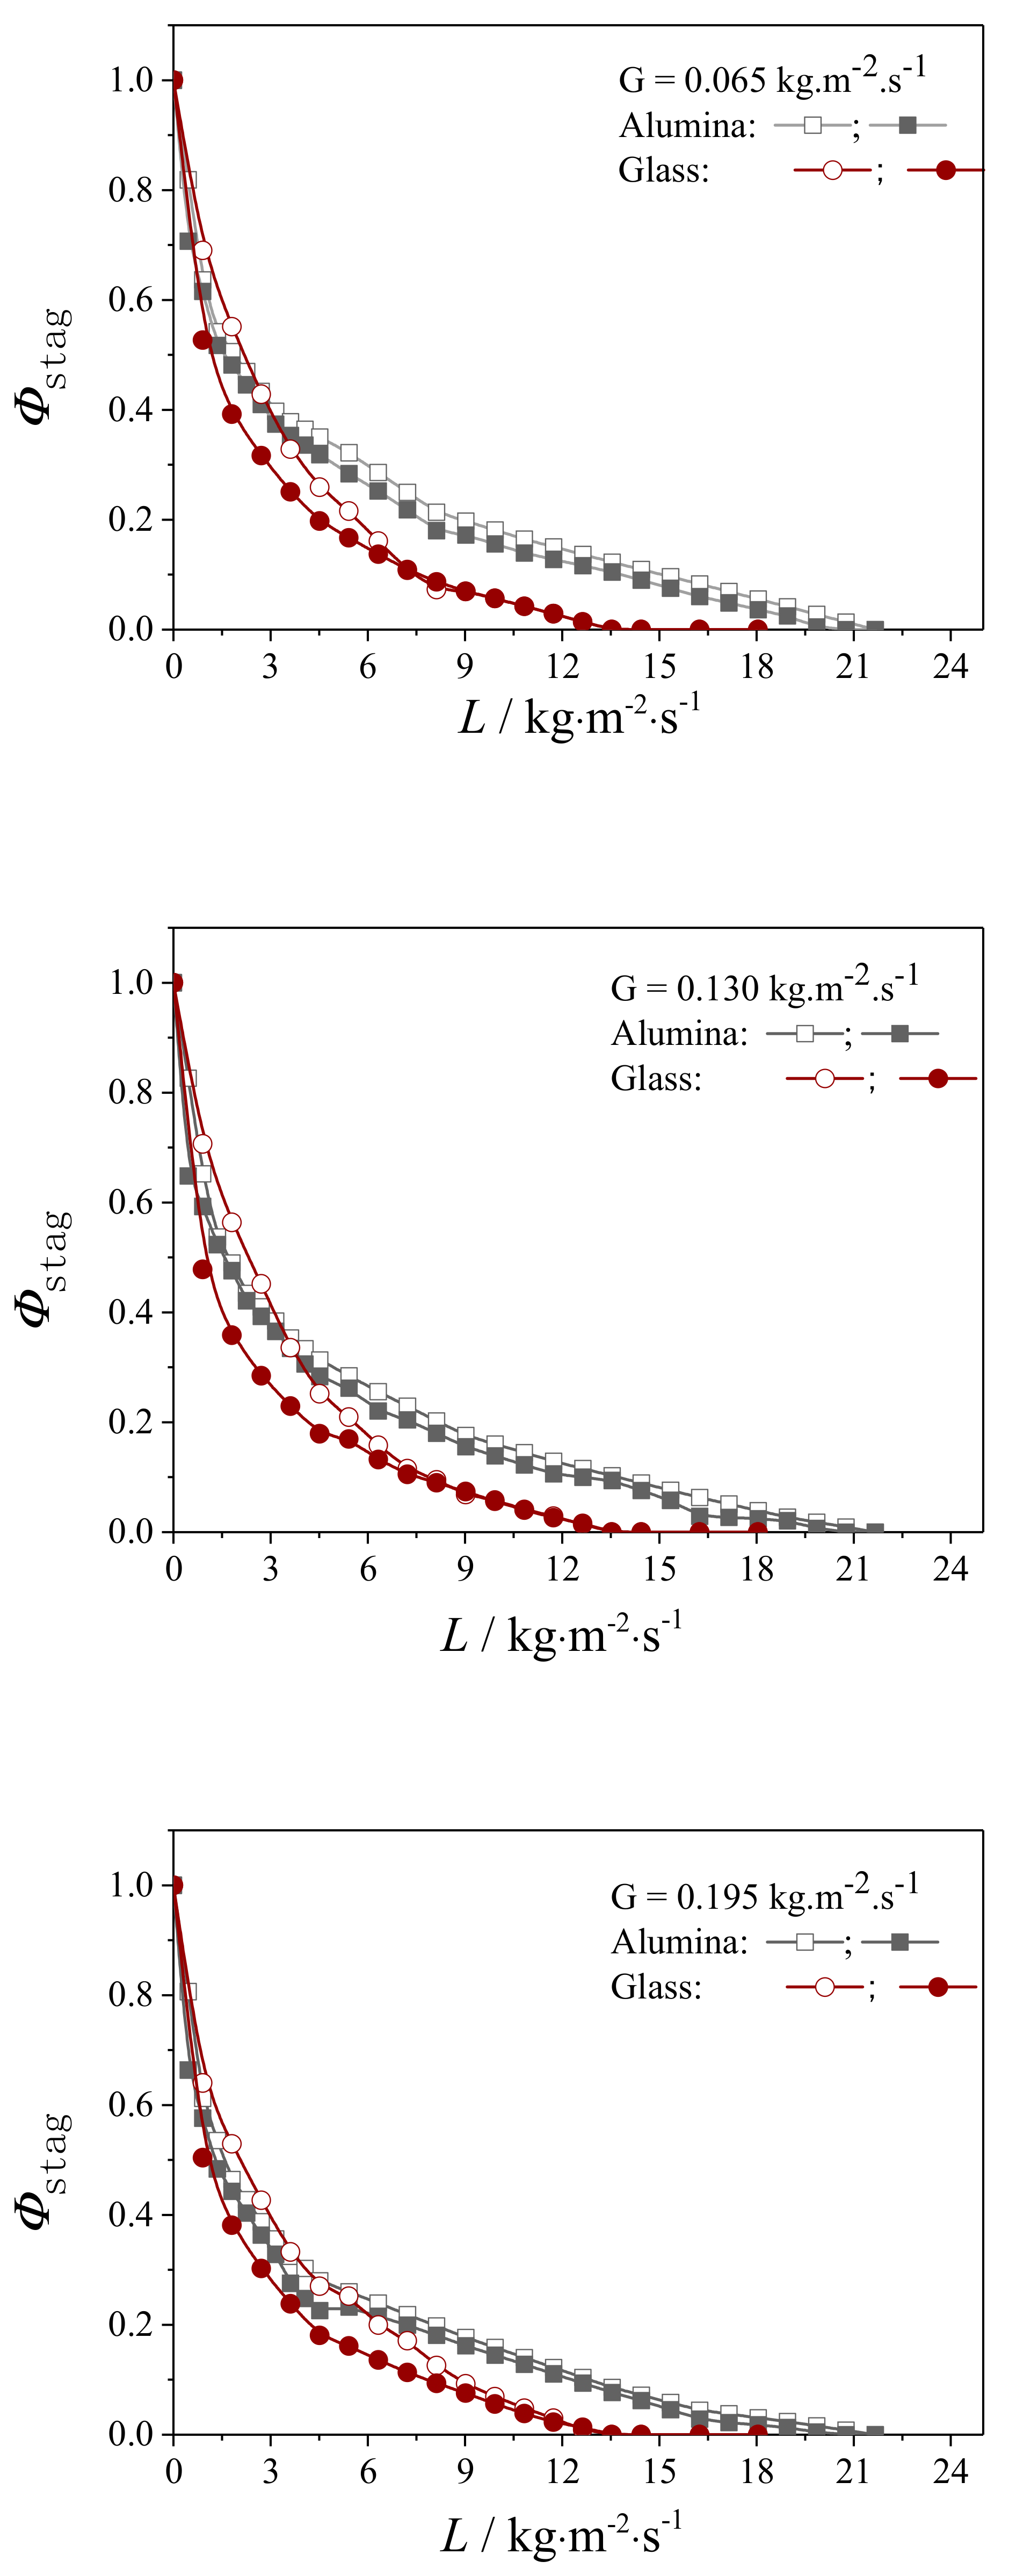
The wetting condition over the packing surface can be represented by the liquid flow texture in the form of fractions of the stagnant liquid, film flow and rivulet flow, which are shown in Figure 5, Figure 6 and Figure 7.
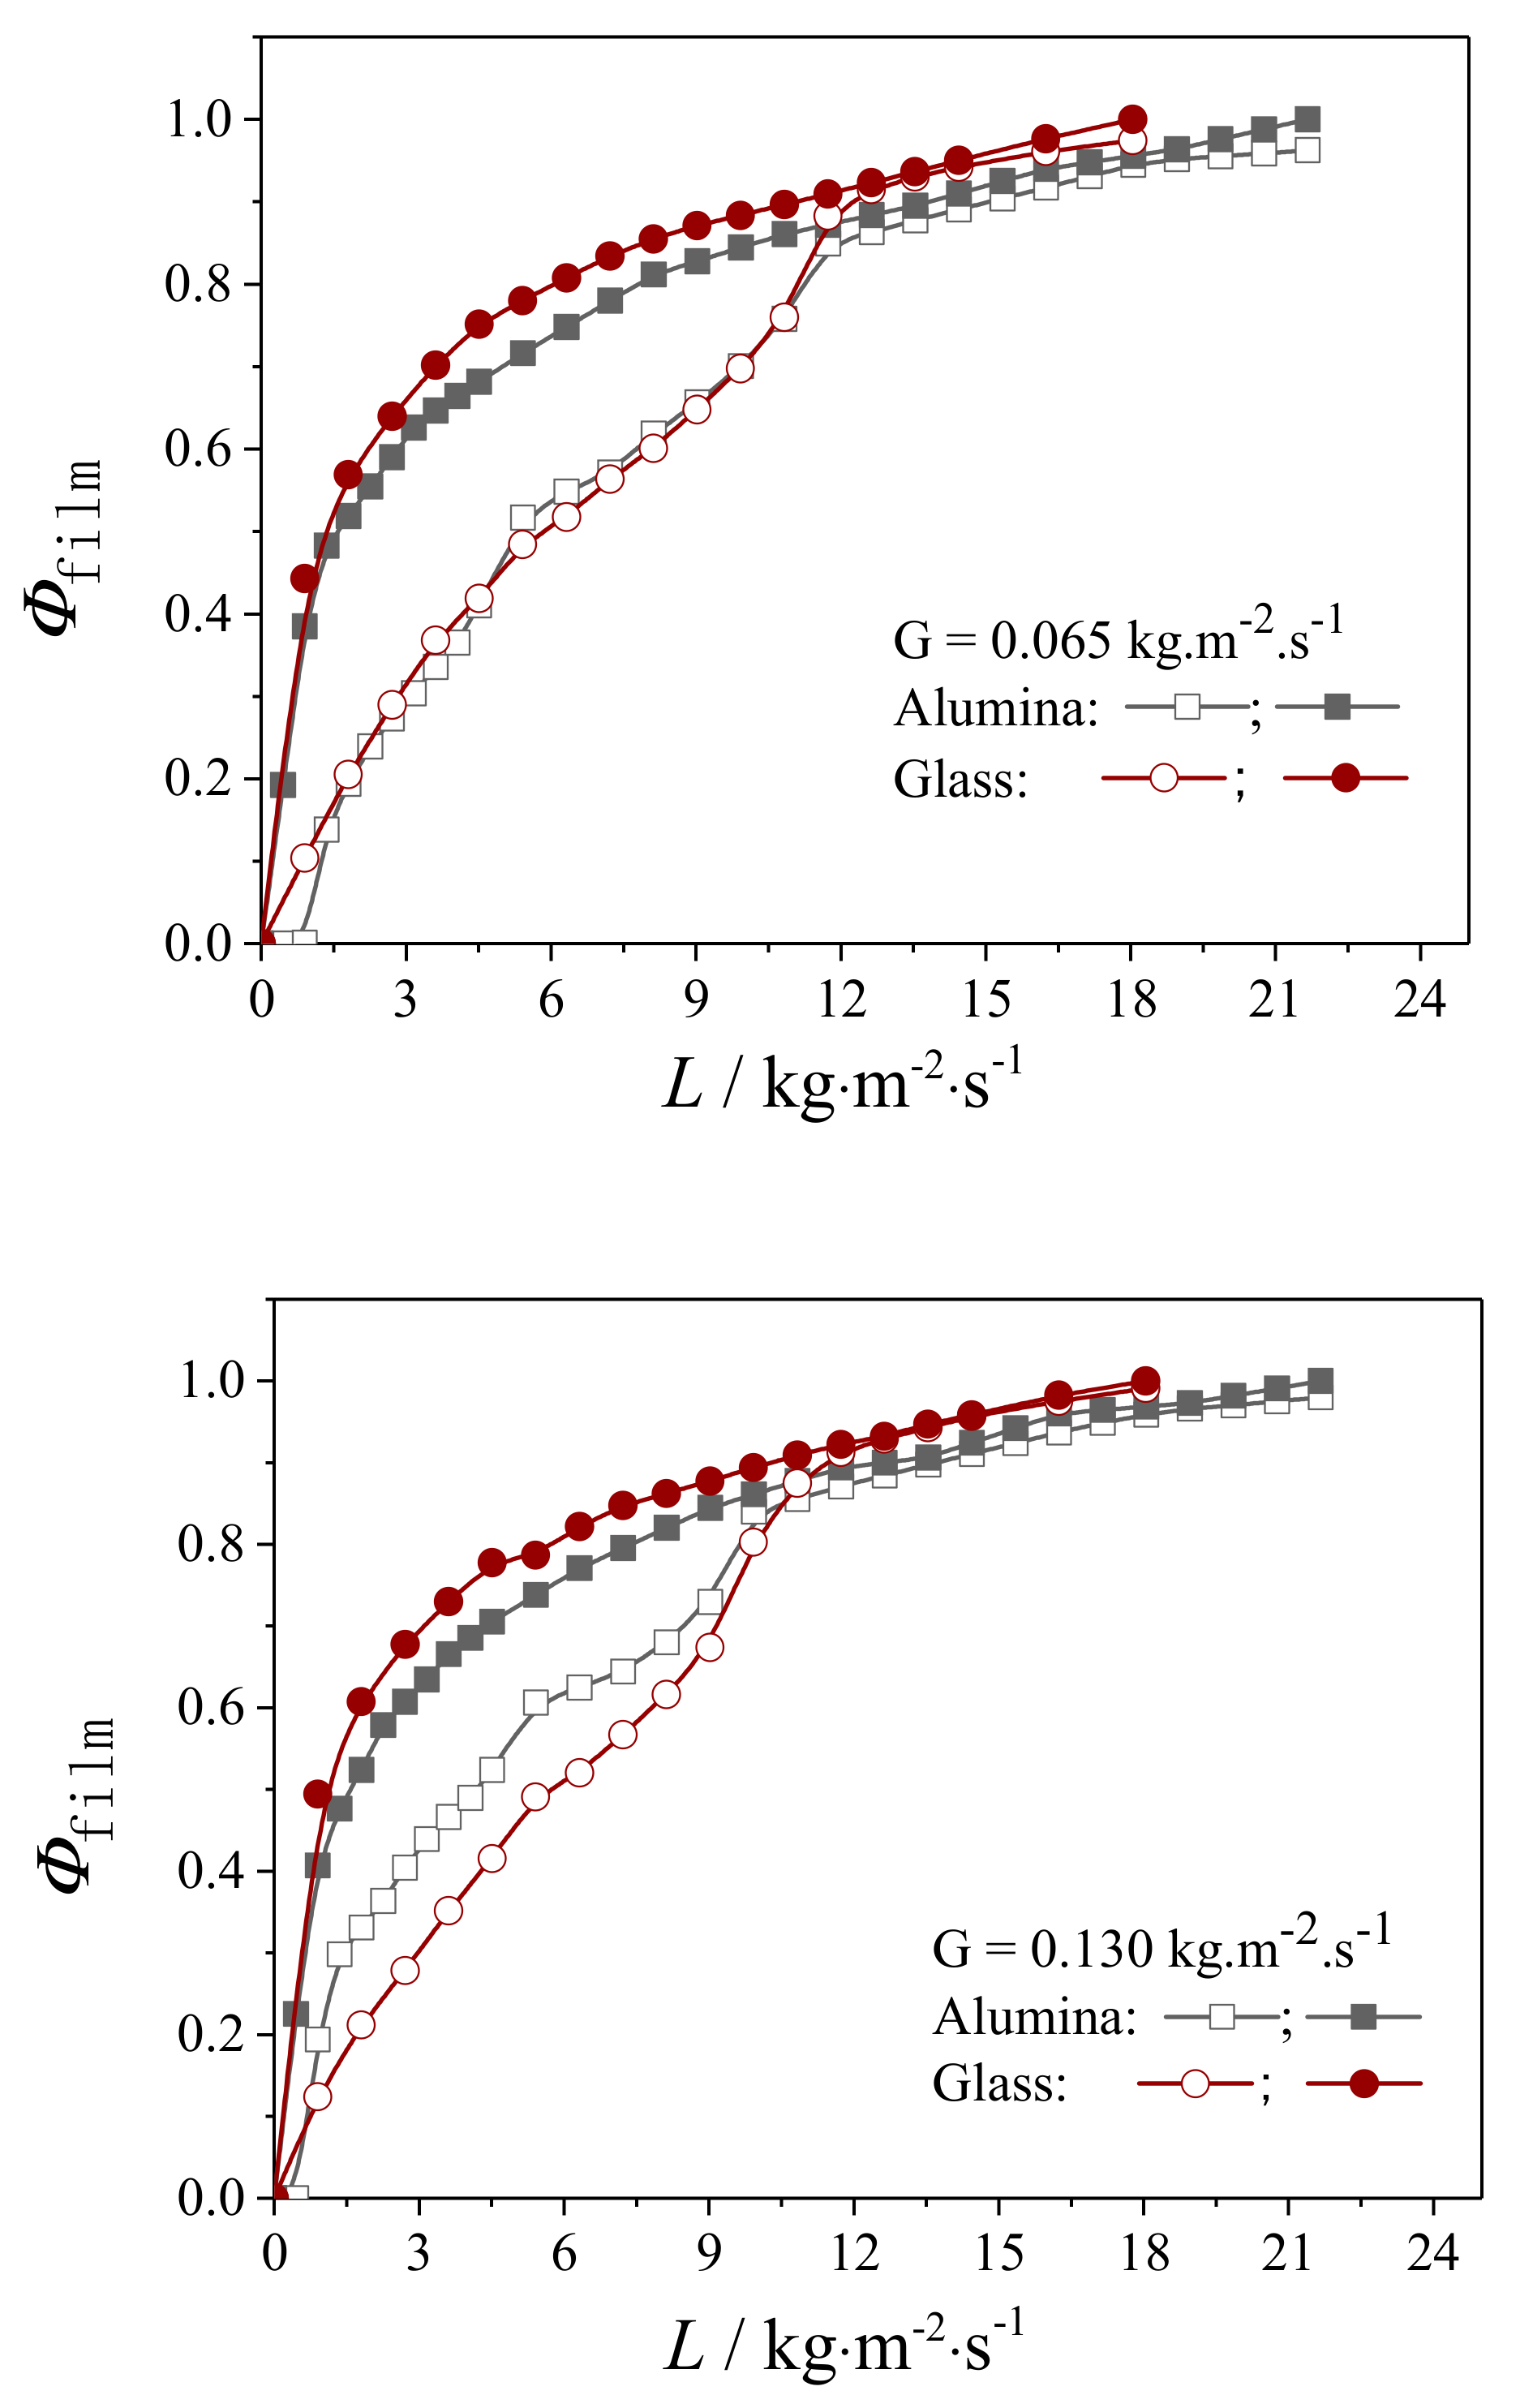
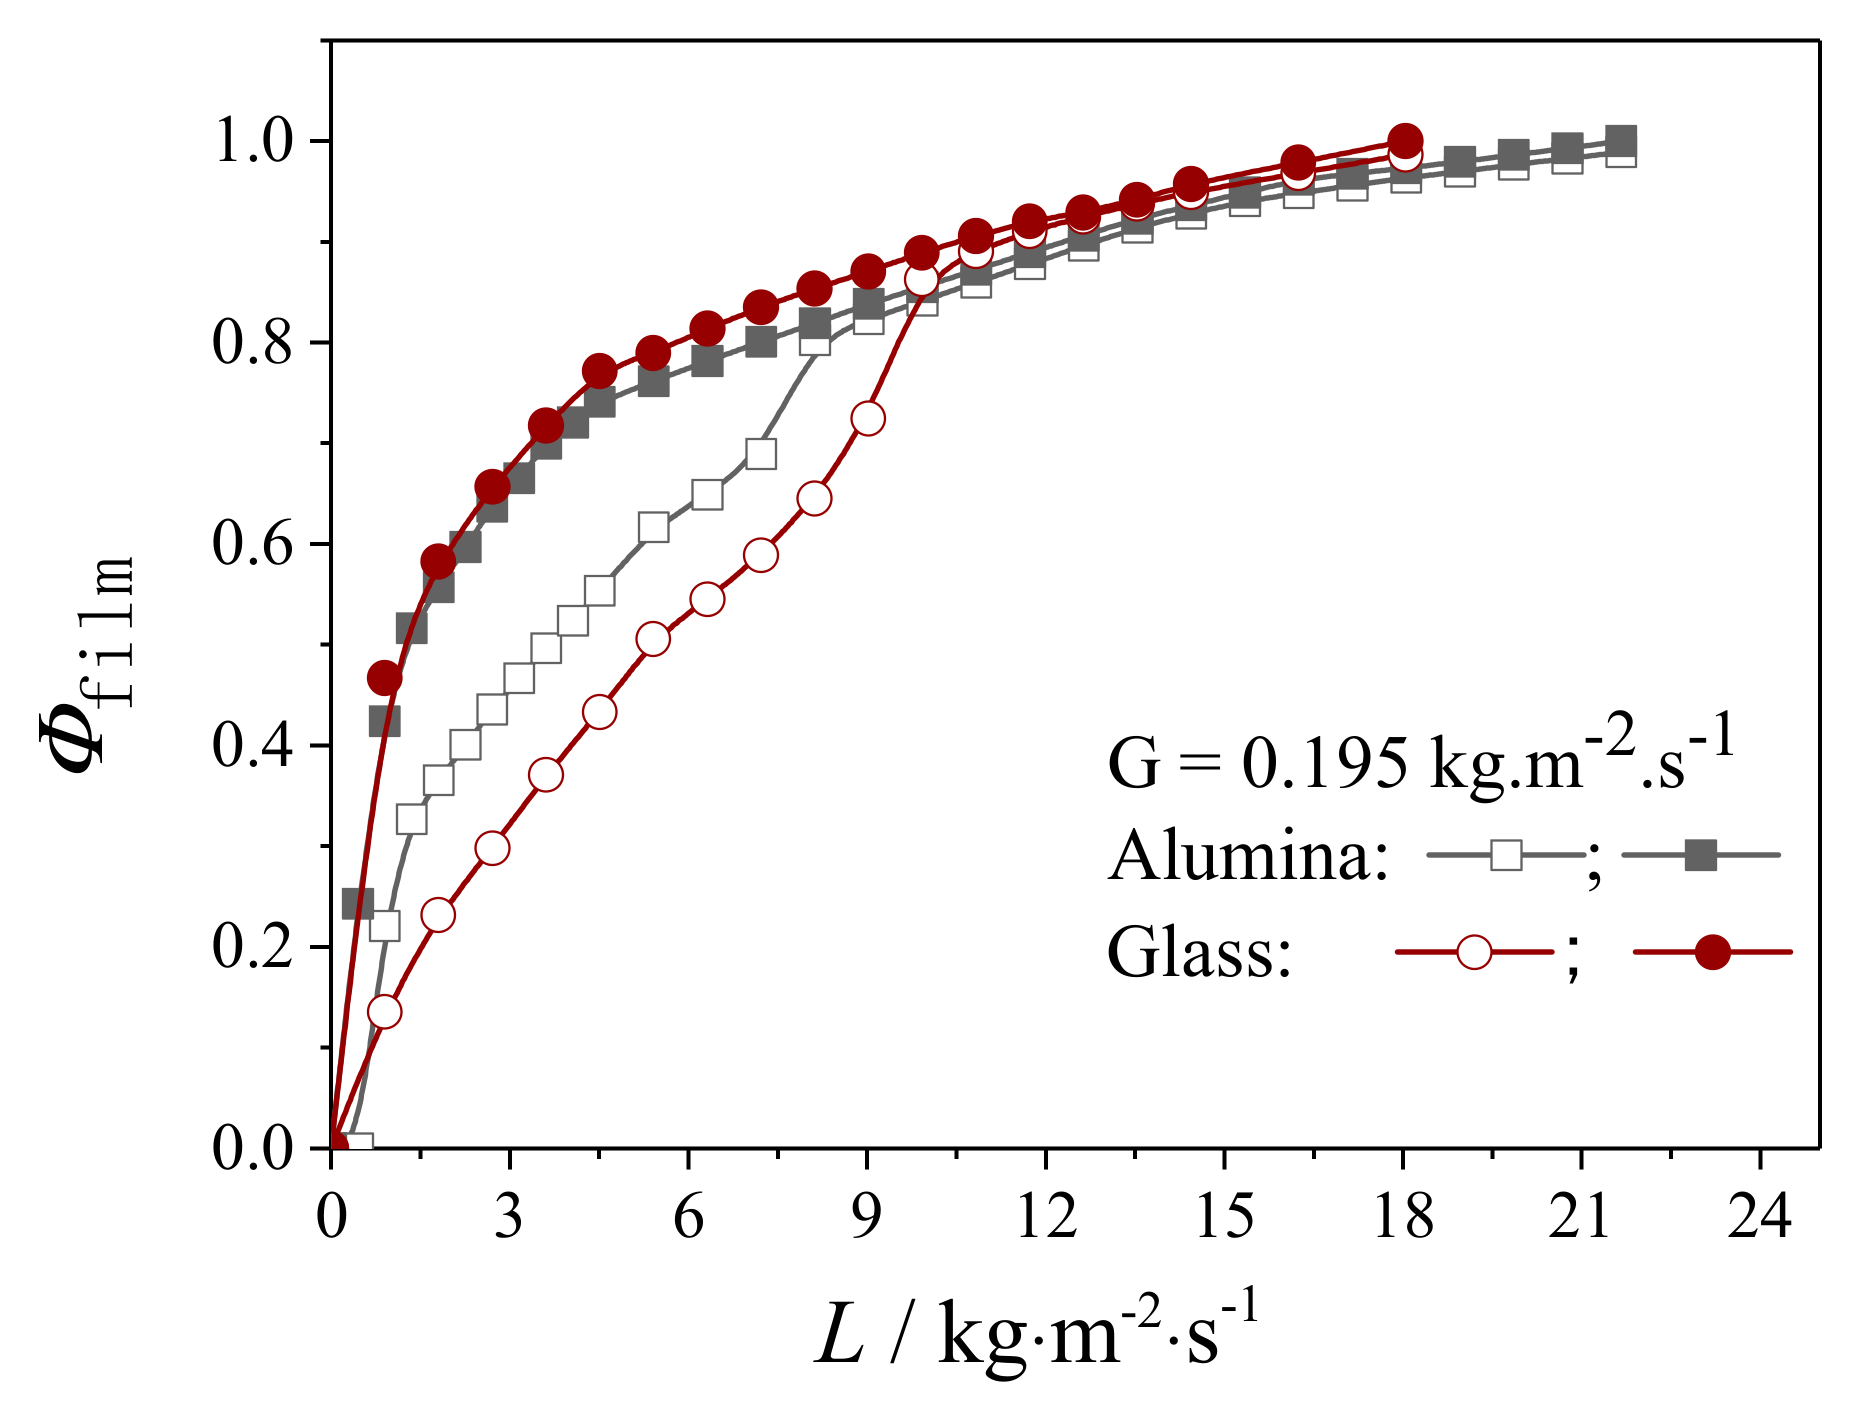
The development of film flow over the two kinds of packing is shown in Figure 5. It is found that at the lowest gas flow rate of 0.065 kg·m2·s−1, there is almost no difference in the film flow fraction Φ film between the alumina and glass pellets. When the gas flow rate is increased to 0.130 and 0.195 kg·m2·s−1, Φ film in the trickling flow regime for the alumina pellets is obviously higher than that of glass beads. This result is consistent with the result of Schubert et al. [42], who observed the dynamic liquid was significantly more uniformly distributed over the cross-section in the Al2O3 bed than in the glass bed, which was assumed that only film flow was existing over the Al2O3 packing. However, Φ film in the liquid flow rate’s decreasing branch, which corresponds to the film flow regime, shows no difference.
The difference in the liquid flow rate’s increasing branch can be explained from the different surface properties of the two pellets. On the porous surface of the alumina pellets, there is a large amount of liquid-filled pores, which tend to adhere liquid droplets. When the surface force cannot counterbalance the droplet weight and the gas friction, the liquid droplet will fall and connect to a lower pore, leading to the formation of a stripe of liquid film. In comparison, the liquid film formation over the glass sphere surface only depends on the liquid–solid surface tension, which is more difficult than the porous surface of alumina. As shown in Figure 5, in the liquid flow rate’s decreasing branch, there is not much difference between the porous and non-porous surface, since both surfaces are covered with liquid film, and hence, no obvious difference in film flow fraction is observed for the two packings; even the liquid flow rate is reduced to a very low value.
The importance of pores on the liquid spreading over the substrate surface has been demonstrated by Maiti et al. [41] in Figure 6 of their paper with a perforated steel plate. They described saturated pores as acting as “attractors” for the moving liquid droplet, i.e., a droplet moving toward the pore is accelerated; on the other hand, a liquid droplet moving away from the pore is held up. The pore acts as accelerator or brake for the droplets. Its acceleration effect results in an increased fractional coverage and wetting efficiency during the increase in liquid flow rate.
A comparison of the fraction of the rivulet flow over the alumina and glass pellets is given in Figure 6. This shows that the fraction of the rivulet flow increases first from 0 to a maximum of 30% over the glass beads and 20% over the alumina pellets, and then it decreases to 0 at a liquid flow rate of about 12.5 kg·m2·s−1, which corresponds to the pulsing flow inception point as indicated from Figure 3. Moreover, since the liquid-saturated pores are favorable for liquid spreading and film formation, there should be less rivulet fraction over the alumina pellets surface than that over the glass pellet surface. This speculation has been verified by the theoretical prediction given in Figure 5, and is consistent with the discussions on the action of pores [38,40,41].
The fractions of stagnant liquid over the alumina pellets and glass beads are presented in Figure 7 with the variation in liquid flow rate. This shows that there is more stagnant liquid fraction over the alumina pellets than over the glass ones, which is consistent with the more static liquid holdup in the alumina bed due to the pinning effect of the pores, since the pores can provide an extra force such as the pining force in the liquid spreading process [41]. It is found that despite the fact that the fractions of stagnant liquid region over the two kinds of pellet both decrease rapidly with the increase in liquid flow rate, there are still two obvious differences between them. First, it is shown in the case of glass beads that the stagnant liquid region reduces to 0 at a liquid flow rate of 12.5 kg·m2·s−1 with the inception of pulsing flow. However, in the case of alumina pellets, stagnant liquid still exists even in the pulsing flow regime, and it will not disappear until a much larger liquid flow rate as high as 21 kg·m2·s−1 is attained. Secondly, as shown in the case of glass beads, there is a hysteresis in the stagnant liquid fraction, which means there are more stagnant liquids in the liquid flow rate’s increasing branch, while it is less in the decreasing branch, since the packing surface is better wetted. In comparison, there is no difference in the case of alumina pellets, since the operation history does not bring about any difference in the pellet surface properties.

4.2.2. Evaluation on the External Wetting Efficiency

Since the catalyst packing can only be effectively wetted by the liquid film and rivulet flow, the liquid–solid external wetting should be the joint contribution of these two factors. Since the liquid film provides a surface rather than a volume in the liquid–solid external wetting, its contribution is different from the volumetric contribution of rivulet flow. In this regard, a formula such as Equation (1) is proposed.
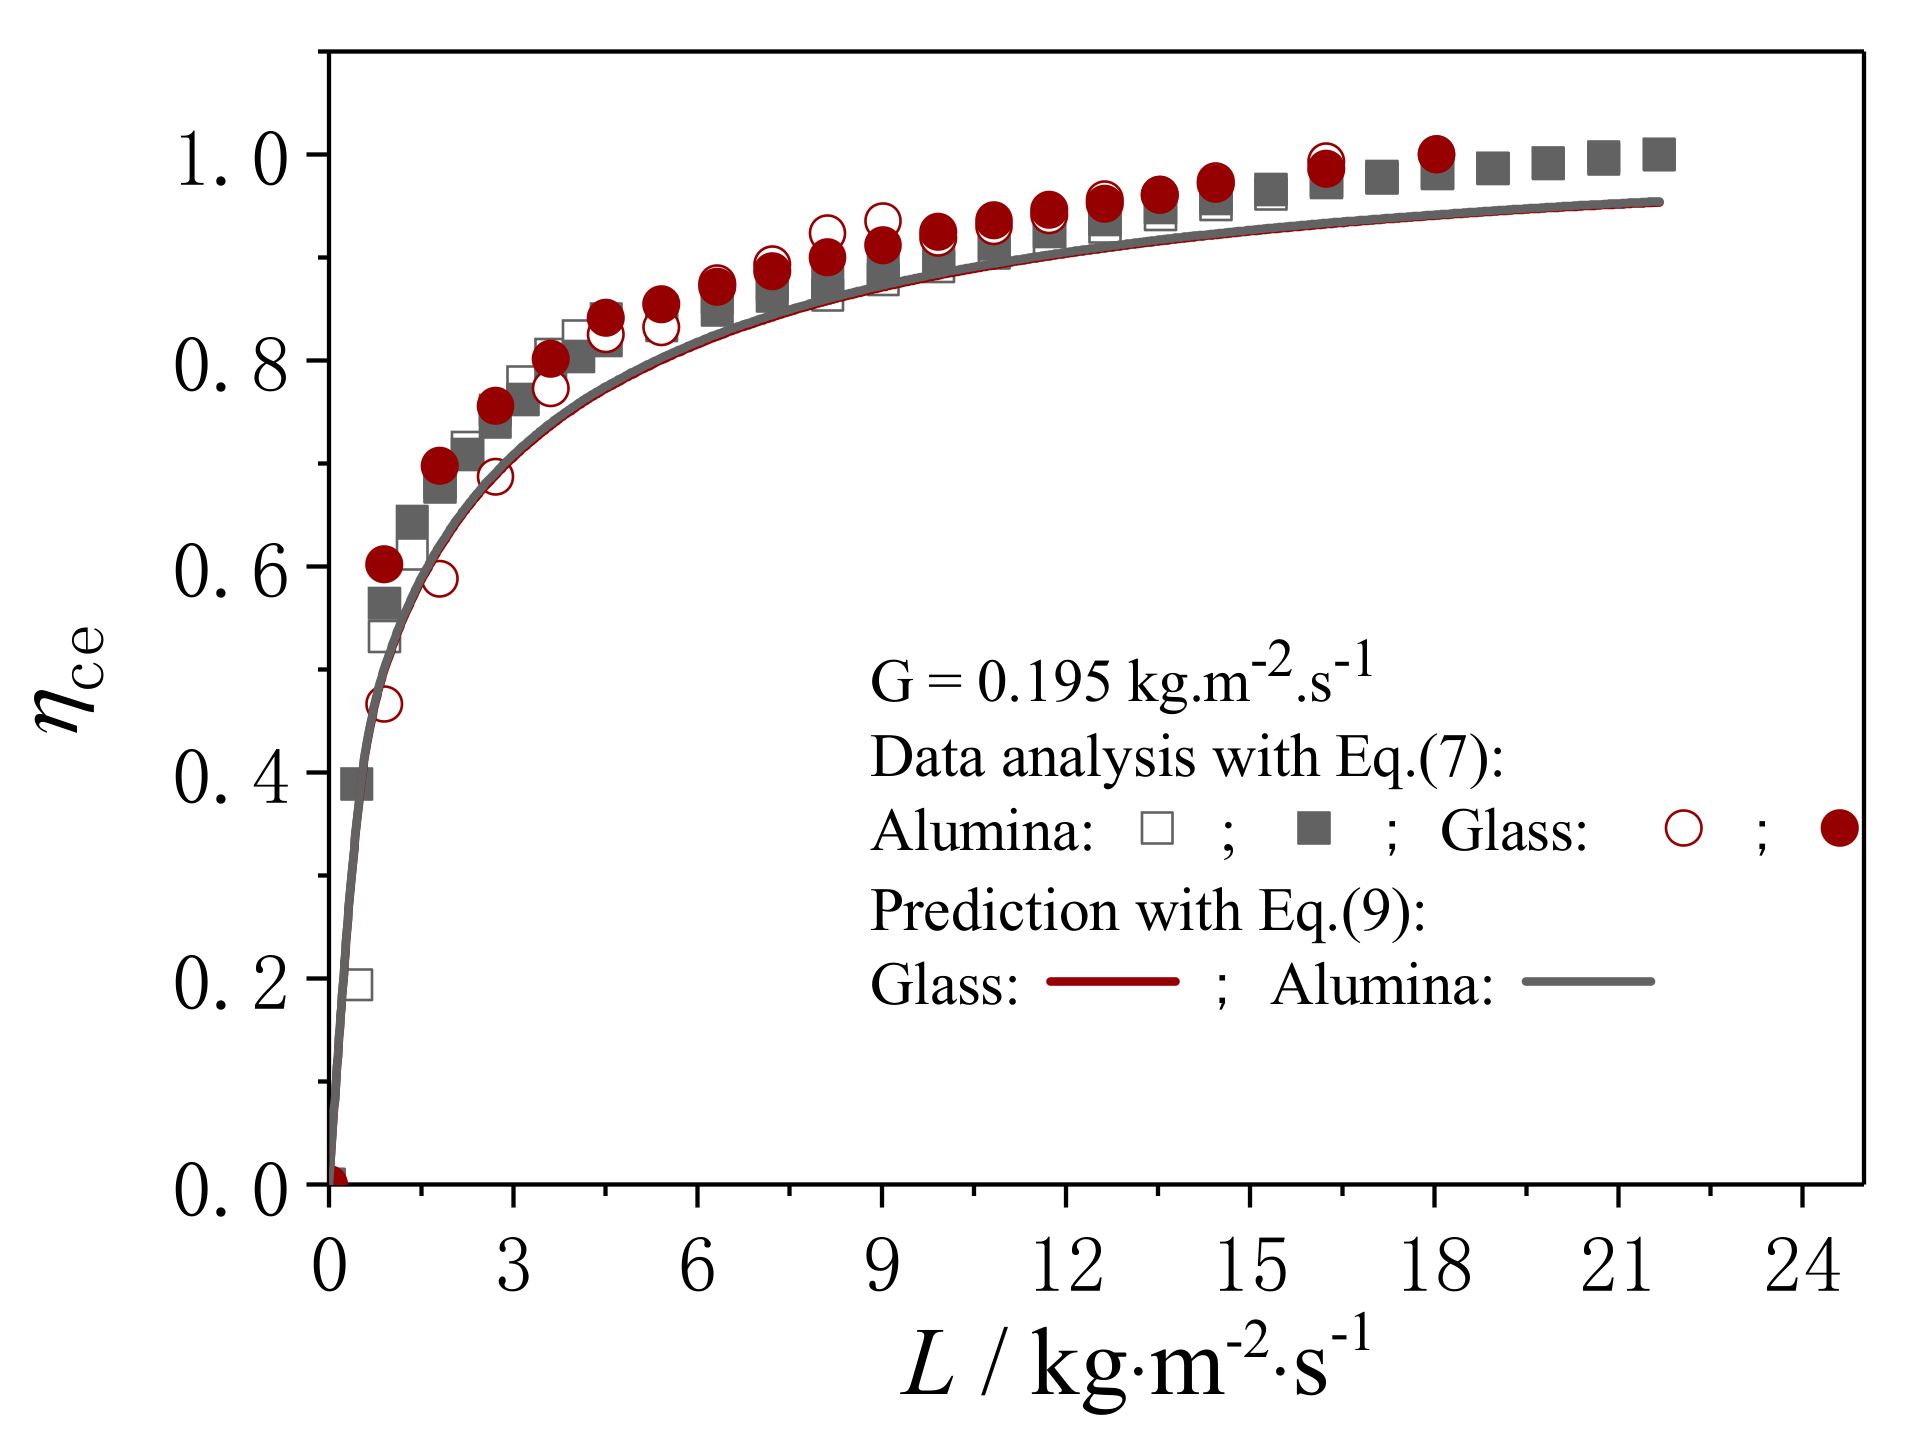
It is shown from Figure 8 that excellent agreements on external wetting efficiency η ce for alumina pellets are obtained between the liquid flow texture-based model and the correlation of Mills and Duduković [24] at all gas and liquid flow rates. It should be noted that the better agreement at the lowest gas velocity of 0.065 kg·m2·s−1 than at the highest one of 0.195 kg·m2·s−1 is due to the conserved result from the correlation of Mills and Duduković [24], since in this correlation, η ce will not reach 1.0 unless the liquid flow rate is infinitely large. In fact, η ce will become 1.0 once the pulsing flow regime is reached. In this regard, the prediction obtained from this work seems to be more reasonable.
Moreover, it is shown in the case of glass beads that the values of η ce in the liquid flow rate’s increasing and decreasing branches are different, which is most obvious at the lowest gas flow rate of 0.065 kg·m2·s−1, since the wetting conditions of the packing surface are different in the two operating branches. In comparison, there is no difference in η ce for the alumina pellets, since the same wetting condition over the packing surface is kept before and after the pulsing flow. In view of the same film flow-covered surface of the glass beads and the alumina pellets in the liquid flow rate’s decreasing branch, the same wetting efficiency ought to be reached, which is confirmed by the model prediction as shown in Figure 8.

5. Conclusions

From the flow texture modeling approach, it becomes possible to identify the wetting condition of a catalyst bed from the fractions of the film flow, rivulet flow, and stagnant liquid at specific gas and liquid flow rates. It shows that despite the wettability of the alumina pellets surface being much lower than that of glass, as evidenced from the liquid–solid contact angle over alumina pellets of about 70° while it is less than 15° over the glass surface, the alumina pellets still exhibit almost the same wetting efficiency as the glass pellets. Due to the presence of pores, it is not only favorable to the formation of film flow but also to the stabilization of stagnant liquid. Different from the glass beads, there is no multiplicity in dynamic liquid holdup and wetting efficiency for the alumina pellets, since the wetting condition of the alumina pellets surface is primarily influenced by the pores rather than by the external environment. The flow texture analysis result verifies the assumptions by Maiti et al. [38] and Schubert et al. [42].

Author Contributions

Conceptualization, Z.C. (Zhenmin Cheng); methodology, Z.C. (Zhenmin Cheng).; investigation, D.L., Z.C. (Zhaoxuan Chen), G.L., Y.T., P.L., B.Z.; data curation, G.L.; writing—original draft preparation, Z.C. (Zhenmin Cheng); writing—review and editing, Y.T.; supervision, Z.C. (Zhenmin Cheng). All authors have read and agreed to the published version of the manuscript.

Funding

The authors are grateful to the financial support from the National Key R&D Program of China (No. 2019YFC1906705) and the National Natural Science Foundation of China (No. 21676085).

Institutional Review Board Statement

Not applicable.

Informed Consent Statement

Not applicable.

Data Availability Statement

All data collected in this study are contained within the article.

Conflicts of Interest

The authors declare no conflict of interest.

Nomenclature

Symbols
a t packing external surface area per unit volume of reactor
A, BErgun equation coefficients, defined in Equation (1)
dppacking diameter, m
E o ¨ Eötvos number, defined in Equation (11)
f w Wetting fraction of the packing surface
ggravitational acceleration, 9.81 m·s−2
Ggas flow rate, kg·m−2·s−1
G a Galileo number, ρ 2 g d p 3 / μ 2
Ga modified Galileo number, ρ 2 g d p 3 ε b 3 / μ 2 1 ε b 3
krelative permeability
Lliquid flow rate, kg·m−2·s−1
PPressure, N·m−2
R e Reynolds number, ρ u d p / μ
Re modified Reynolds number, ρ u d p / μ 1 ε b
Ssaturation degree, degree in Equation (4)
usuperficial velocity, m·s−1
Zaxial distance, m
Greek letters
αcoefficient in Equation (3)
βexponent in Equation (3)
εporosity or holdup
ρdensity, kg·m−3
σsurface tension, N·m−1
Φvolumetric fraction, defined in Equation (5)
ηwetting efficiency
μviscosity, Pa·s
ψdimensionless pressure drop, defined in Equation (2)
Subscripts
bthe bed averaged
cecontacting efficiency
ppacking
Lliquid phase
Ggas phase
filmfilm flow
rivrivulet flow
sstatic liquid
stagstagnant liquid

References

  1. Mary, G.; Esmaeili, A.; Chaouki, J. Simulation of the Selective Hydrogenation of C3-Cut in the Liquid Phase. Int. J. Chem. React. Eng. 2016, 14, 859–874. [Google Scholar] [CrossRef]
  2. Guan, D.; Chen, Z.; Chen, X.; Zhang, Y.; Qi, Q.; Shi, Q.; Zhao, S.; Xu, C.; Zhang, L. Molecular-level heavy petroleum hydrotreating modeling and comparison with high-resolution mass spectrometry. Fuel 2021, 297, 120792. [Google Scholar] [CrossRef]
  3. Mohammed, A.E.; Jarullah, A.T.; Gheni, S.A.; Mujtaba, I.M. Optimal design and operation of an industrial three phase reactor for the oxidation of phenol. Comput. Chem. Eng. 2016, 94, 257–271. [Google Scholar] [CrossRef] [Green Version]
  4. Kasperczyk, D.; Urbaniec, K.; Barbusinski, K.; Rene, E.R.; Colmenares-Quintero, R.F. Application of a compact trickle-bed bioreactor for the removal of odor and volatile organic compounds emitted from a wastewater treatment plant. J. Environ. Manag. 2019, 236, 413–419. [Google Scholar] [CrossRef] [PubMed]
  5. Russo, V.; Kilpiö, T.; Di Serio, M.; Tesser, R.; Santacesaria, E.; Murzin, D.Y.; Salmi, T. Dynamic non-isothermal trickle bed reactor with both internal diffusion and heat conduction: Sugar hydrogenation as a case study. Chem. Eng. Res. Des. 2015, 102, 171–185. [Google Scholar] [CrossRef]
  6. Schubert, M.; Kost, S.; Lange, R.; Salmi, T.; Haase, S.; Hampel, U. Maldistribution susceptibility of monolith reactors: Case study of glucose hydrogenation performance. AIChE J. 2016, 62, 4346–4364. [Google Scholar] [CrossRef]
  7. Srifa, A.; Faungnawakij, K.; Itthibenchapong, V.; Assabumrungrat, S. Roles of monometallic catalysts in hydrodeoxygenation of palm oil to green diesel. Chem. Eng. J. 2015, 278, 249–258. [Google Scholar] [CrossRef]
  8. Aho, A.; Rosales, C.; Eränen, K.; Salmi, T.; Murzin, D.Y.; Grénman, H. Biohydrogen from dilute side streams-Influence of reaction conditions on the conversion and selectivity in aqueous phase reforming of xylitol. Biomass-Bioenergy 2020, 138, 105590. [Google Scholar] [CrossRef]
  9. Thema, M.; Weidlich, T.; Kaul, A.; Böllmann, A.; Huber, H.; Bellack, A.; Karl, J.; Sterner, M. Optimized biological CO2-methanation with a pure culture of thermophilic methanogenic archaea in a trickle-bed reactor. Bioresour. Technol. 2021, 333, 125135. [Google Scholar] [CrossRef]
  10. Hickman, D.A.; Degenstein, J.C.; Ribeiro, F.H. Fundamental principles of laboratory fixed bed reactor design. Curr. Opin. Chem. Eng. 2016, 13, 1–9. [Google Scholar] [CrossRef] [Green Version]
  11. Hickman, D.A.; Holbrook, M.T.; Mistretta, S.; Rozeveld, S.J. Successful Scale-up of an Industrial Trickle Bed Hydrogenation Using Laboratory Reactor Data. Ind. Eng. Chem. Res. 2013, 52, 15287–15292. [Google Scholar] [CrossRef]
  12. Zimmerman, S.P.; Ng, K.M. Liquid distribution in trickling flow trickle-bed reactors. Chem. Eng. Sci. 1986, 41, 861–866. [Google Scholar] [CrossRef]
  13. Lutran, P.G.; Ng, K.M.; Delikat, E.P. Liquid distribution in trickle-beds. An experimental study using computer-assisted tomography. Ind. Eng. Chem. Res. 1991, 30, 1270–1280. [Google Scholar] [CrossRef]
  14. Sederman, A.J.; Gladden, L.F. Magnetic resonance imaging as a quantitative probe of gas–liquid distribution and wetting efficiency in trickle-bed reactors. Chem. Eng. Sci. 2001, 56, 2615–2628. [Google Scholar] [CrossRef]
  15. Van der Merwe, W.; Nicol, W.; de Beer, F. Trickle flow distribution and stability by X-ray radiography. Chem. Eng. J. 2007, 132, 47–59. [Google Scholar] [CrossRef]
  16. Salleh, K.A.M.; Lee, H.K.; Al-Dahhan, M.H. Studying local liquid velocity in liquid–solid packed bed using the newly developed X-ray DIR technique. Flow Meas. Instrum. 2015, 42, 1–5. [Google Scholar] [CrossRef]
  17. Solomenko, Z.; Haroun, Y.; Fourati, M.; Larachi, F.; Boyer, C.; Augier, F. Liquid spreading in trickle-bed reactors: Experiments and numerical simulations using Eulerian–Eulerian two-fluid approach. Chem. Eng. Sci. 2015, 126, 698–710. [Google Scholar] [CrossRef] [Green Version]
  18. Markthaler, S.; Plankenbühler, T.; Weidlich, T.; Neubert, M.; Karl, J. Numerical simulation of trickle bed reactors for biological methanation. Chem. Eng. Sci. 2020, 226, 115847. [Google Scholar] [CrossRef]
  19. Lopes, R.J.G.; de Sousa, V.S.L.; Quinta-Ferreira, R.M. Numerical simulation of reactive pulsing flow for the catalytic wet oxidation in TBR using a VOF technique. AIChE J. 2012, 58, 493–504. [Google Scholar] [CrossRef]
  20. Bouras, H.; Haroun, Y.; Bodziony, F.F.; Philippe, R.; Fongarland, P.; Augier, F. Use of CFD for pressure drop, liquid saturation and wetting predictions in trickle bed reactors for different catalyst particle shapes. Chem. Eng. Sci. 2021, 249, 117315. [Google Scholar] [CrossRef]
  21. Schwartz, J.G.; Weger, E.; Duduković, M.P. A new tracer method for determination of liquid-solid contacting efficiency in trickle-bed reactors. AIChE J. 1976, 22, 894–904. [Google Scholar] [CrossRef]
  22. Colombo, A.J.; Baldi, G.; Sicardi, S. Solid-liquid contacting effectiveness in trickle bed reactors. Chem. Eng. Sci. 1976, 31, 1101–1108. [Google Scholar] [CrossRef]
  23. El-Hisnawi, A.A.; DudukoviĆ, M.P.; Mills, P.L. Trickle-Bed Reactors: Dynamic Tracer Tests, Reaction Studies, and Modeling of Reactor Performance. In Chemical Reaction Engineering; American Chemical Society: Boston, MA, USA, 1982; Volume 196, pp. 421–440. [Google Scholar]
  24. Mills, P.L.; Dudukovic, M.P. Evaluation of liquid-solid contacting in trickle-bed reactors by tracer methods. AIChE J. 1981, 27, 893–904. [Google Scholar] [CrossRef]
  25. Ring, Z.E.; Missen, R.W. Trickle-bed reactors: Tracer study of liquid holdup and wetting efficiency at high temperature and pressure. Can. J. Chem. Eng. 1991, 69, 1016–1020. [Google Scholar] [CrossRef]
  26. Julcour-Lebigue, C.; Baussaron, L.; Delmas, H.; Wilhelm, A.-M. Theoretical analysis of tracer method for the measurement of wetting efficiency. Chem. Eng. Sci. 2007, 62, 5374–5379. [Google Scholar] [CrossRef] [Green Version]
  27. Baussaron, L.; Julcour-Lebigue, C.; Wilhelm, A.-M.; Boyer, C.; Delmas, H. Partial Wetting in Trickle Bed Reactors:  Measurement Techniques and Global Wetting Efficiency. Ind. Eng. Chem. Res. 2007, 46, 8397–8405. [Google Scholar] [CrossRef]
  28. Baussaron, L.; Julcour-Lebigue, C.; Wilhelm, A.-M.; Delmas, H.; Boyer, C. Wetting topology in trickle bed reactors. AIChE J. 2007, 53, 1850–1860. [Google Scholar] [CrossRef]
  29. Lappalainen, K.; Alopaeus, V.; Manninen, M.; Aittamaa, J. Improved Hydrodynamic Model for Wetting Efficiency, Pressure Drop, and Liquid Holdup in Trickle-Bed Reactors. Ind. Eng. Chem. Res. 2008, 47, 8436–8444. [Google Scholar] [CrossRef]
  30. Van Houwelingen, A.J.; Sandrock, C.; Nicol, W. Particle wetting distribution in trickle-bed reactors. AIChE J. 2006, 52, 3532–3542. [Google Scholar] [CrossRef]
  31. Julcour-Lebigue, C.; Augier, F.; Maffre, H.; Wilhelm, A.-M.; Delmas, H. Measurements and Modeling of Wetting Efficiency in Trickle-Bed Reactors: Liquid Viscosity and Bed Packing Effects. Ind. Eng. Chem. Res. 2009, 48, 6811–6819. [Google Scholar] [CrossRef] [Green Version]
  32. Pironti, F.; Mizrahi, D.; Acosta, A.N.; González-Mendizabal, D. Liquid–solid wetting factor in trickle-bed reactors: Its determination by a physical method. Chem. Eng. Sci. 1999, 54, 3793–3800. [Google Scholar] [CrossRef]
  33. Kundu, A.; Nigam, K.D.P.; Verma, R.P. Catalyst wetting characteristics in trickle-bed reactors. AIChE J. 2003, 49, 2253–2263. [Google Scholar] [CrossRef]
  34. Satterfield, C.N. Trickle-bed reactors. AIChE J. 1975, 21, 209–228. [Google Scholar] [CrossRef]
  35. Morita, S.; Smith, J.M. Mass Transfer and Contacting Efficiency in a Trickle-Bed Reactor. Ind. Eng. Chem. Fund. 1978, 17, 113–120. [Google Scholar] [CrossRef]
  36. Van Houwelingen, A.J.; Nicol, W. Parallel hydrogenation for the quantification of wetting efficiency and liquid-solid mass transfer in a trickle-bed reactor. AIChE J. 2011, 57, 1310–1319. [Google Scholar] [CrossRef] [Green Version]
  37. Adamsom, A.; Gast, A. Physical Chemistry of Surfaces, 6th ed.; Wiley: New York, NY, USA, 1997. [Google Scholar]
  38. Maiti, R.N.; Khanna, R.; Sen, P.K.; Nigam, K.D.P. Enhanced liquid spreading due to porosity. Chem. Eng. Sci. 2004, 59, 2817–2820. [Google Scholar] [CrossRef]
  39. Ravindra, P.V.; Rao, D.P.; Rao, M.S. Liquid Flow Texture in Trickle-Bed Reactors:  An Experimental Study. Ind. Eng. Chem. Res. 1997, 36, 5133–5145. [Google Scholar] [CrossRef]
  40. Khanna, R.; Nigam, K.D.P. Partial wetting in porous catalysts: Wettability and wetting efficiency. Chem. Eng. Sci. 2002, 57, 3401–3405. [Google Scholar] [CrossRef]
  41. Maiti, R.N.; Arora, R.; Khanna, R.; Nigam, K.D.P. The liquid spreading on porous solids: Dual action of pores. Chem. Eng. Sci. 2005, 60, 6235–6239. [Google Scholar] [CrossRef]
  42. Schubert, M.; Hessel, G.; Zippe, C.; Lange, R.; Hampel, U. Liquid flow texture analysis in trickle bed reactors using high-resolution gamma ray tomography. Chem. Eng. J. 2008, 140, 332–340. [Google Scholar] [CrossRef]
  43. Wang, R.; Mao, Z.-S.; Chen, J. Experimental and theoretical studies of pressure drop hysteresis in trickle bed reactors. Chem. Eng. Sci. 1995, 50, 2321–2328. [Google Scholar] [CrossRef]
  44. Cheng, Z.; Kong, X.; Zhu, J.; Wang, Z.; Jin, J.; Huang, Z. Hydrodynamic modeling on the external liquid–solid wetting efficiency in a trickling flow reactor. AIChE J. 2013, 59, 283–294. [Google Scholar] [CrossRef]
  45. Gianetto, A.; Specchia, V. Trickle-bed reactors: State of art and perspectives. Chem. Eng. Sci. 1992, 47, 3197–3213. [Google Scholar] [CrossRef]
  46. Sáez, A.E.; Carbonell, R.G. Hydrodynamic parameters for gas-liquid cocurrent flow in packed beds. AlChE J. 1985, 31, 52–62. [Google Scholar] [CrossRef]
  47. Christensen, G.; McGovern, S.J.; Sundaresan, S. Cocurrent downflow of air and water in a two-dimensional packed column. AIChE J. 1986, 32, 1677–1689. [Google Scholar] [CrossRef]
  48. Levec, J.; Grosser, K.; Carbonell, R.G. The hysteretic behavior of pressure drop and liquid holdup in trickle beds. AIChE J. 1988, 34, 1027–1030. [Google Scholar] [CrossRef]
  49. Chu, C.F.; Ng, K.M. Model for pressure drop hysteresis in trickle-beds. AIChE J. 1989, 35, 1365–1369. [Google Scholar] [CrossRef]
  50. Kramer, G.J. Static liquid hold-up and capillary rise in packed beds. Chem. Eng. Sci. 1998, 53, 2985–2992. [Google Scholar] [CrossRef]
  51. Sáez, A.E.; Yépez, M.M.; Cabrera, C.; Soria, E.M. Static liquid holdup in packed beds of spherical particles. AIChE J. 1991, 37, 1733–1736. [Google Scholar] [CrossRef]
  52. Ortiz-Arroyo, A.; Larachi, F.Ç.; Iliuta, I. Method for inferring contact angle and for correlating static liquid hold-up in packed beds. Chem. Eng. Sci. 2003, 58, 2835–2855. [Google Scholar] [CrossRef]
Figure 1. Parallel zone model describing liquid flow texture in a trickle bed.
Processes 10 00135 g001
Figure 2. Dynamic liquid holdup measurements for different pellet diameters. ◯, □—Liquid flow rate increasing; ⬤, ■—Liquid flow rate decreasing.
Processes 10 00135 g002aProcesses 10 00135 g002b
Figure 3. Influence of gas and liquid flow rates on pressure drop hysteresis. ◯, □—Liquid flow rate increasing; ⬤, ■—Liquid flow rate decreasing.
Processes 10 00135 g003
Figure 4. Parity plots of pressure drop measurements versus the predictions.
Processes 10 00135 g004
Figure 5. Fraction of film flow over the packing surface. ◯, □—Liquid flow rate increasing; ⬤, ■—Liquid flow rate decreasing.
Processes 10 00135 g005aProcesses 10 00135 g005b
Figure 6. Fraction of rivulet flow over the packing surface. ◯, □—Liquid flow rate increasing; ⬤, ■—Liquid flow rate decreasing.
Processes 10 00135 g006aProcesses 10 00135 g006b
Figure 7. Fraction of stagnant liquid over the packing surface. ◯, □—Liquid flow rate increasing; ⬤, ■—Liquid flow rate decreasing.
Processes 10 00135 g007
Figure 8. Prediction of liquid–solid wetting efficiency. ◯, □—Liquid flow rate increasing; ⬤, ■—Liquid flow rate decreasing.
Processes 10 00135 g008aProcesses 10 00135 g008b
Table 1. Packing characteristics and static liquid holdup.
Packing
Material
Shapedp
/mm
ε b ε s |Exp.-Cal. *|/Cal. *
Exp.Cal. *
aluminasphere1.60.3610.074690.0497550.13%
glasssphere1.90.3680.049940.049650.58%
* Calculated from Equation (10).
Table 2. Correlations of the gas phase relative permeability vs. the gas phase saturation in the liquid flow rate’s decreasing branch.
Packing MaterialG/kg·m2·s−1
0.0650.1300.195
Alumina k G = 0.92 S G 2.03 k G = 0.98 S G 2.20 k G = 0.98 S G 2.55
Glass k G = 0.90 S G 2.99 k G = 1.01 S G 3.08 k G = 1.05 S G 3..21
Publisher’s Note: MDPI stays neutral with regard to jurisdictional claims in published maps and institutional affiliations.