1. Introduction
A bubble can be defined as a rapid increase in the price of a good, which increases due to the exuberant behavior of the consumer or the market. Bubbles appear in the market when the investor invests in market assets, securities, goods and so forth, in the interest of profitability. This rapid price increase is much more than the productive capacity or the actual value of an asset that no one on the market wants to buy. This leads to a sharp decline in the price of an asset where everyone begins to sell their assets, creating economic turbulence [
1].
With the increase in output, oil is considered as an indicator that has determined the economic development of a country. Oil is considered of prime importance for each country, so its price affects the production of a country. An increase in the price of oil leads to an increase in the cost of production, import bills, and price of petroleum goods, and thus a reduction in the production capacity of a country due to high input cost, which results in low demand, low investment as well as poor economic growth and lower purchasing power [
2].
Caspi and Katzke [
3] detected a bubble in US crude oil from the WTI monthly price series using the generalized sup ADF (ADF) test procedure. The recursive identification algorithms used in this analysis recognize several price exclusivities with macro variables. Zhang and Yao [
4] inspected the presence of bubbles in the crude oil, diesel and petrol markets using the State–Space model and the log-periodic power law (LPPL) model. Su and Li [
5] detected the existence of multiple bubbles in West Texas Intermediate (WTI) crude oil price by using the generalized sup Augmented Dickey–Fuller (GSADF) method and found six bubbles from 1986 to 2016.
Perifanis [
6] examined West Texas Intermediate (WTI) price bubbles, as well as the length and causes of the bubble. The results of this paper indicate that there are speculative episodes in the Brent oil price series, but not in the WTI price series. Li and Chevallier [
7] detected the presence of a bubble in the US, European, and Asian natural gas markets by using the generalized sup ADF (GSADF) test, and the results indicate the presence of bubbles. All of this literature review shows that there have been studies in the past that have found multiple bubbles in the oil price series.
Thus, the following subsections show some historical bubbles that the world has witnessed, which have been clarified as Tulip Mania, the South Sea Bubble, the Dotcom Bubble, and the US Housing Bubble. Going back to history, the most significant speculative bubble was the Tulip Mania that began in 1636 and early 1637 in Holland. Tulips of different colors were introduced and people began to buy them in abundance. The demand overwhelmed the supply of tulips to such an extent that its price reached a point where it was sold at a cost where people mortgage their homes and businesses.
However, by the end of 1637, after reaching a peak, the price of tulips had fallen and left tulip owners bankrupt. The South Sea Bubble, which had destroyed many investors in 1720, was because of a joint stock company that was established in 1711 in London, supplying slaves for Spanish plantations in Central and South America. In anticipation of the success of East India Company, investors took the stock of South Sea Company. There was an implausible boom in the company’s shares in 1720, but stock prices reached much higher than the company’s profits, which drove the market to collapse in September. The company’s stocks plummeted destroying many investors.
Due to the increasing popularity of the Internet in the 1990s, many investors invested in Internet-based startups in the hope of earning profits. The confidence of investors that their investments are going to generate profits created an environment, the NASDAQ composite index, which contained shares of dot.com businesses, and which reached more than 5000 in 2000. However, the index fell quickly because investors neglected the traditional basic investment matrices and caused a recession in the United States. Many economists believe that due to the bursting dot.com bubble, many investors concluded that investing in real estate was safer and better. They began investing in housing markets that doubled housing prices in the United States between 1996 and 2006. In 2006, the value of homes in the US increased and then began to fall, resulting in the average US home losing one-third of its value in 2009. American homes soared and crashed, and the impact on mortgage-backed securities resulted in the first global economic crisis since the Great Depression.
The Asian crisis that took place worldwide in 1997 affected Singapore, Malaysia, Indonesia, Taiwan, the Philippines and South Korea. Later, there was the global financial crisis in 2007–2008, when many financial institutions went bankrupt. The failure of these institutions resulted in a global financial market freeze and required government intervention on a global scale. The European debt crisis and unemployment in Greece and Spain have had a major negative impact on the economy and the labor market. The collapse of price bubbles on financial markets, such as foreign exchange markets, equity markets and housing markets, has caused all these crises.
These events highlight the importance of bubble detection and have revealed its implications. It has been shown that the bursting of a bubble can lead to the collapse of large financial institutions, bring countries to the brink of bankruptcy and lead to complete financial and economic crises. Consequently, the detection of a bubble is very important because a sudden eruption can cause a disruption of economic activity, which leads to other disrupting factors such as unemployment, low wages, financial instability, and the disruption of economic activity.
Most developed and developing countries produce electricity through alternate sources such as renewables including wind, solar, water, etc.; however, Pakistan depends on oil for the production of electricity, which is quite an expensive input. An increase in the oil prices impacts the GDP of Pakistan, contributes to inflation, a rise in the budget deficit, and makes import expensive by putting downward pressure on the exchange rate. Much work is available on bubble detection for the oil prices considering data of different countries; however, no empirical work is available on bubble detection in commonly used fuels for Pakistan. The present research takes a lead and fills this void, addressing this very significant issue in Pakistan using the newly developed Phillips and Shi [
8] approach—the generalized supremum ADF (GSADF). The approach has several advantages over other strategies generally used to detect bubble detection as it can detect periodically collapsing multiple bubbles, whereas previous approaches were designed to detect only a single bubble. The GSADF approach also provides the information on start and end dates of bubbles by using its date-stamping strategy. Thus, the present study will be a good addition to the existing literature, particularly for Pakistan.
The remainder of the paper is organized as follows.
Section 2 provides a thorough and critical summary of the literature.
Section 3 looks at the theoretical and econometric methodology.
Section 4 contains the results and discussions, while
Section 5 presents some relevant policy proposals and the conclusion of the study.
2. Literature Review
The literature on bubble detection exists not only in oil price series, but also in various financial markets, such as gold, agriculture, stocks, housing, etc. See, for example, Campbell and Lo [
9], Diba and Grossman [
10], and Chang and Aye [
11] for stock markets; Brooks and Prokopczuk [
12] for housing markets; Fantazzini [
13] for oil prices; Flood and Garber [
14] for inflation; Caspi and Katzke [
3] for commodity price bubbles.
With reference to the oil market, studies have been undertaken in different economies covering WTI, BRENT, US, Asia, Europe, and many others, by employing different methods of testing, such the usual right-tailed Augmented Dickey–Fuller (ADF) test, sup-ADF and the generalized SADF tests.
Hall and Psaradakis [
15] detect the collapse of the consumer price bubble and Argentina’s exchange rate in terms of monthly USD data. Time series data from 1983 to 1989 were tested by using the Dickey–Fuller test and Markov switching approach. The results revealed that it is better to switch to the ADF approach to identify bubbles in the exchange rate market; therefore, the null hypothesis, which endorses explosive behaviors in the data, is rejected.
Yumashev and Ślusarczyk [
16] speculated the presence of bubbles in the US stock market by applying a momentum threshold autoregressive (MTAR) model, a non-linear time series technique to detect bubbles. Time series from 1871 to 1999, together with monthly data from 1871 to 2001, were used. The results of the analysis of two subsamples of data (1871 to 1995) and a subsample of data (1871 to 2001) confirm the existence of bubbles. General findings conclude that the market collapsed as a result of the presence of a bubble in the 1990s.
In their study, An and Mikhaylov [
17] developed a model which made it possible to quantitatively determine whether a bubble exists in the gold market or not. They calculated the difference between the market and the fundamental price. Data were taken from August 2011 to September 2011 to determine if there exists a martingale or a local martingale under the risk-neutral possibilities through random process. If the volatility is too large as measured through a modified Florens–Zmirou estimator then there exists a bubble. However, the results concluded that gold price is a martingale and not a local martingale, so there exists no bubble in the gold market during the testing period.
Fantazzini [
13] argued that in 2014/2015, there was a negative bubble in oil prices, reducing them above the extent warranted by economic fundamentals. Two sets for bubble prediction methods have been corroborated: the first set consists of financial bubble measures, while the second set consists of the log-periodic power law (LPPL) model for negative financial bubbles. The data of daily nominal and real WTI (West Texas Intermediate) oil prices series were taken from January 2013 to April 2015. This time frame was selected because the researcher concentrated on the price collapse that occurred at the end of 2014. The results conclude that in the last months of 2014 and early 2015, the price of oil experienced a financial bubble.
In their paper based on historical crude oil, Zhang and Yao [
4] analyzed diesel and gasoline market data taken from November 2001 to December 2015. The study used the State–Space model and the log-periodic power law (LPPL) model to detect dynamic oil price bubbles and predict the moment of their collapse. The results conclude that, first, there are only oil market bubbles between November 2001 and July 2008, and bubbles are the driving force behind the rise in crude oil and diesel prices. Secondly, the State–Space model detects the bubbles in crude oil and diesel prices that differ in time. Finally, the crash time of bubbles is well estimated by the LPPL model.
In their paper, Dinçer and Lisin [
18] examined the existence of multiple bubbles in West Texas Intermediate (WTI) crude oil price by using the generalized sup Augmented Dickey–Fuller (GSADF) method proposed by Phillips and Shi [
8]. Crude oil is considered to be of primary importance in both the energy sector and the capital market. Data were collected from January 1986 to April 2016 and multiple bubbles on the WTI oil market were detected in 1990, 2005, 2006, 2008 and 2015. The results indicate that there were six bubbles between 1986 and 2016 and that oil prices differ from their inherent value. The bubble dates are consistent with particular events in the global and financial markets.
Caspi and Katzke [
3] detected the existence of multiple bubbles by using the generalized sup ADF (GSADF) test procedure developed [
8]. The researchers used monthly data from 1876 to 2014 and classified explosive cycles of oil prices in comparison to the general market level and stocks of oil in the US after 1876 and 1920, respectively. The recursive identification algorithms used in this analysis recognize several periods of price exclusivity and provide guidance for examining the macroeconomic effect of historic periods with large increases in oil prices.
Liaqat and Nazir [
19] used the GSADF to detect the existence of numerous bubbles at the Pakistan Stock Exchange across different industrial sectors. Monthly data from 2007 to 2016 were used for the analysis and indicated that the industries where there are no stock bubbles are investment, chemicals and textile spinning. They concluded in their analysis that several bubbles were present in the KSE-100 index.
Perifanis [
6] researched for a bubble in West Texas Intermediate (WTI) from the periods (1 January 1947 and 1 September 2018). The main purpose of the study, besides the identification of the existence and duration of the bubbles, was to understand the cause behind each explosive bubble. The study used two methodologies including PWY (2011) and PSY (2015) for bubble detection. The PWY (2011) date-stamping process detects only two bubble periods in real WTI prices. In comparison, PSY (2015) suggests seven bubbles, while the era of the 1978 oil crisis is implicated as an explosion period.
In their paper, Liz and Ruiz-Herrera [
20] examined the presence of multiple bubbles for WTI and BRENT oil price series by taking weekly data between 1990 and 2019 using GSADF right tail tests initiated. The result of this paper indicates the presence of speculative episodes in Brent oil price series but not in the WTI price series because the former is a more united market and less vulnerable to speculative movements.
Fatima and Ahmed [
21] tested for the existence of bubbles in the agricultural commodities of Pakistan. They used monthly data of agricultural commodities from January 2000 to May 2018 (wheat, rice, cotton, sugar, maize, barley, and soybean) by applying the GSADF method. The analysis revealed the presence of 22 bubbles in agricultural commodities. Butt and Ahmed [
22] took the initiative to detect the presence of multiple bubbles in five distinct sets of inflation rates such as the CPI, SPI, WPI, CPIG and CPIF by applying GSADF. The observational results were built on data taken from the monthly time series from January 2006 to January 2019. The results led to the conclusion that a number of bubbles were detected in the non-food WPI and CPI. For the remaining series, only a single bubble has been detected.
Li and Chevallier [
7] detected the origin and termination of housing bubbles in 140 US cities during the period from 1989 to 2017. Many factors were examined in this study: first, the existence of housing bubbles in US cities; second, the identification of the period of housing bubbles and the determination of the origin of housing bubbles; and third, the potential basis of regional variation in the existence of bubbles. The methodology used for bubble detection is GSADF (2013) and the results of the study indicate bubbles in 40 cities out of 140.
Li and Chevallier [
7] detected bubbles in all three potential US, European and Asian markets. Monthly data from January 1996 to June 2017 were taken for analysis and it was found that the price bubble of the natural gas industry has a great impact on the economy at micro and macro levels. The detection of gas price bubbles is necessary in order to develop effective strategies to deal with the explosion of bubbles. The results indicate the presence of bubbles between January 1996 and June 2017 in the European market, January 1996 and June 2017 in the Asian market, and between January 1996 and June 2017 in the US market.
Li and Chevallier [
7] examined volatility in asset prices due to the existence of bubbles. He used the real stock prices and dividend data from 1871 to 1997, consisting of 122 observations. The methodology used was augmented Dickey–Fuller tests. The results of the findings conclude that much of the deviation from the actual prices was due to the presence of bubbles and the H0 hypothesis, which states that no bubble is rejected as the conclusion shows that the deviation is frequently attributed to the presence of bubbles in the model, which deviates the actual asset prices.
Hall and Psaradakis [
15] detected the collapsing bubble in consumer prices and the exchange rate of Argentina in terms of USD monthly data. Time series data for the analysis was taken from 1983 to 1989. Data were tested using the Dickey–Fuller test and by employing the Markov switching approach. The results show that it is better to switch to the ADF approach to identify bubbles in the exchange rate market; therefore, the null hypothesis, which endorses explosive behaviors in the data, is rejected.
Brooks and Prokopczuk [
12] determine the occurrences of bubbles in the UK for traded equity property stocks. The time series data have been taken from 1986 to 1998 by employing a co-integration analysis. The methodology includes the dividend discount and Gordon growth method as well as variance bound tests, which are used to detect the presence of bubbles. However, the results of the findings conclude that bubbles existed in the 1980s, but that no bubbles existed in the 1990s. Inclusively, these bubbles are short-lived.
Bohl [
23] speculated the presence of bubbles in the US stock market by applying a momentum threshold autoregressive (MTAR) model, a non-linear time series technique to detect bubbles that cause sudden rise followed by an abrupt crash. Time series data from 1871 to 1999, as well as monthly data from 1871 to 2001, are analyzed. The results of the analysis in two subsamples of data (1871 to 1995) suggested that there was no major bubble, and a subsample of data (1871 to 2001) implied the existence of bubbles since the 1990s, so the general findings conclude that the market crashed due to the presence of a bubble.
In their paper, Case and Shiller [
24] analyzed whether there exist multiple bubbles in the housing market or not. Their study was conducted through a survey supervised in 2003, of the people of four big cities (Los Angeles, San Francisco, Boston, and Milwaukee) that bought houses. A random sample method was used for the survey. The results of the survey show that several factors affect housing buying behavior and also tell us whether a housing bubble exists or not. These factors include investment motives and the desire for additional price increase, the need for urgency to purchase a home, and adherence to short-sighted hypotheses about the housing markets. However, the results showed that there existed no bubble in 2003 as there was in 1988; the 2003 survey was a replica of the 1988 survey, with the difference that Milwaukee was added as a new case in 2003. These results also indicate that these prices cannot be sustained at such high levels for long and that a bubble is inevitable.
In their paper, Noussair and Tucker [
25] considered future markets and the formation of a bubble in the asset market, which differed from Smith et al.’s (1988) study where they observed bubbles and crashes. The results of the study indicated that when future markets are present, bubbles do not occur in the spot market because the future market decreases the speculation and decision errors that seem to give rise to price bubbles in asset markets. The data was taken from October 2002 to April 2003, involving 12 traders in each of the sessions.
Wang and Fan [
26] detected the rational bubble in the Korean stock market. The data was taken from 1996 to November 2007; they used three integration tests, namely, the JJ, KSS, and BN approaches. The findings of the traditional JJ test confirmed the existence of rational bubbles, while both the nonlinear KSS test and the nonparametric BN test proved that rational bubbles may not have been present in the capital market of Korea.
In their paper, Jarrow and Kchia [
27] developed a model that can quantitatively determine whether a bubble exists in the gold market or not. They calculated the difference between the market and the fundamental price. The data were taken from 25 August 2011 to 1 September 2011. They analyzed it to determine if there existed a martingale or a local martingale under the risk-neutral possibilities. If the volatility was too large as measured through a modified Florens–Zmirou estimator, then there existed a bubble; however, the results indicated that gold price is a martingale and not a local martingale, so there existed no bubble in the gold market during the testing period.
Baur and Glover [
28] established a study to determine bubbles in gold prices. They used the method developed by Phillips and Shi [
8]. They used different start dates and then they were able to detect periods of significant and insignificant explosive price behaviors. From 2002 to 2012, the results of the estimates indicate significant explosive price behaviors; however, in 2008, this behavior was disturbed by the financial crisis. However, the results show strong evidence of the bubble in gold prices.
Yiu and Yu [
29] detected bubbles in the residential property market of Hong Kong. Data was taken from March 1993 to March 2011 and the recently built PSY approach which defines the asset price bubble in the residential real estate of the Hong Kong property market. The findings show nine bubbles between 1994 and 2011, and the result shows the speculative bubble in the Hong Kong property market in 1997, another positive bubble from January to March 2004, which was short-lived, and lastly, our approach distinguishes two bubbles, one from April to August 2009 and one from February to March 2011.
In their paper, Bouoiyour and Selmi [
30] investigated whether Bitcoin is an income or a speculative bubble. Their study’s main objective was to determine the main driving force behind the Bitcoin price, business transaction, and consumer attractiveness. Data used for Bitcoin price was taken on a daily basis through the blockchain website (ETR); the user’s attractiveness to Bitcoin was collected through daily Bitcoin views on Wikipedia. However, the results uncovered a few contrasts regarding the frequencies in question, featuring the multi-faced nature of surveying what Bitcoin resembles and more trouble to identify this developing cryptocurrency. This paper concludes that Bitcoin is a speculative bubble without disregarding its convenience for monetary reasons.
Etienne and Irwin [
31] tested the presence of bubbles in US future agricultural markets. The data was taken from 1970 to 2011 and an ADF test was applied for testing. The results concluded that multiple price explosiveness exists and most of the bubbles are momentary and last less than ten days; moreover, the results also suggested that approximately one-third of the bubbles are negative. All these factors include incompetent commodity markets, increase trading volume, and technological advancement.
Adämmer and Bohl [
32] investigated corn, soya bean, and wheat prices in the US. Data were taken from January 1983 to April 2011. The results indicate that bubbles exist in wheat prices because it is a high energy-consuming commodity as compared to others and has a large share in US exports, while for corn and soya bean, the results were inconclusive.
de Holanda Barbosa and da Silva Filho [
33] tested bubble detection for hyperinflation in Brazil. They used the time series tax revenue data from 1947 to 2003, using the ADF approach. The results indicated that strong hyperinflation is rejected whereas weak hyperinflation is not rejected and the hypothesis that hyperinflation is caused due to bubble presence is rejected.
Coskun and Jadevicius [
34] detected bubbles in Turkey’s housing market by using the GSADF approach. Data was taken on a monthly basis from January (2010) to June (2014). The results of the observations oppose the existence of bubbles over the chosen duration of time and also suggest that the theory that demand conditions have led prices to emerge is true.
Greenaway-McGrevy and Phillips [
35] examined the detection of housing bubbles in the metropolitan centers in New Zealand. Therefore, they used data from 1993 to 2014, by applying the bubble tests initiated by Phillips et al. The results indicate that the real estate sector in Auckland City contributed to the rise of bubbles in the other centers by up to two quarters in 2003, as well as other TAs in the Auckland area by a single quarter, which was due to high cost of real estate
Gomez-Gonzalez and Gamboa-Arbeláez [
36] examined the bubble detection in housing prices for 18 OECD countries. Data was taken quarterly from 1970 to 2013. The methodology used was GSADF and the co-explosive technique suggested by Engsted and Nielsen [
37] to test for bubble detection. The results of the study show the explosiveness in housing prices which supports the hypothesis of the bubble presence.
In their paper, Bevilacqua and Fassò [
38] analyzed whether the Internet is facing another bubble, keeping in mind the 1999–2000 dotcom bubble. He put forward four criteria to determine whether there exists a bubble or not. The first criteria consist of the determination of venture capital funding as it is the main culprit of a speculative bubble. The second consists of initial public offerings. The third was the NASDAQ stock exchange as it played a major role in the dotcom bubble phenomena. The last was to analyze different external signals. However, the results concluded that the venture capital funding is very high and the majority of the portion was taken by the technological industry, and soon after, a downward trend showed that a bubble might be present. As far as IPO earning is concerned, the data showed the companies went public before earing any profits as they went public at the time of dotcom bubble, which shows that bubble might have existed on its way to the tech company. As the external signals are concerned, they concluded that according to their results, the venture capital index has declined, which may not confirm a bubble; however, if there exists a bubble, it might burst very soon.
Arshanapalli and Nelson [
39] detected bubbles through four econometric tools. The variance bound test was used but, due to several errors in the test, a new test was developed, named the West Test. The West Test could detect bubbles but it could not identify the start and end dates. Another test called co-integration was used but it faced the same problem as the West Test, so they then used a unit root test that was capable of detecting bubbles present; however, it still could not detect multiple bubbles. To detect multiple bubbles, the ADF test was developed by Phillips and Shi [
8] which detects multiple bubbles as well as detecting the start and end dates of a bubble. However, the author of the paper concluded that the accessibility of such real-time monitoring instruments would encourage financial specialists and portfolio directors to rebalance their portfolios during the existence of such bubbles in the stock market.
Caramugan and Bayacag [
40] analyzed exports, mainly rice, rubber, and palm oil, by using monthly time series data from 1980 to 2015. They used GSADF and date stamps for the initiation and end of bubbles. The results of the finding concluded that there exist multiple bubbles; numerous factors have backed price swells such as low stock, rising oil prices, weak currency, and instability in commodity markets.
Alexakis and Bagnarosa [
41] tested bubble detection in the prices of hog corn and soybean future meals. They used monthly time series data from January 2001 to April 2016. Data series were analyzed using the BSDAF approach and co-integrated vector autoregressive model. However, the results concluded that bubbles in feed do not co-integrate with the price of the hog.
Greenaway-McGrevy and Phillips [
35] established a study to identify bubbles in house prices-to-rent ratios in Australian capital cities. To investigate whether the house price-to-rent ratio in the national capital, Canberra, and any of the state capital cities (Adelaide, Brisbane, Hobart, Melbourne, Perth, and Sydney) demonstrated explosive activity at any point in time, they used the PSY research algorithm. The data used from December 1995 to August 2015 were sourced from SIRCA’s (2015) Core Logic RP online database. The findings show proof of asset bubbles in many capital cities, many of which are broadly consistent with the construction boom in the first half of the 2000s.
Liaqat and Nazir [
19] used the GSADF model to detect the existence of numerous bubbles in the Pakistan stock exchange through various industrial sectors. They used monthly data from 2007 to 2016. The analysis reveals that the only industries in which no stock bubbles are found are investment, chemical, and textile spinning, and concluded in their analysis the presence of several bubbles in the KSE-100 Index, along with numerous industrial sectors.
Zhang and Wang [
42] detected multiple bubbles in the Chinese food market. Monthly data were taken from January 1990 to December 2017 using the GSADF technique. The results indicate that four explosive bubbles episodes prevailed. These bubbles occurred due to various factors such as supply and demand differences, depreciation in USD, financial crisis, and speculation.
Fatima and Ahmed [
21] tested for the existence of bubbles in agricultural commodities of Pakistan. This study led to the detection of bubbles in different agricultural commodities of Pakistan. The statistics used were monthly data for the price of agricultural commodities from January 200 to May 2018 (wheat, rice, cotton, sugar, maize, barley, and soybean) by using the newly developed, state-of-the-art GSADF method developed by Phillips et al. (2015). The analysis indicates that in all the price sequences, 22 bubbles were found in total.
In their paper, Wei and Li [
43] detected housing bubbles in 140 US cities and also endeavored to understand the bubbles’ origin and termination, during the period from 1989 to 2017. Many factors are examined in this study: first, the existence of housing bubbles in US cities; second, the identification of the period of housing bubbles and the determination of the origin of housing bubbles; and third, the potential basis of regional variation in the existence of bubbles. The methodology used for bubble detection is (GSADF 2013) and the results of the finding suggest 40 cities out of 140 cities where there is a bubble.
Elsayed and Danial [
44] detected the presence of multiple bubbles in five separate series of inflation rates including CPI, SPI, WPI, CPIG, and CPIF. They used the recently developed methodology of GSADF. The observational results were built on data taken from the monthly time series of January 2006 to January 2019. However, the findings concluded that several bubbles were found in non-food WPI and CPI. For the remaining three series, only a single bubble was detected.
Table 1 provides details of the studies that are performed specifically on oil price series across the world.
From the extensive literature review, it is concluded that some studies have been conducted on bubble detection in other relevant areas, such as those by Liaqat, Nazir [
19] Butt and Ahmed [
22] but no studies have been carried out on detecting oil prices in Pakistan. Most of the papers reviewed used the methodology that were capable of detecting a single bubble and were not able to identifying the exact date or hidden bubbles. These drawbacks led us to use the latest methodology available to detect the presences of multiple bubbles.
In this study, however, an attempt is made to fill this gap by detecting the presence of multiple bubbles in Pakistan’s fuel price series. The analytical results from this paper will help investors and policy makers understand fuel price volatility of HSD, LDO, MS RON, natural gas, petrol, and kerosene in the presence of a bubble. The results of the study will be used by decision-makers to make future economic decisions aimed at preventing financial risk and maintaining financial stability.
4. Results and Discussion
This section provides details of the empirical results covering basic summary statistics of the data series under consideration followed by the results of GSADF test and finally presenting date-stamping of bubbles in each of the fuel price series with information on the bubble start and end dates. The detailed discussion of results is also provided.
Table 3 presents descriptive statistics on the six oil price series (petrol, HSD, LDO, MSRON, natural gas, and kerosene).
Table 4 presents the RTDF, SADF and GSADF statistics for the six series and rejects the null hypothesis of no bubble in the series.
Table 5 shows the stamping periods of the six oil price series of the selected period, their start and end dates as well as their duration.
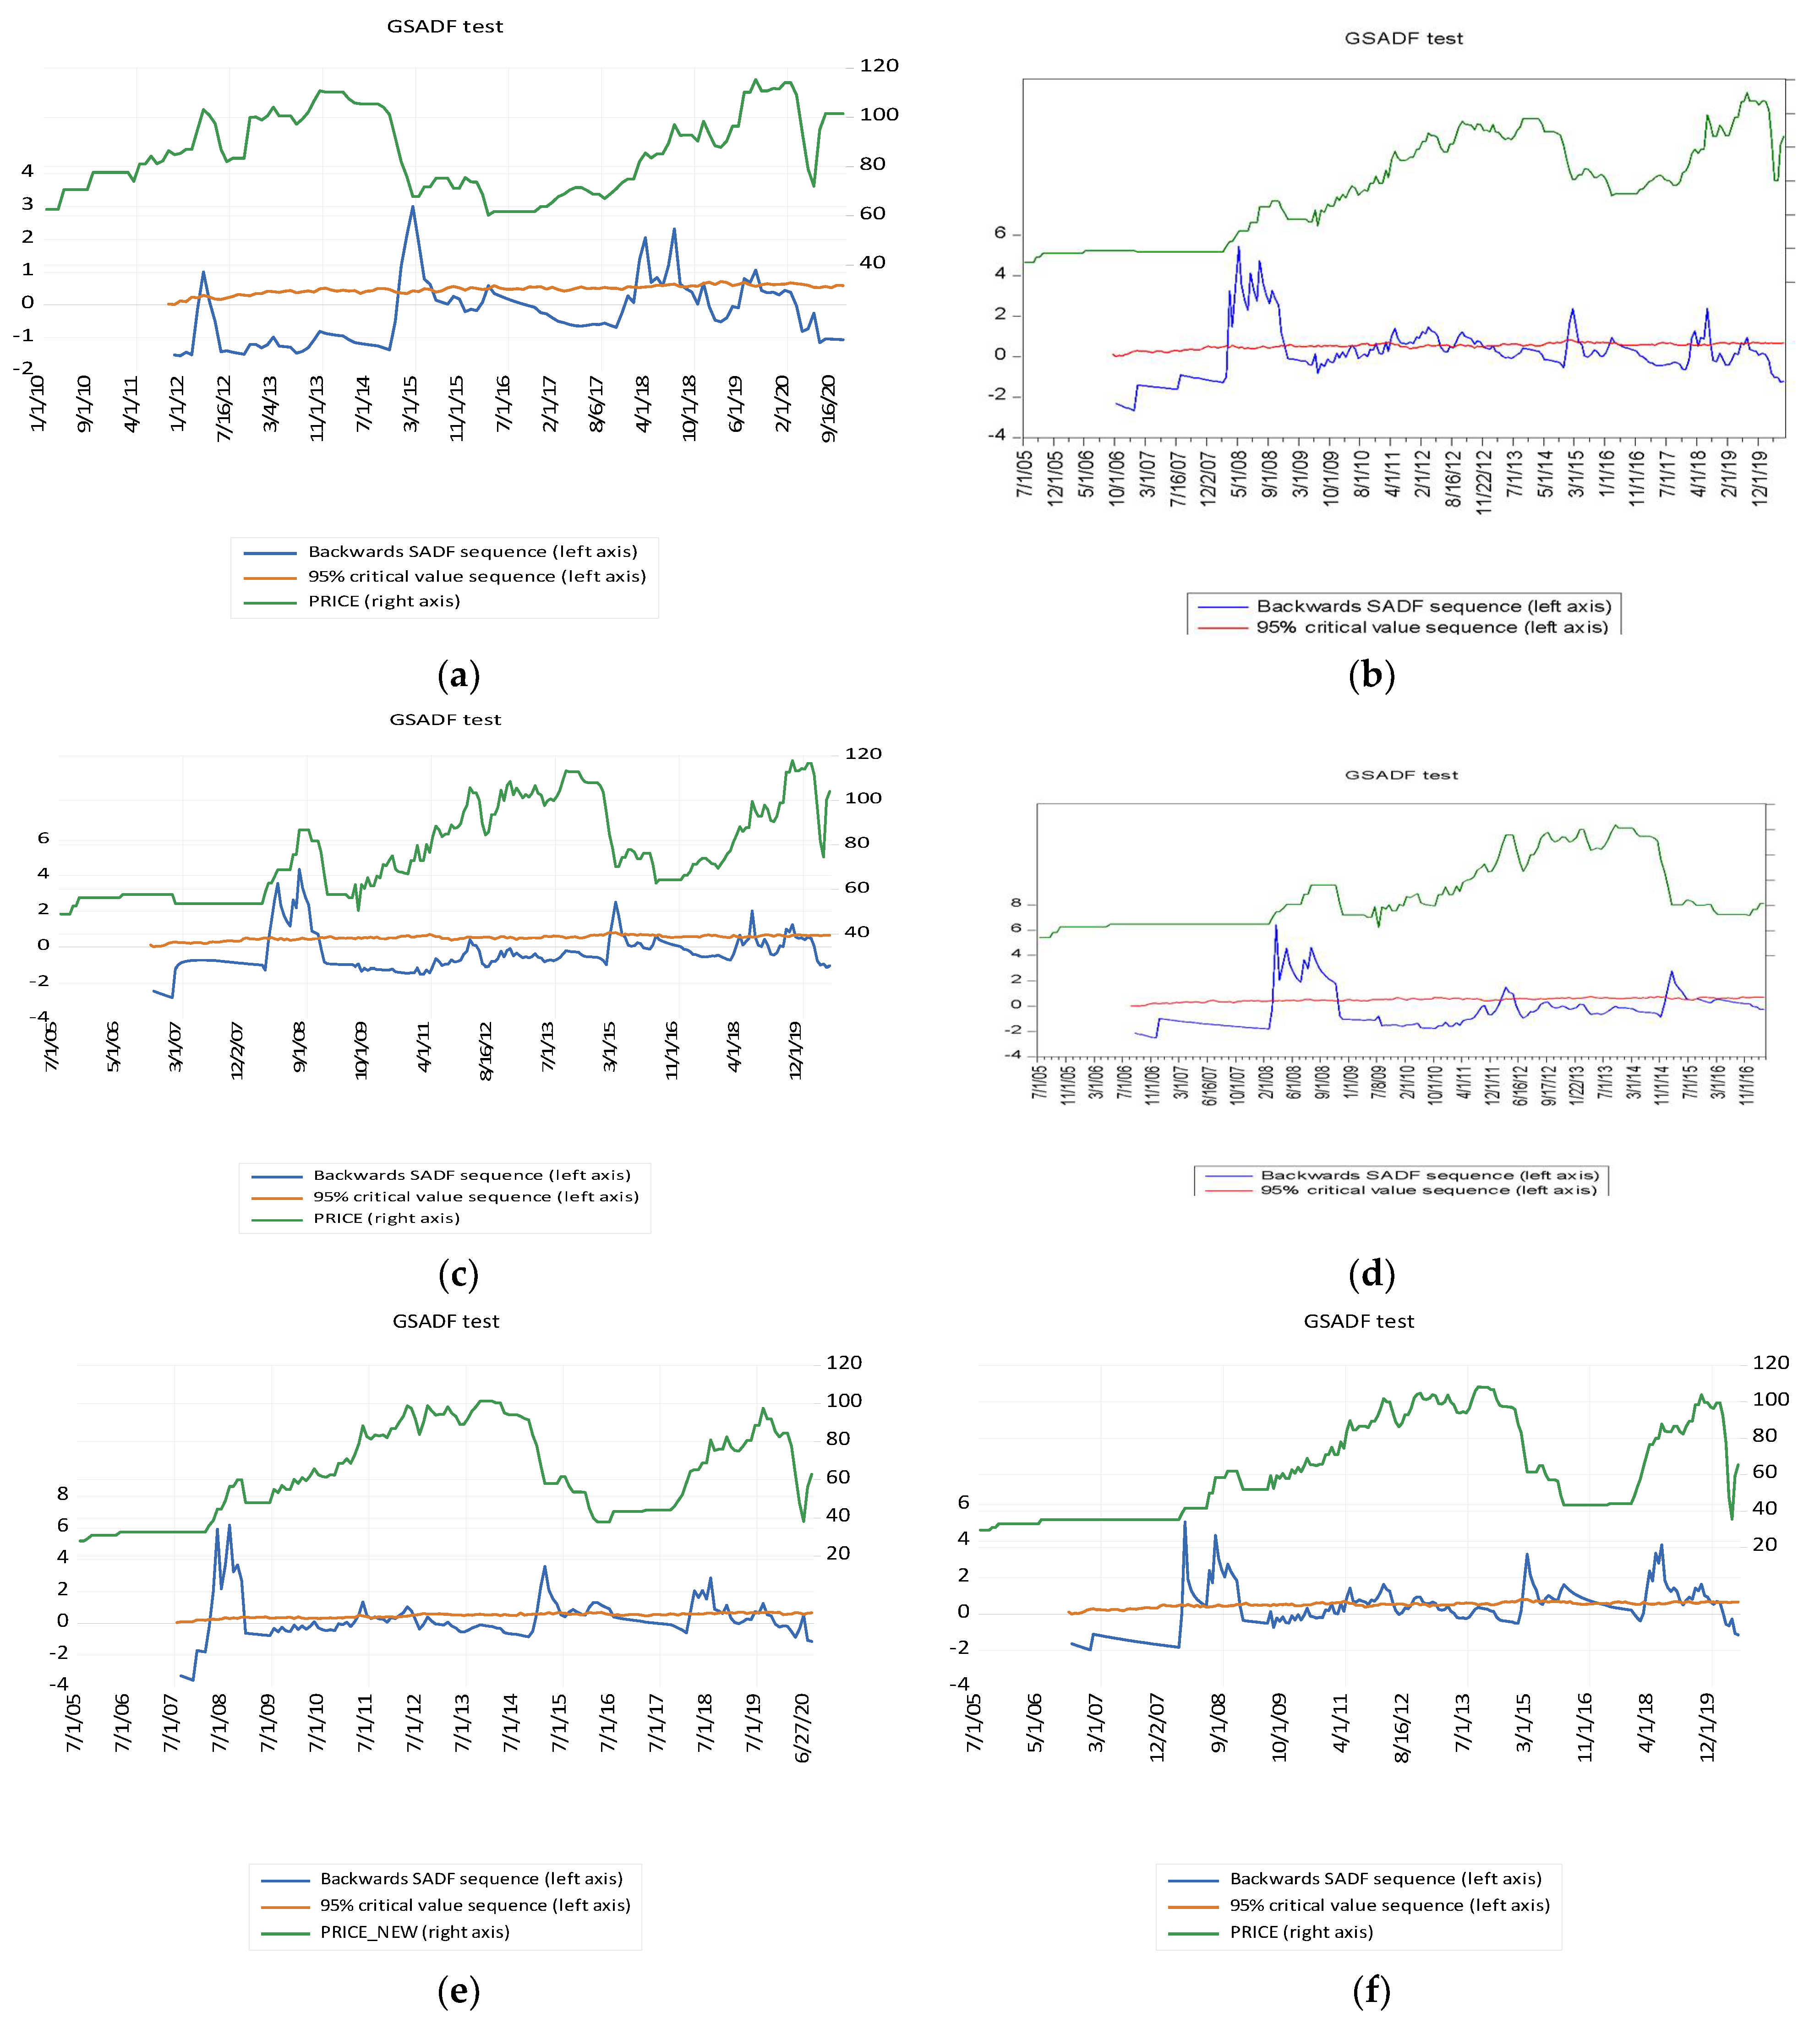
Table 5 illustrates that the greatest number of bubbles occurred in the natural gas and kerosene price series. The date stamp for each price series was noted and indicates that four bubbles were detected in the price of natural gas from February 2012 to June 2012 for the duration of five months. The second bubble was from October 2014 to April 2015, the third bubble period was from December 2017 to May 2018 and the fourth bubble started from May 2018 to July 2018. Three bubbles were found in the HSD oil price series with the longest duration of eleven months between February 2008 and November 2008. Likewise, for the petrol price series, three bubbles were observed from March 2008 to October 2008 and the longest bubble was eight months. In the LDO, three bubbles were detected, the first bubble was between March 2008 and November 2008 for a duration of nine months. The second bubble occurred from November 2015 to July 2015 and the last bubble seen in the LDO is from April 2018 to November 2018. Finally, in kerosene, the longest bubble was observed during twelve months between January 2018 and December 2018. A total of five bubbles were observed in the kerosene oil price series.
The analysis indicates that, with the exception of natural gas, the other five oil prices experienced a bubble in 2008 and it was a year of global recession. Oil prices surged and the trend accelerated after the recession, as Pakistan is an import economy and dependent on oil imports which influences the overall price of the country. In 2008, BRENT oil prices rose significantly in January from USD 92/bbl to USD 139.83/bbl in June 2008 (Bloomberg). The depreciation of the Pak rupee in dollars has led to very expensive imports and the upward trend in oil prices has doubled the impact on domestic petroleum products. Both reasons paved the way for a rise in oil prices.
The fluctuation of oil prices has a profound impact on the overall economic situation. The supply and demand conditions in the oil market that determine oil prices. Price volatility may be due to three reasons: (a) oil supply shocks normally occur in oil-exporting countries such as the Middle East due to lack of investment and geopolitical tensions, (b) due to exceptionally strong economic growth in developing countries or a relatively rapid economic rebound in some countries in the aftermath of the financial crisis, (c) the specific demand for oil caused by the temporal importance of oil among alternative energy sources and the shifting perception of oil fundamentals. There is a consensus in the literature that the oil demand shocks that were triggered by world economic activity were the major drivers of the bubble in Pakistan’s fuel price series.
Figure 1a–f shows the general behaviors of a single bubble and multiple bubbles during the duration of the sample and its rise and fall. To find a particular bubble, the measured value of backward SADF is compared to the critical value. When the computed value exceeds the critical value, the bubble exists and otherwise collapses. The graph shows the start and endpoint clearly. This method is encouraging because it can detect multiple bubbles and stamping the date of bubbles can be easily defined.
The results of our research are not directly comparable to existing studies because of differences in the selected country and data, and the methodology employed in this research is not the same as in many other studies. However, as a comparison, research has been conducted on the detection of the oil price bubble. Caspi and Katzke [
3] detected the existence of multiple bubbles in US oil stocks by using the generalized sup ADF (GSADF) test procedure developed by Phillips, Shi [
8]. The methodology used allows the identification of bubbles that break down periodically. Fantazzini [
13] detected a negative financial bubble in WTI oil prices. Zhang and Yao [
4] detected a bubble in three financial markets using the LPPL method. Su and Li [
5] detected six bubbles in WTI oil prices using a similar approach to that which we used in our paper (GSADF). Herrera and Tourinho [
20] also detected a bubble in BRENT oil prices using GSADF. Li amd Chevallier [
7] detected bubbles in three financial markets of Europe, Asia, and the US using the GSADF method. However, Herrera and Tourinho [
20] rejected bubble detection in WTI oil prices.


 ,
, 
