
Pressure Fluctuation–Vorticity Interaction in the Volute of Centrifugal Pump as Hydraulic Turbines (PATs)
Abstract
:1. Introduction
2. Numerical Method
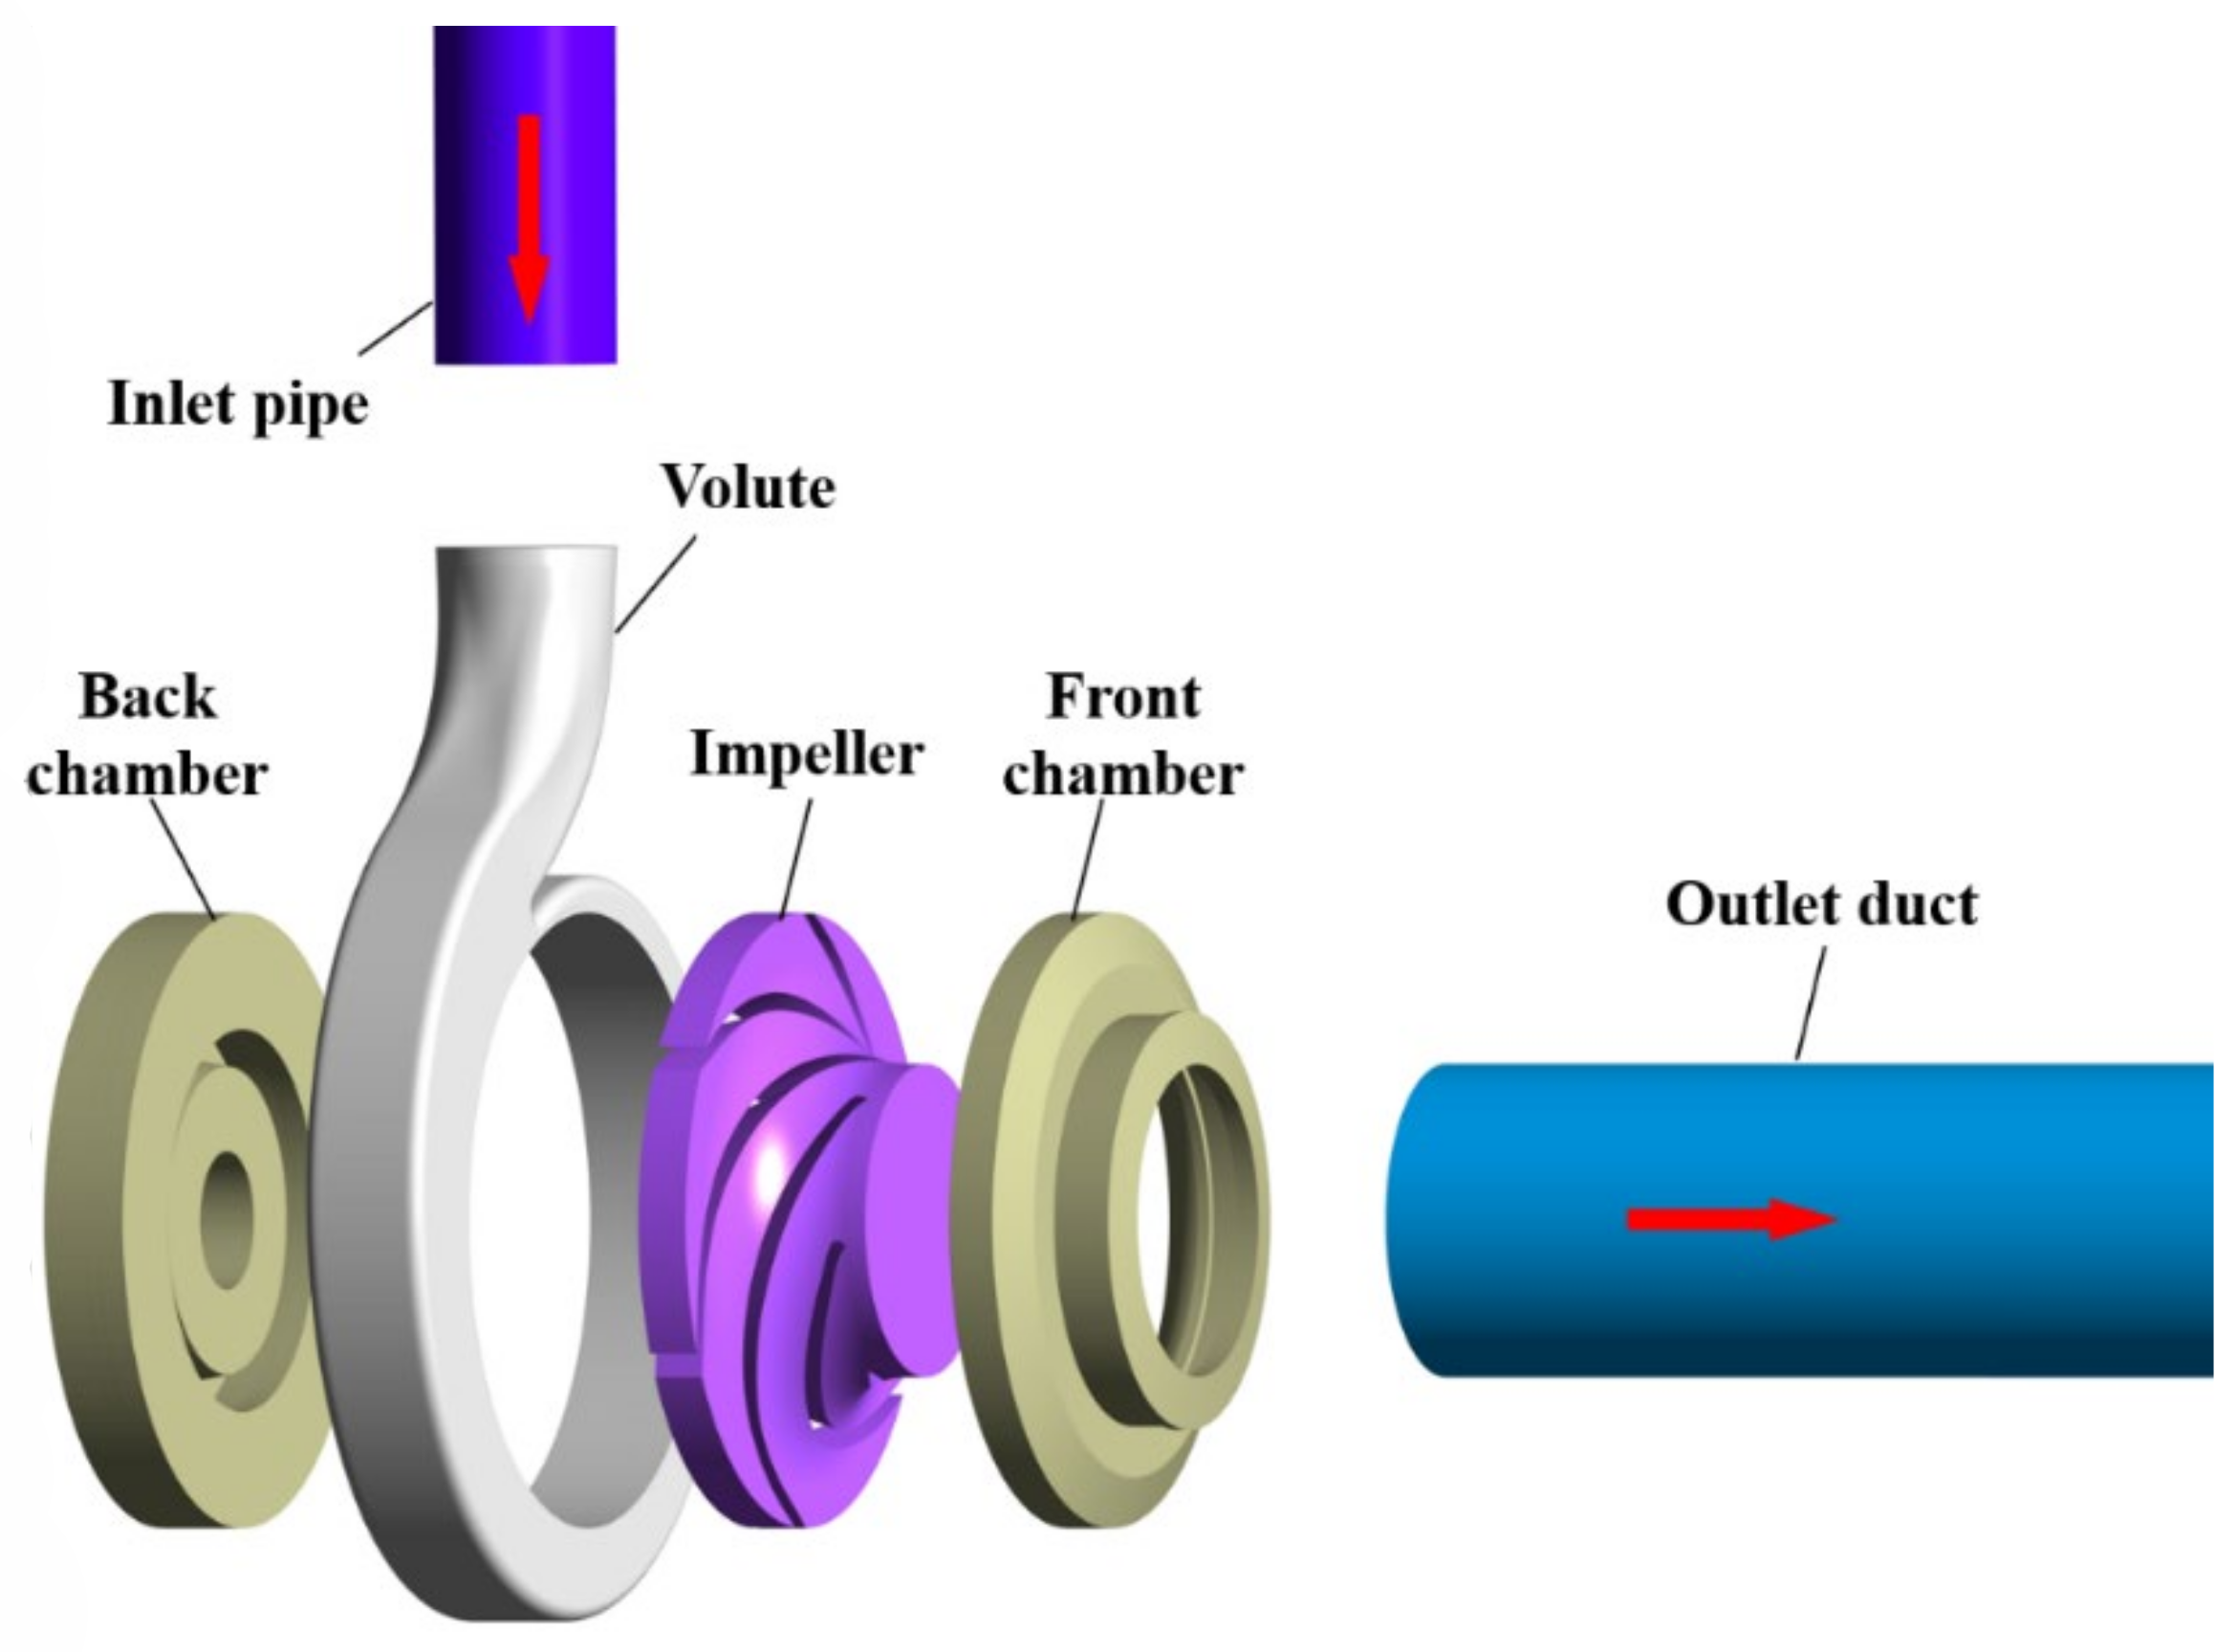
2.1. Physical Model
2.2. Governing Equations and Turbulence Model
2.3. Numerical Schemes and Boundary Conditions
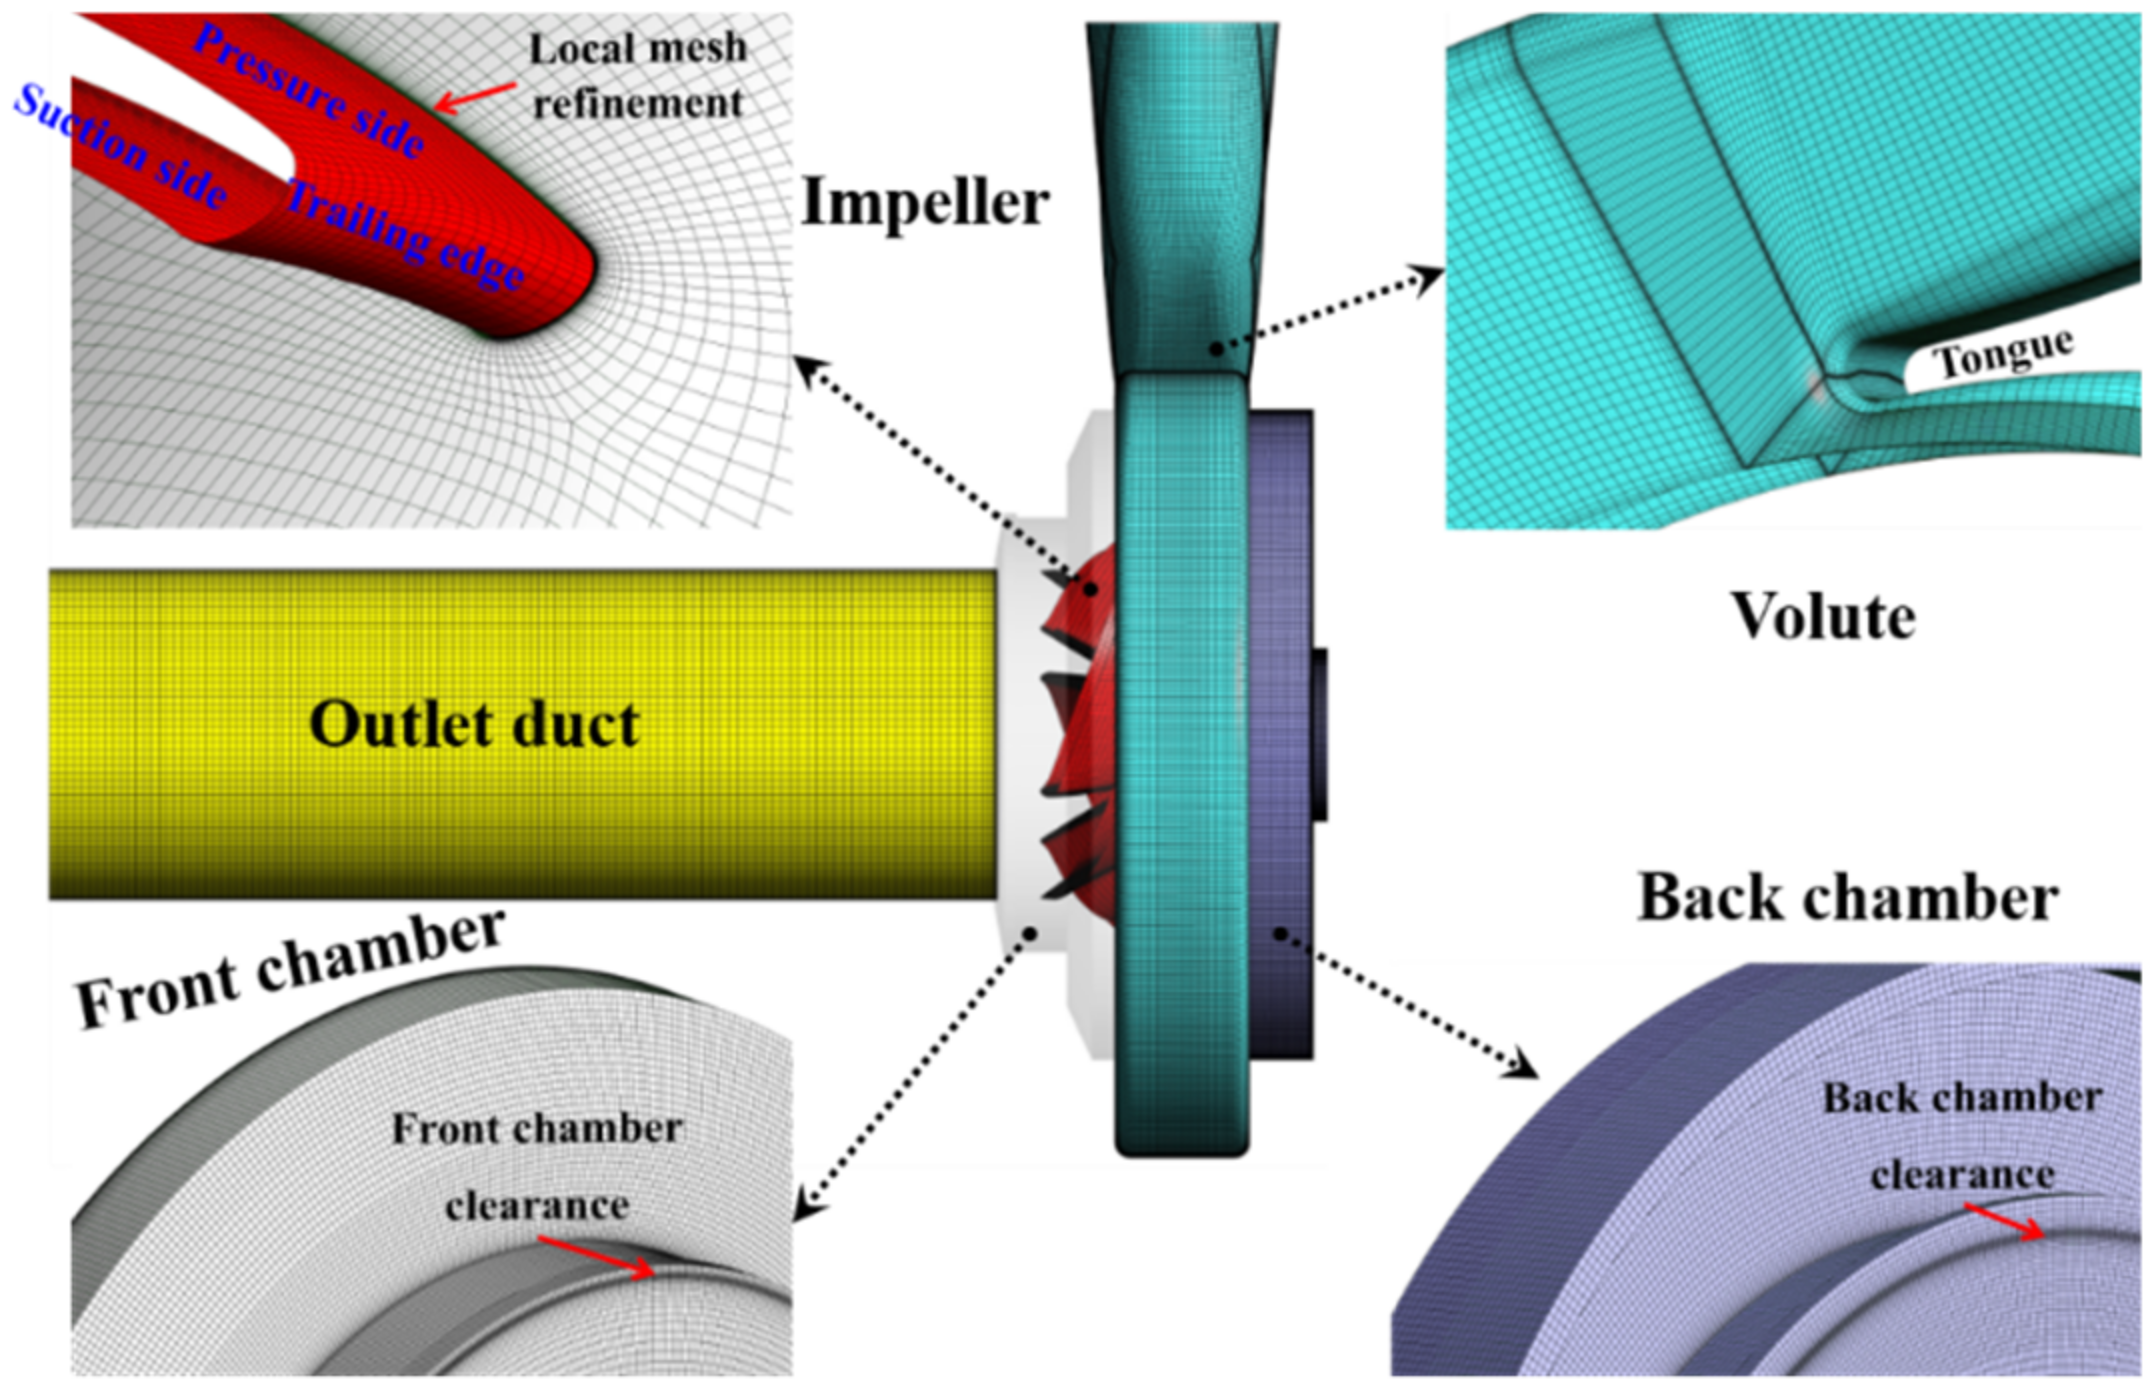
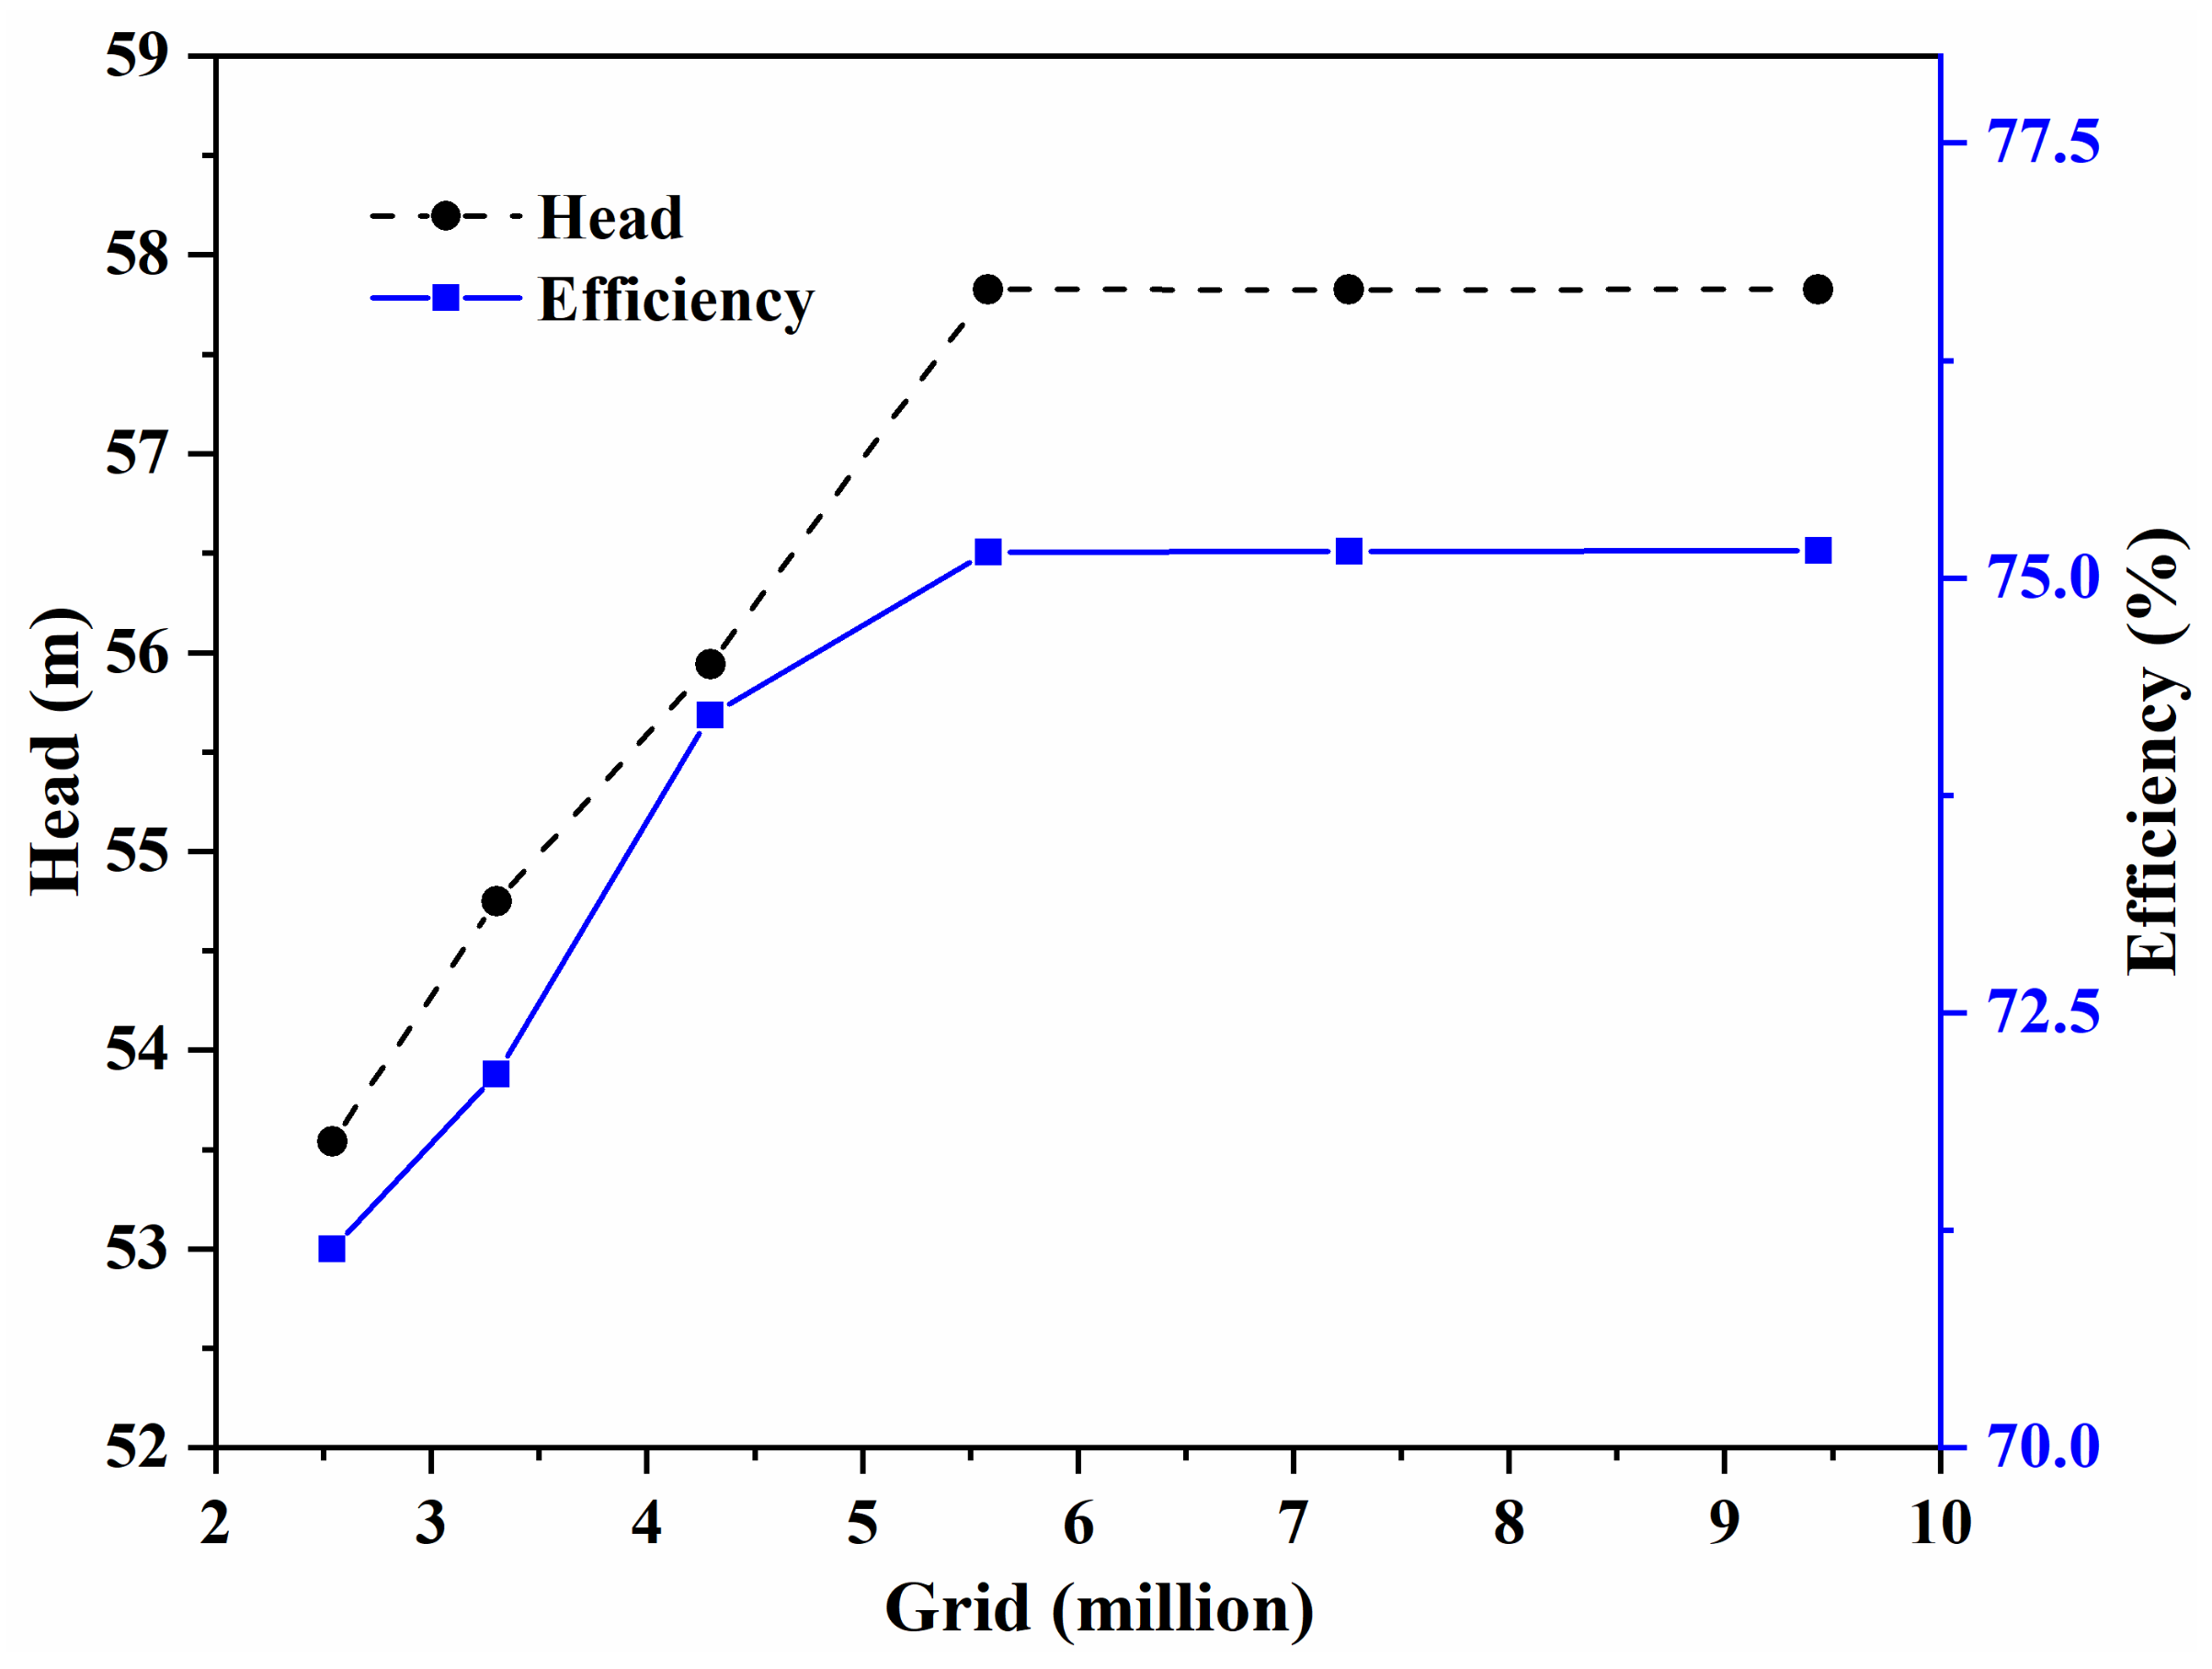
2.4. Mesh Generation and Sensitivity Analysis
2.5. Validation of Numerical Results
3. Results and Discussion
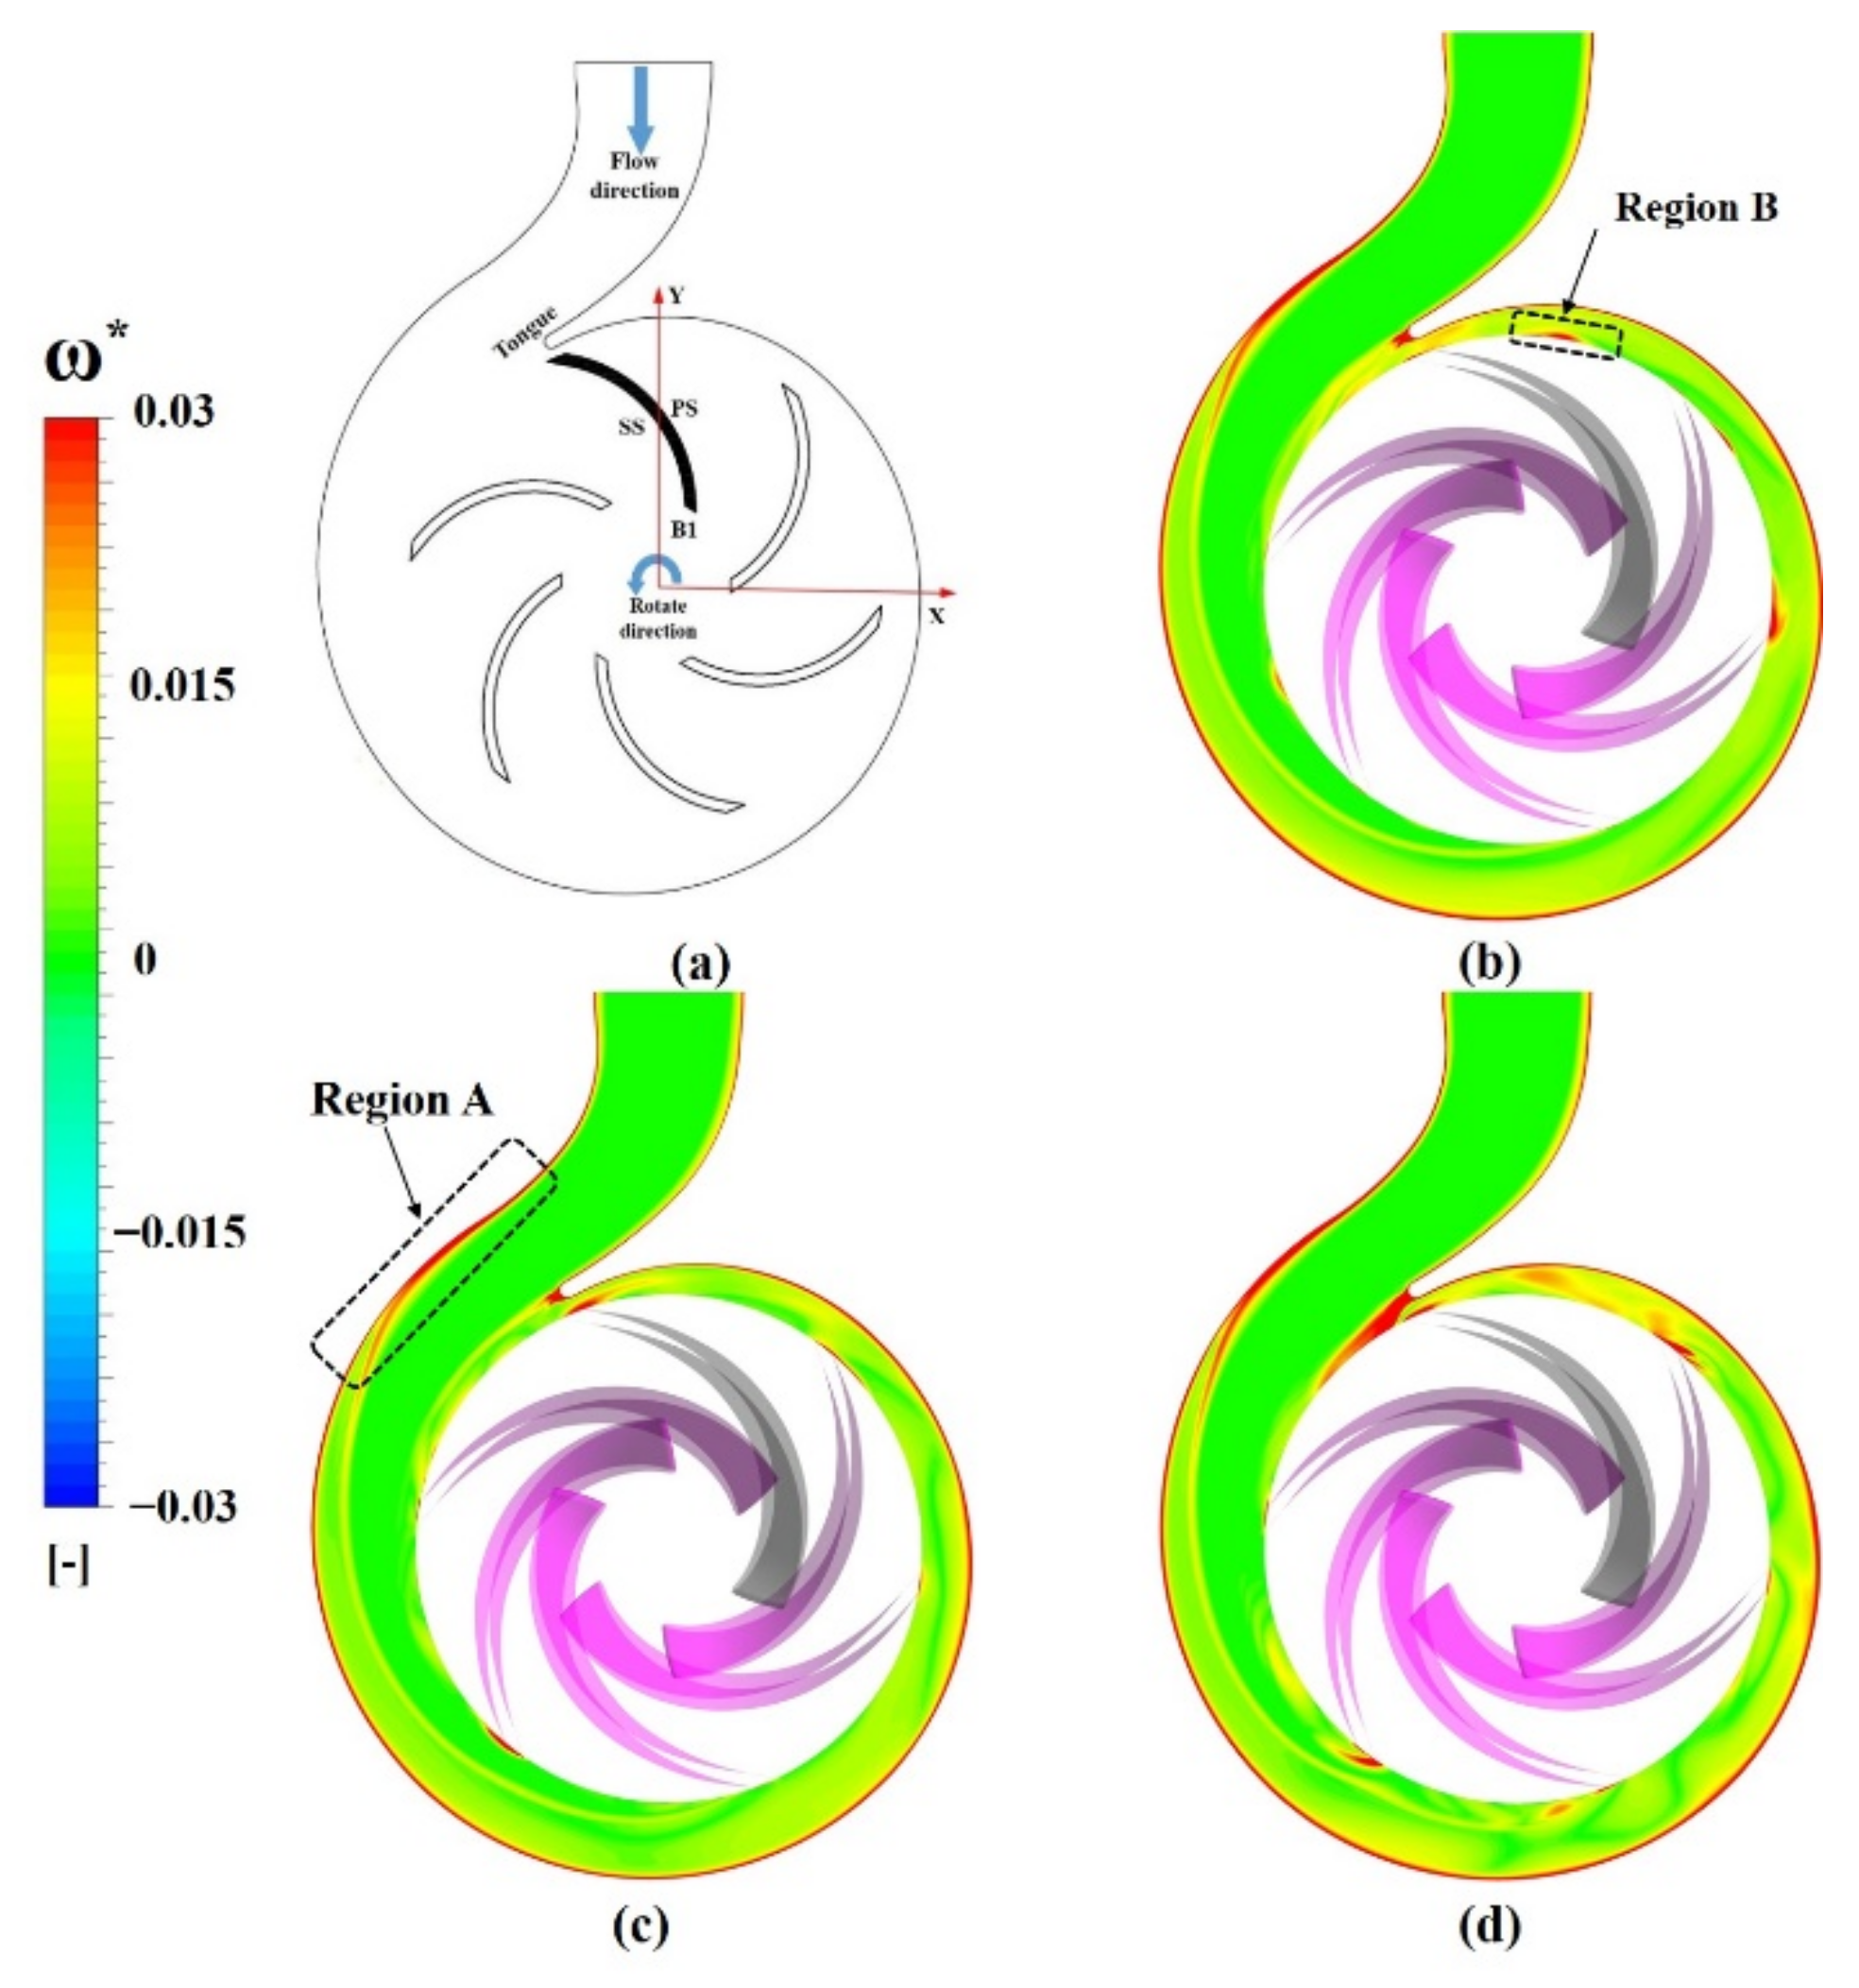
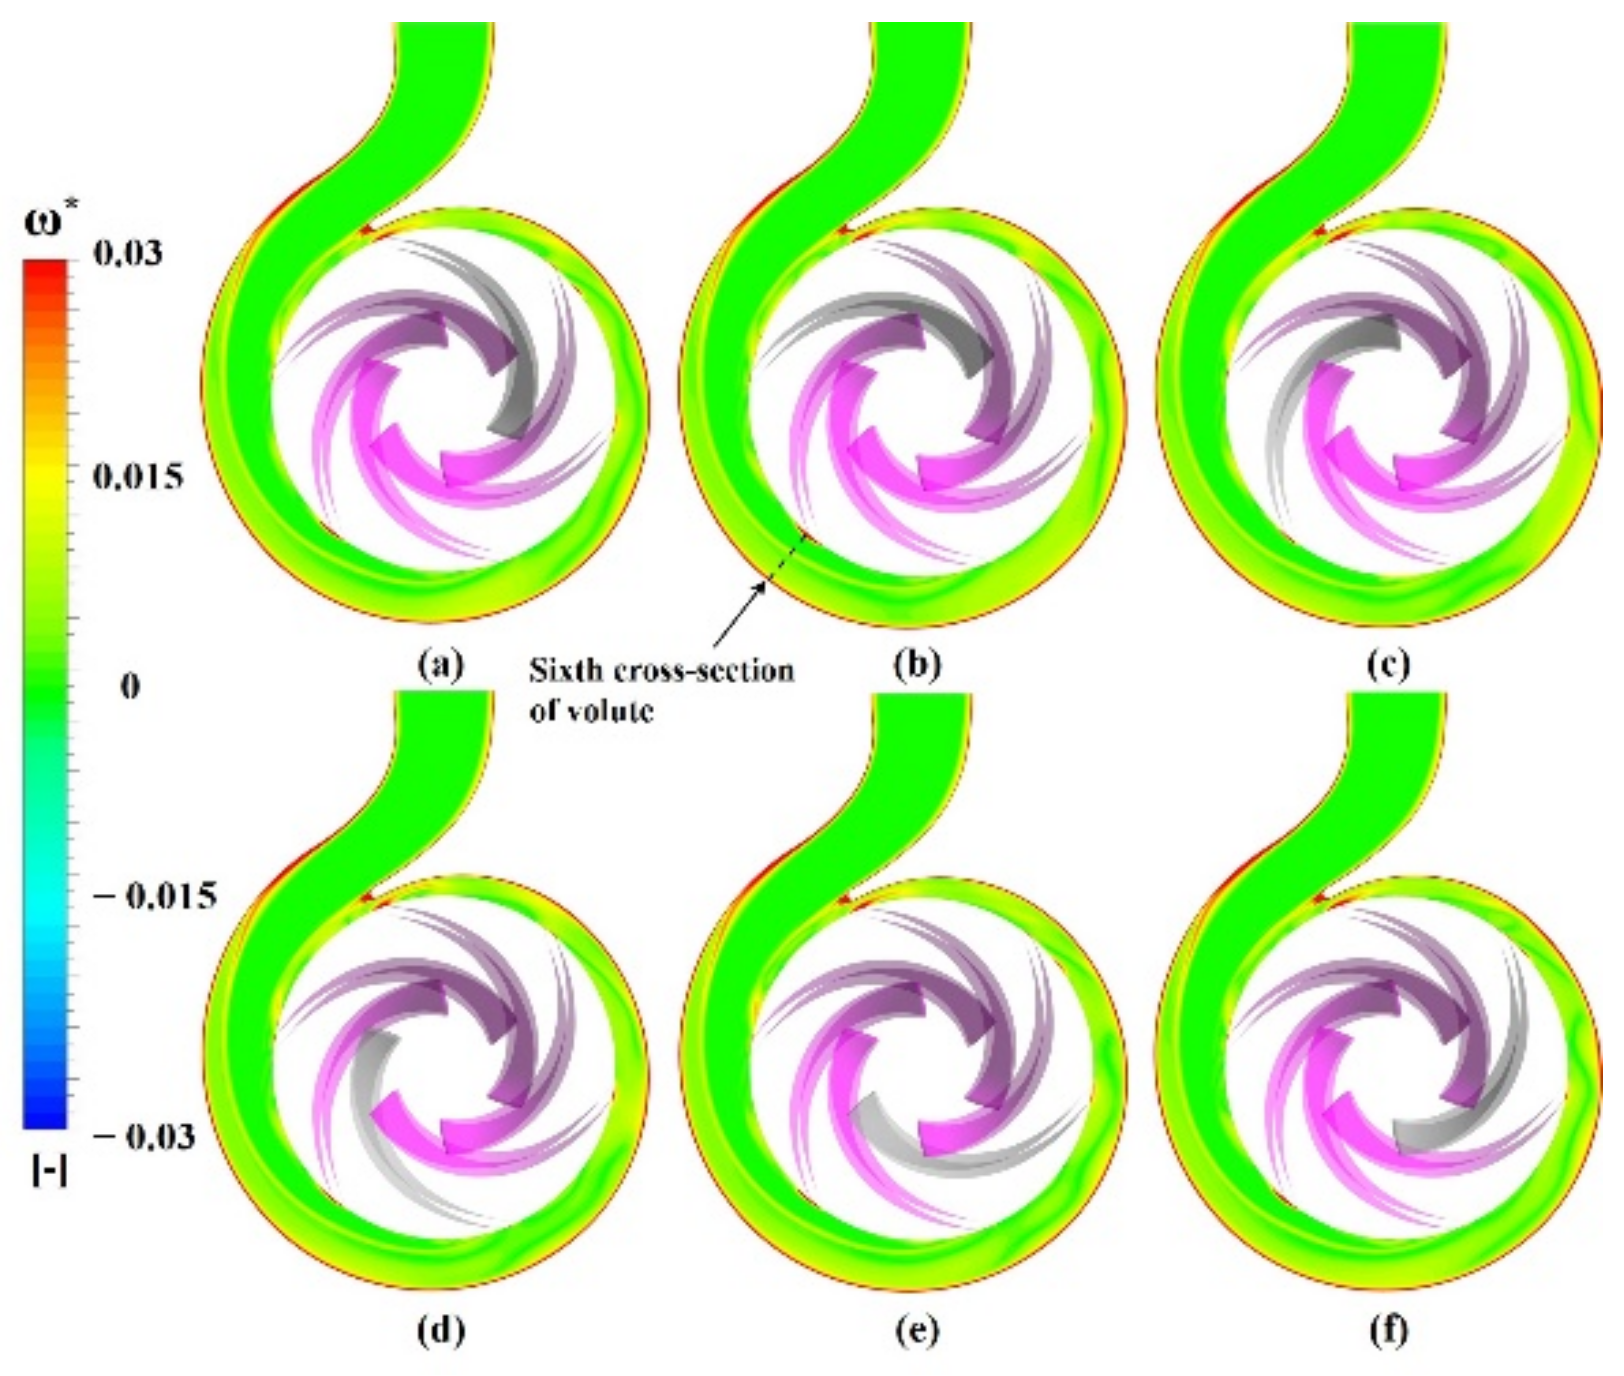
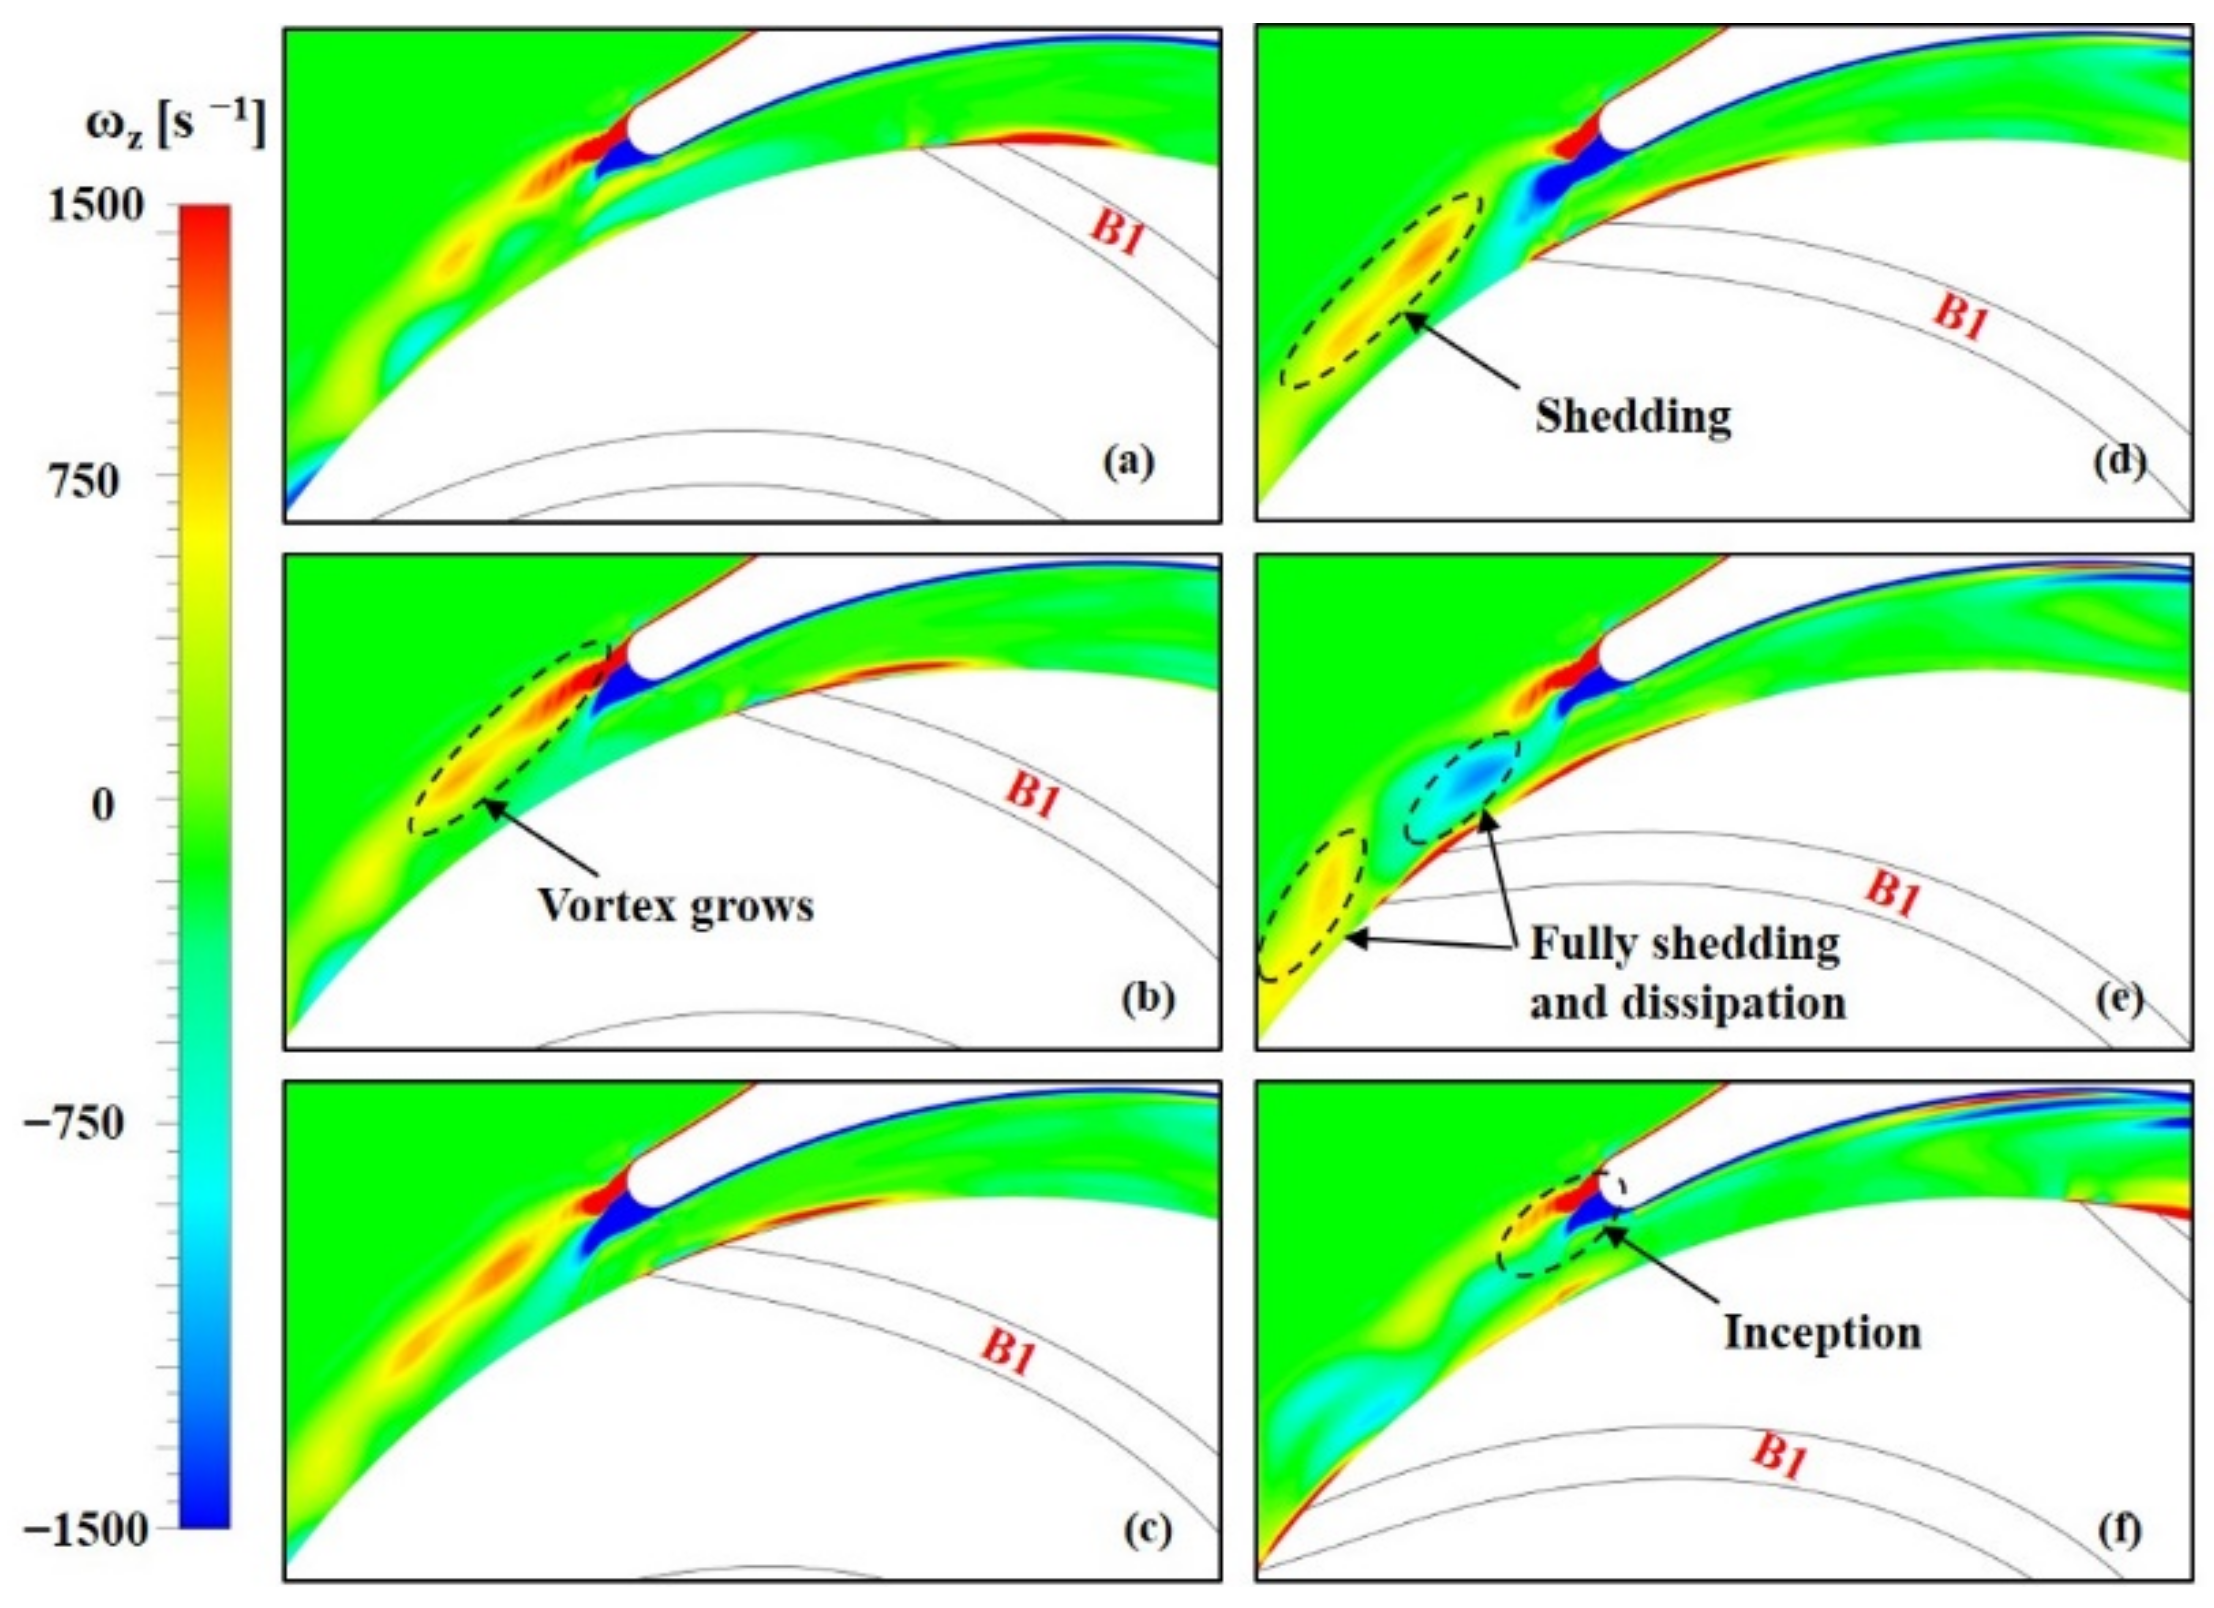
3.1. Spatial and Temporal Evolution of the Vorticity
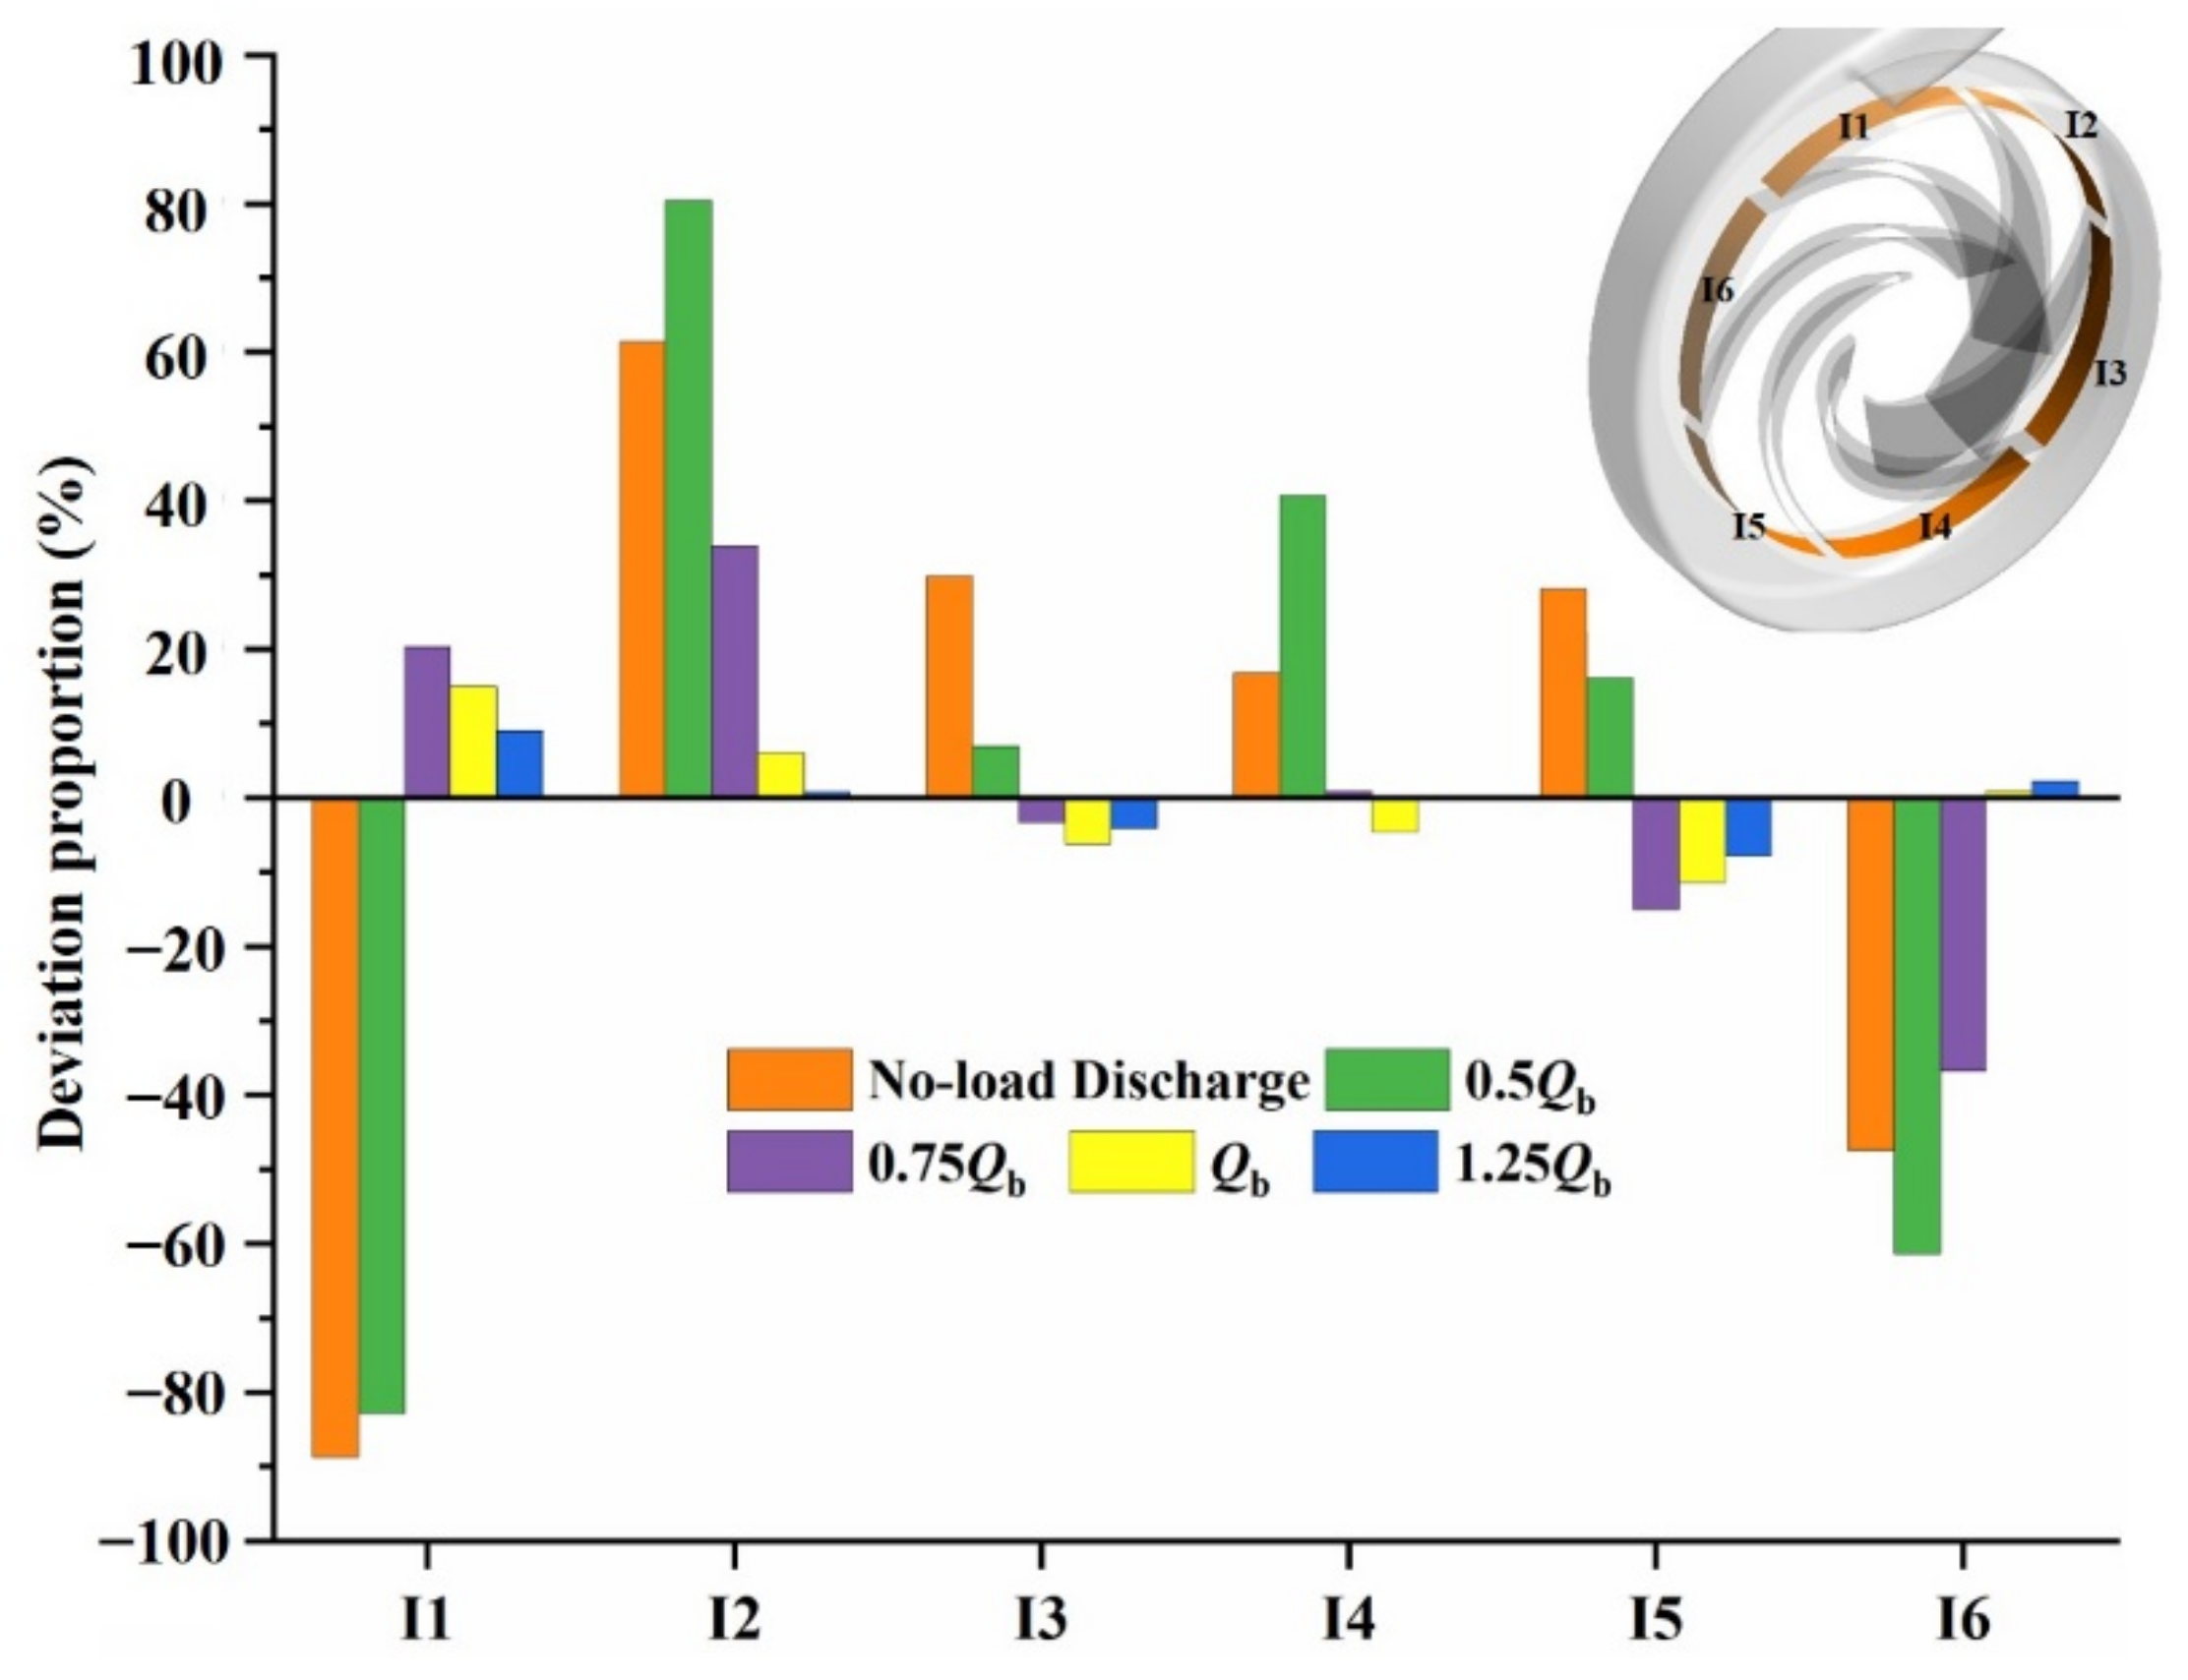
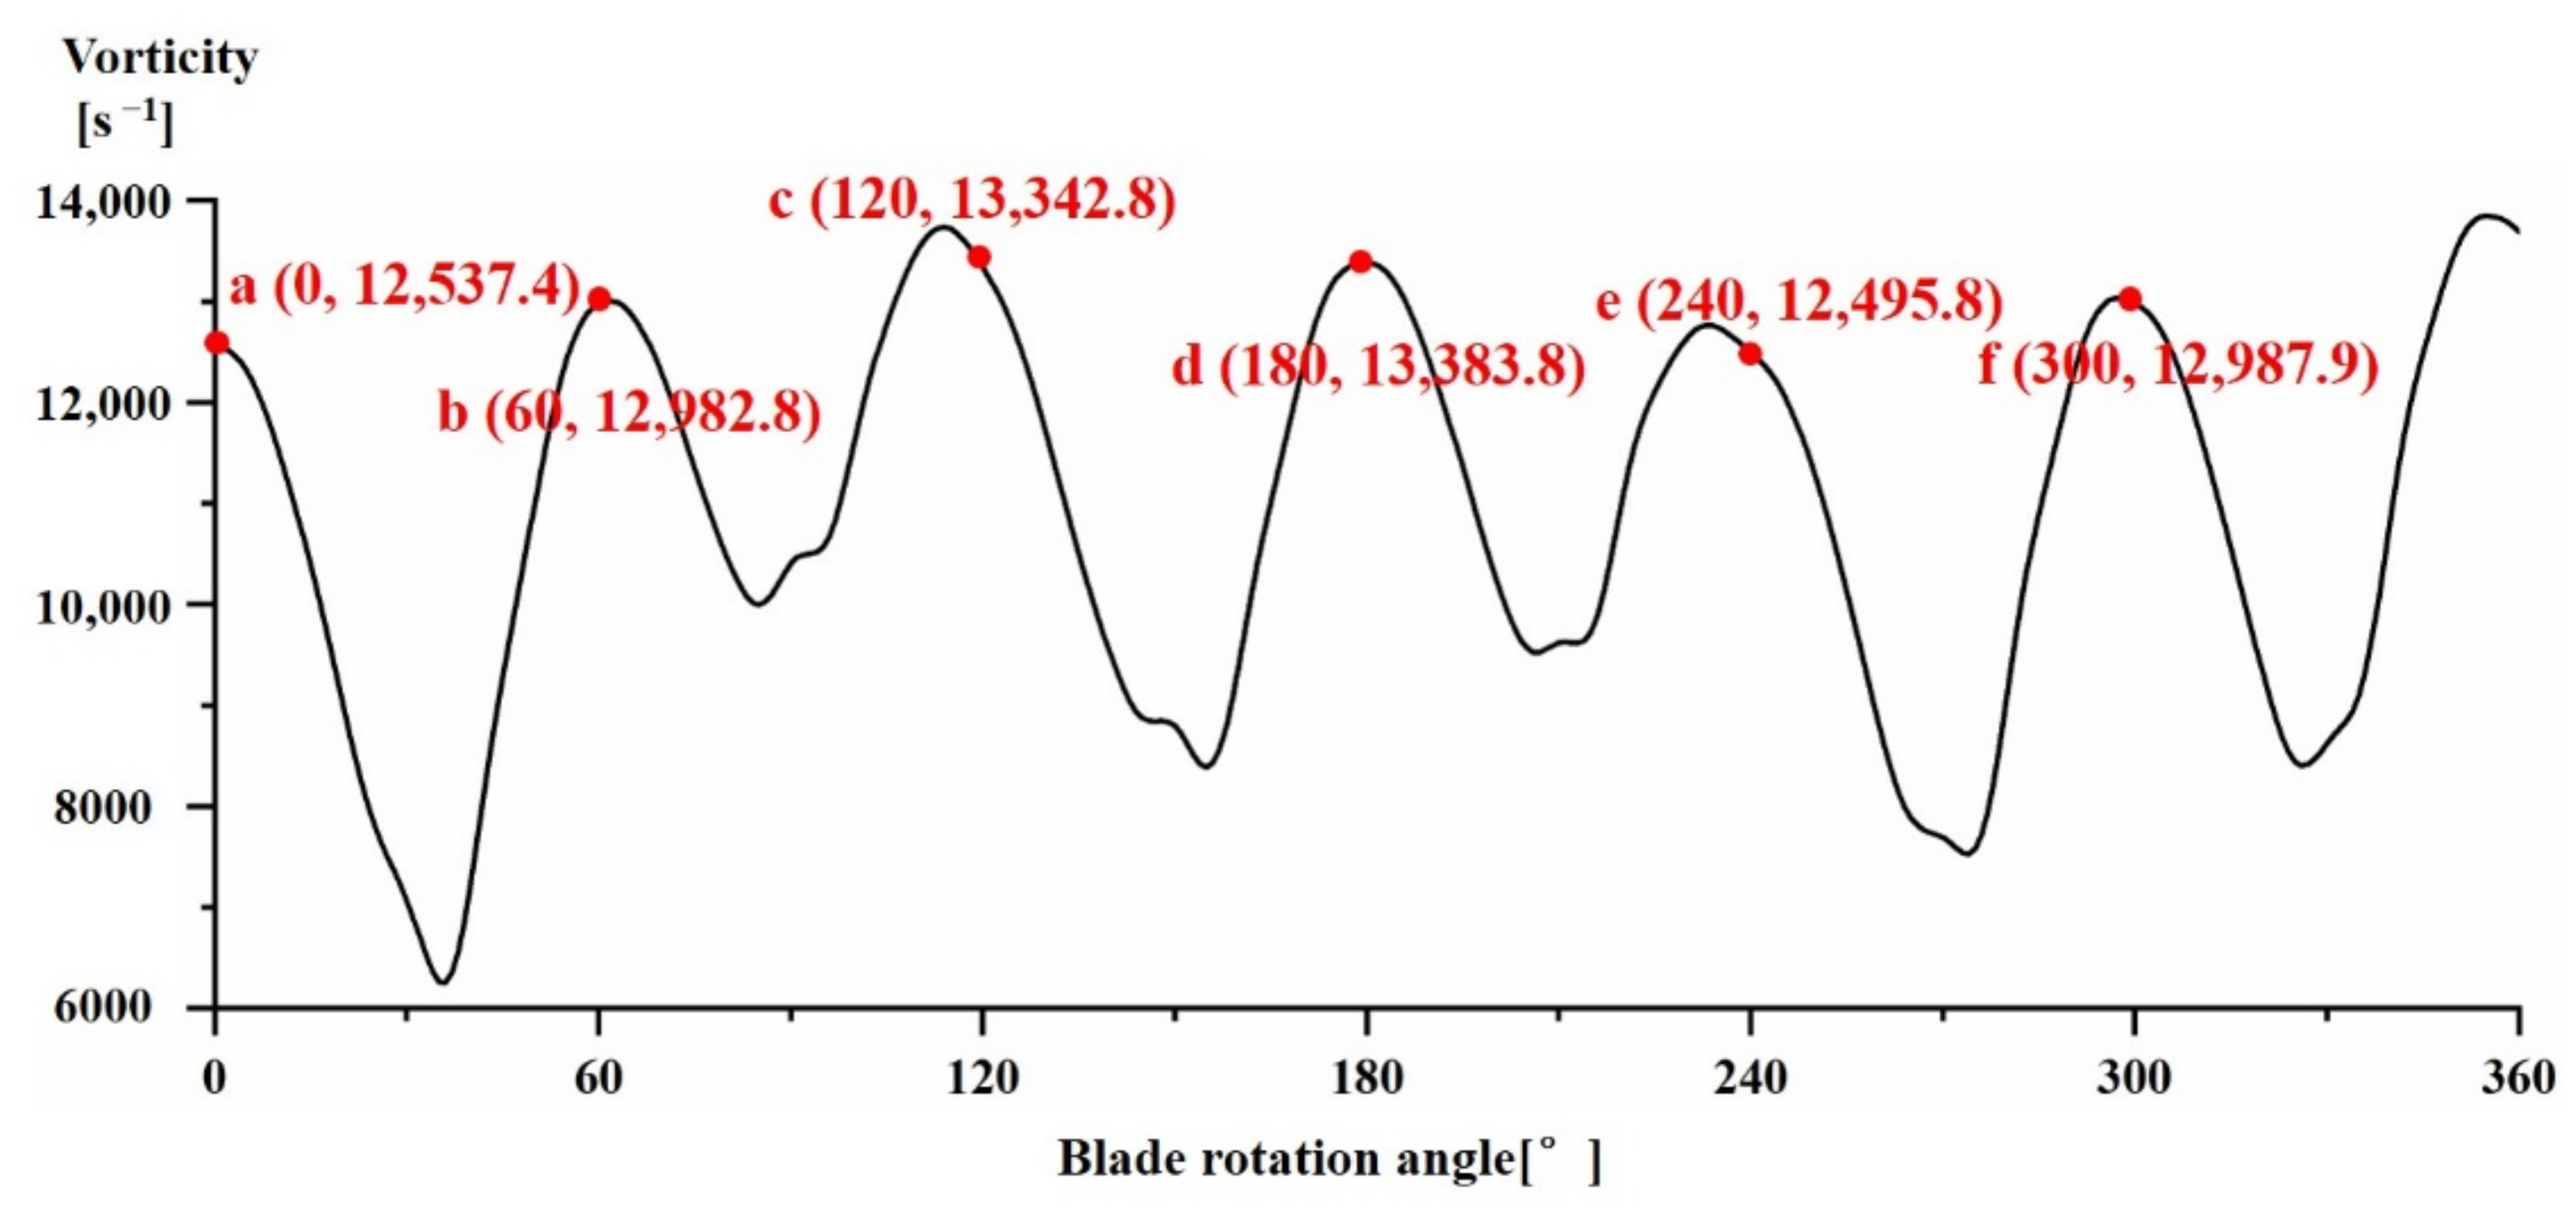
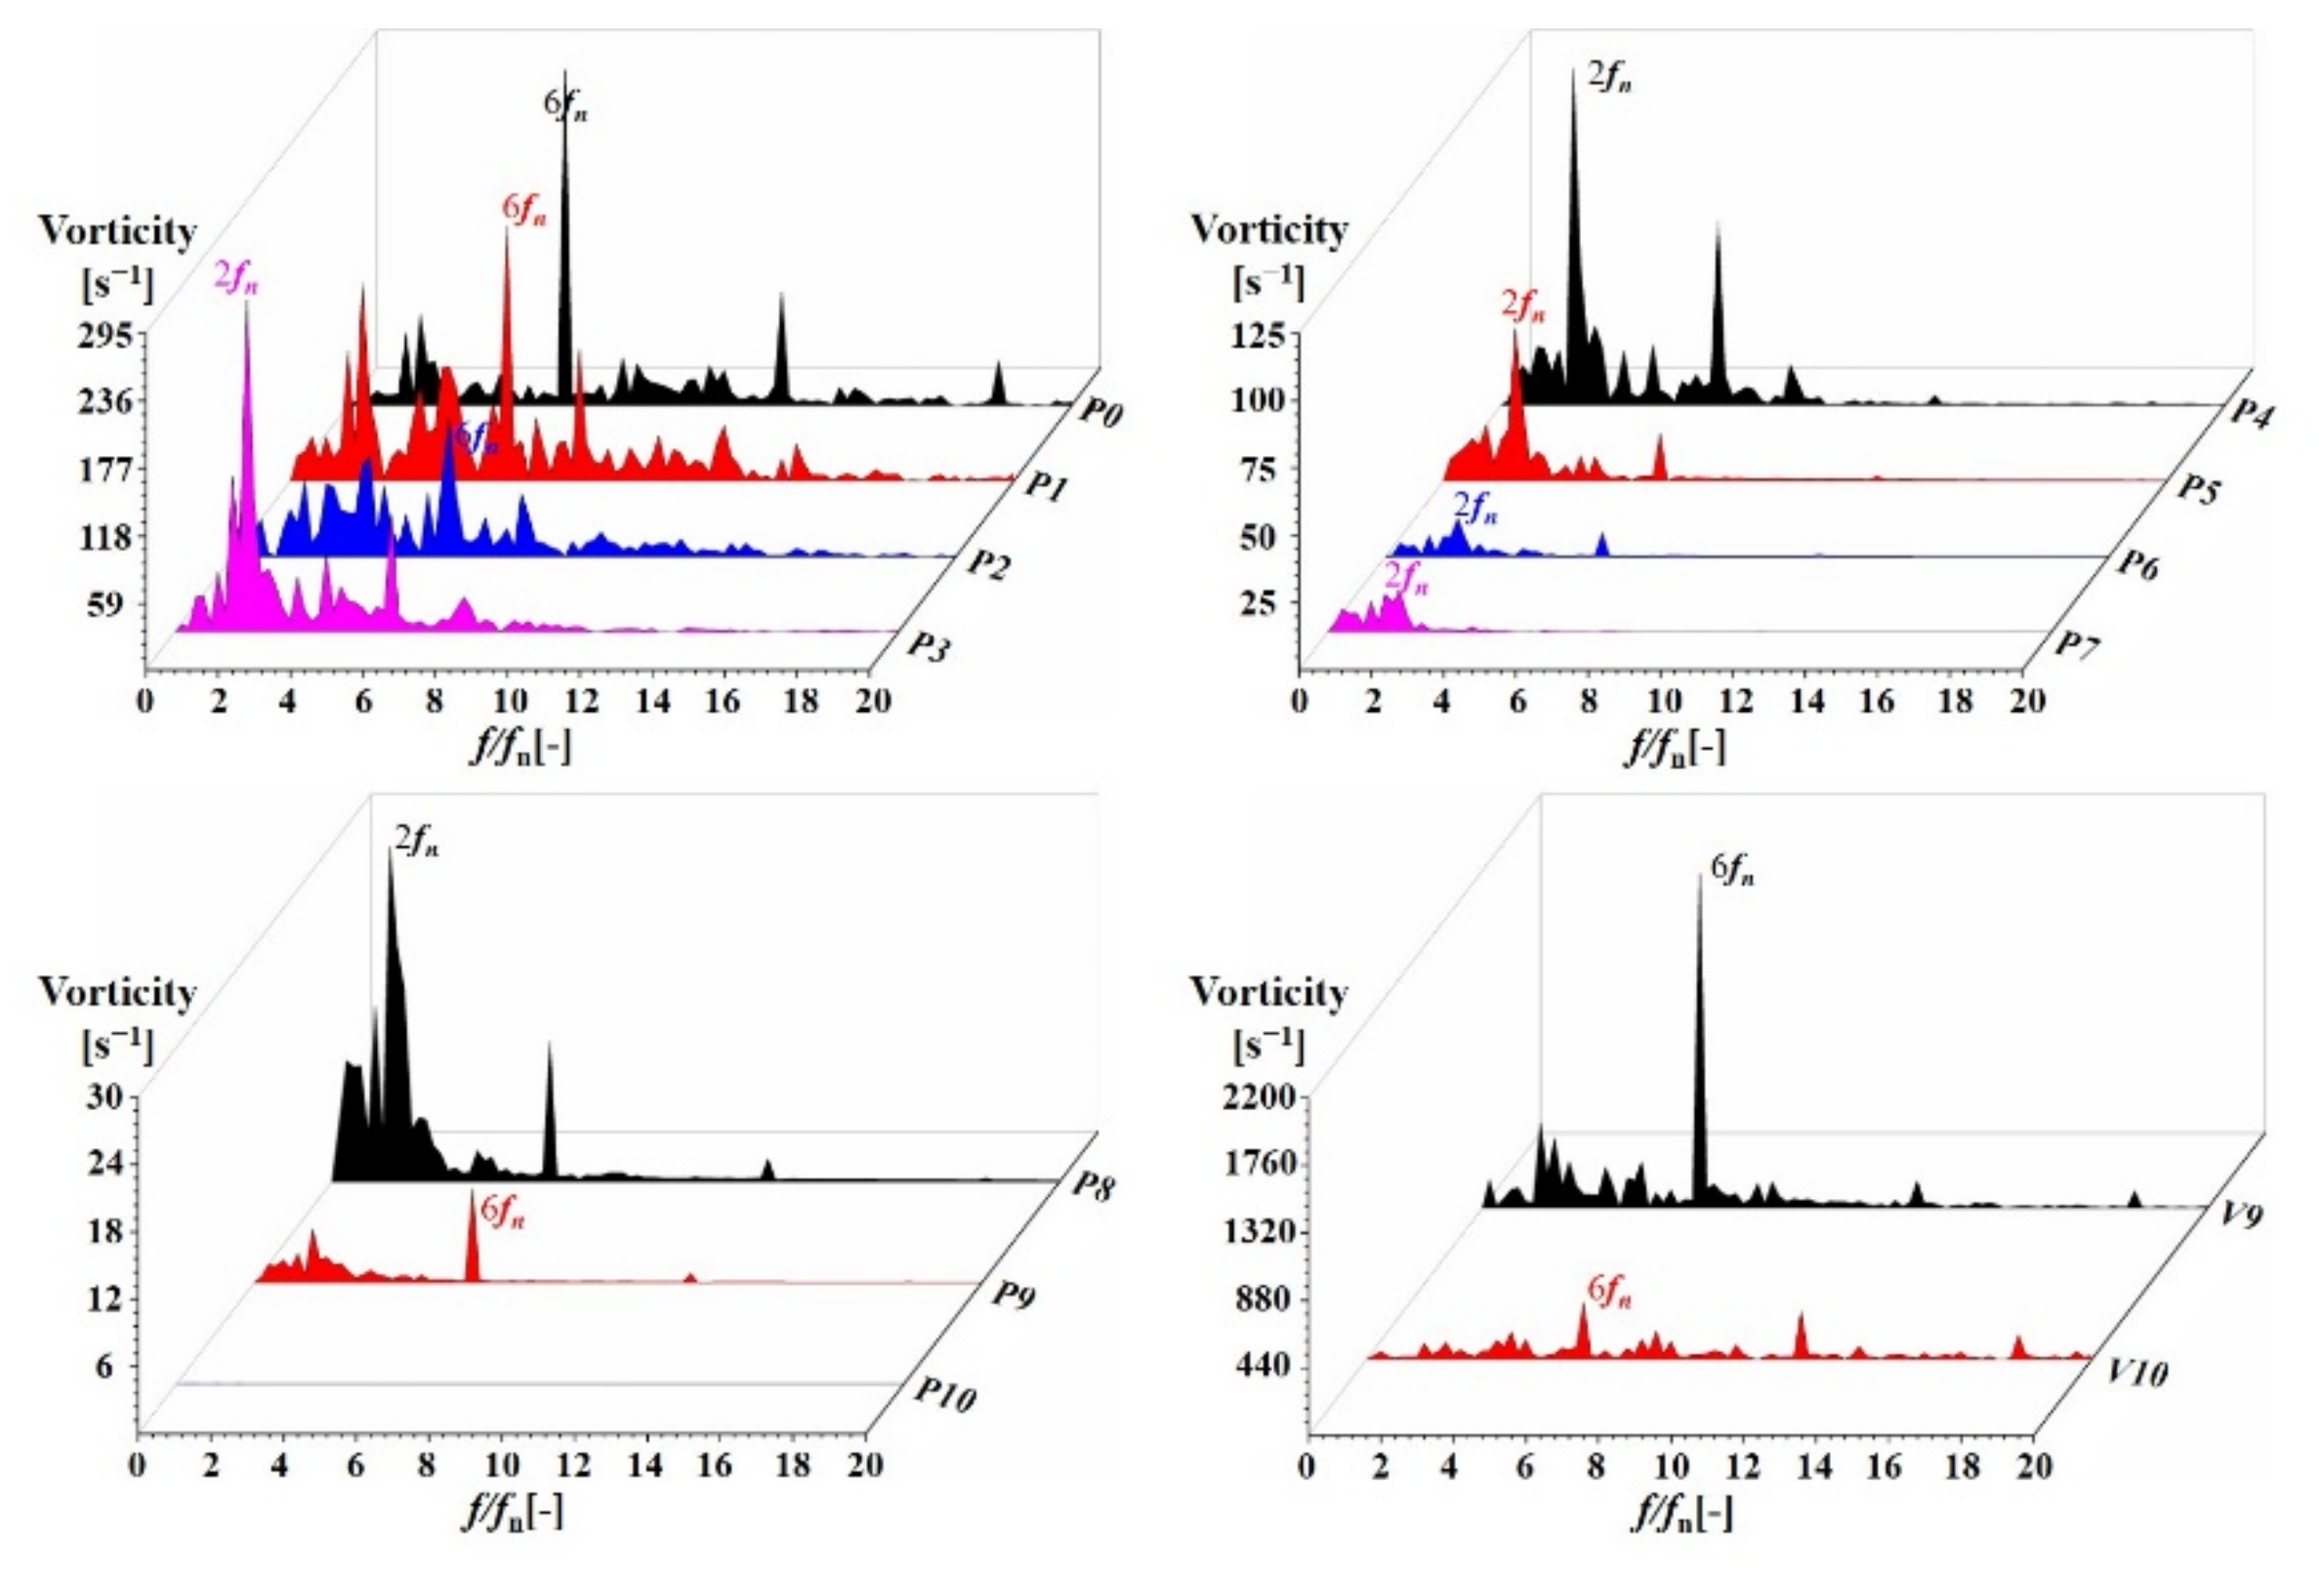
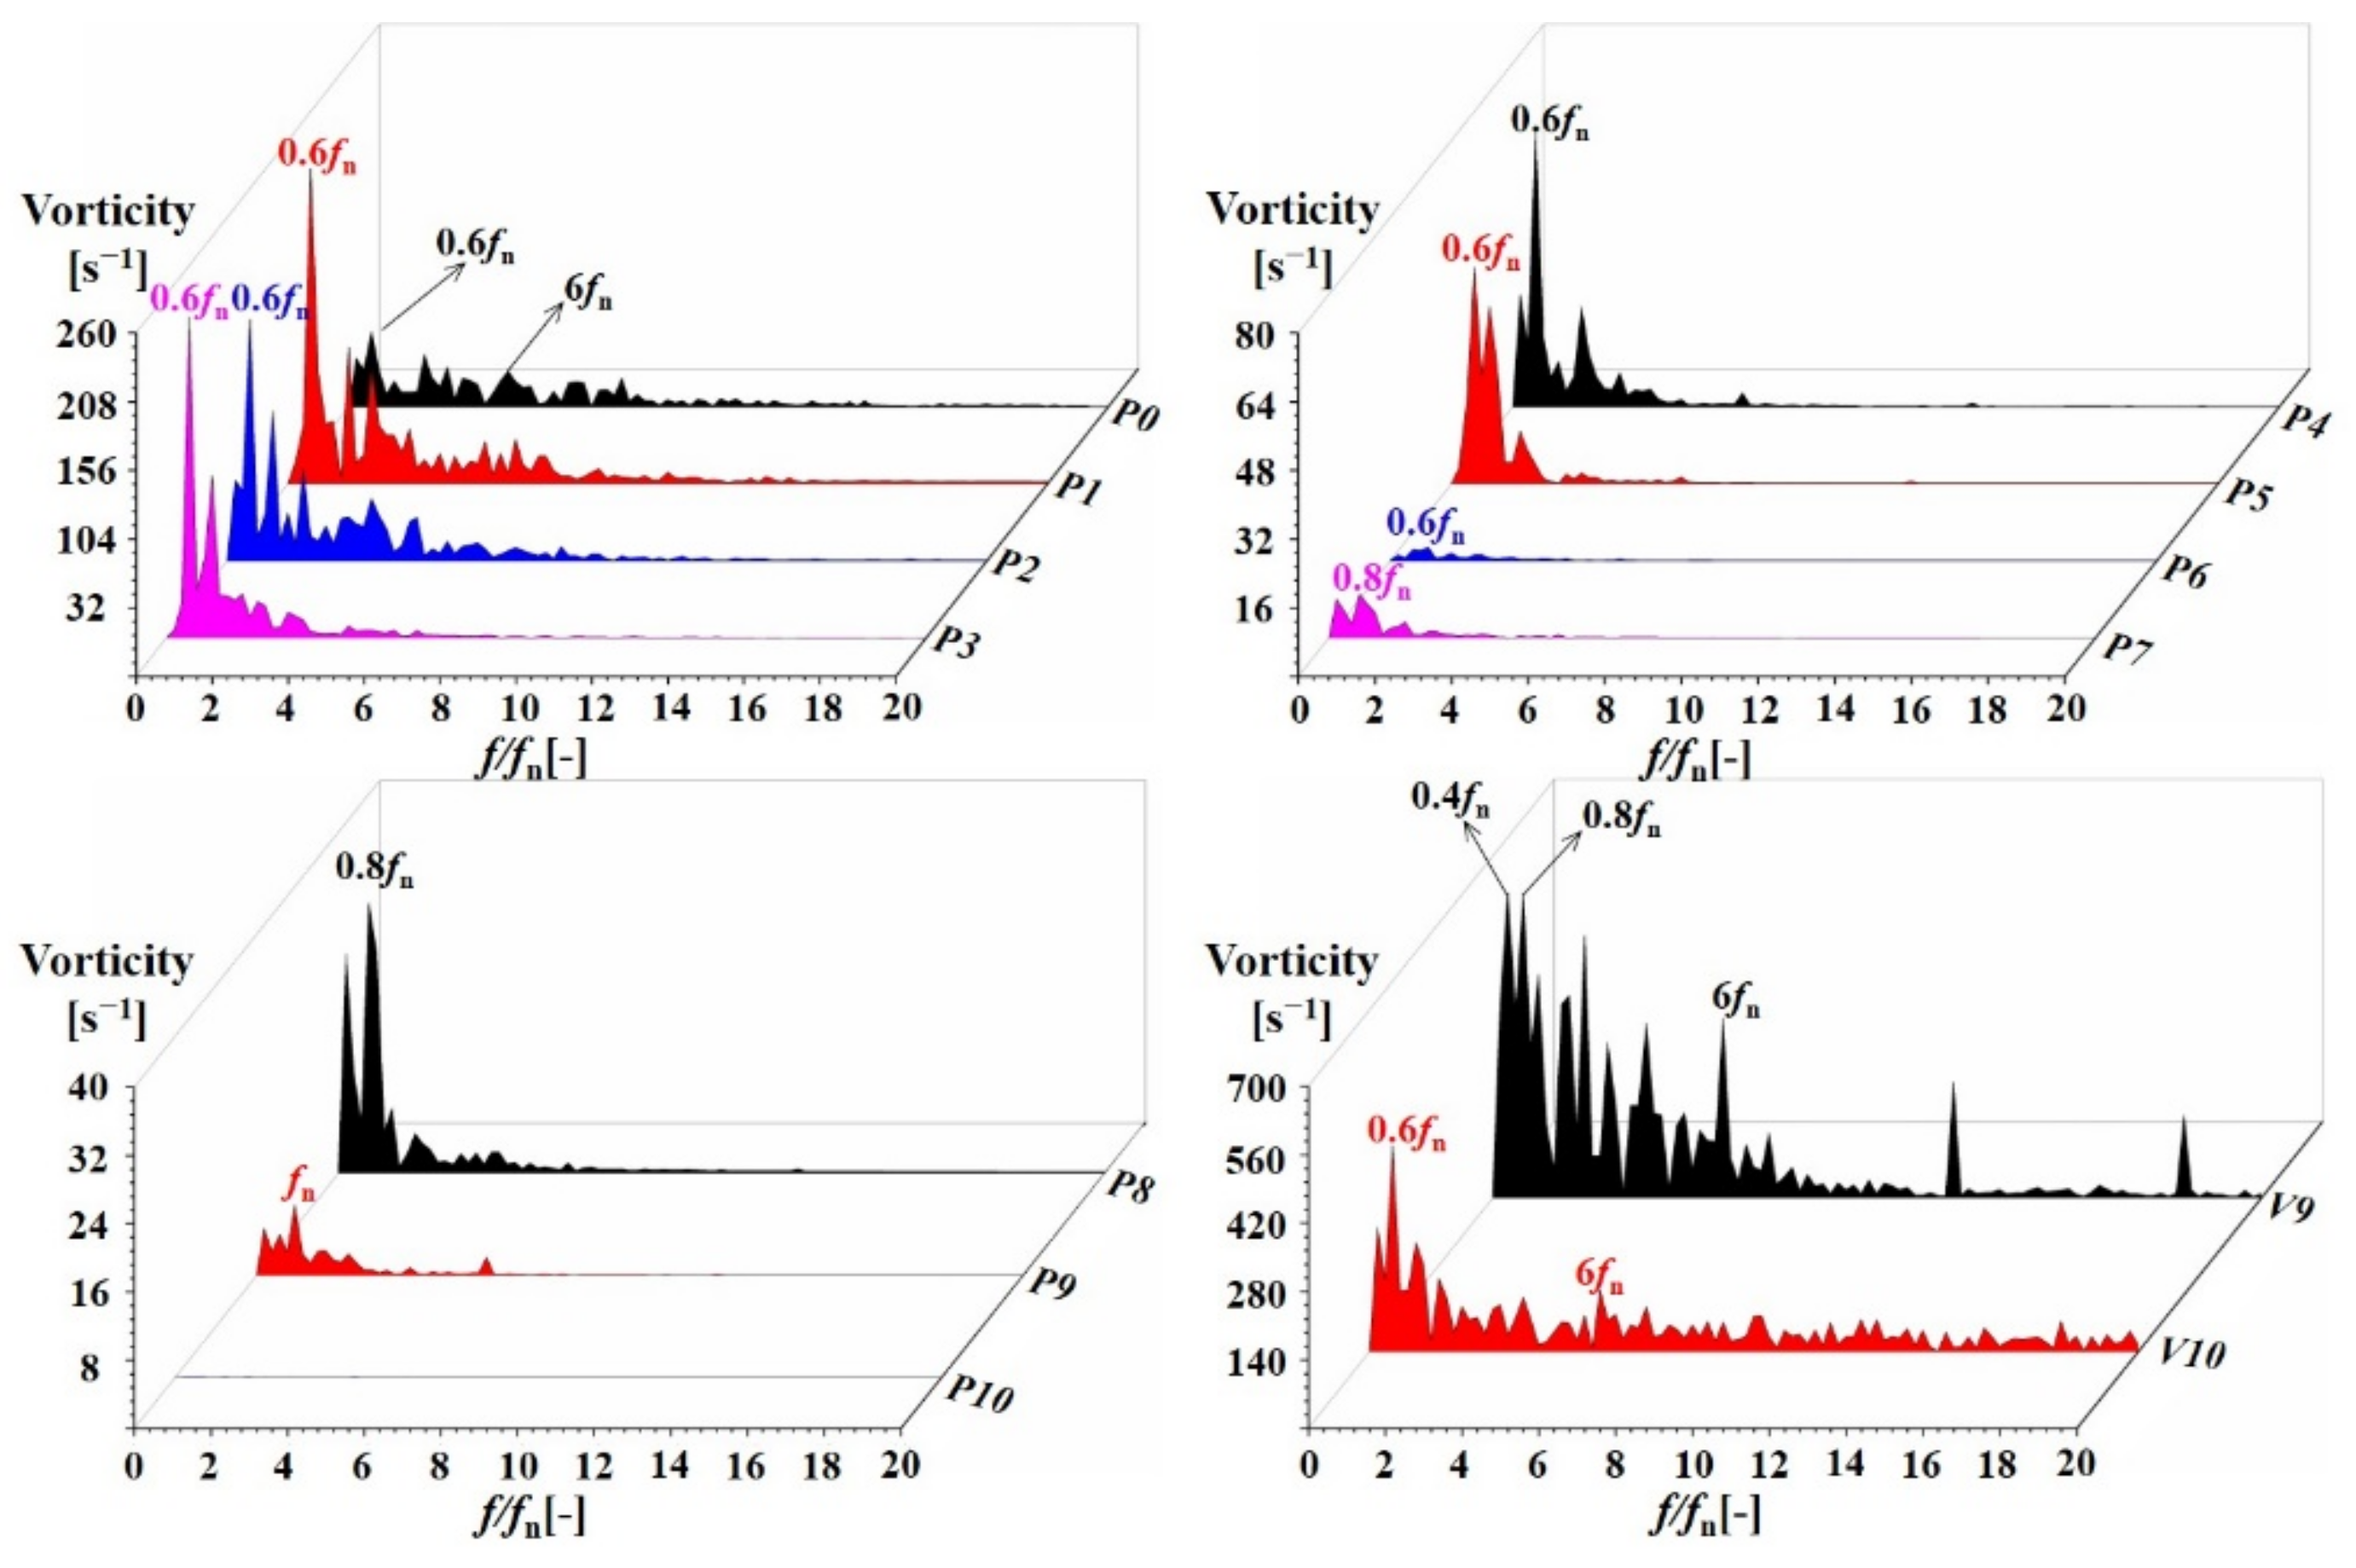
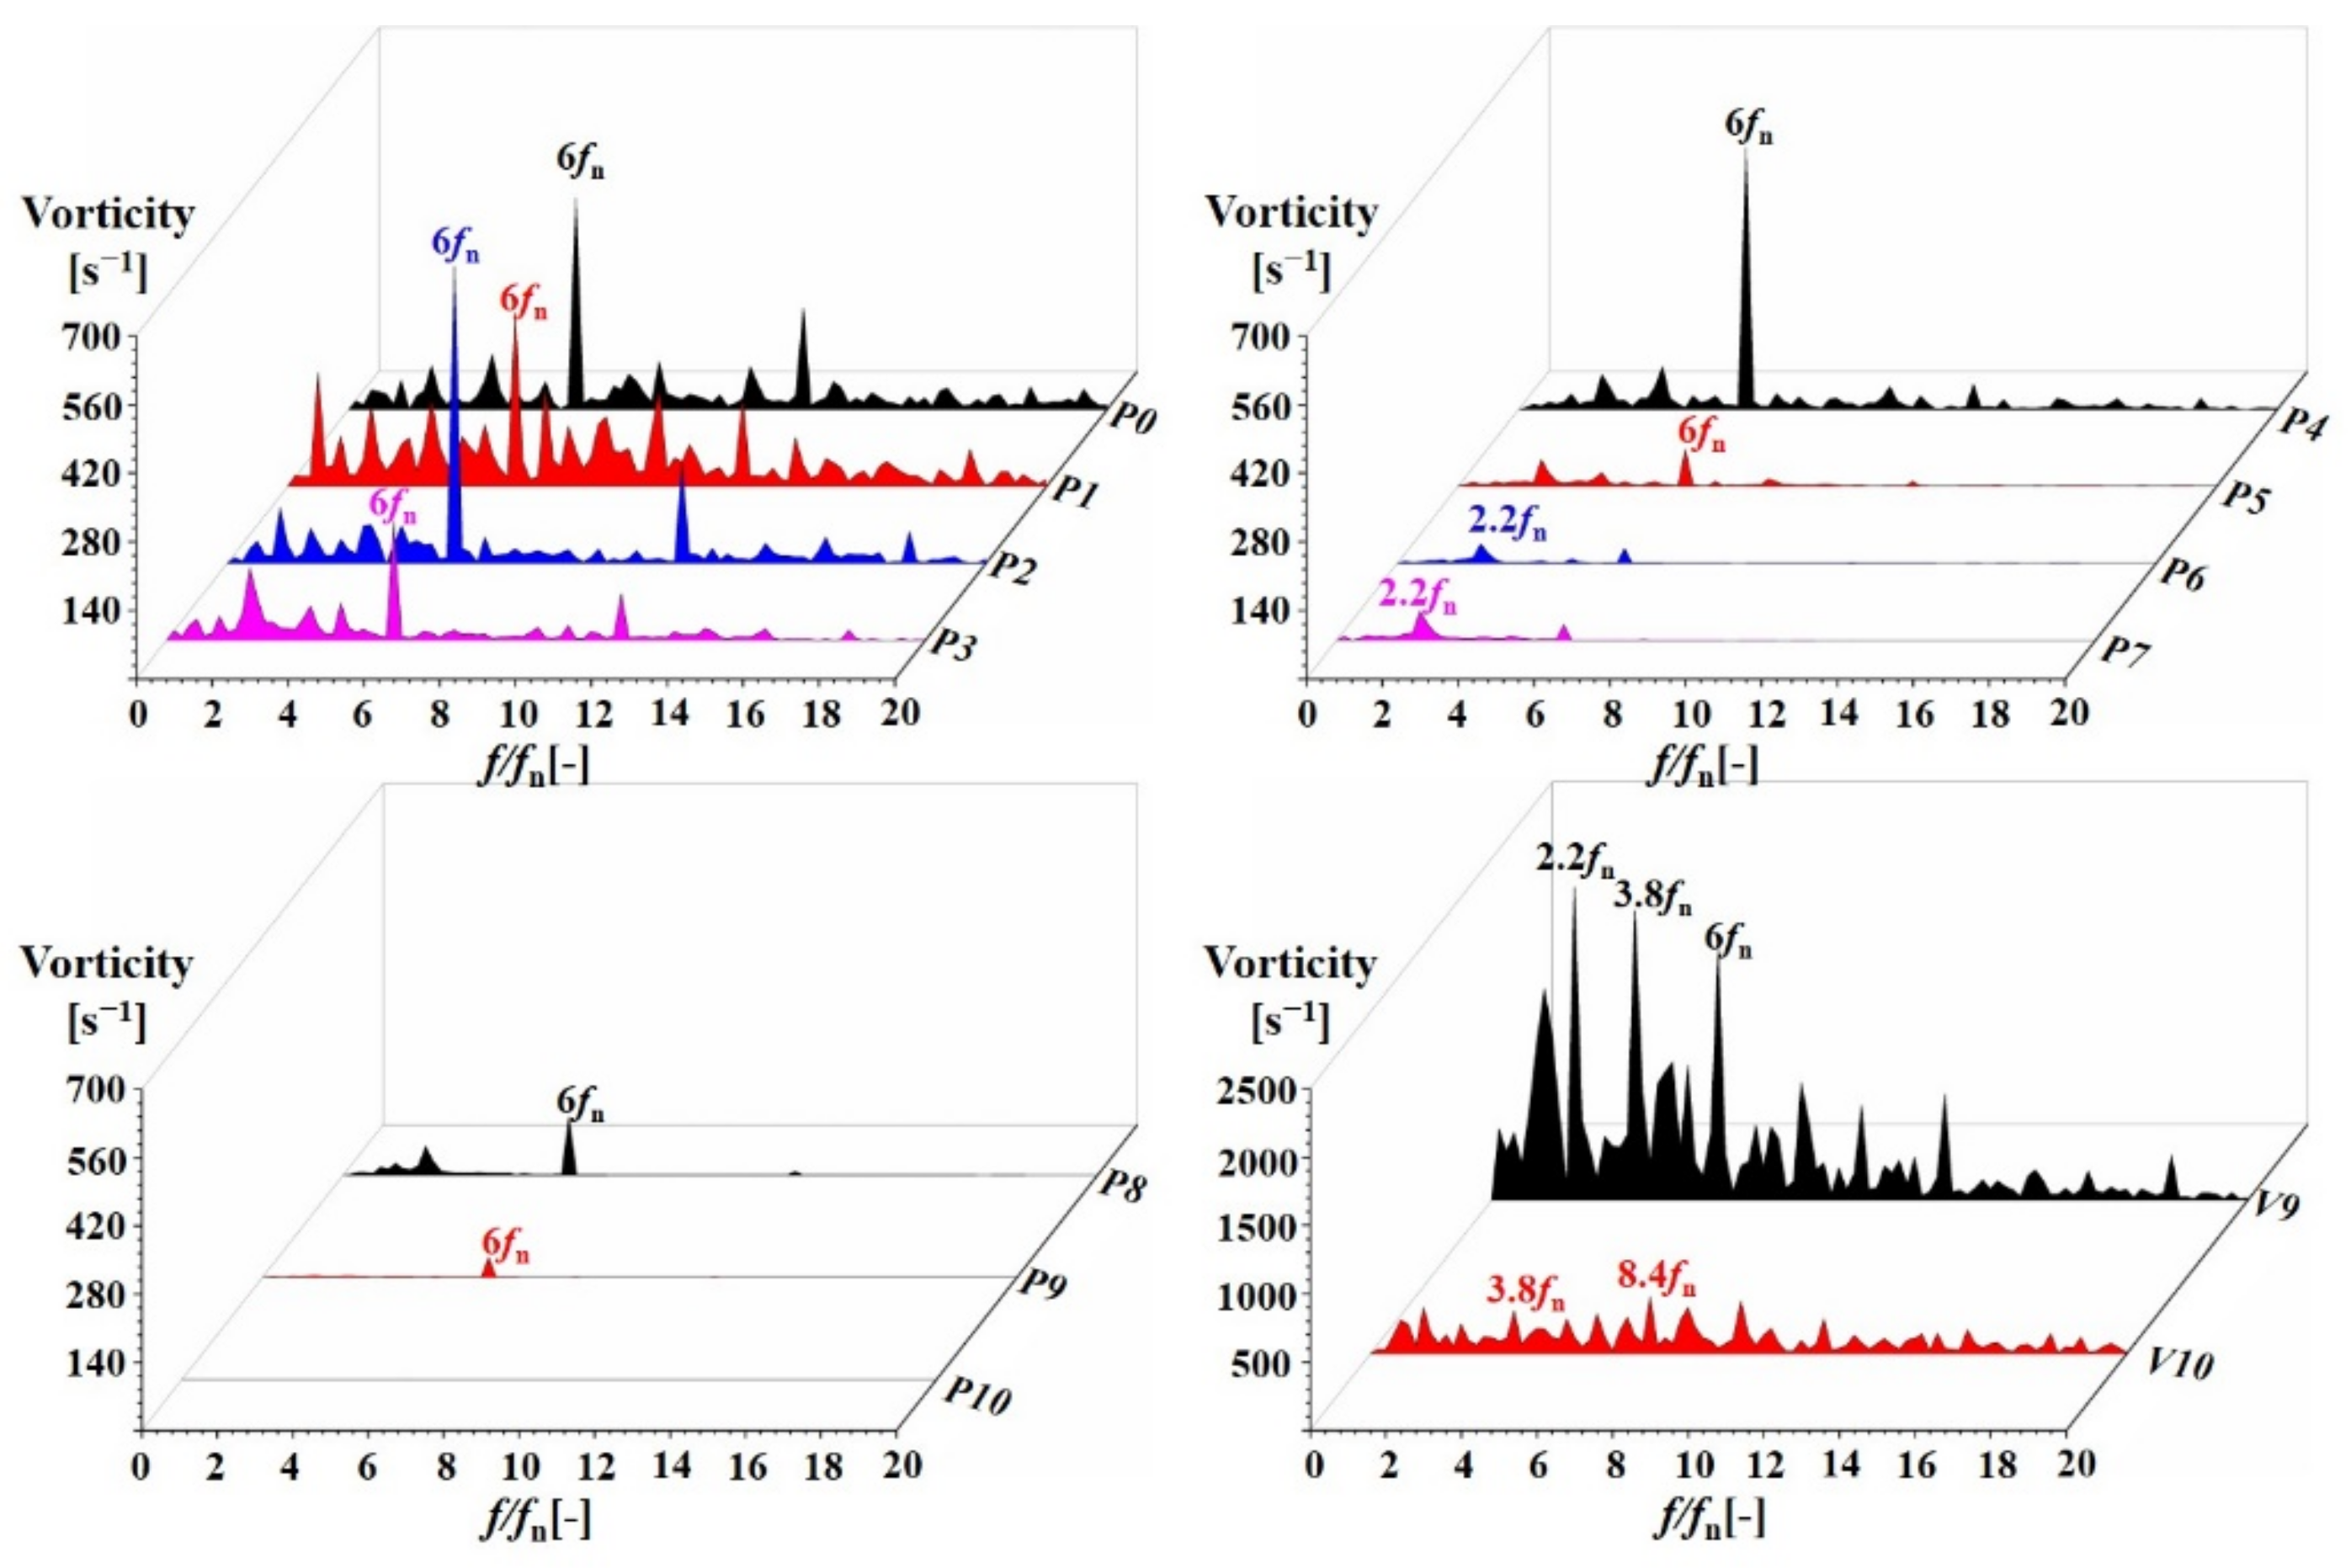
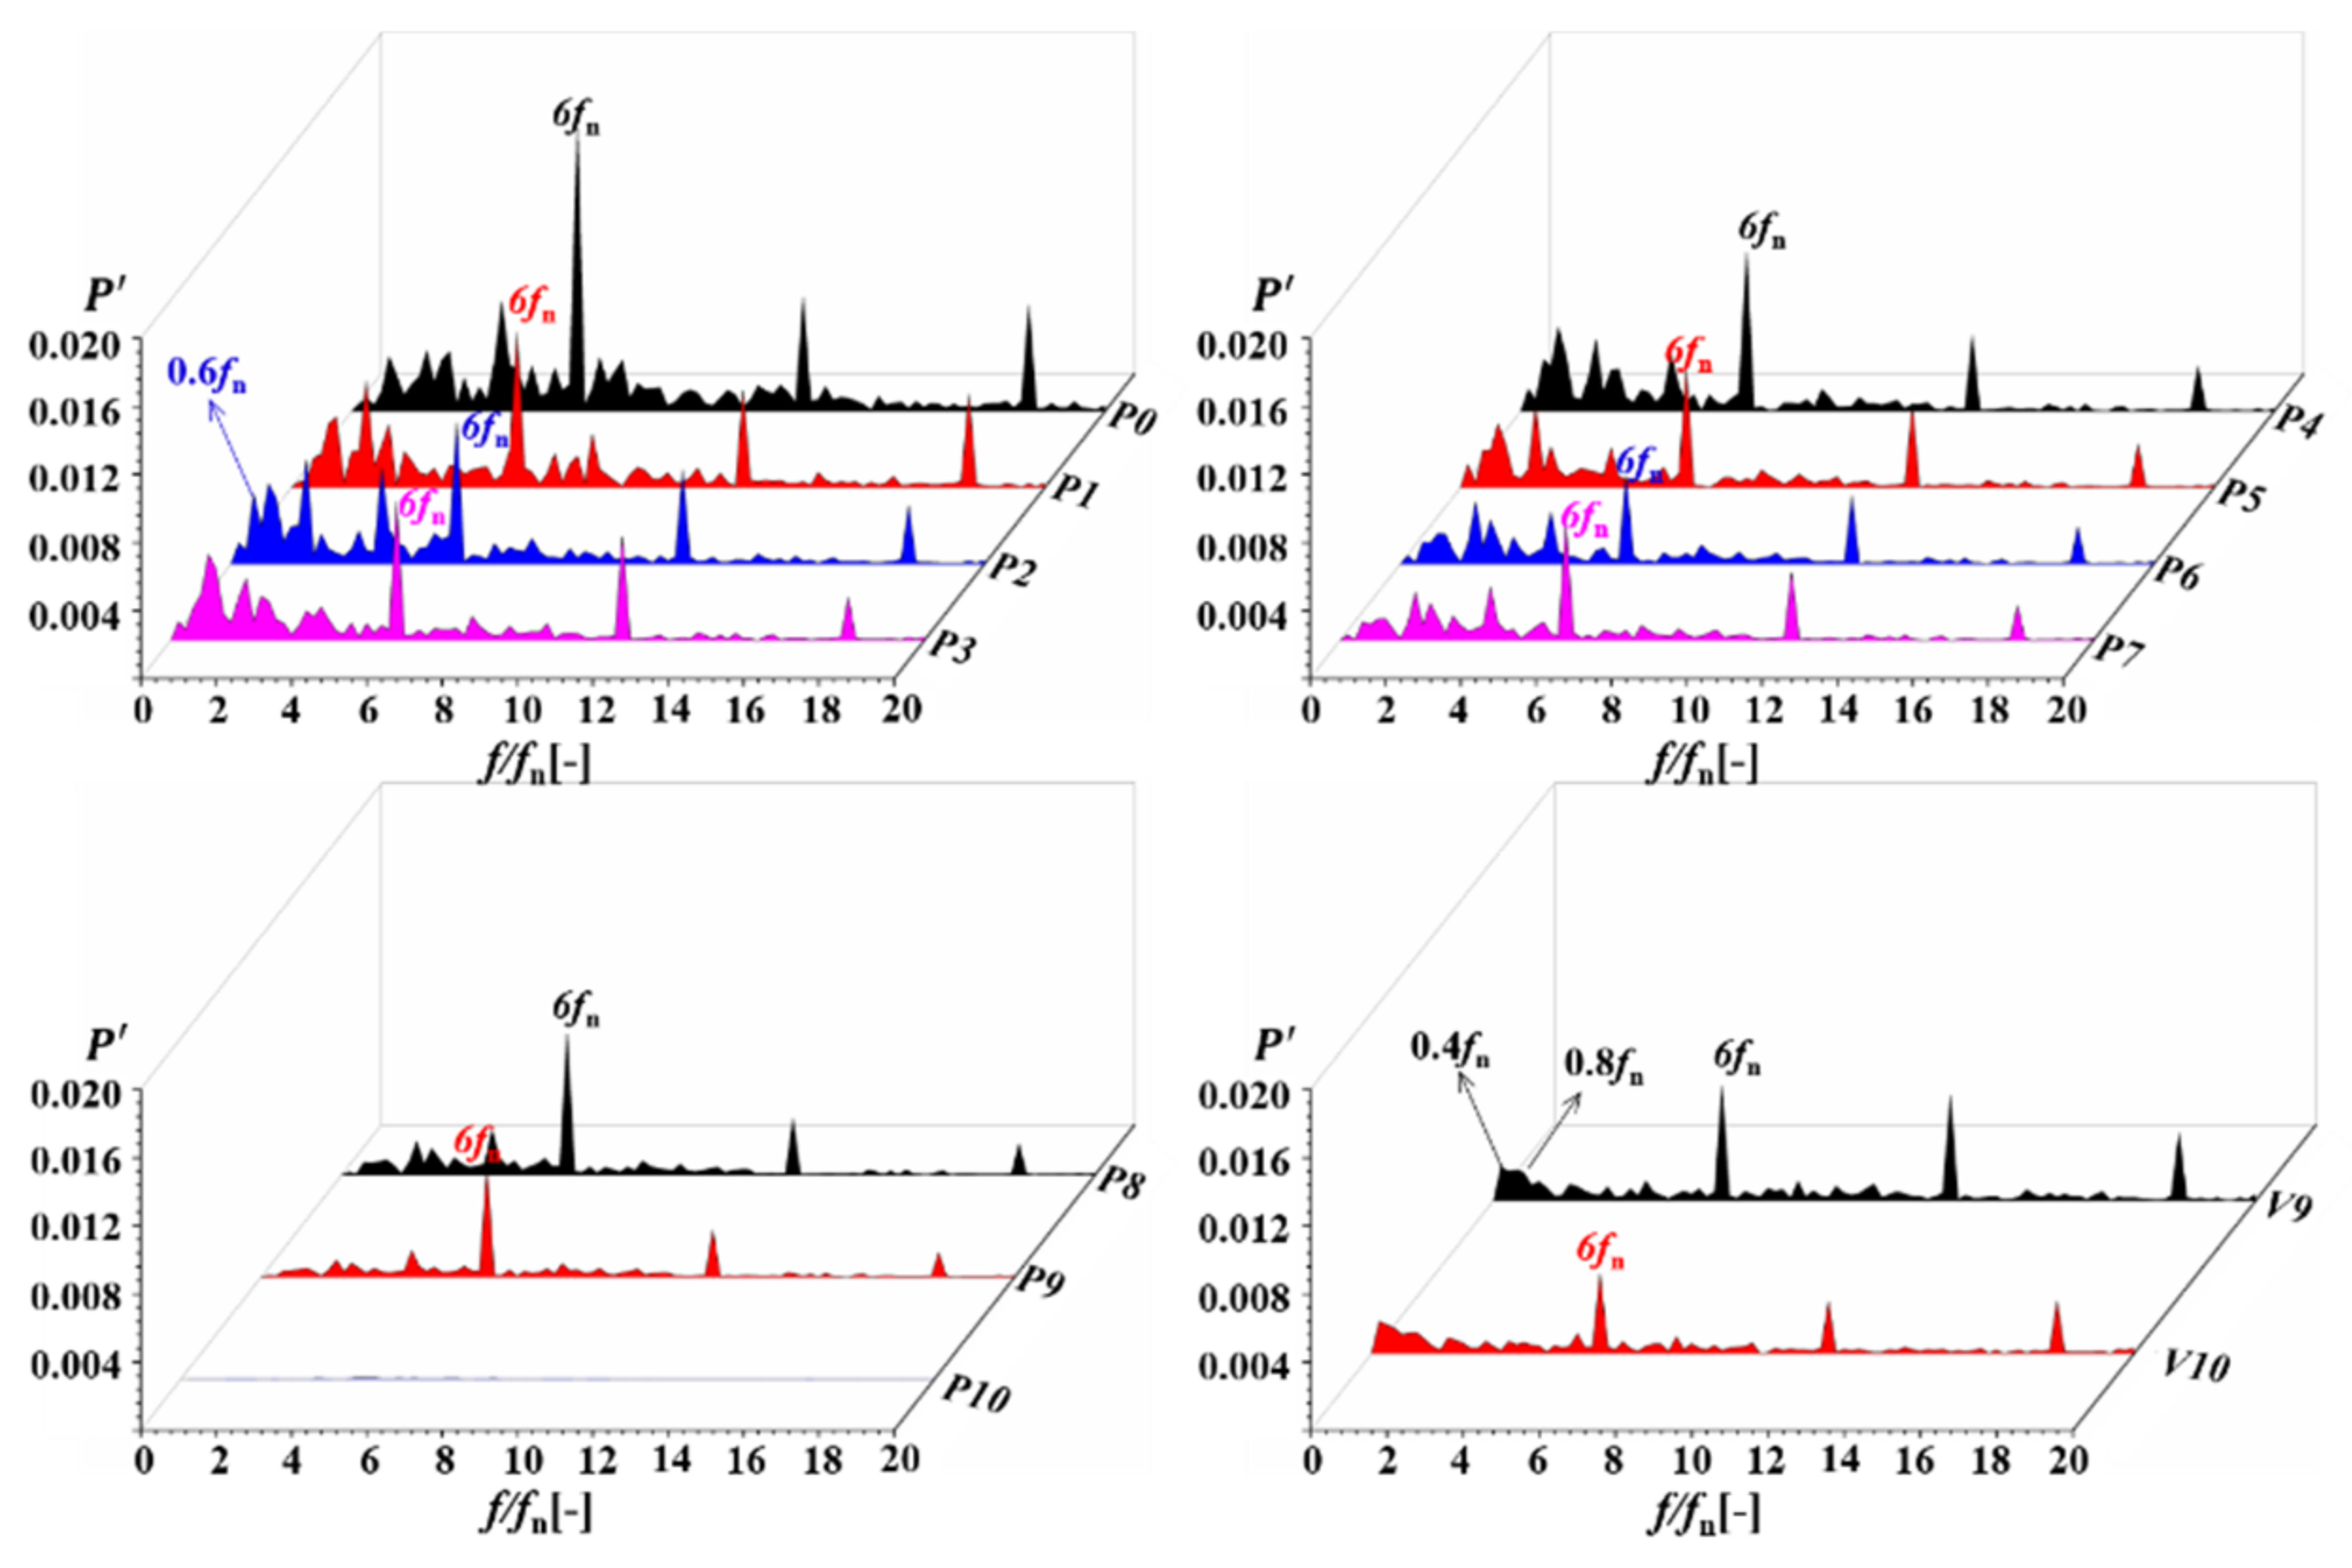
3.2. Vorticity Fluctuation Characteristics
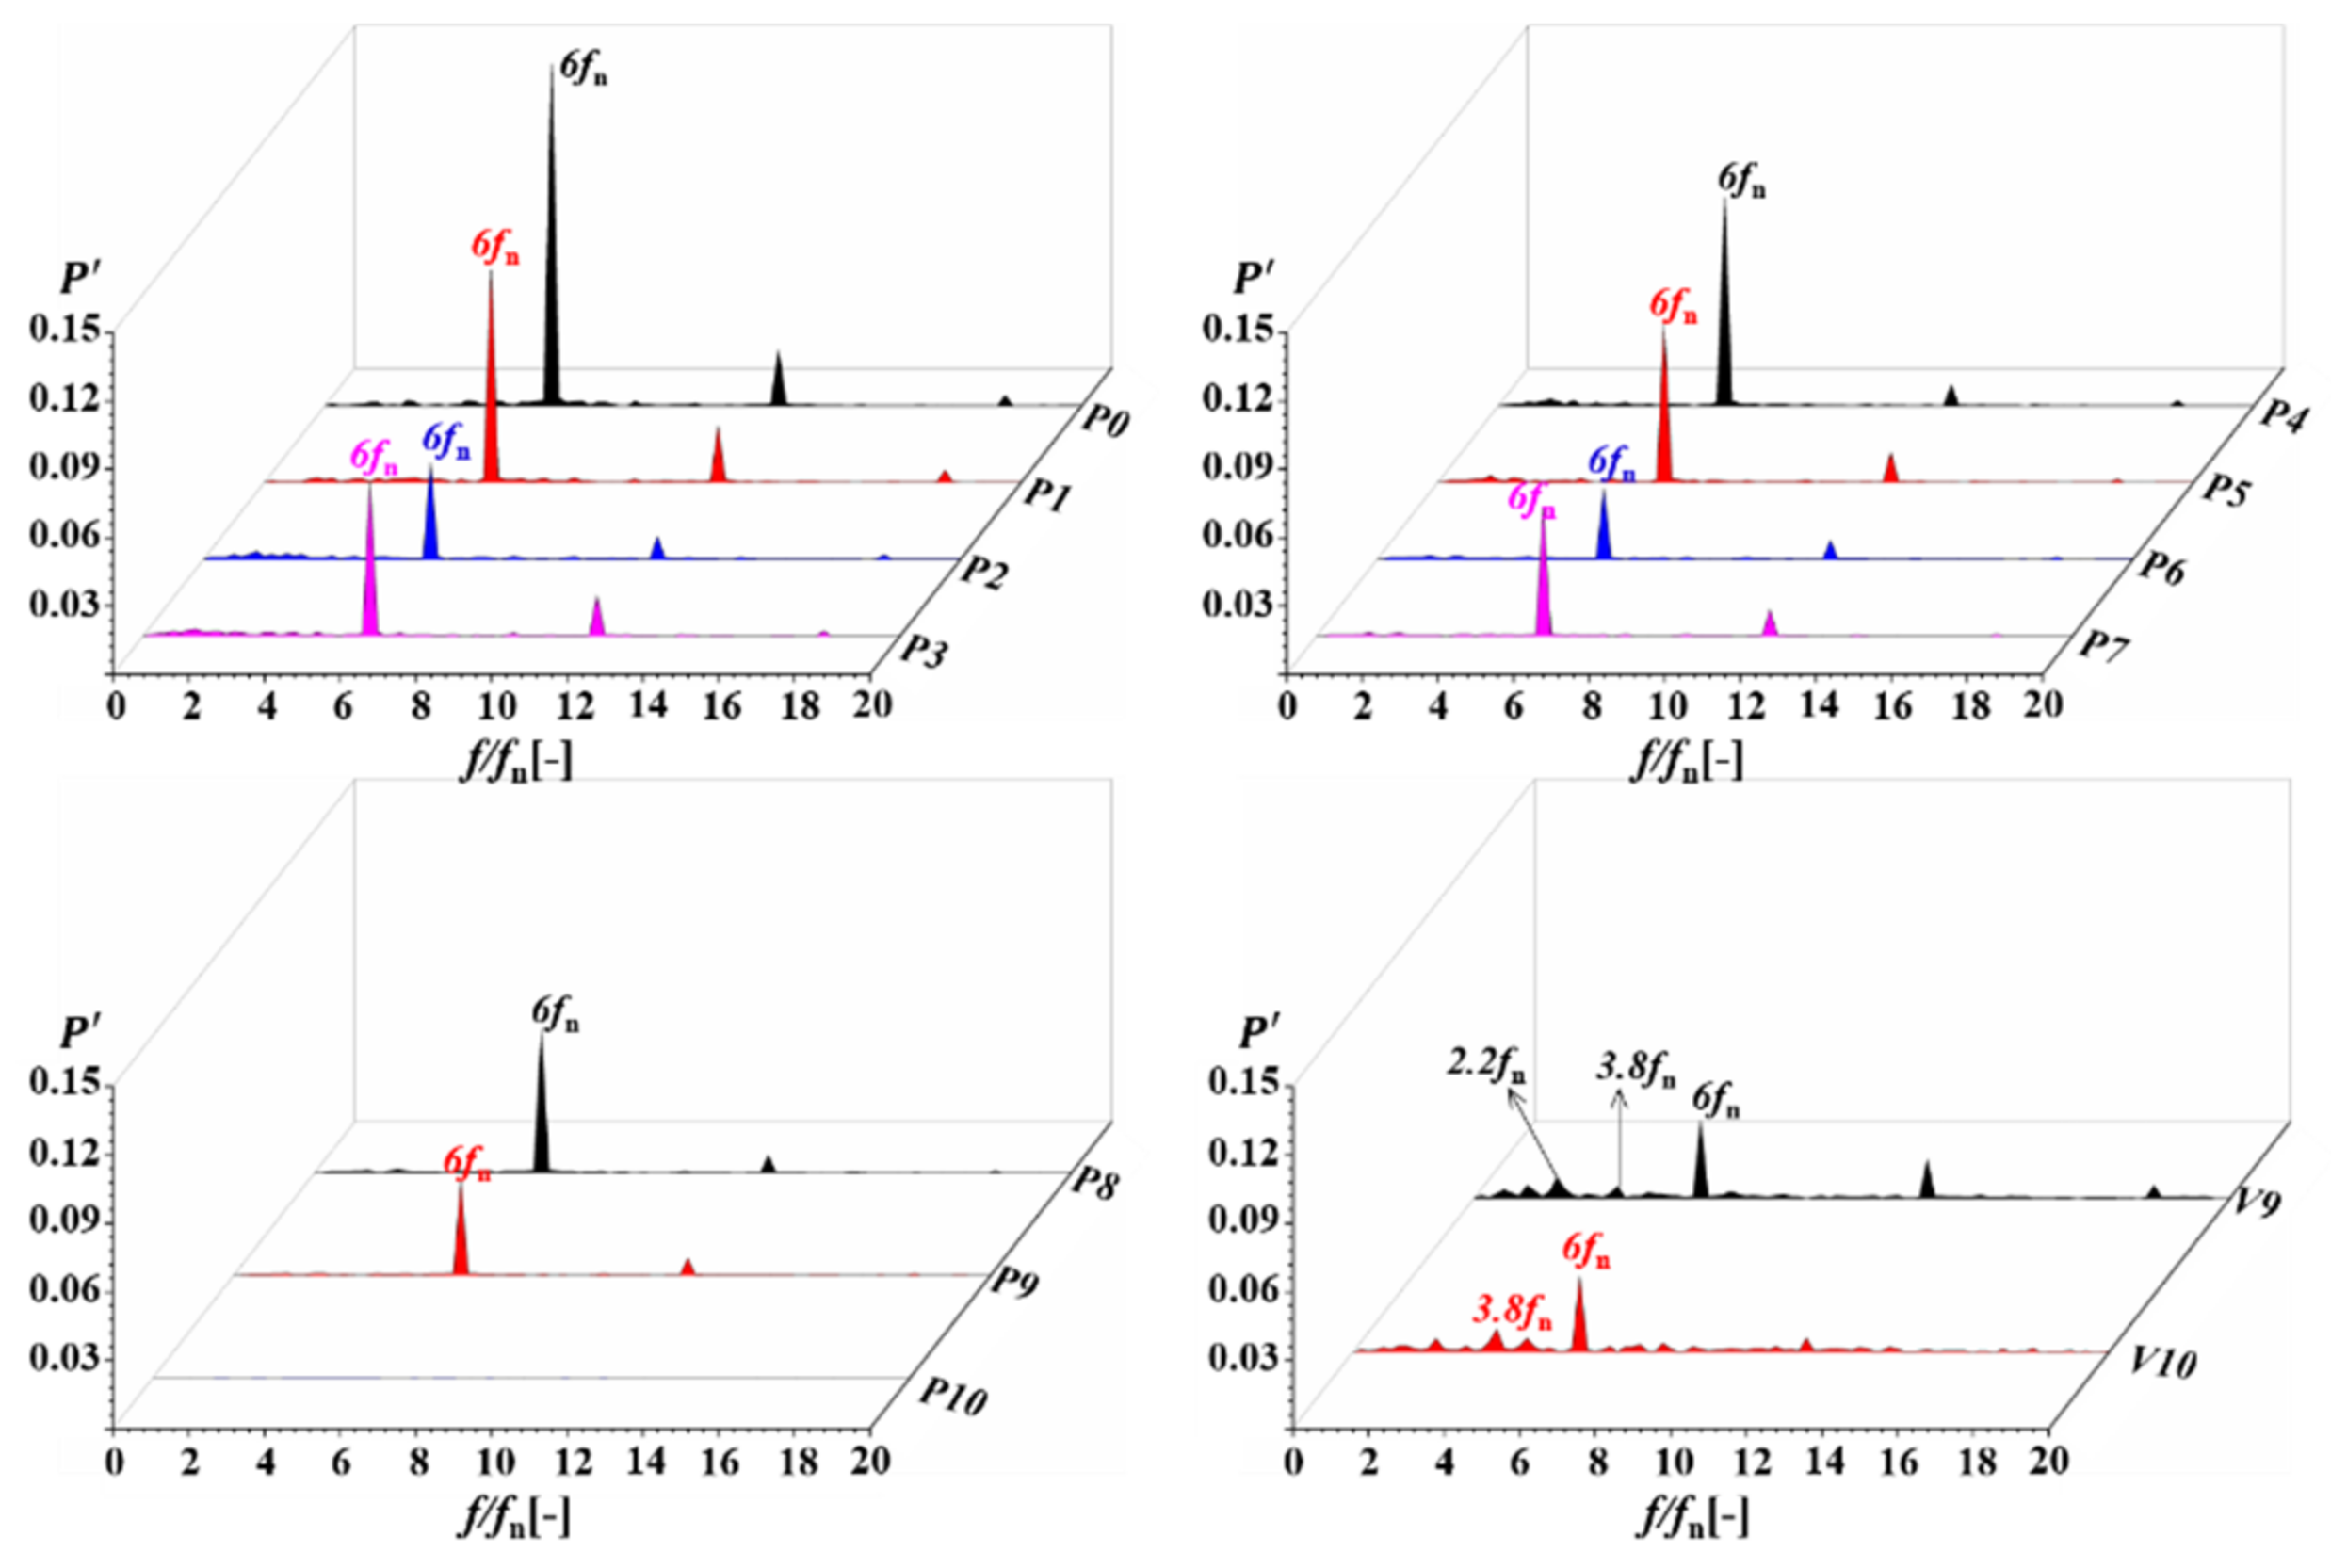
3.3. Pressure Fluctuation Characteristics
4. Conclusions
- (1)
- Under Qb conditions, the effects of impeller rotation had less influence on the vorticity distribution near the volute walls but significantly influenced the vortex evolution at the leading edge of the volute tongue. The evolution of vorticity at the leading edge of the volute tongue intensified the local pressure pulsations as the flow rate increased. Under the different operating conditions of the PATs, the vorticity fluctuation dominant frequency of the volute was significantly varied.
- (2)
- The pressure fluctuation intensity was the lowest in the volute while the volute tongue aligned with the blade leading edge, increasing with the flow rate. The pressure fluctuations characteristic of the volute were dominated by the rotor–stator interaction with the dominant frequency is 6fn. The rotor–stator interaction had few effects on the pressure and vorticity fluctuation characteristics of the volute inlet contraction section and its upstream section.
- (3)
- Under Qb and 1.3Qb conditions, the vorticity pulsation near the wall in the circumferential direction of the volute had less effect on local pressure pulsation characteristics. The effects of impeller rotation had less influence on vortex evolution at the leading edge of the volute tongue under the off-design conditions. The evolution of vorticity at the leading edge of the volute tongue intensified the local pressure pulsations as the flow rate increased. Under the 0.7Qb conditions, the vorticity pulsation characteristics in the volute were complex and had a relatively significant influence on local pressure pulsation.
Author Contributions
Funding
Data Availability Statement
Conflicts of Interest
Nomenclature
| H | Head (m) |
| Q | Flow rate (m3·s−1) |
| N | Total number of cells |
| Extrapolated parameter value (−) | |
| Gfine | Fine-grid convergence index (−) |
| eext | Extrapolated relative error (−) |
| ea | Approximate relative error (−) |
| p1 | Inlet static pressure of the PAT (Pa) |
| p2 | Outlet static pressure of the PAT (Pa) |
| fn | Impeller rotation frequency (Hz) |
| Cp | pressure pulsation intensity coefficient (−) |
| ωz | Z-direction vorticity (s−1) |
| Standard deviation (−) | |
| Random uncertainty (−) | |
| ρ | Density (kg·m−3) |
| η | Efficiency (−) |
| Pressure fluctuations coefficient (−) | |
| Qb | Best efficiency flow rate point (m3·s−1) |
| ns | Designed specific speed (−) |
| T | Torque of the impeller (N·m−1) |
| n | Rotational speed (min−1) |
| y+ | y plus value (−) |
Abbreviations
| PAT | Pump as turbine |
| RMS | Root mean square |
| BEP | Best efficiency point |
| GCI | Grid convergence index |
| ECD | Electric eddy current dynamometer |
| CFD | Computational fluid dynamics |
| BPF | Blade passing frequency |
| PS | Pressure side of the blade |
| SS | Suction side of the blade |
| FDR | Flow deviation ratio |
References
- Zhang, Z.; Su, X.; Jin, Y.; Zhu, Z.; Lin, T. Research on energy recovery through hydraulic turbine system in marine desulfurization application. Sustain. Energy Technol. Assess. 2022, 51, 101912. [Google Scholar] [CrossRef]
- Lin, T.; Zhu, Z.; Li, X.; Li, J.; Lin, Y. Theoretical, experimental and numerical methods to predict the best efficiency point of centrifugal pump as turbine. Renew. Energy 2021, 168, 31–44. [Google Scholar] [CrossRef]
- Lin, T.; Li, X.; Zhu, Z.; Xie, J.; Li, Y.; Yang, H. Application of enstrophy dissipation to analyze energy loss in a centrifugal pump as turbine. Renew. Energy 2021, 163, 41–55. [Google Scholar] [CrossRef]
- Cui, B.; Li, X.; Rao, K.; Jia, X.; Nie, X. Analysis of unsteady radial forces of multistage centrifugal pump with double volute. Eng. Comput. 2018, 35, 1500–1511. [Google Scholar] [CrossRef]
- Huang, S.; Qiu, G.; Su, X.; Chen, J.; Zou, W. Performance prediction of a centrifugal pump as turbine using rotor-volute matching principle. Renew. Energy 2017, 108, 64–71. [Google Scholar] [CrossRef]
- Tao, Y.; Yuan, S.; Liu, J.; Zhang, F. Influence of cross-sectional flow area of annular volute casing on transient characteristics of ceramic centrifugal pump. Chin. J. Mech. Eng. 2019, 32, 1–13. [Google Scholar] [CrossRef] [Green Version]
- Tahani, M.; Kandi, A.; Moghimi, M.; Houreh, S.D. Rotational speed variation assessment of centrifugal pump-as-turbine as an energy utilization device under water distribution network condition. Energy 2020, 213, 118502. [Google Scholar] [CrossRef]
- Štefan, D.; Rossi, M.; Hudec, M.; Rudolfa, P.; Nigrob, A.; Renzi, M. Study of the internal flow field in a pump-as-turbine (PaT): Numerical investigation, overall performance prediction model and velocity vector analysis. Renew. Energy 2020, 156, 158–172. [Google Scholar] [CrossRef]
- Mohammadi, M.; Yasi, M.; Jamali, S.; Hajikandi, H. Experimental Study on Single-and Multi-Stage Pump as Turbine on Water Supply Pipelines. Iran. J. Sci. Technol. Trans. Civ. Eng. 2022, 46, 3307–3318. [Google Scholar] [CrossRef]
- Wang, T.; Wang, C.; Kong, F.; Gou, Q.; Yang, S. Theoretical, experimental and numerical study of special impeller used in turbine mode of centrifugal pump as turbine. Energy 2017, 130, 473–485. [Google Scholar] [CrossRef]
- Wang, T.; Kong, F.; Xia, B.; Bai, Y.; Wang, C. The method for determining blade inlet angle of special impeller using in turbine mode of centrifugal pump as turbine. Renew. Energy 2017, 109, 518–528. [Google Scholar] [CrossRef]
- Su, X.; Huang, S.; Zhang, X.; Yang, S. Numerical research on unsteady flow rate characteristics of pump as turbine. Renew. Energy 2016, 94, 488–495. [Google Scholar] [CrossRef]
- Morabito, A.; Vagnoni, E.; Di Matteo, M.; Hendrick, P. Numerical investigation on the volute cutwater for pumps running in turbine mode. Renew. Energy 2021, 175, 807–824. [Google Scholar] [CrossRef]
- Arani, H.A.; Fathi, M.; Raisee, M.; Nourbakhsh, S.A. Numerical investigation of tongue effects on pump performance in direct and reverse modes. In IOP Conference Series: Earth and Environmental Science; IOP Publishing: Bristol, UK, 2019; Volume 240, p. 042003. [Google Scholar]
- Arani, H.A.; Fathi, M.; Raisee, M.; Nourbakhsh, S.A. The effect of tongue geometry on pump performance in reverse mode: An experimental study. Renew. Energy 2019, 141, 717–727. [Google Scholar] [CrossRef]
- Qian, Z.; Wang, F.; Guo, Z.; Lu, J. Performance evaluation of an axial-flow pump with adjustable guide vanes in turbine mode. Renew. Energy 2016, 99, 1146–1152. [Google Scholar] [CrossRef]
- Xin, T.; Wei, J.; Qiuying, L.; Hou, G.; Ning, Z.; Yuchuan, W.; Diyi, C. Analysis of hydraulic loss of the centrifugal pump as turbine based on internal flow feature and entropy generation theory. Sustain. Energy Technol. Assess. 2022, 52, 102070. [Google Scholar] [CrossRef]
- Lu, Z.; Xiao, R.; Tao, R.; Li, P.; Liu, W. Influence of guide vane profile on the flow energy dissipation in a reversible pump-turbine at pump mode. J. Energy Storage 2022, 49, 104161. [Google Scholar] [CrossRef]
- Giosio, D.R.; Henderson, A.D.; Walker, J.M.; Brandnerb, P.A.; Sargisonc, J.E.; Gautam, P. Design and performance evaluation of a pump-as-turbine micro-hydro test facility with incorporated inlet flow control. Renew. Energy 2015, 78, 1–6. [Google Scholar] [CrossRef]
- Shi, F.X.; Yang, J.H.; Wang, X.H. Analysis on the effect of variable guide vane numbers on the performance of pump as turbine. Adv. Mech. Eng. 2018, 10, 1687814018780796. [Google Scholar] [CrossRef]
- Zhang, L.; Davila, G.; Zangeneh, M. Multi-objective optimization of a high specific speed centrifugal volute pump using three-dimensional inverse design coupled with computational fluid dynamics simulations. J. Fluids Eng. 2021, 143, 021202. [Google Scholar] [CrossRef]
- Shim, H.S.; Kim, K.Y. Design optimization of the impeller and volute of a centrifugal pump to improve the hydraulic performance and flow stability. J. Fluids Eng. 2020, 142, 10. [Google Scholar] [CrossRef]
- Shim, H.S.; Kim, K.Y. Effects of the cross-sectional area of a volute on suction recirculation and cavitation in a centrifugal pump. J. Fluids Eng. 2020, 142, 5. [Google Scholar] [CrossRef]
- Morros, C.S.; Oro, J.M.F.; Díaz, K.M.A. Numerical modelling and flow analysis of a centrifugal pump running as a turbine: Unsteady flow structures and its effects on the global performance. Int. J. Numer. Methods Fluids 2011, 65, 542–562. [Google Scholar] [CrossRef]
- Binama, M.; Su, W.T.; Cai, W.H.; Lic, X.-B.; Muhirwaa, A.; Lia, B.; Bisengimana, E. Blade trailing edge position influencing pump as turbine (PAT) pressure field under part-load conditions. Renew. Energy 2019, 136, 33–47. [Google Scholar] [CrossRef]
- Xiang, R.; Wang, T.; Fang, Y.; Yu, H.; Zhou, M.; Zhang, X. Effect of blade curve shape on the hydraulic performance and pressure pulsation of a pump as turbine. Phys. Fluids 2022, 34, 085130. [Google Scholar] [CrossRef]
- Yang, S.S.; Kong, F.Y.; Qu, X.Y.; Jiang, W.M. Influence of blade number on the performance and pressure pulsations in a pump used as a turbine. J. Fluids Eng. 2012, 134, 12. [Google Scholar] [CrossRef]
- Buono, D.; Frosina, E.; Mazzone, A.; Cesaro, U.; Senatore, A. Study of a pump as turbine for a hydraulic urban network using a tridimensional CFD modeling methodology. Energy Procedia 2015, 82, 201–208. [Google Scholar] [CrossRef] [Green Version]
- Gao, Y.; Fan, X.; Dang, R. Numerical characterization of the effects of flow rate on pressure and velocity distribution of pump as turbine. Curr. Sci. 2019, 117, 00113891. [Google Scholar] [CrossRef]
- Fei, Z.; Zhang, R.; Xu, H.; Feng, J.; Mu, T.; Chen, Y. Energy performance and flow characteristics of a slanted axial-flow pump under cavitation conditions. Phys. Fluids 2022, 34, 035121. [Google Scholar] [CrossRef]
- Lin, Y.; Li, X.; Zhu, Z.; Wang, X.; Lin, T.; Cao, H. An energy consumption improvement method for centrifugal pump based on bionic optimization of blade trailing edge. Energy 2022, 246, 123323. [Google Scholar] [CrossRef]
- Wu, C.; Pu, K.; Li, C.; Wu, P.; Huang, B.; Wu, D. Blade redesign based on secondary flow suppression to improve energy efficiency of a centrifugal pump. Energy 2022, 246, 123394. [Google Scholar] [CrossRef]
- Ji, L.; Li, W.; Shi, W.; Chang, H.; Yang, Z. Energy characteristics of mixed-flow pump under different tip clearances based on entropy production analysis. Energy 2020, 199, 117447. [Google Scholar] [CrossRef]
- Zhang, F.; Appiah, D.; Hong, F.; Zhang, J.; Yuan, S.; Adu-Poku, K.A.; Wei, X. Energy loss evaluation in a side channel pump under different wrapping angles using entropy production method. Int. Commun. Heat Mass Transf. 2020, 113, 104526. [Google Scholar] [CrossRef]
- Spalart, P.R.; Shur, M. On the sensitization of turbulence models to rotation and curvature. Aerosp. Sci. Technol. 1997, 1, 297–302. [Google Scholar] [CrossRef]
- Roache, P.J. Quantification of uncertainty in computational fluid dynamics. Annu. Rev. Fluid Mech. 1997, 29, 123–160. [Google Scholar] [CrossRef] [Green Version]
- Celik, I.B.; Ghia, U.; Roache, P.J.; Freitas, C.J. Procedure for estimation and reporting of uncertainty due to discretization in CFD applications. J. Fluids Eng.-Trans. ASME 2008, 130, 078001. [Google Scholar] [CrossRef] [Green Version]
- Yang, B.; Li, B.; Chen, H.; Liu, Z.; Xu, K. Numerical investigation of the clocking effect between inducer and impeller on pressure pulsations in a liquid rocket engine oxygen turbopump. J. Fluids Eng. 2019, 141, 071109. [Google Scholar] [CrossRef]


| Parameter | Notation | Value | Parameter | Notation | Value |
|---|---|---|---|---|---|
| Impeller inlet diameter (mm) | D1 | 169 | Blade inlet angle (°) | β2 | 25 |
| Impeller outlet diameter (mm) | D2 | 86 | Blade outlet angle (°) | β1 | 30 |
| Impeller inlet width (mm) | b1 | 14 | Volute base circle diameter (mm) | D3 | 172 |
| Impeller outlet width (mm) | b2 | 20 | Blade number | Z | 6 |
| H (m) | 1.32 | 1.31 | 0.986 | 57.83 | 0.0032% | 0.0104% | 1.30% | 57.82 | 0.0024% | 0.0079% | 0.99% |
| η (%) | 1.32 | 1.31 | 4.943 | 75.16 | 0.0014% | 0.0005% | 0.06% | 75.16 | 0.0052% | 0.0019% | 0.23% |
| Domain | Node (Million) | Wall Average y+ | Worst Quality |
|---|---|---|---|
| Inlet duct | 0.3415 | 3.24 | 0.88 |
| Volute | 2.6914 | 6.37 | 0.52 |
| Impeller | 2.7624 | 6.24 | 0.43 |
| Front chamber | 0.4764 | 5.54 | 0.74 |
| Back chamber | 0.6213 | 4.84 | 0.72 |
| Outlet duct | 0.3649 | 3.76 | 0.87 |
Publisher’s Note: MDPI stays neutral with regard to jurisdictional claims in published maps and institutional affiliations. |
© 2022 by the authors. Licensee MDPI, Basel, Switzerland. This article is an open access article distributed under the terms and conditions of the Creative Commons Attribution (CC BY) license (https://creativecommons.org/licenses/by/4.0/).
Share and Cite
Lin, T.; Zhang, J.; Li, J.; Li, X.; Zhu, Z. Pressure Fluctuation–Vorticity Interaction in the Volute of Centrifugal Pump as Hydraulic Turbines (PATs). Processes 2022, 10, 2241. https://doi.org/10.3390/pr10112241
Lin T, Zhang J, Li J, Li X, Zhu Z. Pressure Fluctuation–Vorticity Interaction in the Volute of Centrifugal Pump as Hydraulic Turbines (PATs). Processes. 2022; 10(11):2241. https://doi.org/10.3390/pr10112241
Chicago/Turabian StyleLin, Tong, Jianrong Zhang, Jian Li, Xiaojun Li, and Zuchao Zhu. 2022. "Pressure Fluctuation–Vorticity Interaction in the Volute of Centrifugal Pump as Hydraulic Turbines (PATs)" Processes 10, no. 11: 2241. https://doi.org/10.3390/pr10112241