Article

The Influence of Reservoir Clay Composition on Heavy Oil In Situ Combustion

by
Ilgiz F. Minkhanov
1,
Alexander V. Bolotov
1,
Aidar R. Tazeev
1,
Vladislav V. Chalin
1,
Anini Franck D. Kacou
1,
Ranel I. Galeev
1,
Rustam N. Sagirov
1,
Ameen A. Al-Muntaser
1,
Dmitrii A. Emelianov
1,2,
Mohammed Amine Khelkhal
1,* and
Mikhail A. Varfolomeev
1,*
1
Department of Petroleum Engineering, Kazan Federal University, 18 Kremlyovskaya Str., 420008 Kazan, Russia
2
Department of Physical Chemistry, Kazan Federal University, 18 Kremlyovskaya Str., 420008 Kazan, Russia
*
Authors to whom correspondence should be addressed.
Processes 2022, 10(11), 2308; https://doi.org/10.3390/pr10112308
Submission received: 20 September 2022 / Revised: 27 October 2022 / Accepted: 4 November 2022 / Published: 6 November 2022
(This article belongs to the Special Issue Heavy Oils Conversion Processes (II))

Abstract

:
Thermally enhanced oil recovery methods, such as in situ combustion and steam injection, are generating considerable interest in terms of improving oil reserve exploitation and satisfying oil demand and economic growth. However, the early breakthrough of the in situ combustion front and the significant amount of heat loss associated with steam injection for deeper reservoir applications are the main challenges that require urgent solutions. Further data collection related to the effects of a reservoir’s physical and chemical properties, temperature, and pressure on in situ combustion front propagation and steam injection heat transfer inefficiency would be needed to achieve better reservoir oil recovery. Most studies have focused on the application of catalytic systems and the investigation of minerals’ effects on combustion front stabilization; however, the effect of clay interlayers’ minerals on the performance of in situ combustion is still poorly understood. This paper takes a new look at the role played by the interlayers’ minerals in stabilizing the combustion front using X-ray diffraction (XRD), thermogravimetry (TG), differential scanning calorimetry (DSC) combined with nuclear magnetic resonance (NMR), and combustion tube experiments. The studied samples’ compositions were analyzed by XRD, TG/DSC, and NMR techniques. Meanwhile, the effects of interlayers’ minerals on oil production were screened by combustion tube experiments. The data obtained from this study suggest that clay dispersion within a reservoir would improve oil recovery via in situ combustion, and our study led us to obtain an 80.5% recovery factor. However, the experiments of models with clay interlayers showed less recovery factors, and the model with interlayers led to a 0% recovery factor in the presence of air injection. Meanwhile, the same model in hydrothermal and air injection conditions led to a 13.9% recovery factor. This was due to the hydrothermal effect improving permeability and pore enlargement, which allowed the transfer of heat and matter. Moreover, our study found that clay minerals exhibit excellent catalytic effects on the formation of fuel deposition and the coke oxidation process. This effect was reflected in the significant role played by clay minerals in decreasing the number of heteroatoms by breaking down the C-S, C-N, and C-O bonds and by stimulating the processes of hydrocarbon polymerization during the in situ combustion. Our results add to a growing body of literature related to in situ combustion challenges and underline the importance of a reservoir’s physical parameters in the successful application of in situ combustion.

1. Introduction

Presently, the shortage of conventional hydrocarbons is among the most widely discussed topics. It is well-known that unconventional hydrocarbons are set to become a vital factor in developing industries in future generations. For many years, these resources have been neglected and poorly studied [1,2,3]. Traditionally, they included heavy and extra-heavy oil, shale oil, and bitumen. Heavy oil is one of the major sources of hydrocarbons on the planet. According to world energy resources, global deposits of heavy oil are estimated to be in the range of 210 billion barrels of unproven reserves and 299 billion barrels of original reserves [4,5,6]. Therefore, heavy oil is likely to become an important component in the energy sector within the next few years. Nevertheless, a striking feature of this type of reserve is the lack of effective technologies for their extraction.
Unconventional oil reserves are currently developed and exploited using enhanced oil recovery methods (EOR). These methods are classified into three main types: chemical [7,8,9], physical [10], and thermal [11,12]. Basically, chemical EOR methods are based on injecting chemicals into the reservoir to decrease the viscosity by weakening the interfacial energy between the water and oil phases. On the other hand, physical EOR methods are based on the application of electromagnetic heating into a reservoir to break down the high-molecular-weight compounds of heavy oil and therefore decrease the viscosity and provide more liquid hydrocarbons. Thermal EOR methods are based on applying additional heat to the hydrocarbon content in situ in the reservoir, whether by applying steam or the combustion of a part of the contained oil within the formation.
In situ combustion is widely believed to be the most promising and efficient method for enhancing heavy oil recovery [13,14]. In fact, it is based on burning a part of the oil in place in order to generate additional heat in situ to decrease the oil viscosity and increase its mobility as a result of the combustion front propagation throughout the reservoir. Regardless of the importance and uniqueness of the suggested idea, there is still a deep ambiguity toward the success of the present technology due to the lack of successful projects using this technique around the world, apart from the projects located in Louisiana [15] and Romania [16]. In fact, it has been found that the instability of combustion front propagation is the main reason for the failure of most projects involving the application of in situ combustion [17,18].
One of the promising methods to stabilize a combustion front is the use of different catalysts of transition metals. In their works [19,20,21], Khelkhal et al. have demonstrated the positive effect that can be generated from the use of copper-, iron-, nickel-, and cobalt-based catalysts on combustion front stabilization, where these metals have shown lower activation energy compared to the noncatalytic combustion process of heavy oil. Moreover, Galukhin et al. [22,23,24,25] studied the effects of different manganese-based catalysts and found a similar positive effect on the combustion behavior of heavy oil. Other similar works [26,27,28,29] have demonstrated a higher efficiency from the use of copper-based catalysts in reducing the in situ combustion ignition temperature and the H/C ratio in addition to increasing oil recovery.
A key problem with much of the literature on catalyst application during in situ combustion is that most catalysts obtained at the laboratory scale do not seem to be applicable in real reservoir conditions due to heat or matter transfer issues associated with different formations’ geologies or due to the lack of sufficient technologies that would allow the dispersion of these materials in deeper reservoirs. It can thus be reasonably assumed that studying real samples from a formation would sufficiently lead us to control the application of in situ combustion in a specific reservoir. It is common knowledge that clay and formation permeability play important roles in stabilizing a combustion front and provide sufficient conditions for combustion front propagation [30,31,32]. Vossoughi et al. [33] found that rock’s clay minerals accelerate oxidation reactions during heavy oil in situ combustion by reducing the energy of activation of the occurring reactions. Li et al. [34] have performed experiments on the isothermal oxidation and pyrolysis of heavy oil in the presence of various clay minerals. The results obtained from their study have shown that montmorillonite and kaolinite improve heavy oil in situ combustion by increasing the proportion of oil mobility compared to similar experiments in their absence. At the same time, illite, contrary to montmorillonite and kaolinite, has been found to inhibit the oxidation reaction of in situ combustion, where it has decreased oil mobility compared to similar experiments in its absence [35].
Another important factor that would generate a considerable interest in terms of investigation is the interlayer clay minerals’ role in the combustion front propagation pattern. Kozlovsky et al. [36] have studied the catalytic effect of clay on the performance of in situ combustion by testing the combustion behavior of different crude oils with different mineral contents in six one-dimensional combustion tube experiments. The obtained results have shown that the combustion behavior mainly depends on the type of oil and the types of the minerals contained in the rock samples. It was also shown that clay controls the combustion front propagation, the fuel formation, and the produced oil quality.
The present study provides more data about the effect of clay’s minerals on the process of heavy oil oxidation in the presence of different rock samples with different properties and clay contents.

2. Materials and Methods

2.1. Materials

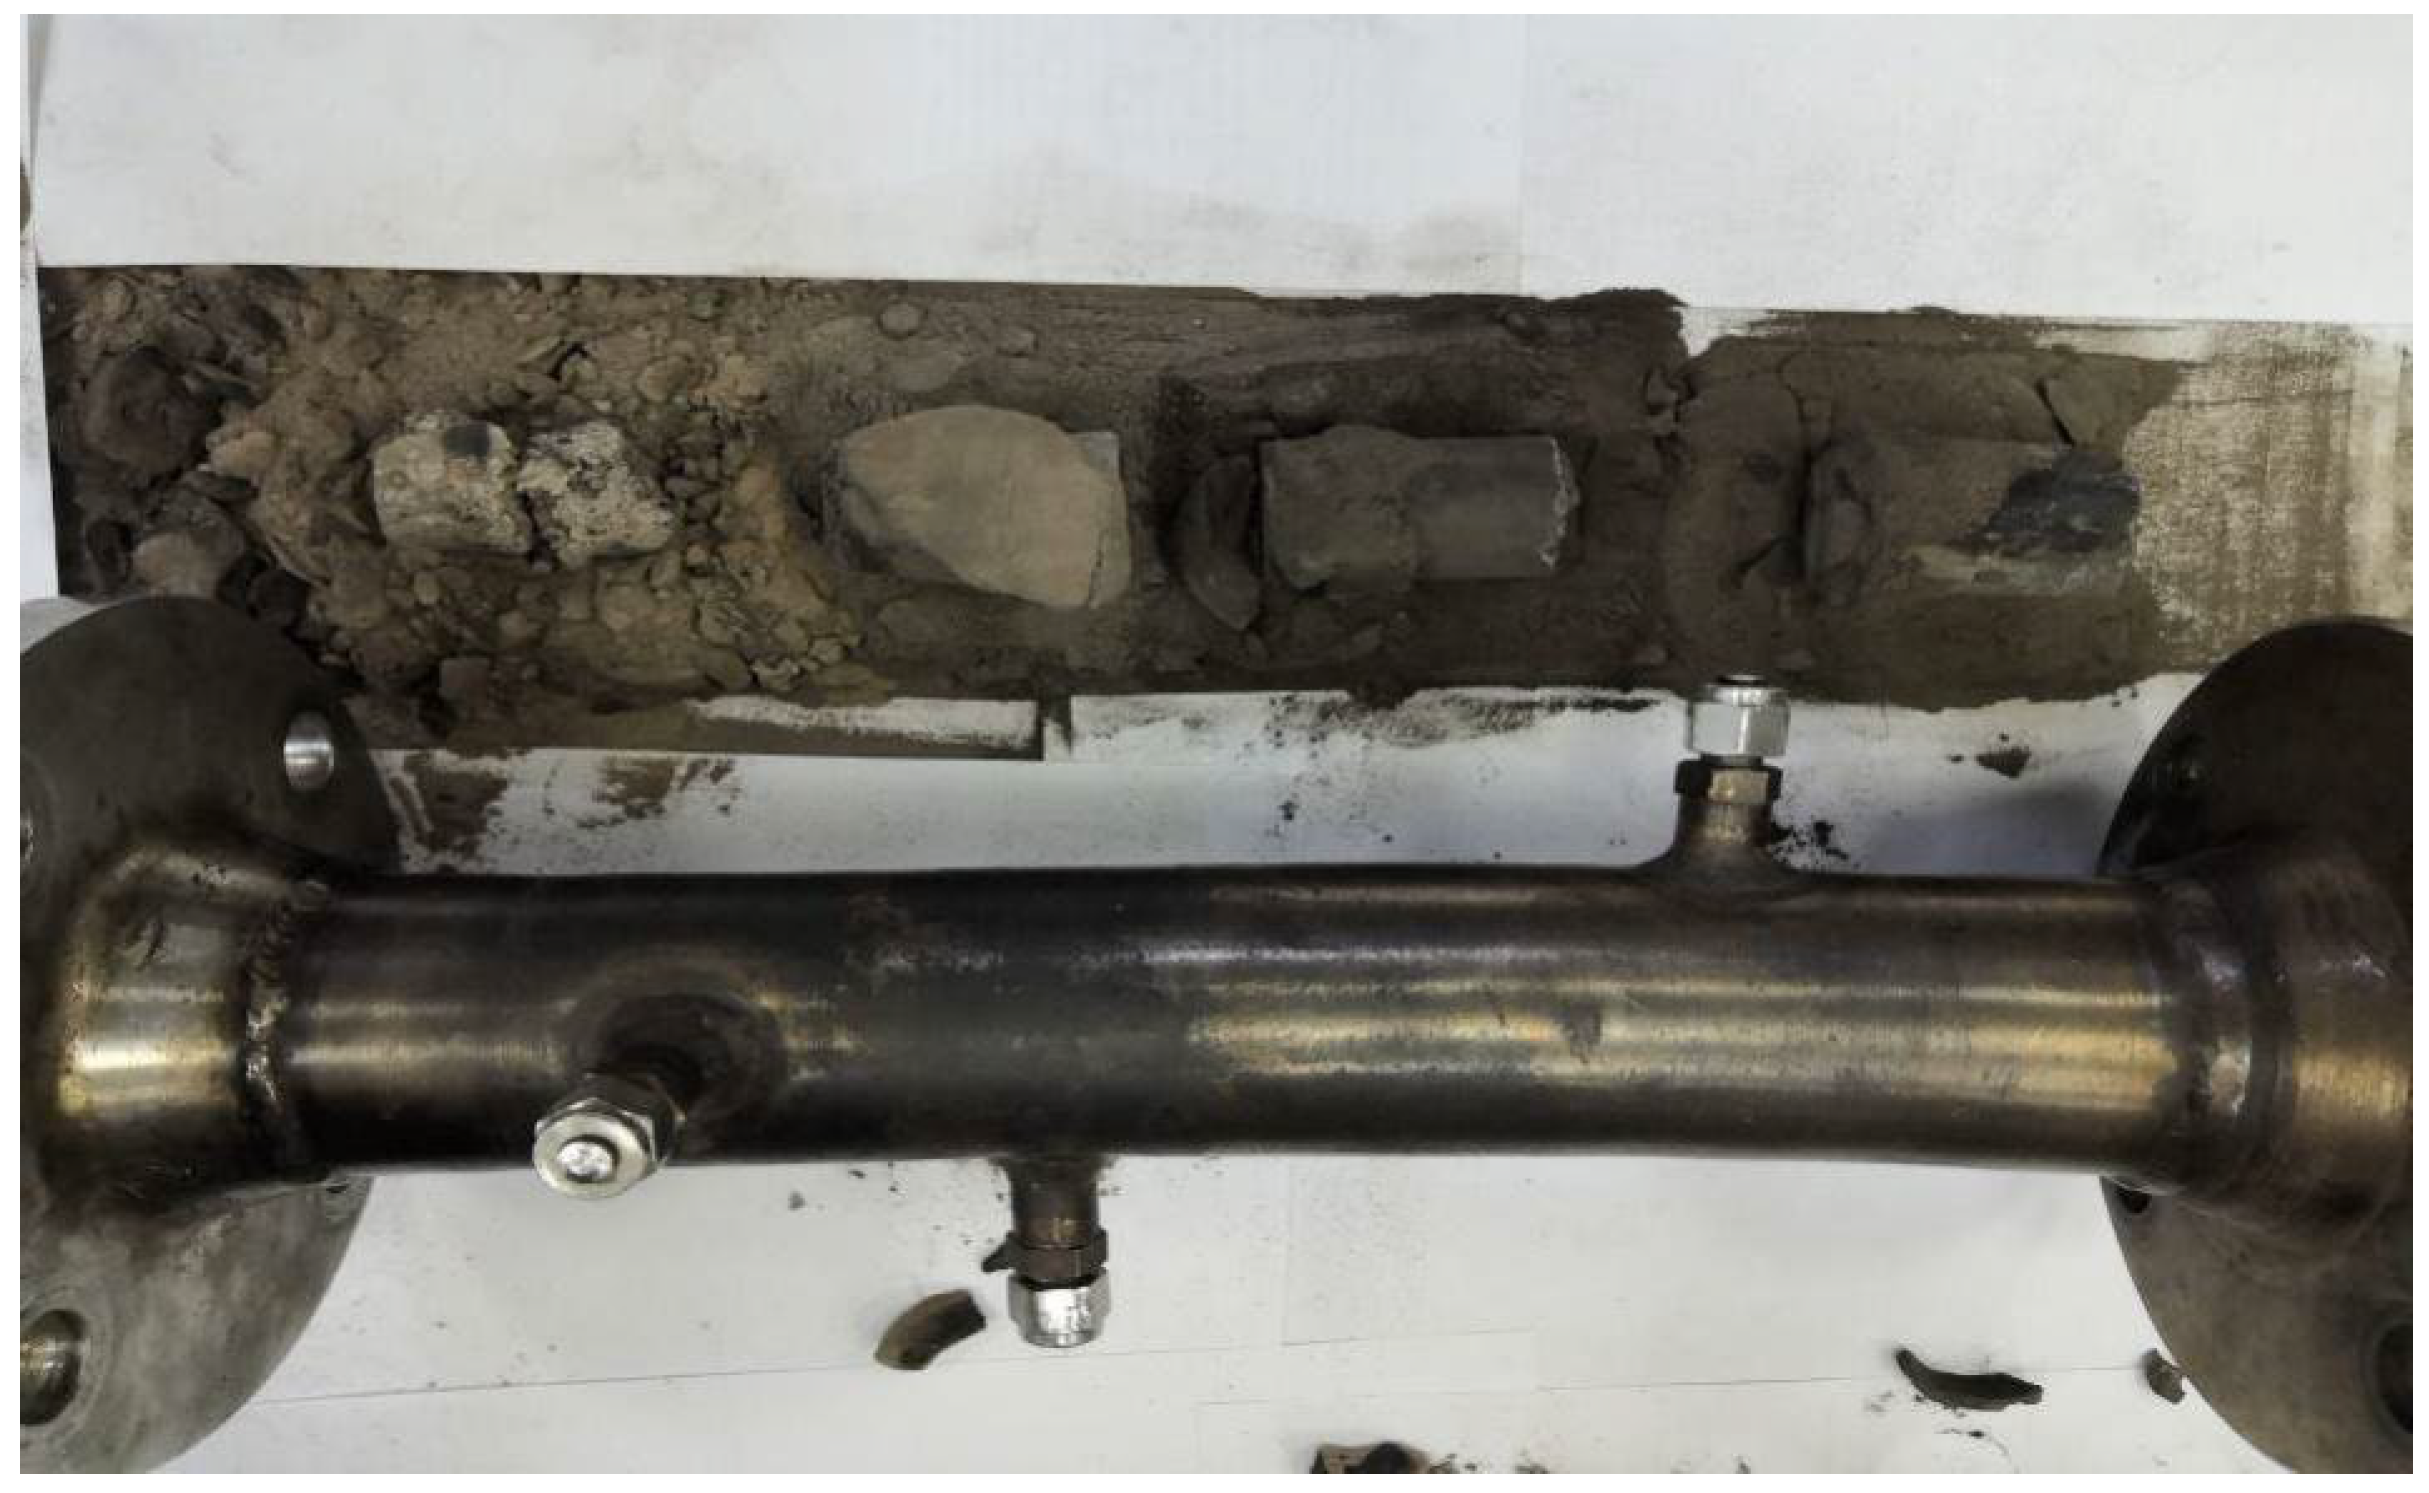
In order to perform our study, natural oil-saturated rocks (Figure 1) obtained from depths of 413–417 m were selected. These samples are indicated as 1 (413), 2 (415), and 3 (417).
The samples’ mineral contents were characterized by XRD (Table 1), and the contents of organic matter in the samples before and after the combustion tube experiments were identified by means of NMR and thermogravimetric analysis (TG). The obtained XRD data are presented in Table 1.

2.2. NMR Analysis of the Initial Oil-Saturated Samples

A Proton 20 M NMR analyzer (JSC SDO Chromatec, Yoshkar-Ola, Russia) with a 1H NMR frequency of 20 MHz was used to determine the organic matter contents in the initial oil-saturated samples based on the T2 relaxation curves of the rock samples. The samples were dried in advance to remove residual moisture at T = 60 °C for 12 h. Then, the samples were placed in 10 mm glass ampoules sealed with rubber stoppers. The samples were thermally stabilized in a thermostat for at least 15 min at (40 ± 0.2) °C and then placed in the NMR sensor. The free induction decay (FID) data were obtained after 10 μs of minimum dead time. The data processing was performed at 1 μs (dwell time) between the measured points (receiver bandwidth of 1 MHz) until a total acquisition time of 6 ms.
After that, we used 225 signal accumulations with a repetition period of 2 s. The accurate quantitative estimates in sample reduction changes were obtained by means of mathematical processing, which was carried out according to a specially created multistage adjustment program based on model functions using the Solver Excel software package, according to the recommendations described in [37,38]. The NMR relaxation allowed us to assess the initial oil saturation in the rock samples (Table 2).

2.3. Thermal Analysis of the Initial Oil-Saturated Samples

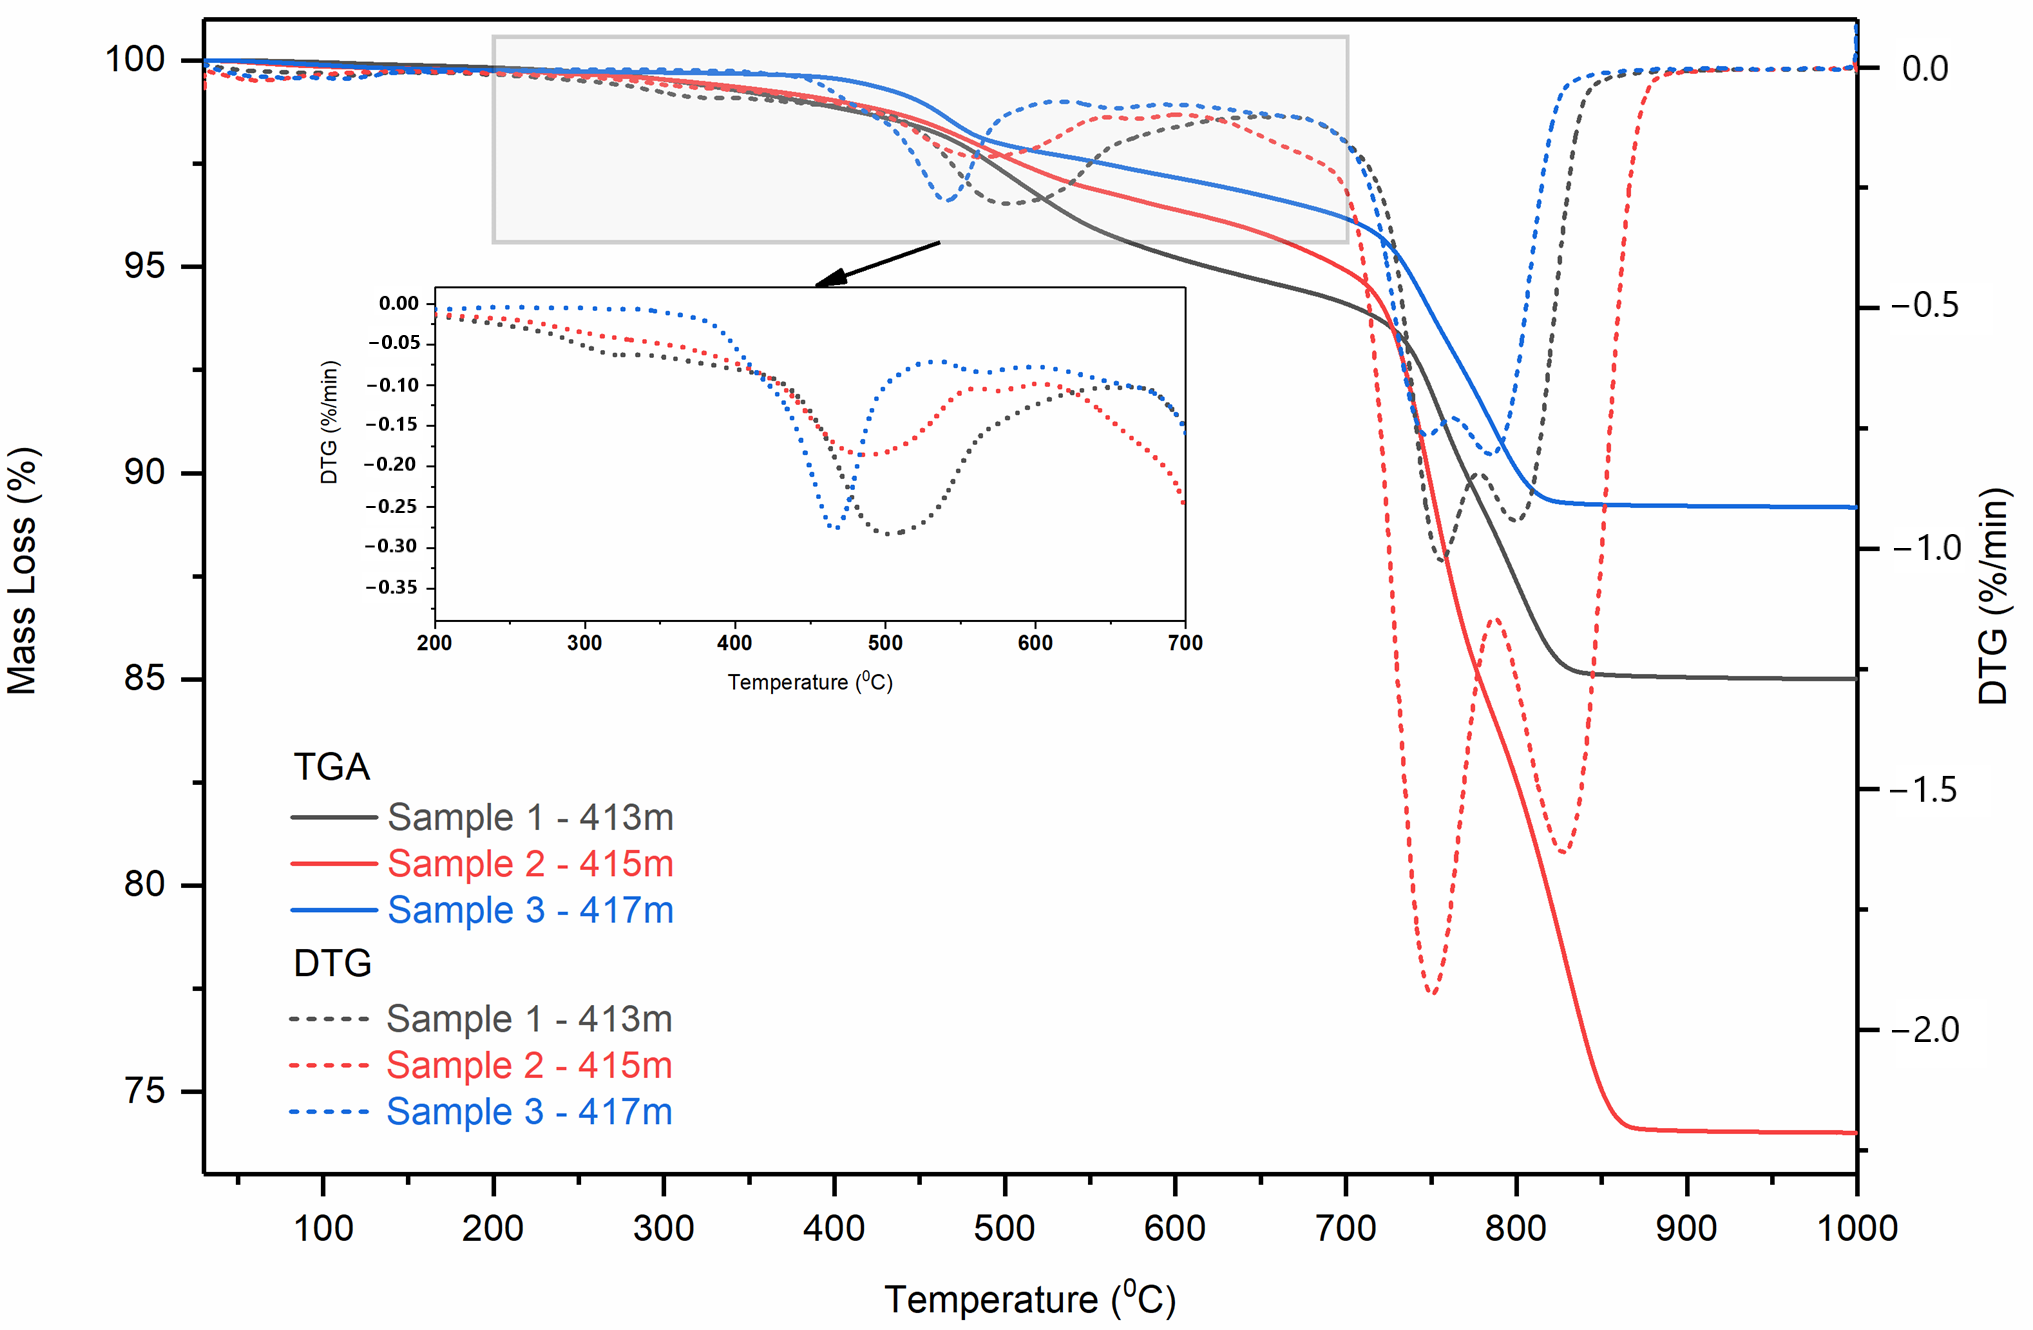
In order to obtain accurate data about the contents of organic matter in the studied samples, we applied a thermal analysis technique (TG/DSC). The experiments were carried out in a dynamic air–nitrogen medium at a linear heating rate of 10 °C/min from room temperature to 900 °C in corundum crucibles with an 85 μL internal volume. The device was preheated for one week to achieve a stable signal of mass and temperature curves. The temperature of the circulation thermostat connected to the device was 25 °C. The gases used in the experiments possessed a high degree of purity (99%), which is an important criterion for a successful experiment. For additional cleaning, a replaceable system of low-pressure filters (up to 10 bar) was used. Figure 2 shows the obtained TG and DTG curves of the combustion of the studied samples.
It is common knowledge that the process of heavy oil oxidation occurs through two main regions: low-temperature oxidation (LTO) and high-temperature oxidation (HTO) regions [39]. The obtained thermogravimetric curves show a gradual behavior of mass loss. In fact, it can be seen from Figure 2 that LTO occurred in the range of 200–400 °C. Meanwhile, HTO occurred in the range of 400–600 °C. It is worth noting that during low-temperature oxidation light fractions evaporate at the beginning of the oxygen–oil component reaction, followed by the formation of oxygenated compounds such as hydroperoxides, ketones, aldehydes, etc. From the curves above, we can see that sample 3 contained the lowest amount of light hydrocarbons because it showed the lowest mass loss compared to samples 1 and 2. Moreover, the highest mass loss in the HTO was found for sample 1, followed by samples 2 and 3, respectively, which indicates that the fuel deposit during the LTO was greater for the first sample. The content of the fuel deposit in sample 2 was less than that of sample 1 but greater than the content of the fuel deposit resulting from the oxidation of sample 3. These results (Table 3) are in good agreement with the NMR data, which showed almost the same tendency toward the total organic matter in the studied samples. In fact, the differences in the obtained values were mainly due to the types of experiments, where NMR studies considered the entire surface of the obtained rock samples, while the TG analysis investigated well-crushed samples with homogeneous dispersions of organic matter.

Differential Scanning Calorimetric Analysis of the Initial Oil-Saturated Samples

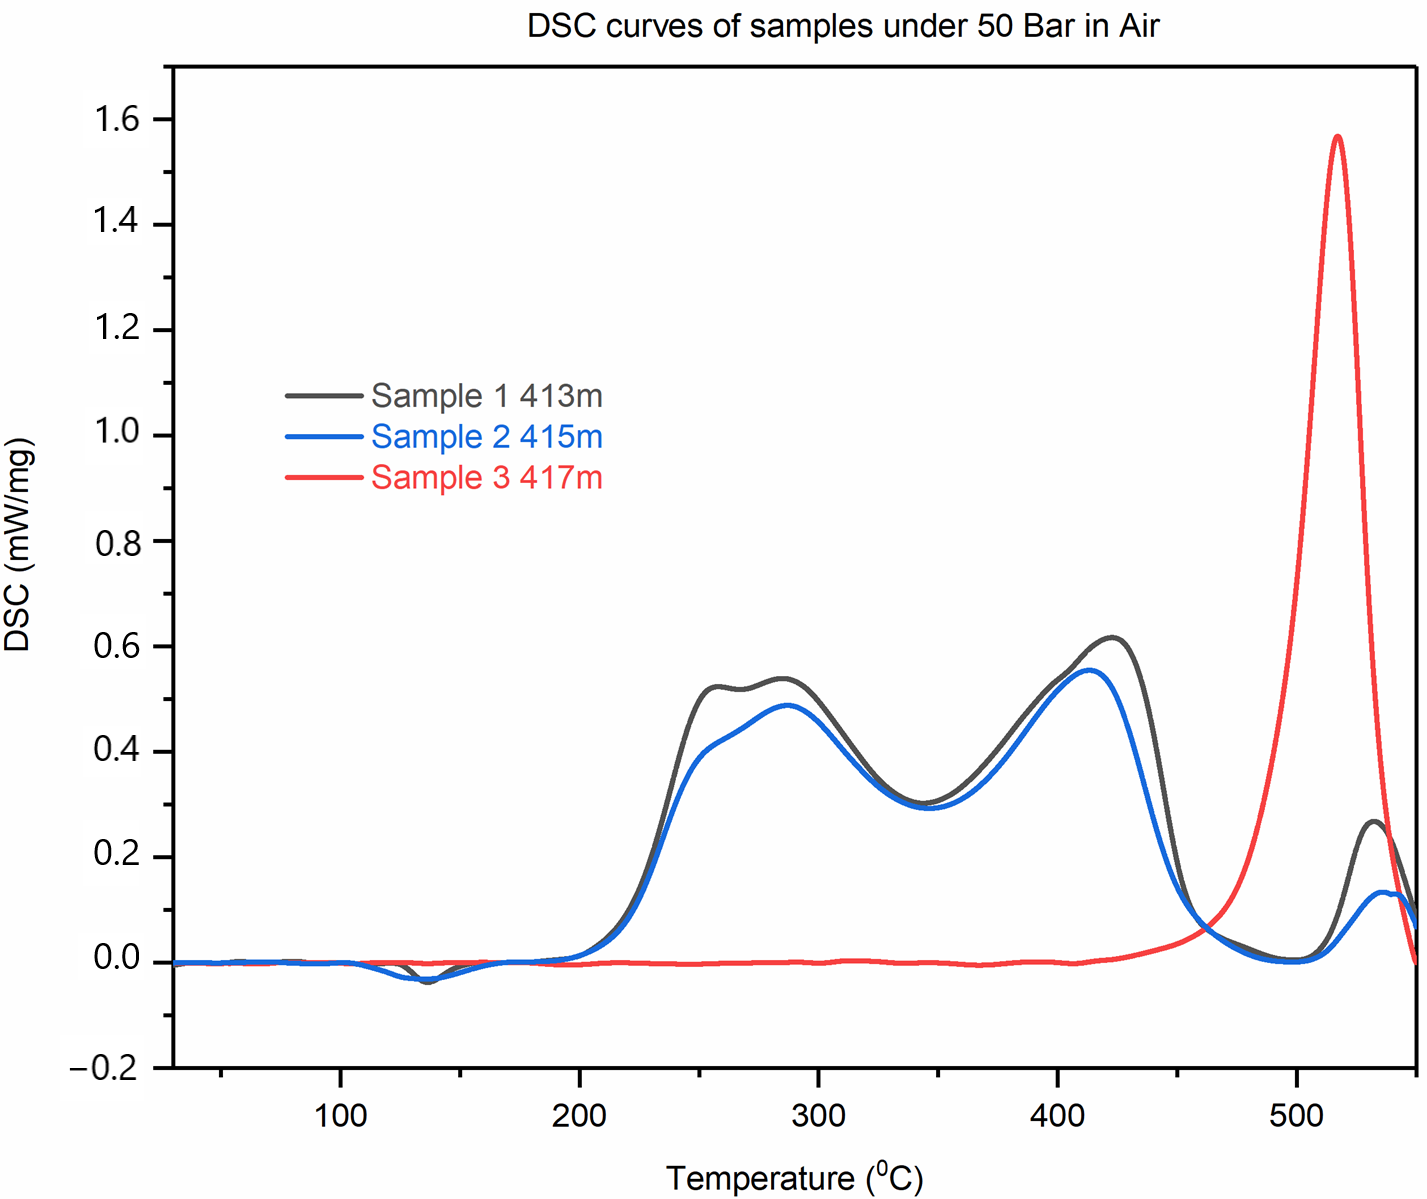
High-pressure differential scanning calorimetry (HPDSC) was applied to estimate the parameters of in situ combustion that should be taken into consideration during the displacement experiments in the combustion tube. The results obtained from the HPDSC are presented in Figure 3.
In an attempt to predict the parameters of the combustion experiments, we applied differential scanning calorimetry. This technique allowed us to detect the heat change during the process at any time and temperature. The obtained DSC curves showed three main peaks that referred to LTO at 200–350 °C, HTO at 350–500 °C, and coke combustion at 500–600 °C due to the presence of a significant amount of organic matter in these samples. However, the third sample showed one exothermic peak at around 500 °C that was associated with the combustion of the coke adsorbed on the rock sample.
Taking advantage of the data obtained from HPDSC, we were able to predict the process initiation for the first and second samples, which was found at around 220 °C, as shown by the onset of the combustion process for the first and second sample. The data also show a plateau in the significant exothermic effect at 600 °C, which may explain the presence of a stable combustion front in this temperature range. However, the third sample was found to start burning at around 430 °C, as shown by the onset of the combustion process, with an exothermic peak at 500 °C associated with the small quantity of organic compounds in the sample. This can be explained by the low heat transfer in this sample during the combustion process and by the contents of only heavy fractions. In other words, the organic matter in this sample was likely represented by heavy components, resins, and asphaltenes, which are not particularly involved in the LTO reactions but mainly manifest themselves at the HTO stage. The design of the combustion tube experiments in the present study was based mainly on the data obtained from HPDSC and TG.

2.4. Combustion Tube Experiments

It is well-known that in situ combustion in a reservoir mainly depends on the physical characteristics of the developed formation. The behaviors of the combustion and the propagation of an in situ combustion front are mainly affected by the homogeneity of the clay minerals in the reservoir and the presence of clay interlayers between the combustion zones. In addition, combustion front propagation is mostly unpredictable, and the influence of clays manifests in different ways. Therefore, we prepared three models from the selected samples to assess the success of in situ combustion in reservoir conditions. In fact, all the models were composed of four standard core samples with 3 cm widths and 5 cm lengths (Figure 4 and Figure 5) that were taken from reservoir depths of 413 and 415 m, respectively. The core samples were compacted with a 0.1 mm interlayer and had an oil saturation of 2.12% for the first combustion tube experiment, which was considered to be the control experiment (Figure 1). However, the same model as in control experiment 1 (ISC-1) with some modifications was used for experiments 2 and 3 (ISC-2 and -3). In other words, the first model was separated by two layers of unsaturated clays taken from sample 3, which was obtained from a reservoir depth of 417 m. The widths of layers «clay 1» and «clay 2» were 1 and 2 cm, respectively (Figure 5).
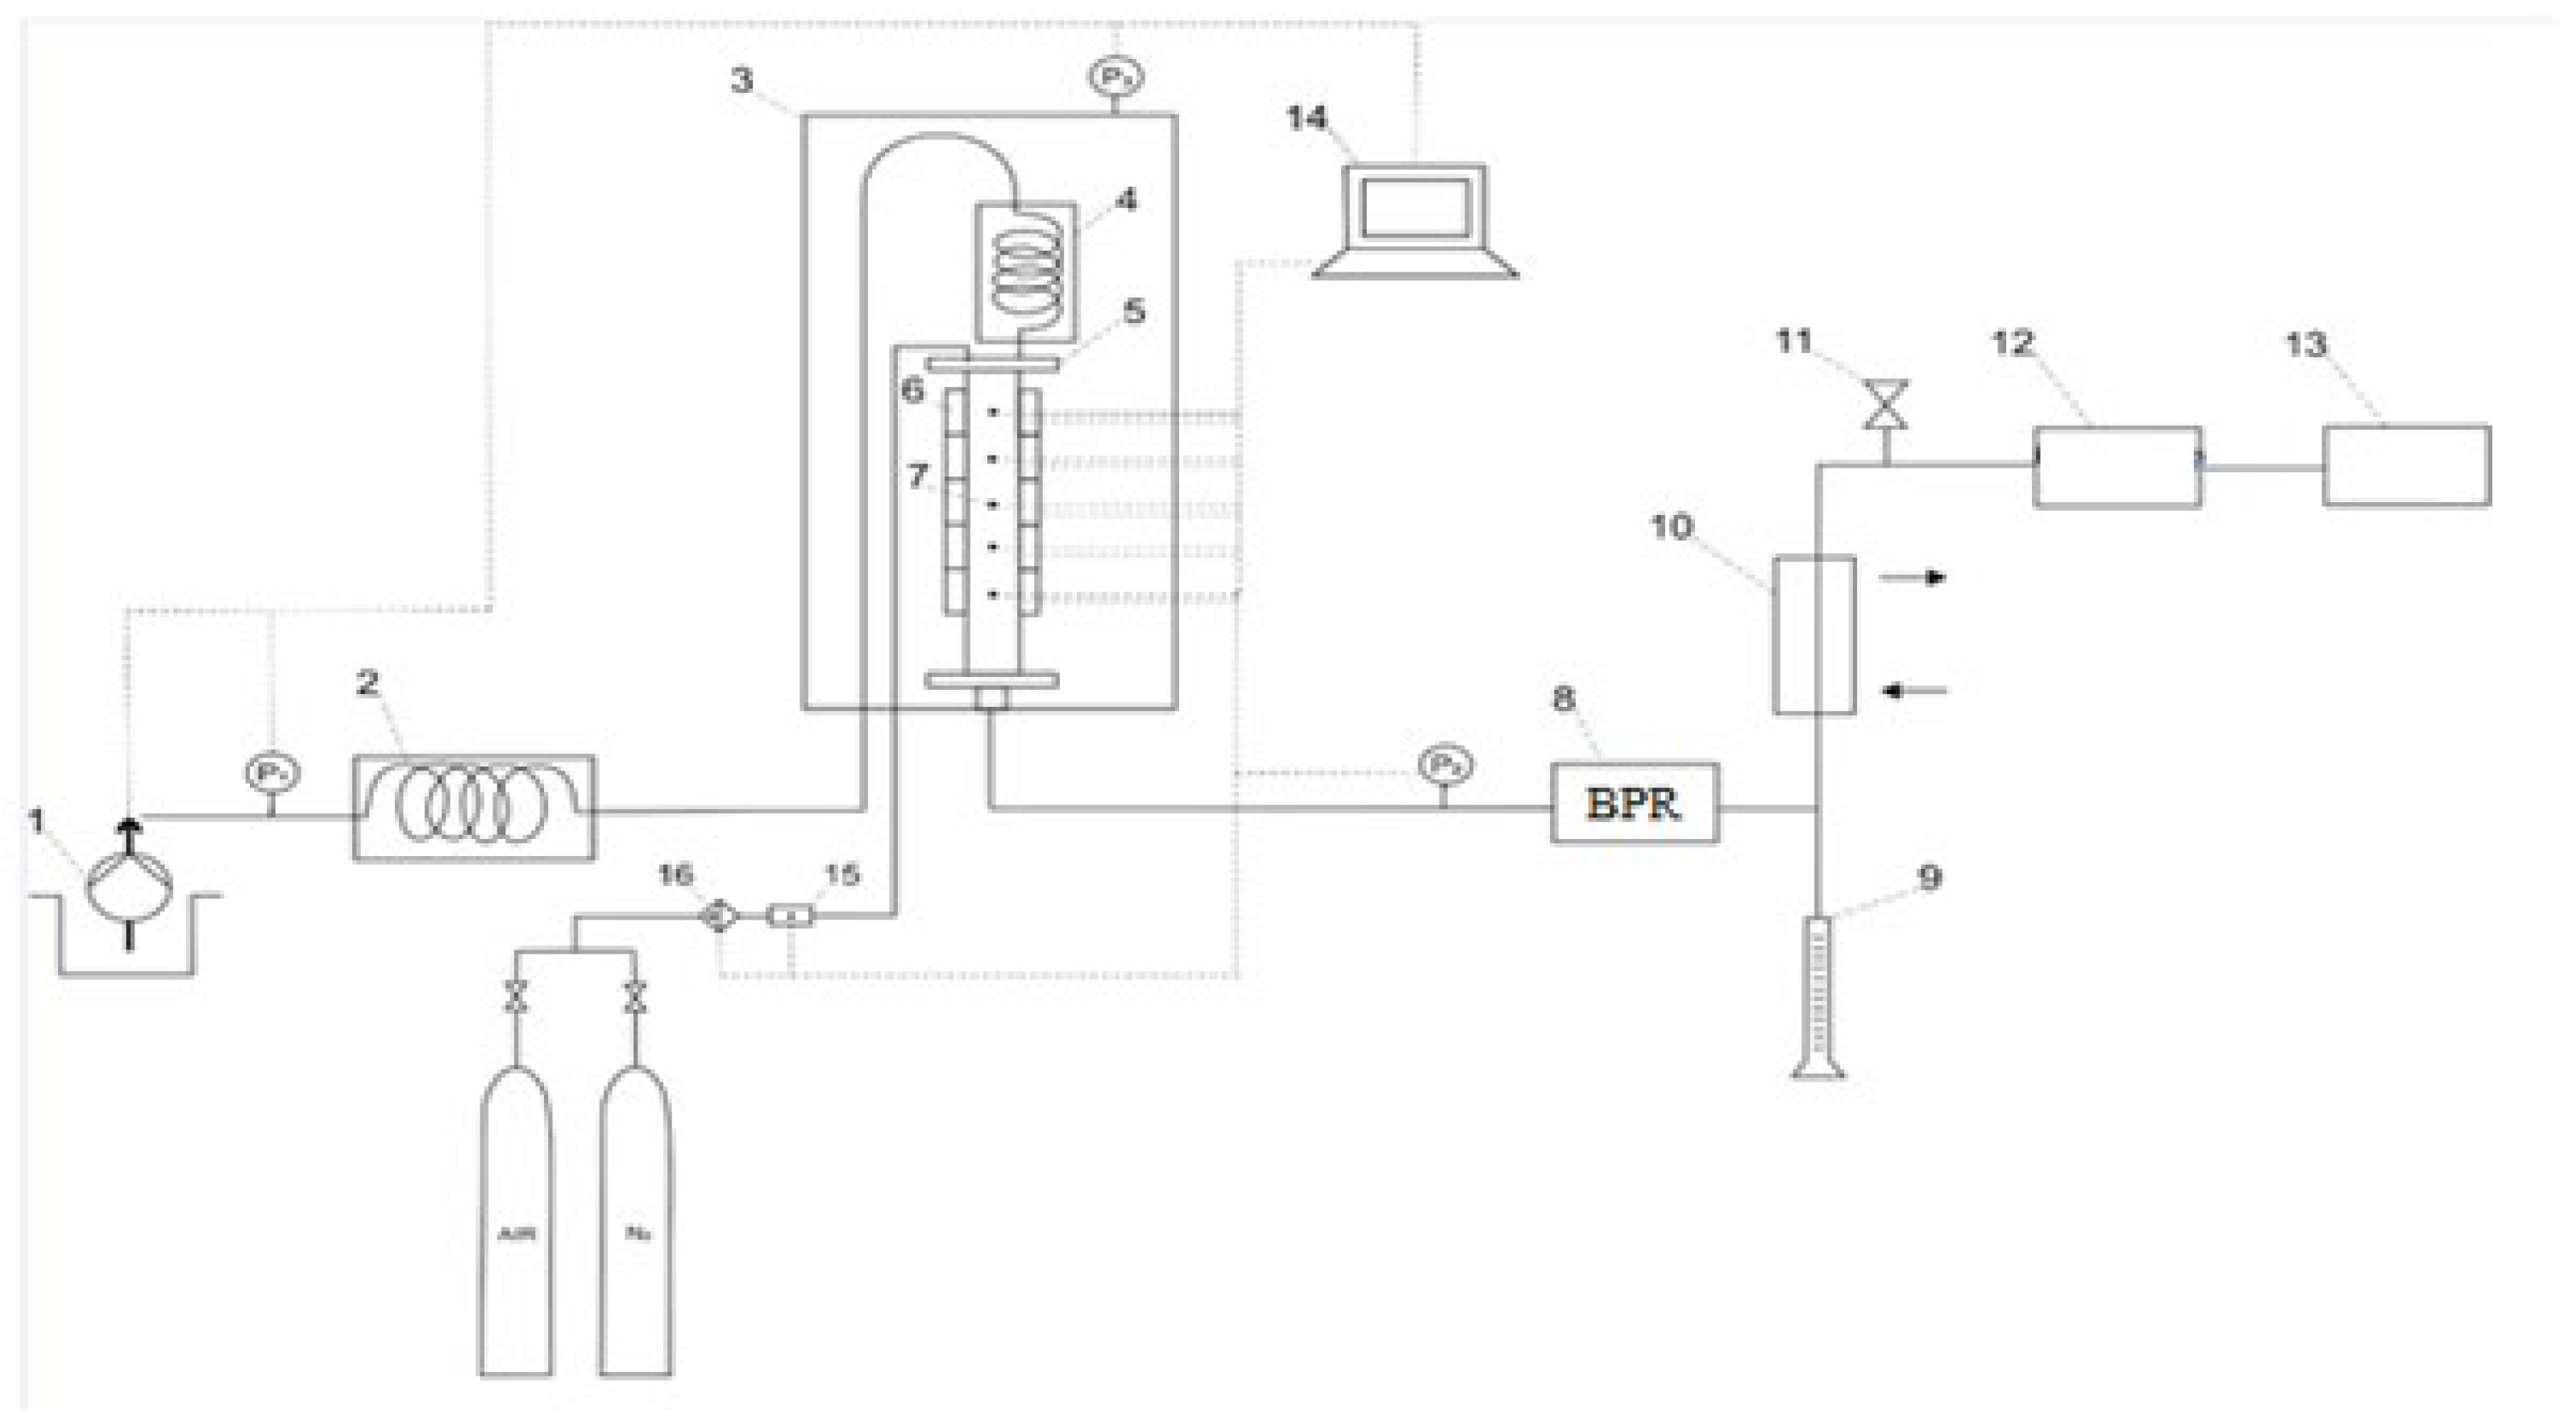
All the combustion tube experiments were performed in the in situ combustion and SAGD physicochemical self-designed installation (Figure 6) by taking into consideration the recommendations provided in [26,40,41] at a pressure of 4 MPa created by nitrogen injection.
The experiments were carried out in a combustion tube with a 30 cm length and a 5 cm internal diameter (Figure 4 and Figure 5). The composite model was packed in a core holder. The first thermocouple was located directly at the input of the core holder, and each subsequent thermocouple was in front of the core samples.
The combustion tube was installed in a horizontal position to reduce the gravitational drainage effect. Nitrogen pressure was created up to the required working pressure and checked for leaks. The gas analyzer continuously monitored the composition of the effluent gases, and the displaced liquids were collected in the separating burette.
The prepared models were investigated by different injection schemes in order to establish the clay minerals’ effects on the process of in situ combustion. In the first two experiments, with model 1 and model 2, we heated up the initial zone (Figure 4) to 200 °C using electric heating elements, after which air was supplied to the models. However, ISC-3 aimed to investigate the effects of hydrothermal conditions on the efficiency of in situ combustion in reservoirs with clay interlayers. Therefore, a steam was preliminarily pumped to the tube in order to preheat the core model and to create a hydrodynamic conductivity, and the air injection was continued similar to the first two experiments. In all experiments, the temperature, pressure, and effluent gas amount over time were recorded. The input parameters and descriptions of all the experiments in the combustion tube are presented in Table 4 and Table 5.

3. Results and Discussion

3.1. In Situ Combustion Test for Standard Core Model (ISC-1)

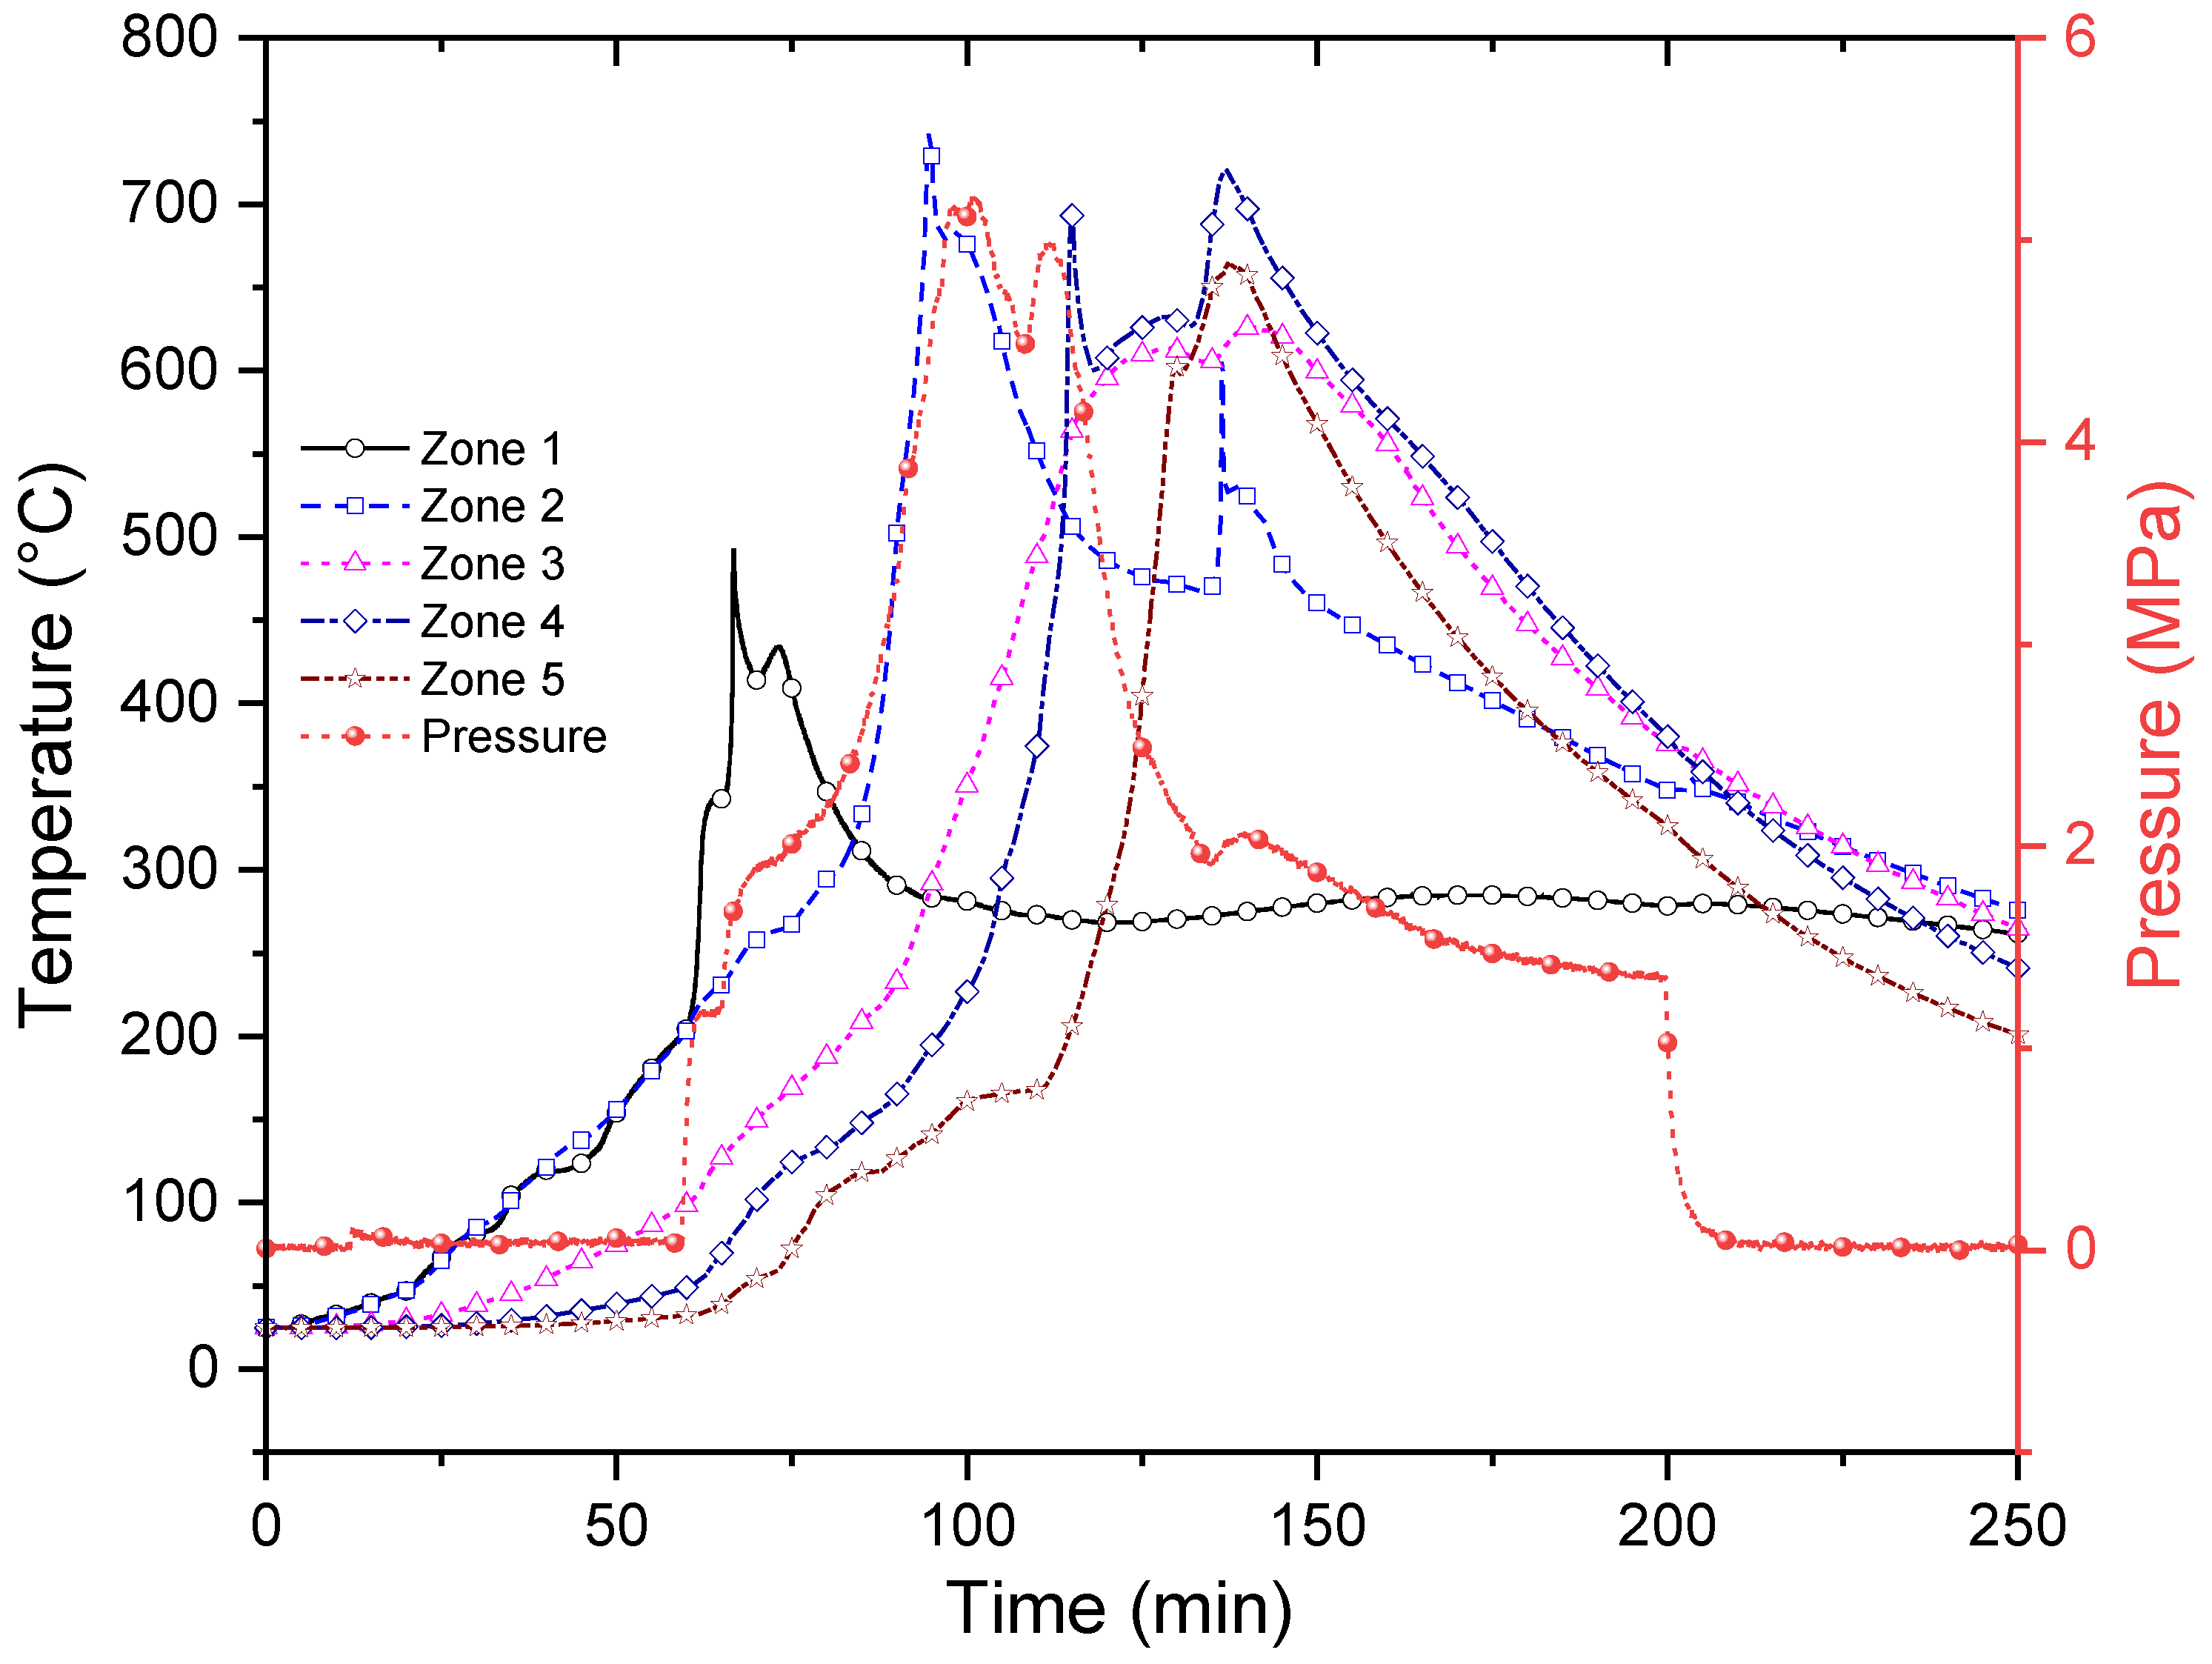
In this experiment, a core model with a uniform distribution of clay minerals was heated to 200 °C by an electrical heater in the first zone of a core holder, and after that the air was pumped at a constant rate of 2.5 L/min. The temperature–pressure profile and the effluent gas evolution throughout the experiment are presented in Figure 7 and Figure 8, respectively.
As can be seen from Figure 7, the standard core model combustion highlighted a maximum temperature value for each zone in an alternative way. This indicated stable movement of the combustion front. On the other hand, it showed that the standard core model combustion reached a maximum temperature of 740 °C. The obtained data indicated an increase in pressure during air supply, followed by a significant decrease (5.2 MPa) at the end of the experiment. This was associated with fuel deposition at the end of the low-temperature oxidation region. In other words, the fuel deposit burned during HTO and stabilized the combustion front, leading to pressure decreasing at this stage.
The effluent gas evolution (Figure 8) during the standard core model combustion (ISC-1) indicated more than 15% CO2 content, with a maximum value of 20.5% in the exhaust gas mixture, which indicated stable combustion front behavior. Moreover, the maximum temperature peak (700 °C) indicated in Figure 8 was related to the release of methane gas from oil. In addition, the proportion of effluent gases was found to increase naturally with the oxygen reduction in the effluent gas composition, as shown in Figure 8.
The homogeneous and accurate behavior of combustion front propagation during the process of standard core model combustion was clearly observed in the alternative combustion, which first occurs in zone 1, then in zone 2, followed by other zones every 50, min almost as indicated by combustion peaks. This was illustrated by the total damage to the used core model, as shown in Figure 9.
The effluent gas composition curves show a considerable release of CO2, contrary to CH4, which was found in nonsignificant amounts and decreased with time. Moreover, the obtained results show opposite behavior between CO2 and O2 consumption as a result of uniform combustion front propagation. In addition, by considering the model’s mass and the content of organic matter obtained by low-field NMR relaxation, we were able to assess the oil displacement coefficient for the standard core model combustion, which was found to be equal to 80.5% (Table 6).
An SARA analysis of the original oil and the produced oil after the standard core model combustion (ISC-1) is presented in Table 7.
The obtained oil composition from the standard core model combustion with homogeneous clay dispersion showed a decrease in asphaltenes from 16.07% to 10.76%, a decrease in resins from 13.51% to 11.53%, and a significant increase in saturates from 34.89% in the original oil to 50.79% in the produced oil. As a result, the viscosity of the produced oil was found to be much lower (0.324 Pa*s) than the viscosity of the initial oil (20,306 Pa*s) in the standard core model, which seems likely to increase the mobility of oil in a reservoir. The reason for such upgrading in the produced oil was mainly related to the combustion front at 450–500 °C, which resulted from exothermic reactions at 55 to 100 min, which were associated with a decrease in the amount of CH4 and an increase in the CO2 curves. In other words, the obtained solid coke burned at the combustion front zone and the associated light fractions, which moved forward ahead of the combustion front to the coking, and steam zones are the main factors upgrading the remaining crude oil. Another reason would seem to be the hydrogen production from the water–gas shift after the coking zone, which improved the quality of the produced oil by increasing the amount of saturated hydrocarbons because of the destruction of asphaltenes and resins (Table 7).

3.2. In Situ Combustion Test for Core Model with Clay Interlayers (ISC-2)

In this experiment, we selected a sample composed of a core model with a nonuniform distribution of clay minerals in addition to clay interlayers between the studied cores. The prepared sample was studied in the combustion tube installation. The first zone of the core holder was heated to 200 °C by an electrical heater and was then saturated with air at a constant flow rate (2.5 L/min). The obtained temperature–pressure profile and the effluent gas evolution throughout ISC-2 are presented in Figure 10 and Figure 11, respectively.
The temperature profile graph (Figure 10) of ISC-2 shows that the combustion process initiation occurred at the 185th minute as a result of the air supply to the studied model (active temperature increased in zone 2). On other hand, the obtained profile demonstrates an even development of the combustion front, as evidenced by the consistent temperature rise in the model zones. Contrary to ISC-1, the combustion front in this experiment was achieved at lower temperatures (430 °C). Moreover, the pressure increased significantly at the time of air supply, with a maximum of 4.3 MPa at temperature peaks. In addition, the temperature–pressure profile showed a gradual pressure change, which indicated poor permeability and unstable combustion front propagation. This was mainly related to fuel deposition and clay interlayers.
In addition, the effluent gas evolution highlighted a noticeable drop in the oxygen content at the output of the model and an increase in the CO2 content to 15–20% at the 185th minute, which indicated the beginning of the combustion process.
The combustion process was active for 100 min (from the 185th minute to the 285th minute). However, the oxygen content in the exhaust gases did not disappear, and the effluent gas volume was not significant, which is explained by the blockage of the combustion front and the disruption of the hydrodynamic conductivity between the oil-saturated zones in the model.
The data obtained from the ISC-2 effluent gas evolution showed a sharp decrease in CO2 concentration, contrary to ISC-1, when the temperature front reached zone 3. As far as we know, this was related to the low content of organic compounds. Nevertheless, the temperature dynamics profile showed combustion front breakthrough in zone 4, which was most likely associated with an increase in this zone by 1 cm compared to zone 3. Therefore, in order to stabilize and promote the front propagation through clay interlayers with low contents of organic matter, it is necessary that the combustion front transfers a sufficient amount of heat to zone 3, where the combustion reinitiates, and the same must happen for the layer between the third and fourth zones.
This is explained by the fact that the clay interlayers prevent the advance of the combustion front due to their lack of saturation with oil.
It is worth noting that we did not detect any oil yield during ISC-2, where the oil displacement coefficient was equal to 0%. This fact suggests that the layers of clays in the studied model prevented the advance and stabilization of the combustion front and thereby prohibited oil displacement within the reservoir model.
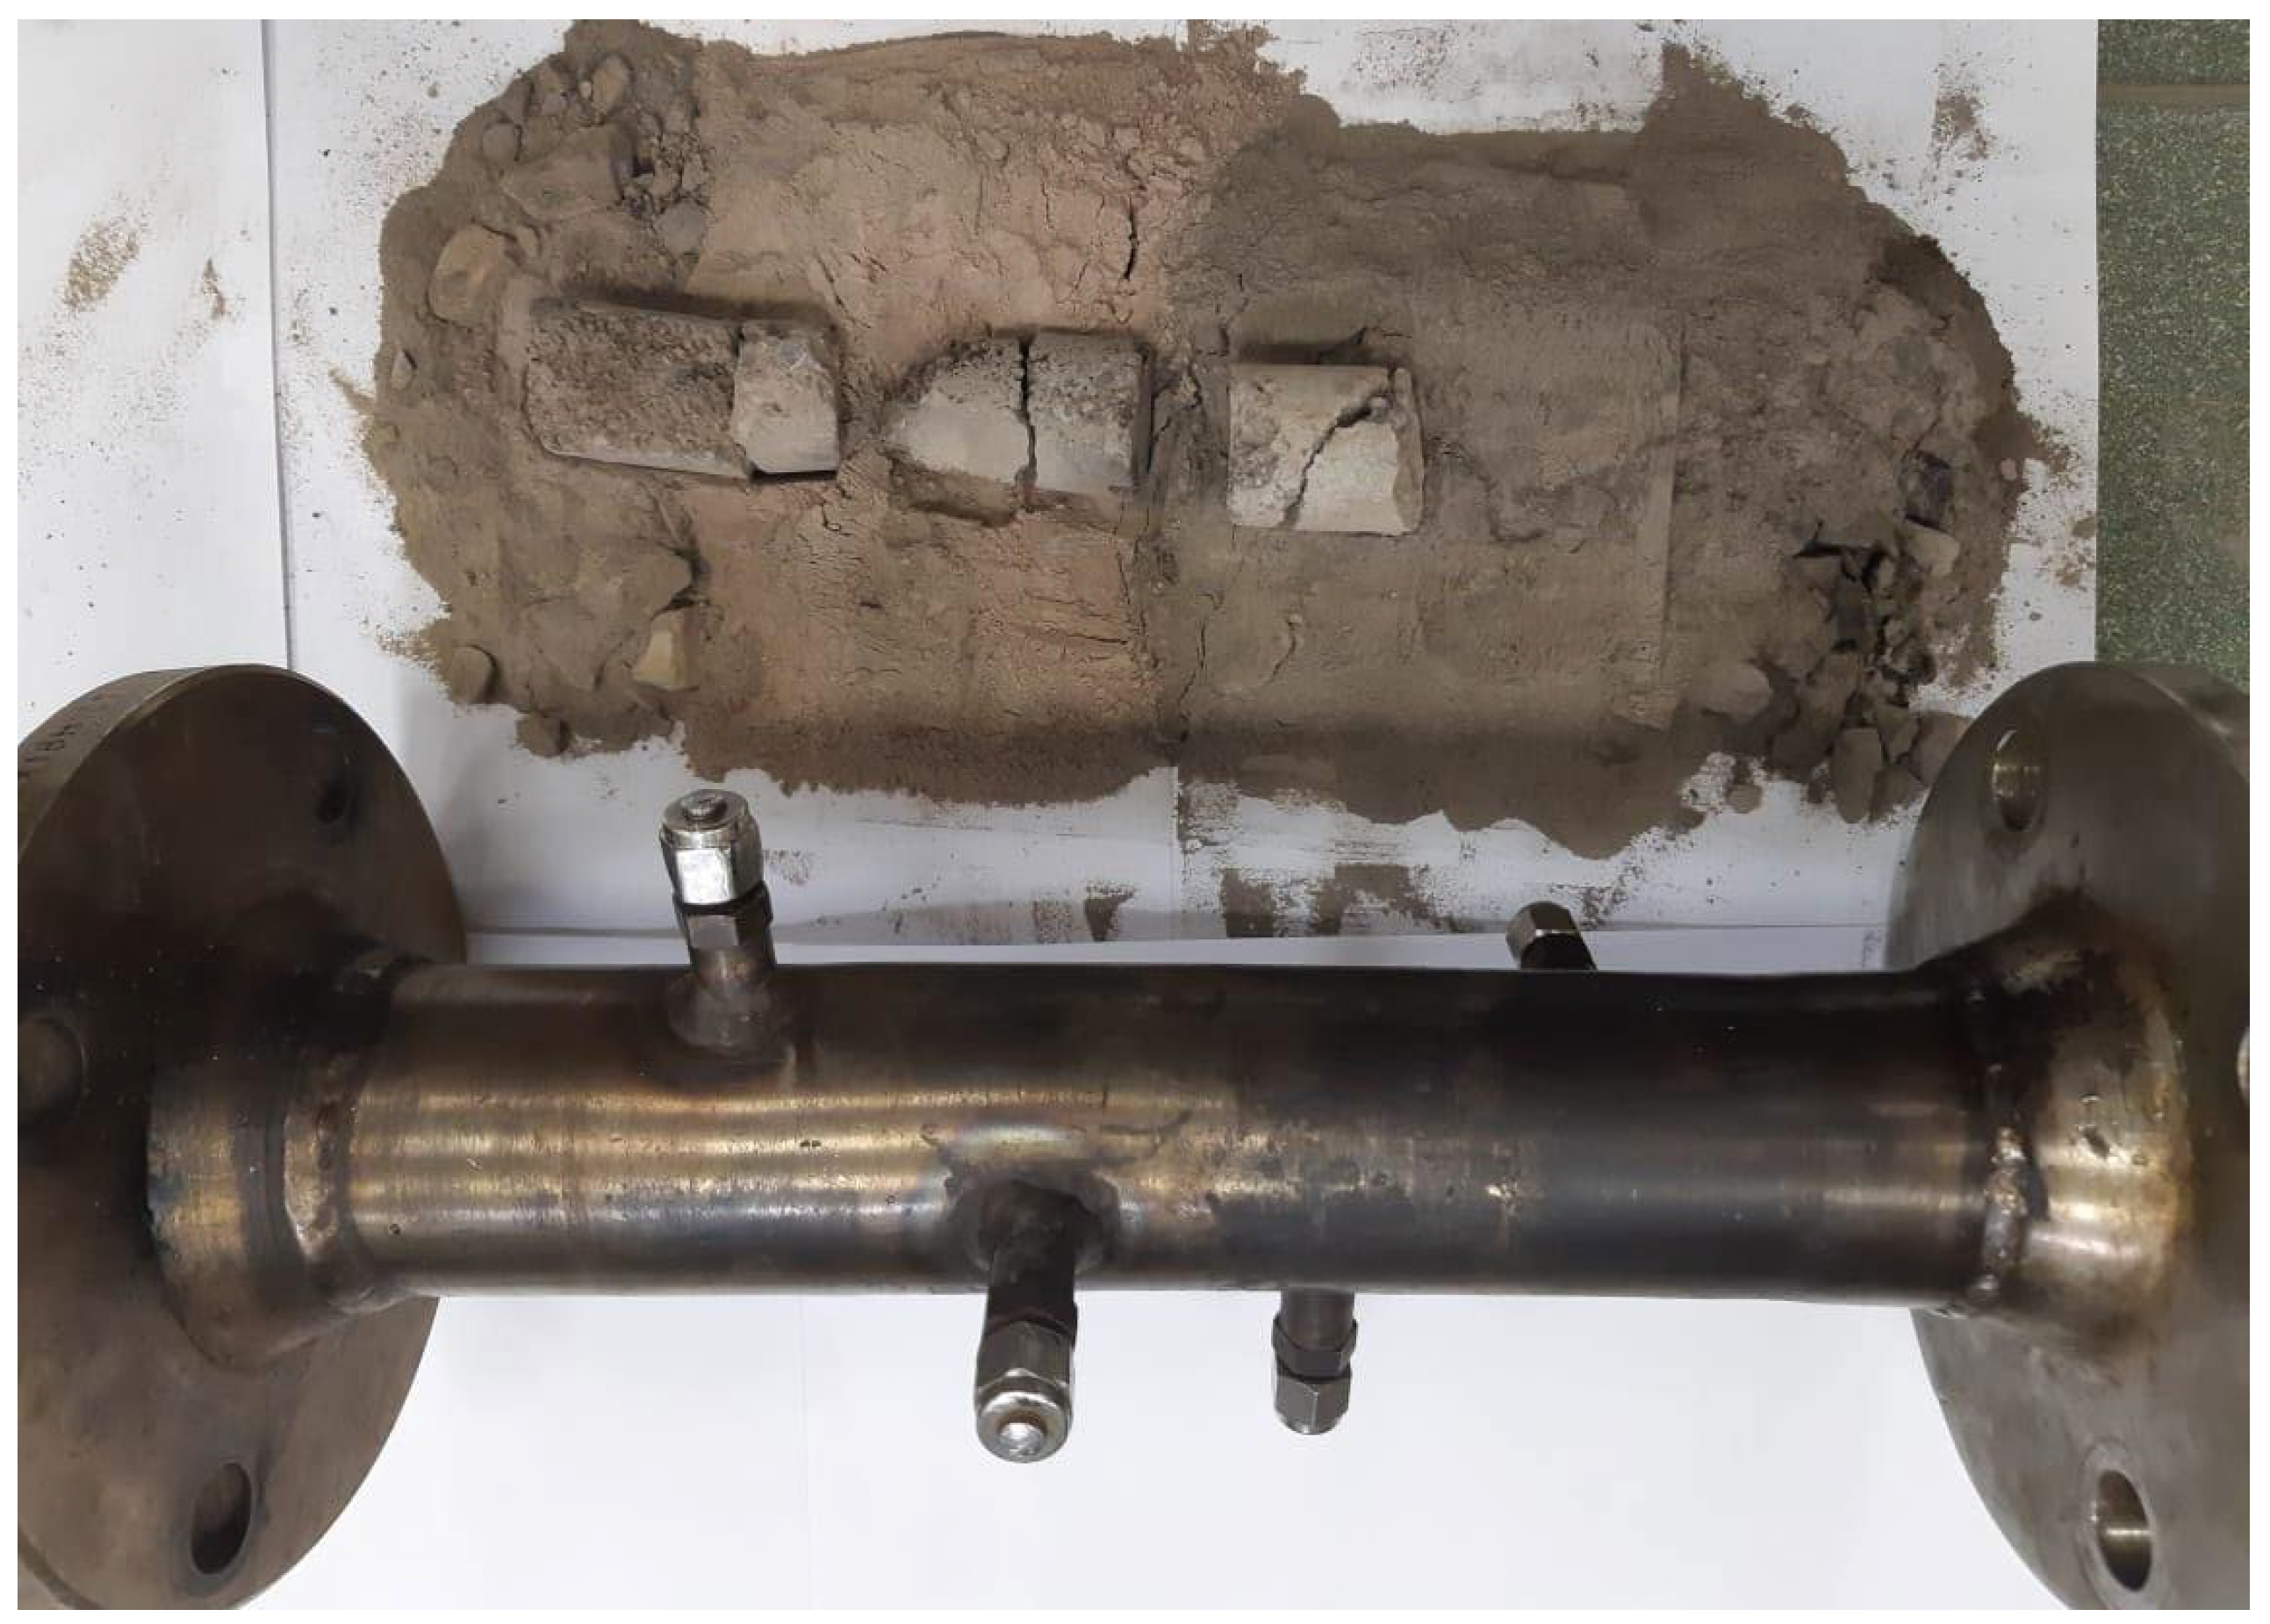
During ISC-2, we observed a migration of oil from the model’s initial zone to the end (Figure 12). Table 8 presents the data on each zone’s initial and final oil saturation after the core model combustion with clay interlayers (ISC-2). The obtained data indicated the absence of methane production in the gas composition during this experiment. As can be seen from Figure 11, the curves of O2 and CO2 are opposite, but the CO2 curve presents many peaks, which indicates a perturbation in the propagation of the combustion front during the process of in situ combustion.
The obtained data in Table 8 indicate that the process of in situ combustion occurred normally before the first interlayer (clay 1) for the first and the second zones, where oil content and saturation decreased adequately. However, by passing through the first layer, we noticed a significant increase in the oil content and saturation of the third and fourth zones because of the migration of heavy oil via interlayers (clays 1 and 2), which led to the accumulation of oil in these zones without any further production of liquid hydrocarbons. Another reason seems to be oil sand deposits in pores [42]. In addition, zones 3 and 4 experienced an increase in the oil content, contrary to expectation, and this oil increase was the result of oil mobility from zones 1 and 2.
Based on the obtained results, we suggest that applying in situ combustion in reservoirs with clay interlayers would lead to the unsuccessful application of in situ combustion projects due to the breakthrough of combustion front after the ignition process as a result of attenuation from the confronted walls of the clay layers.

3.3. In Situ Combustion Test for Core Model with Clay Interlayers in the Presence of Hydrothermal Conditions (ISC-3)

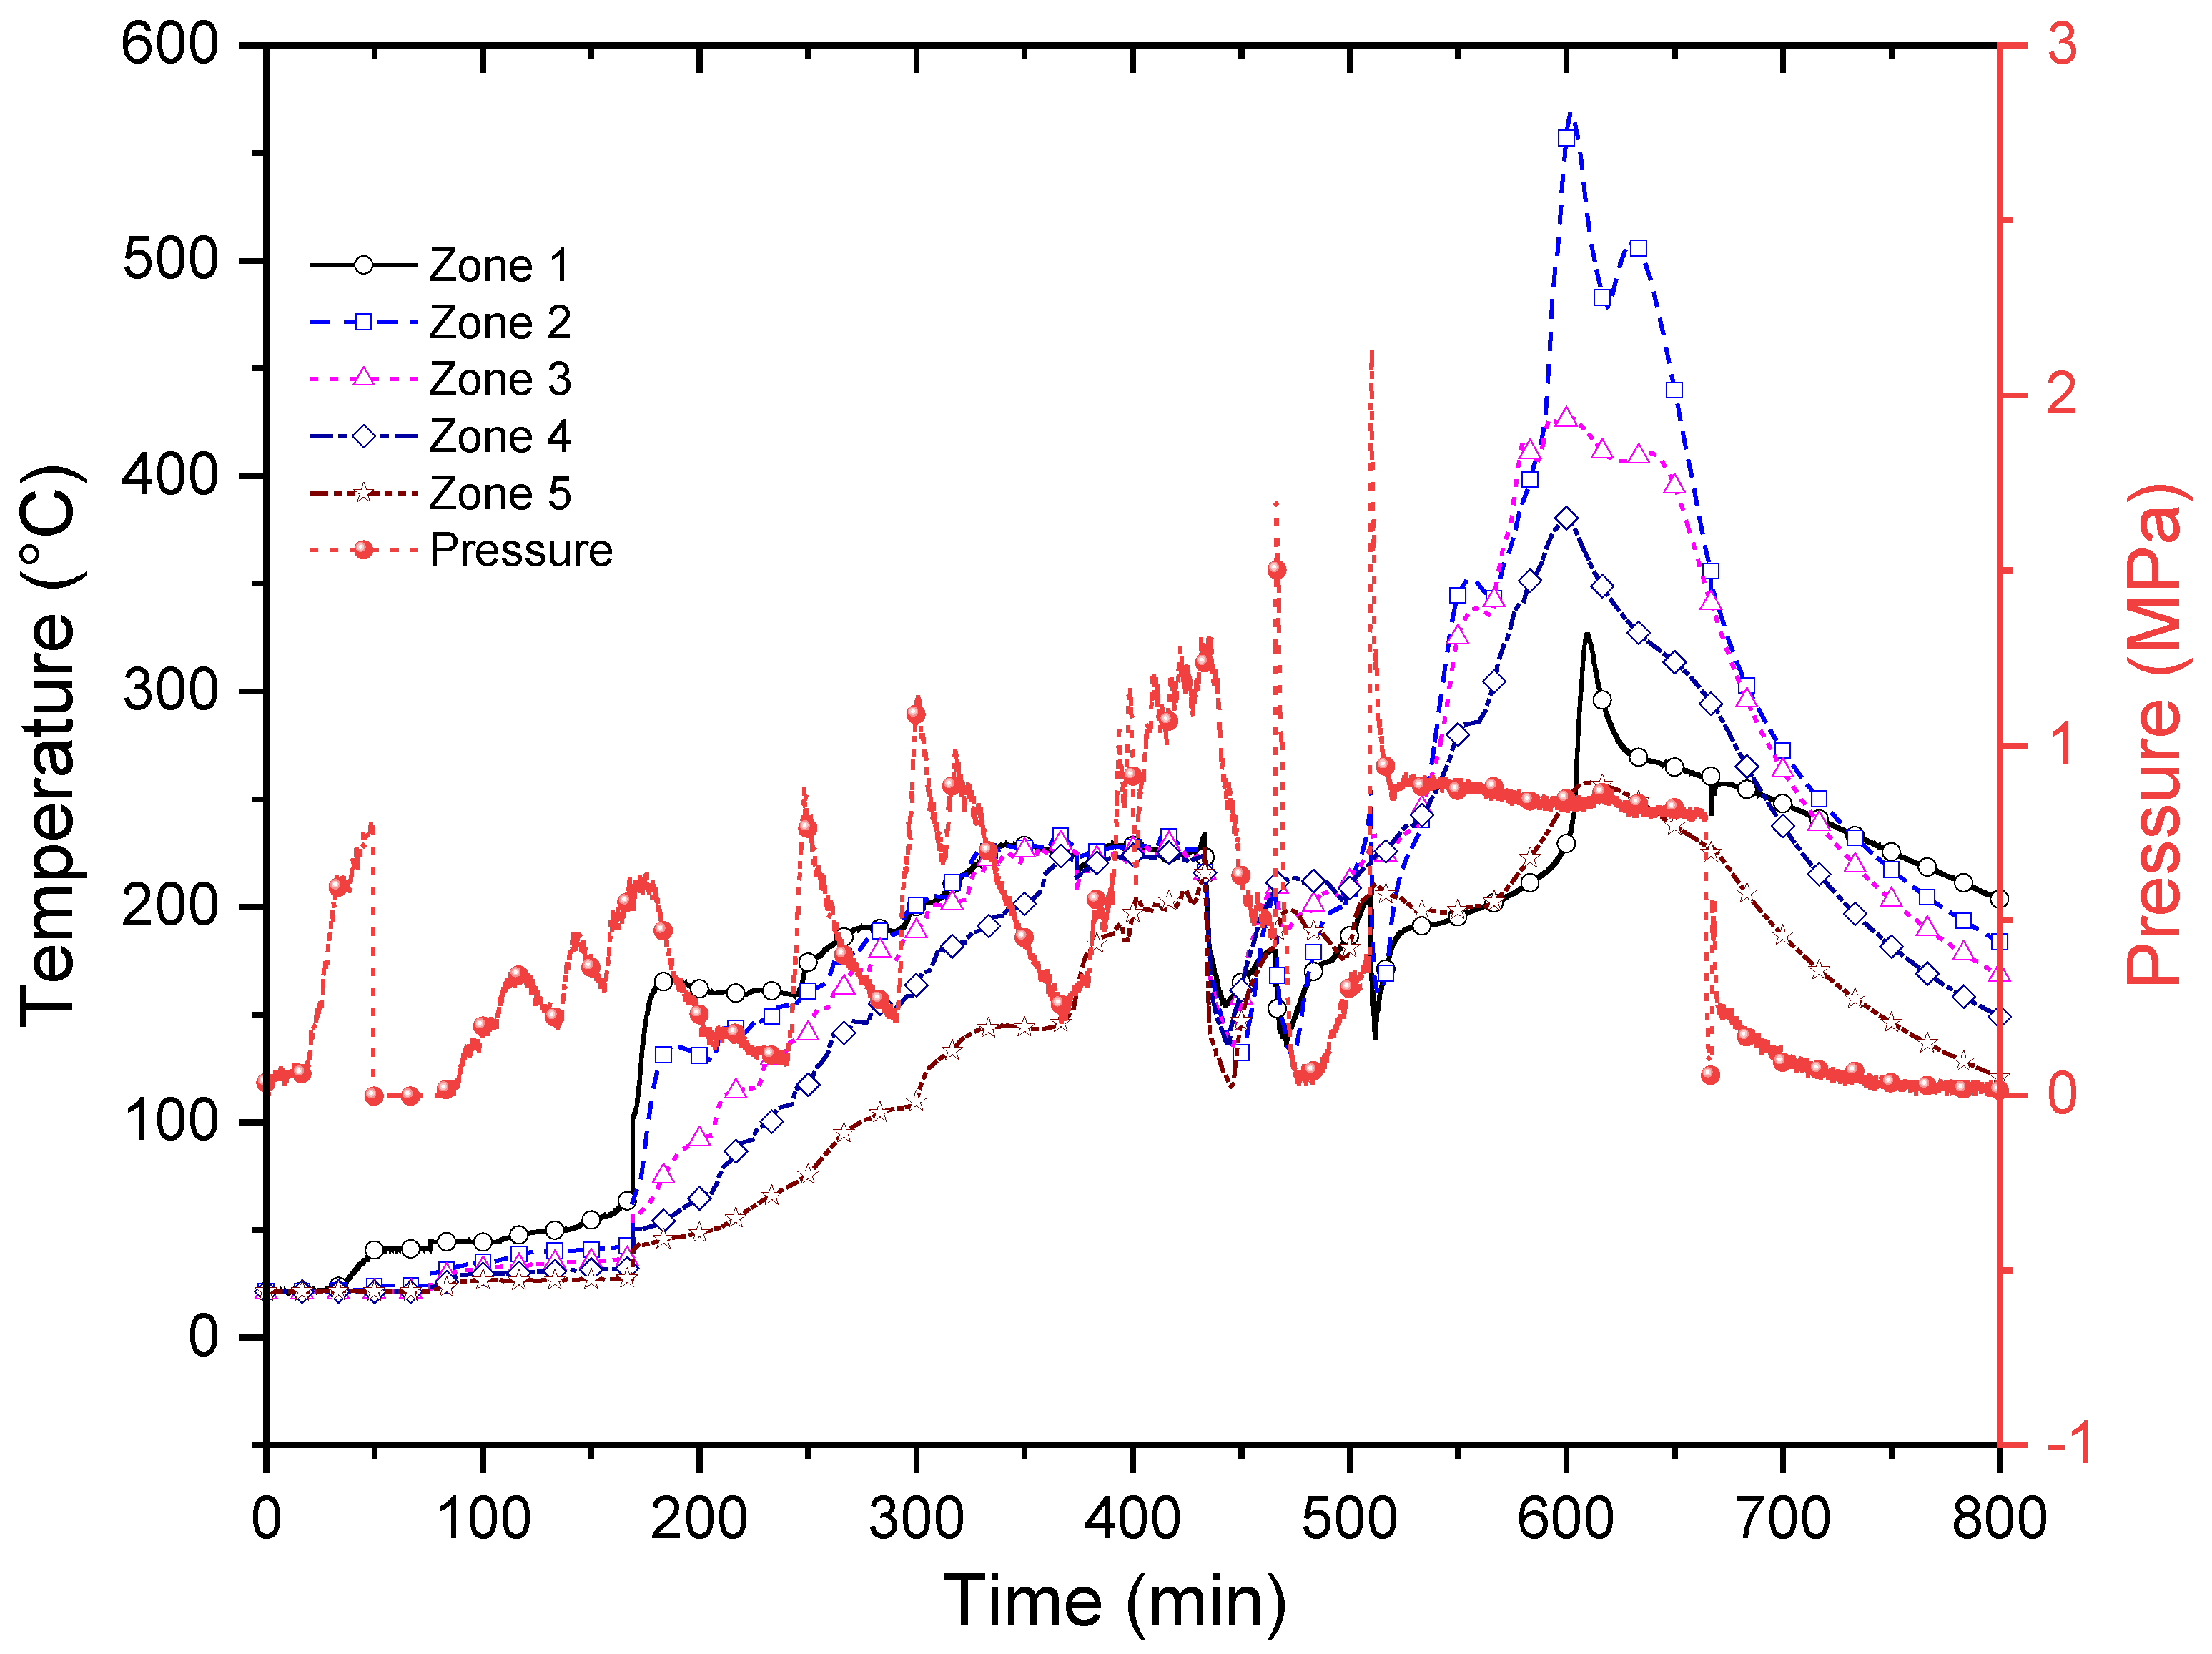
In order to improve the effectiveness of in situ combustion in reservoirs with multiple clay layers, we applied hydrothermal conditions simultaneously with the application of the in situ combustion experiment before the introduction of an air supply. We first injected water vapor into the model-containing medium to create a hydrothermal bond with the studied model. At 200 °C, the steam injection was replaced by air injection without combustion initiation. At this stage, the steam supply was resumed, the initial zone was warmed up to 240 °C, and the combustion process of the model was initiated. The temperature, pressure, and effluent gas concentrations were recorded during the experiment. The obtained results are presented in Figure 13 and Figure 14.
Figure 13 shows that the combustion process was initiated in the 510th minute in the first zone, with a noticeable increase in temperature. The obtained temperature–pressure profile shows no sequential peak achievement in any zone. However, the temperature values were different in each zone, which can be explained by the fact, that combustion began simultaneously in all model zones, with a tendency to decrease the temperature from the initial zone to the final zone. In addition, the pressure profile obtained during the experiment expresses significant perturbation, which demonstrates the model’s uneven filtration of vapor and gases.
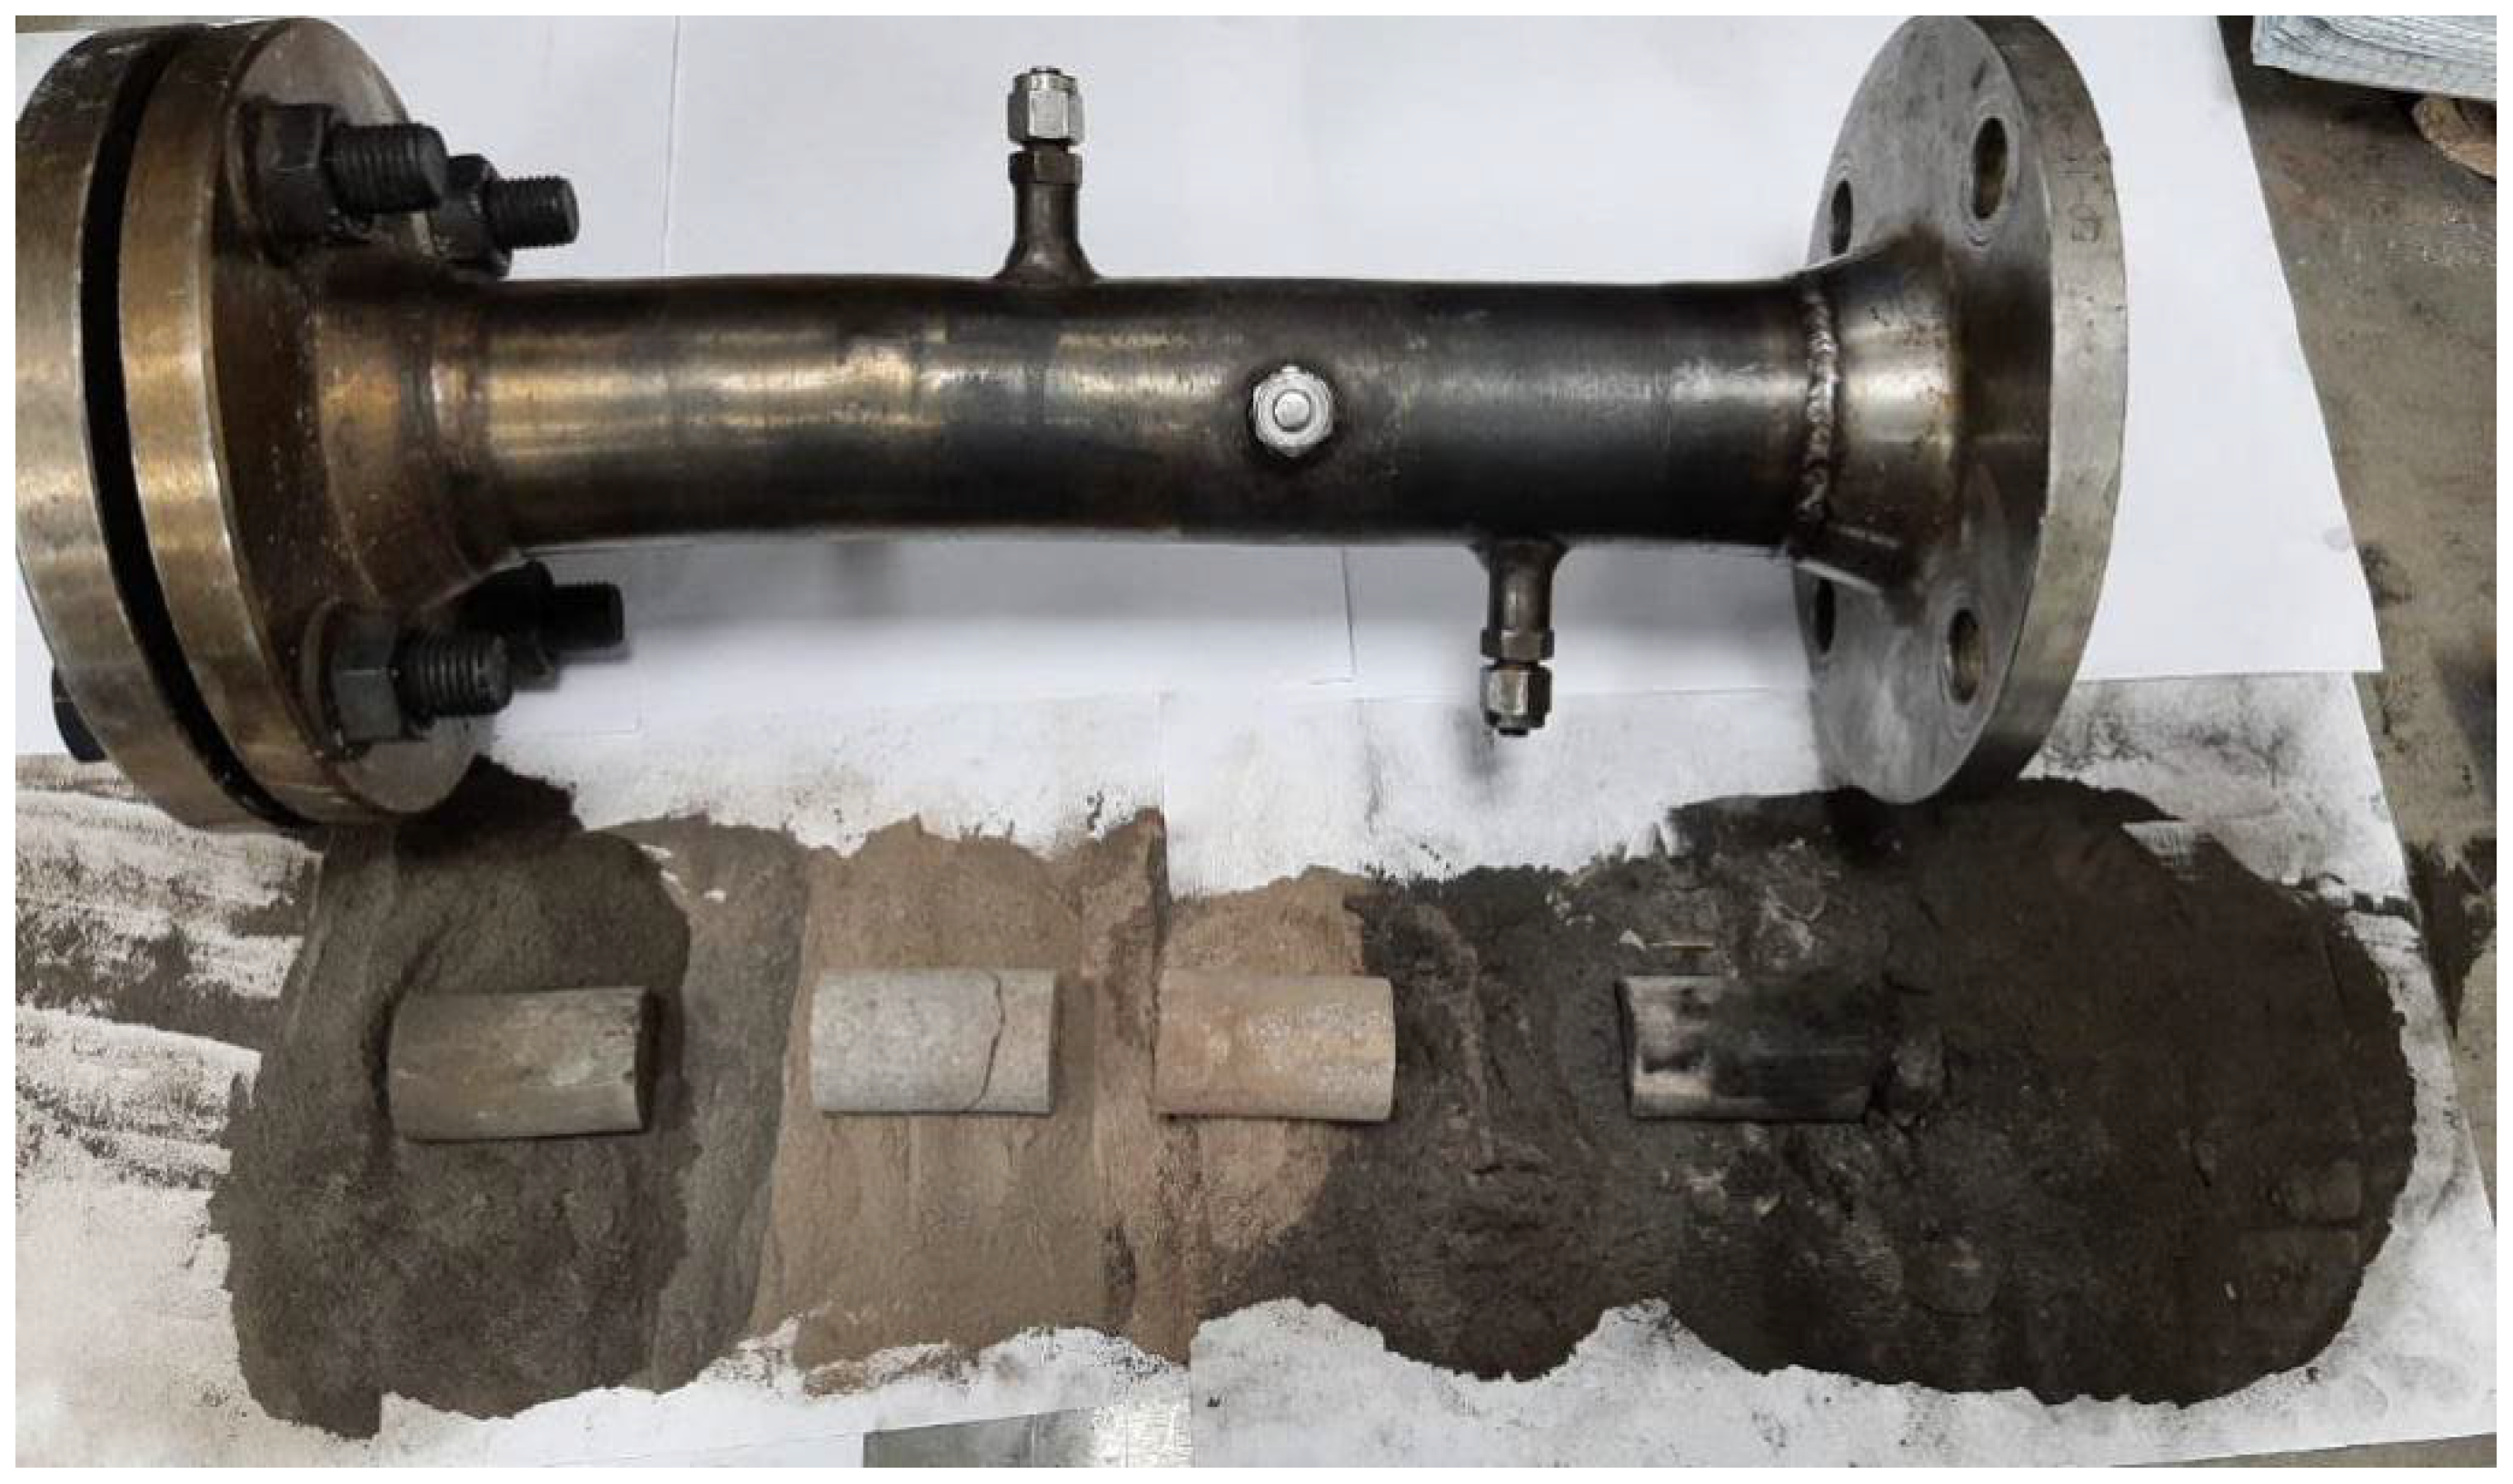
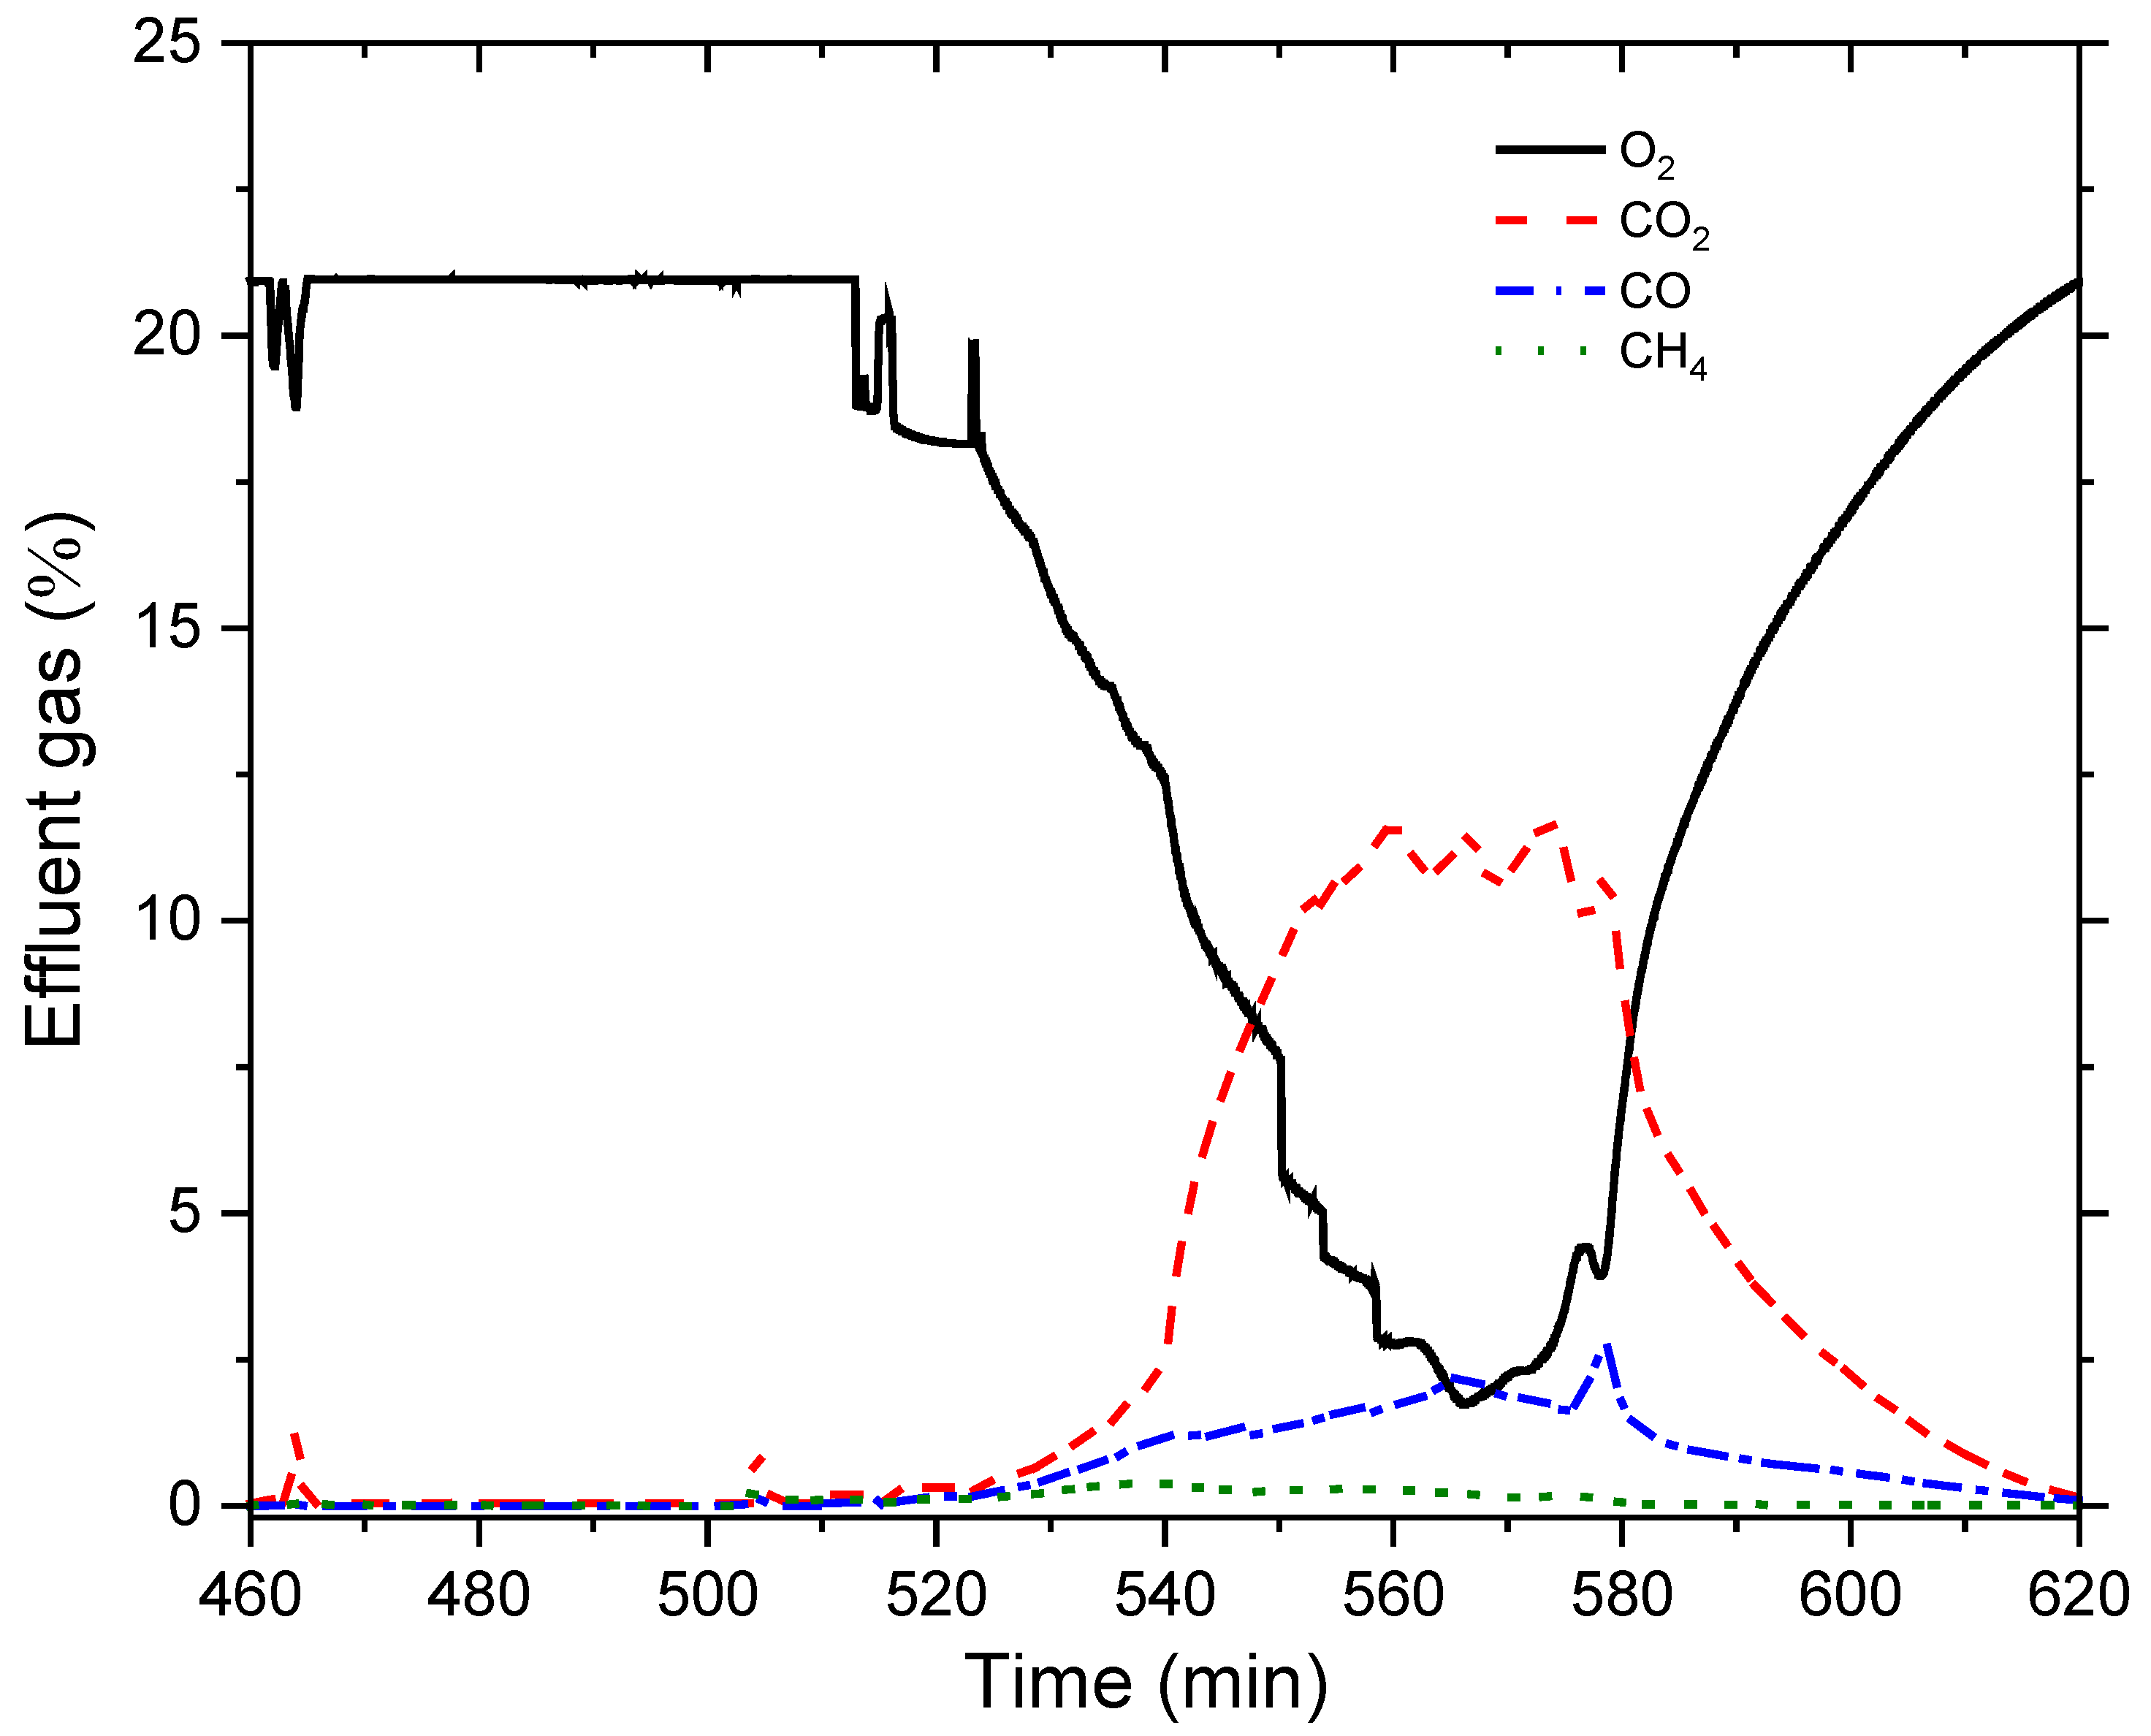
Additionally, the obtained data show that the combustion process of the model lasted only 100 min (From 520 to 620 min, as shown in Figure 13). Moreover, the effluent gas profile shows the weak intensity of the combustion process, as indicated by the composition of the gas at the exit of the model during the experiment (Figure 14). Broadly speaking, the CO2 content increased above 10% and remained stable for a short time in the range from 550 to 580 min, but there was no total oxygen consumption at this stage. As a result, 6.85 g of oil was displaced, and the oil displacement coefficient reached 13.9% at the end of ISC-2 (Figure 15).
At the end of the experiment, a rock was selected from each zone to establish the final saturation with oil. Table 9 presents the data on each zone’s initial oil saturation and final oil saturation after the core model combustion with clay interlayers in hydrothermal conditions (ISC-2).
The data from Table 9 indicate decreases in oil saturation in zones 1 and 2, while the oil contents in zones 3 and 4 and in clays increased. It can be concluded that hydrothermal conditions are likely to improve oil mobility via interlayer pores in addition to promoting heteroatom bond cleavage and stimulating the production of hydrogen from the hybrid process of steam injection and in situ combustion.
By summarizing the results obtained in ISC-3, we can conclude that the primary injection of steam into the clay layers can improve hydrodynamic coupling and slightly increase the degree of oil recovery. Still, the presence of clay layers significantly reduces the effectiveness of ISC.

Analysis of Combustion Tube Data

It is common knowledge that effluent gas composition is a crucial criterion in decision making related to in situ combustion applications. Therefore, we calculated the gas composition (O2, CO2, CO, and N2 mole %) to find combustion parameters (Table 10 and Table 11), including the apparent atomic H/C ratio, air/fuel ratio, O2/fuel ratio, oxygen utilization, and air requirement for evaluating the combustion performance, based on the basic chemical expression that describes the combustion of coke described in the works of Sarathi:
C x H y + aO 2 + RaN 2 bCO 2 + dCO + fO 2 + jH 2 O + RaN 2
The oxygen/fuel ratio is the minimum volume of O2 required for the consumption of a unit mass of fuel and can be calculated from Equation (1):
O 2 Fuel = 379 N 2 R F
where F is the fuel’s molecular mass:
F = 12.011x + 1.008y
where 12.011 = the atomic mass of carbon and 1.008 = the atomic mass of hydrogen.
X = [ CO 2 ] + [   CO ]   and   y = 4 ( N 2 R CO 2 CO 2 O 2 )
Therefore:
O 2 Fuel = 379 N 2 R 12 , 011 CO 2 + CO + 4.032 N 2 R CO 2 CO 2 O 2
where: R = N 2 O 2 , O 2 = O 2 100 O 2 + CO 2 + CO + N 2 , CO 2 = CO 2 100 O 2 + CO 2 + CO + N 2   , [CO] = CO 100 O 2 + CO 2 + CO + N 2 , [N2] = N 2 100 O 2 + CO 2 + CO + N 2 .
The air/fuel ratio is defined as the volume of air needed for the consumption of a unit mass of fuel and is calculated from Equation (2):
Air Fuel = 1 + R O 2 Fuel
n = H/C ratio is the ratio of hydrogen atoms to carbon atoms in the burned fuel:
n = H C = 4 N 2 R CO 2 CO 2 O 2 CO 2 + CO
The oxygen utilization (Y) is defined as the molar percentage of consumed O2 in combustion reactions:
Y = N 2 R O 2 N 2 R
The air requirement is the volume of air that should be injected to sweep a unit volume of sand pack:
A r = 379.1 X Cf O 2 i 100 K 12 + n
where x = 2 ProducedCO 2 + ProducedCO 2 ProducedCO 2 + 2 ProducedCO + n 4 ; K = 100 4.76 ProducedO 2 100 + ProducedO 2 x ProducedO 2 .
The consumed fuel per volume of burned sand in each reaction is equal to the total mass of burned fuel divided by the burned sand volume. The total mass of burned fuel equals the total of carbon and hydrogen in the burned fuel. In addition, the carbon mass in burned fuel = 12 379 ProducedCO 2 + ProducedCO , and the hydrogen mass in burned fuel = 4 379 ProducedN 2 R unreactedO 2 ProducedCO 2 0.5 ProducedCO .
Table 11 provides the calculated in situ combustion parameters for all experiments (ISC 1–3). It is shown that the H/C ratios with and without interlayers are 0.9994, 4.148, and 2.669, respectively. In fact, the H/C ratio reflects the properties of the formed fuel, which is used for the consumption of hydrogen based on the oxygen balance to evaluate the in situ combustion state. Usually, H/C ratio values lower than 3 imply that HTO reactions are dominant with scission-type combustion and a sustaining combustion front, which also proves the successful establishment of a combustion front and its stable propagation. As can be seen from Table 11, the lower H/C ratio in ISC-1 implies that this experiment was favorable for HTO and that the catalytic clay’s effect was in accordance with our temperature profile. Moreover, the catalytic impact in ISC-1 can also be explained by the lower ratios of O2/fuel and air/fuel, in addition to the significant amount of produced CO2 (Table 11). This result points towards the fact that ISC-2 and ISC-3 were unable to achieve the goal of in situ combustion, even after the combustion occurred, which indicates that the interlayers of clay block or disturb the in situ combustion reactions and the propagation of the combustion front via these interlayers. A comprehensive analysis of all the calculated combustion data shows that in the in situ combustion of ISC-1 we observed that the H/C ratio was reduced and the fuel deposition was increased due to the catalytic effect of the clay. However, in ISC-2 and ISC-3, these parameters did not show similar tendencies, which disturbed the in situ combustion process and blocked the propagation of the combustion front during the application of in situ combustion projects.

4. Conclusions

This paper investigated the effect of clays interlayers on the in situ combustion process by studying reservoir models. We studied two models at different conditions in the presence and absence of steam injection. The studied models were characterized by a physicochemical analysis using X-ray diffraction (XRD), thermogravimetry (TG), and differential scanning calorimetry (DSC) combined with nuclear magnetic resonance (NMR) and were tested in combustion tube experiments. The findings of this study suggest that clay minerals play an important role in promoting and stabilizing a combustion front. This effect was exhibited by a homogeneous dispersion of clay minerals in the reservoir volume and should be placed in the reaction zones, as our study led us to obtain an 80.5% recovery factor from this experiment. However, the experiments of models with clay interlayers showed less recovery factors, where the ISC-1 experiment showed no recovery factor in the presence of air injection and ISC-2 led to a 13.9% recovery factor. This was due to the hydrothermal effect of improving permeability and enlarging pores, which allowed the transfer of heat and matter. Unlike the experiments with a homogeneous dispersion of mineral clays in the studied models, the combustion front propagation was found to be unstable and to break out at earlier stages after going through two zones. This early breakthrough resulted in zero oil recovery. The evidence from this experiment suggests that the application of in situ combustion in reservoirs with multiple layers between residual oil would lead to unsuccessful implementation and require additional innovation and technologies. Our study, however, provided a stimulus for a new method for the application of in situ combustion in heterogeneous reservoirs by the injection of steam at earlier stages of the process application. A consequence of creating hydrothermal conditions before the injection of air is the possibility of improving the oil recovery factor, which was increased from 0 to 13.9% in the presence of the hydrothermal effect. Taken together, these results would seem to suggest that a hydrothermal medium could stimulate permeability values and provide more pore space for oil mobility toward oil production wells. Our investigations into this area are still ongoing and seem likely to confirm our hypotheses.

Author Contributions

I.F.M.: Formal analysis, Investigation, and Visualization; A.V.B.: Formal analysis, Investigation, and Visualization; A.R.T.: Formal analysis and Investigation; V.V.C.: Formal analysis and Investigation; A.F.D.K.: Formal analysis, Investigation, and Visualization; R.I.G.: Investigation and Visualization; R.N.S.: Formal analysis and Investigation; A.A.A.-M.: Investigation and Visualization; D.A.E.: Investigation and Visualization; M.A.K.: Writing—review and editing, Investigation, Visualization, Data curation, and Conceptualization; M.A.V.: Writing—review and editing, Formal analysis, Investigation, Visualization, Funding acquisition, Resources, and Supervision. All authors have read and agreed to the published version of the manuscript.

Funding

This research received no external funding.

Data Availability Statement

Not applicable.

Acknowledgments

This work was supported by the Ministry of Science and Higher Education of the Russian Federation under agreement №. 075-15-2020-931 within the framework of the development program for a world-class research center “Efficient development of the global liquid hydrocarbon reserves”.

Conflicts of Interest

The authors declare no conflict of interest.

References

  1. He, L.; Lin, F.; Li, X.; Sui, H.; Xu, Z. Interfacial Sciences in Unconventional Petroleum Production: From Fundamentals to Applications. Chem. Soc. Rev. 2015, 44, 5446–5494. [Google Scholar] [CrossRef] [PubMed]
  2. Caineng, Z.; Guangya, Z.; Shizhen, T.; Suyun, H.; Xiaodi, L.; Jianzhong, L.; Dazhong, D.; Rukai, Z.; Xuanjun, Y.; Lianhua, H. Geological Features, Major Discoveries and Unconventional Petroleum Geology in the Global Petroleum Exploration. Pet. Explor. Dev. 2010, 37, 129–145. [Google Scholar] [CrossRef]
  3. Zou, C. Unconventional Petroleum Geology; Elsevier: Amsterdam, The Netherlands, 2017; ISBN 0128122358. [Google Scholar]
  4. Ganat, T.A.-A.O. Unconventional Petroleum Reservoirs. In Fundamentals of Reservoir Rock Properties; Springer: Berlin/Heidelberg, Germany, 2020; pp. 115–129. [Google Scholar]
  5. Mukherjee, S.; Kumar, A.; Zaworotko, M.J. Metal-Organic Framework Based Carbon Capture and Purification Technologies for Clean Environment. In Metal-Organic Frameworks (MOFs) for Environmental Applications; Elsevier: Amsterdam, The Netherlands, 2019; pp. 5–61. [Google Scholar]
  6. Mukherjee, S.; Kumar, A.; Zaworotko, M.J. Department of Chemical Sciences; Bernal Institute, University of Limerick: Limerick, Ireland, 2019. [Google Scholar]
  7. Sheng, J.J. Modern Chemical Enhanced Oil Recovery: Theory and Practice; Gulf Professional Publishing: Houston, TX, USA, 2010; ISBN 0080961630. [Google Scholar]
  8. Green, D.W.; Willhite, G.P. Enhanced Oil Recovery; Henry, L., Ed.; Doherty Memorial Fund of AIME, Society of Petroleum Engineers: Richardson, TX, USA, 1998; Volume 6. [Google Scholar]
  9. Mokheimer, E.M.A.; Hamdy, M.; Abubakar, Z.; Shakeel, M.R.; Habib, M.A.; Mahmoud, M. A Comprehensive Review of Thermal Enhanced Oil Recovery: Techniques Evaluation. J. Energy Resour. Technol. 2019, 141, 30801. [Google Scholar] [CrossRef]
  10. Vakhin, A.V.; Khelkhal, M.A.; Tajik, A.; Ignashev, N.E.; Krapivnitskaya, T.O.; Peskov, N.Y.; Glyavin, M.Y.; Bulanova, S.A.; Slavkina, O.V.; Schekoldin, K.A. Microwave Radiation Impact on Heavy Oil Upgrading from Carbonate Deposits in the Presence of Nano-Sized Magnetite. Processes 2021, 9, 2021. [Google Scholar] [CrossRef]
  11. Sitnov, S.; Mukhamatdinov, I.; Aliev, F.; Khelkhal, M.A.; Slavkina, O.; Bugaev, K. Heavy Oil Aquathermolysis in the Presence of Rock-Forming Minerals and Iron Oxide (II, III) Nanoparticles. Pet. Sci. Technol. 2020, 38, 574–579. [Google Scholar] [CrossRef]
  12. Mukhamatdinov, I.I.; Salih, I.S.S.; Khelkhal, M.A.; Vakhin, A.V. Application of Aromatic and Industrial Solvents for Enhancing Heavy Oil Recovery from the Ashalcha Field. Energy Fuels 2021, 35, 374–385. [Google Scholar] [CrossRef]
  13. Santos, R.G.; Loh, W.; Bannwart, A.C.; Trevisan, O.V. An Overview of Heavy Oil Properties and Its Recovery and Transportation Methods. Braz. J. Chem. Eng. 2014, 31, 571–590. [Google Scholar] [CrossRef] [Green Version]
  14. Mahinpey, N.; Ambalae, A.; Asghari, K. In Situ Combustion in Enhanced Oil Recovery (EOR): A Review. Chem. Eng. Commun. 2007, 194, 995–1021. [Google Scholar] [CrossRef]
  15. Sharma, J.; Dean, J.; Aljaberi, F.; Altememee, N. In-Situ Combustion in Bellevue Field in Louisiana–History, Current State and Future Strategies. Fuel 2021, 284, 118992. [Google Scholar] [CrossRef]
  16. Carcoana, A.N.; Machedon, V.C.; Pantazi, I.G.; Petcovici, V.C. In Situ Combustion-an Effective Method to Enhance Oil Recovery in Romania. Proc. World Pet. Congr. 1983. [Google Scholar]
  17. Khelkhal, M.A.; Eskin, A.A.; Nurgaliev, D.K.; Vakhin, A.V. Thermal Study on Stabilizing the Combustion Front via Bimetallic Mn@ Cu Tallates during Heavy Oil Oxidation. Energy Fuels 2019, 34, 5121–5127. [Google Scholar] [CrossRef]
  18. Farhadian, A.; Khelkhal, M.A.; Tajik, A.; Lapuk, S.E.; Rezaeisadat, M.; Eskin, A.A.; Rodionov, N.O.; Vakhin, A.V. Effect of Ligand Structure on the Kinetics of Heavy Oil Oxidation: Toward Biobased Oil-Soluble Catalytic Systems for Enhanced Oil Recovery. Ind. Eng. Chem. Res. 2021, 60, 14713–14727. [Google Scholar] [CrossRef]
  19. Khelkhal, M.A.; Eskin, A.; Vakhin, A.V. Kinetic Study on Heavy Oil Oxidation by Copper Tallates. Energy Fuels 2019, 33, 12690–12695. [Google Scholar] [CrossRef]
  20. Khelkhal, M.A.; Eskin, A.A.; Sitnov, S.A.; Vakhin, A.V. Impact of Iron Tallate on the Kinetic Behavior of the Oxidation Process of Heavy Oils. Energy Fuels 2019, 33, 7678–7683. [Google Scholar] [CrossRef]
  21. Khelkhal, M.A.; Eskin, A.A.; Mukhamatdinov, I.I.; Feoktistov, D.A.; Vakhin, A.V. Comparative Kinetic Study on Heavy Oil Oxidation in the Presence of Nickel Tallate and Cobalt Tallate. Energy Fuels 2019, 33, 9107–9113. [Google Scholar] [CrossRef]
  22. Galukhin, A.; Khelkhal, M.A.; Gerasimov, A.; Biktagirov, T.; Gafurov, M.; Rodionov, A.; Orlinskii, S. Mn-Catalyzed Oxidation of Heavy Oil in Porous Media: Kinetics and Some Aspects of the Mechanism. Energy Fuels 2016, 30, 7731–7737. [Google Scholar] [CrossRef]
  23. Khelkhal, M.A.; Eskin, A.A.; Sharifullin, A.V.; Vakhin, A.V. Differential Scanning Calorimetric Study of Heavy Oil Catalytic Oxidation in the Presence of Manganese Tallates. Pet. Sci. Technol. 2019, 37, 1194–1200. [Google Scholar] [CrossRef]
  24. Galukhin, A.; Nosov, R.; Eskin, A.; Khelkhal, M.; Osin, Y. Manganese Oxide Nanoparticles Immobilized on Silica Nanospheres as a Highly Efficient Catalyst for Heavy Oil Oxidation. Ind. Eng. Chem. Res. 2019, 58, 8990–8995. [Google Scholar] [CrossRef]
  25. Galukhin, A.V.; Khelkhal, M.A.; Eskin, A.V.; Osin, Y.N. Catalytic Combustion of Heavy Oil in the Presence of Manganese-Based Submicroparticles in a Quartz Porous Medium. Energy Fuels 2017, 31, 11253–11257. [Google Scholar] [CrossRef]
  26. Varfolomeev, M.A.; Yuan, C.; Bolotov, A.V.; Minkhanov, I.F.; Mehrabi-Kalajahi, S.; Saifullin, E.R.; Marvanov, M.M.; Baygildin, E.R.; Sabiryanov, R.M.; Rojas, A. Effect of Copper Stearate as Catalysts on the Performance of In-Situ Combustion Process for Heavy Oil Recovery and Upgrading. J. Pet. Sci. Eng. 2021, 207, 109125. [Google Scholar] [CrossRef]
  27. Yuan, C.; Emelianov, D.A.; Varfolomeev, M.A.; Rodionov, N.O.; Suwaid, M.A.; Vakhitov, I.R. Mechanistic and Kinetic Insight into Catalytic Oxidation Process of Heavy Oil in In-Situ Combustion Process Using Copper (Ⅱ) Stearate as Oil Soluble Catalyst. Fuel 2021, 284, 118981. [Google Scholar] [CrossRef]
  28. Amanam, U.U.; Kovscek, A.R. Analysis of the Effects of Copper Nanoparticles on In-Situ Combustion of Extra Heavy-Crude Oil. J. Pet. Sci. Eng. 2017, 152, 406–415. [Google Scholar] [CrossRef]
  29. Li, Y.-B.; Gao, H.; Pu, W.-F.; Li, L.; Chen, Y.; Bai, B. Study of the Catalytic Effect of Copper Oxide on the Low-Temperature Oxidation of Tahe Ultra-Heavy Oil. J. Therm. Anal. Calorim. 2019, 135, 3353–3362. [Google Scholar] [CrossRef]
  30. Ariskina, K.A.; Yuan, C.; Abaas, M.; Emelianov, D.A.; Rodionov, N.; Varfolomeev, M.A. Catalytic Effect of Clay Rocks as Natural Catalysts on the Combustion of Heavy Oil. Appl. Clay Sci. 2020, 193, 105662. [Google Scholar] [CrossRef]
  31. Kök, M.V.; Varfolomeev, M.A.; Nurgaliev, D.K. TGA and DSC Investigation of Different Clay Mineral Effects on the Combustion Behavior and Kinetics of Crude Oil from Kazan Region, Russia. J. Pet. Sci. Eng. 2021, 200, 108364. [Google Scholar] [CrossRef]
  32. Minkhanov, I.F.; Bolotov, A.V.; Sagirov, R.N.; Varfolomeev, M.A.; Anikin, O.V.; Tazeev, A.R.; Derevyanko, V.K. The Influence of the Content of Clay Minerals on the Efficiency of Steam Treatment Injection for the Bitumen Oils Recovery. SOCAR Proc. 2021. [Google Scholar] [CrossRef]
  33. Vossoughi, S.; Willhite, G.P.; Kritikos, W.P.; Guvenir, I.M.; El Shoubary, Y. Automation of an In-Situ Combustion Tube and Study of the Effect of Clay on the in-Situ Combustion Process. Soc. Pet. Eng. J. 1982, 22, 493–502. [Google Scholar] [CrossRef]
  34. Li, Y.-B.; Luo, C.; Lin, X.; Li, K.; Xiao, Z.-R.; Wang, Z.-Q.; Pu, W.-F. Characteristics and Properties of Coke Formed by Low-Temperature Oxidation and Thermal Pyrolysis during in Situ Combustion. Ind. Eng. Chem. Res. 2020, 59, 2171–2180. [Google Scholar]
  35. Ariskina, K.A.; Ding, Z.; Abaas, M.; Yuan, C.; Emelianov, D.A.; Chen, Q.; Varfolomeev, M.A. Influence of Carbonate Minerals on Heavy Oil Oxidation Behavior and Kinetics by TG-FTIR. Energies 2021, 14, 8136. [Google Scholar] [CrossRef]
  36. Kozlowski, M.L.; Punase, A.; Nasr-El-Din, H.A.; Hascakir, B. The Catalytic Effect of Clay on In-Situ Combustion Performance. In Proceedings of the SPE Latin American and Caribbean Petroleum Engineering Conference, Quito, Ecuador, 18–20 November 2015; OnePetro: Houston, TX, USA, 2015. [Google Scholar]
  37. Galeev, R.I.; Sakharov, B.V.; Khasanova, N.M.; Volkov, V.Y.; Fazlyyyakhmatov, M.G.; Shamanov, I.N.; Emelianov, D.A.; Kozlova, E.V.; Petrashov, O.V.; Varfolomeev, M.A. Novel Low-Field NMR Method for Characterization Content and SARA Composition of Bitumen in Rocks. J. Pet. Sci. Eng. 2022, 214, 110486. [Google Scholar] [CrossRef]
  38. Pituganova, A.; Nassan, T.; Amro, M.; Minkhanov, I.; Varfolomeev, M.; Bolotov, A. Experimental and Numerical Analysis of Thermal EOR Recovery Schemes for Extra-Heavy Oil of the Oykino-Altuninsky Uplift of the Romashkinskoye Oilfield. In Proceedings of the International Petroleum Technology Conference, Riyadh, Saudi Arabia, 21–23 February 2022; OnePetro: Houston, TX, USA, 2022. [Google Scholar]
  39. Ushakova, A.S.; Zatsepin, V.; Khelkhal, M.A.; Sitnov, S.A.; Vakhin, A.V. In Situ Combustion of Heavy, Medium, and Light Crude Oils: Low-Temperature Oxidation in Terms of a Chain Reaction Approach. Energy Fuels 2022, 36, 7710–7721. [Google Scholar] [CrossRef]
  40. Minkhanov, I.F.; Bolotov, A.V.; Al-Muntaser, A.A.; Mukhamatdinov, I.I.; Vakhin, A.V.; Varfolomeev, M.A.; Slavkina, O.V.; Shchekoldin, K.A.; Darishchev, V.I. Experimental Study on the Improving the Efficiency of Oil Displacement by Co-Using of the Steam-Solvent Catalyst (Russian). Neft. Khozyaystvo-Oil Ind. 2021, 2021, 54–57. [Google Scholar] [CrossRef]
  41. Minkhanov, I.F.; Marvanov, M.M.; Bolotov, A.V.; Varfolomeev, M.A.; Khairtdinov, R.K. Improvement of Heavy Oil Displacement Efficiency by Using Aromatic Hydrocarbon Solvent. Int. Multidiscip. Sci. GeoConference SGEM 2020, 20, 711–718. [Google Scholar]
  42. Speight, J.G. Oil Sand Production Processes; Gulf Professional Publishing: Houston, TX, USA, 2012; ISBN 0124045529. [Google Scholar]
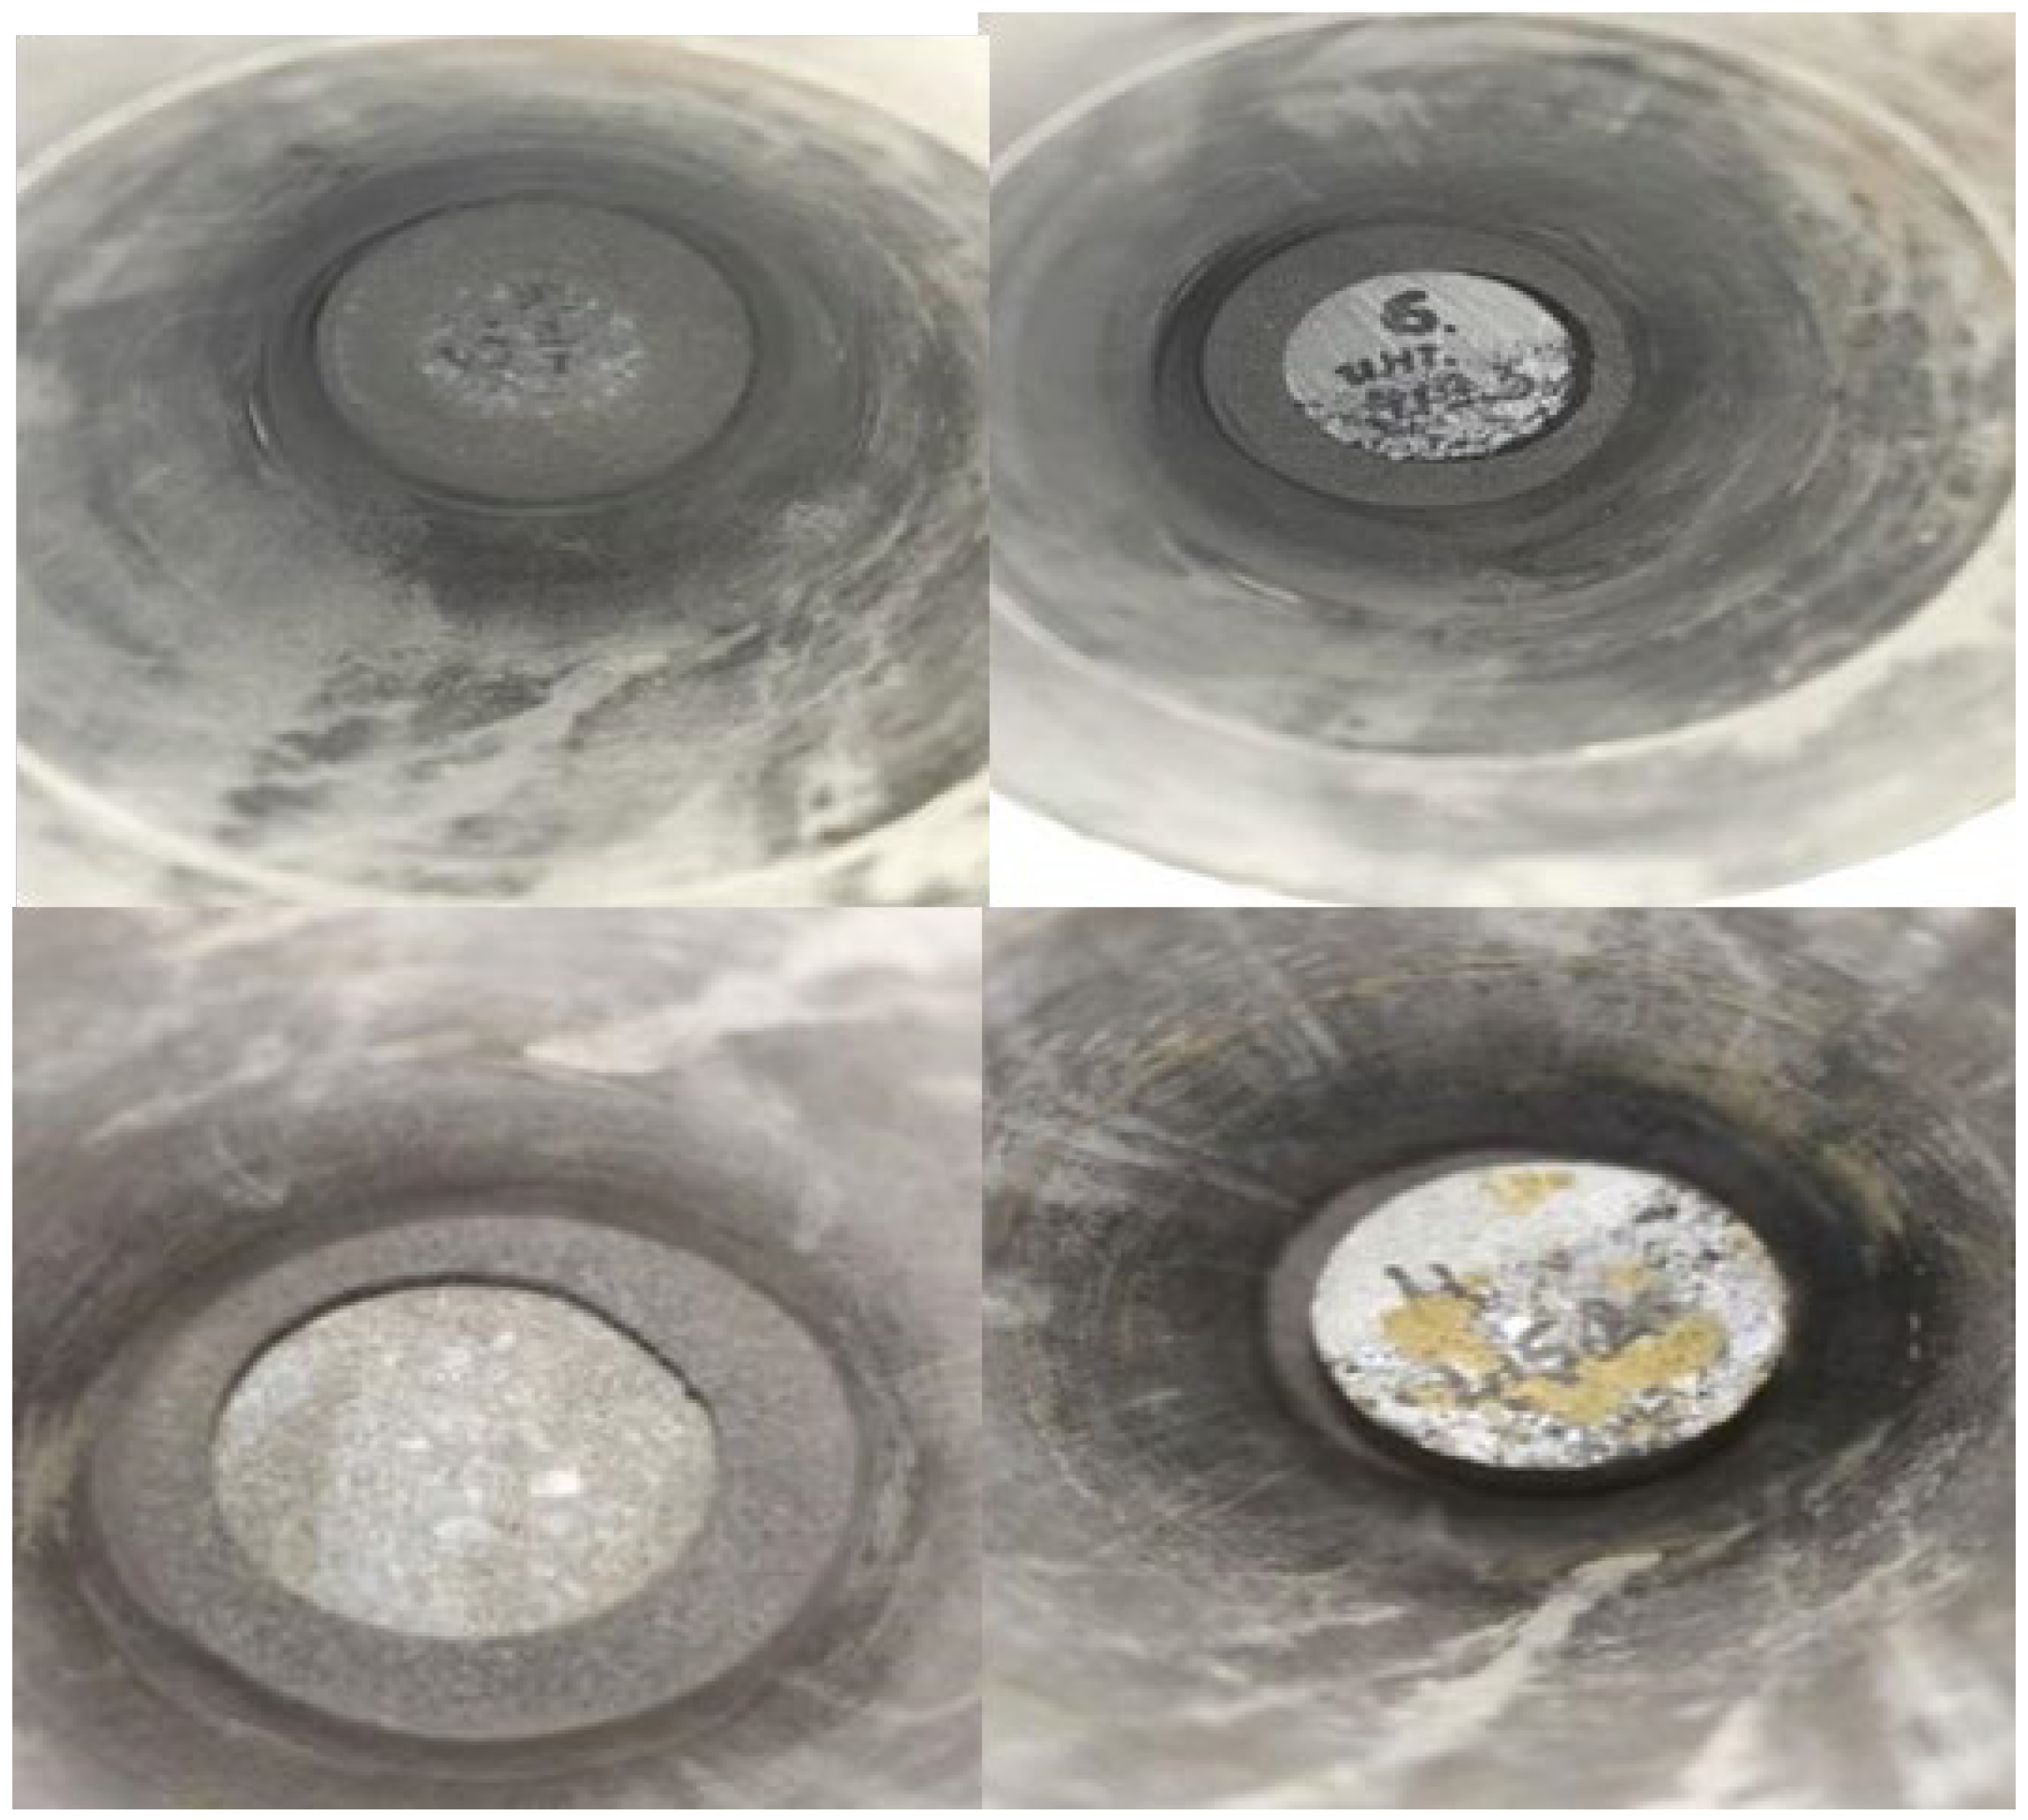
Figure 1. Heavy oil core samples obtained from depths of 413–417 m.
Processes 10 02308 g001
Figure 2. Thermogravimetric and differential thermogravimetric curves of the studied samples’ combustion processes.
Processes 10 02308 g002
Figure 3. Differential scanning calorimetric curves of the studied samples’ combustion processes under 50 bars.
Processes 10 02308 g003
Figure 4. Schematic presentation of the model used in the control experiment, ISC-1.
Processes 10 02308 g004
Figure 5. Schematic presentation of the model used in ISC-2 and -3.
Processes 10 02308 g005
Figure 6. Schematic presentation of in situ and SAGD physicochemical modeling installation: (1) high-pressure pump, (2) steam generator, (3) high-pressure chamber, (4) internal steam generator, (5) core holder, (6) ceramic electric heaters, (7) thermocouples, (8) back pressure regulator, (9) separation burette, (10) thermostat, (11) needle valve, (12) gas flow meter, (13) gas analyzer, (14) computer, (15) flow meter, (16) air filter.
Processes 10 02308 g006
Figure 7. ISC-1 temperature–pressure profile during the in situ combustion test.
Processes 10 02308 g007
Figure 8. ISC-1 effluent gas evolution.
Processes 10 02308 g008
Figure 9. The standard core model after combustion (ISC-1).
Processes 10 02308 g009
Figure 10. ISC-2 temperature–pressure profile during the in situ combustion test.
Processes 10 02308 g010
Figure 11. ISC-2 effluent gas evolution.
Processes 10 02308 g011
Figure 12. Core model with clay interlayers (ISC-2) after combustion.
Processes 10 02308 g012
Figure 13. ISC-3 temperature–pressure profile during the in situ combustion test.
Processes 10 02308 g013
Figure 14. ISC-3 effluent gas evolution.
Processes 10 02308 g014
Figure 15. Core model with clay interlayers (ISC-3) after combustion in hydrothermal conditions.
Processes 10 02308 g015
Table 1. Mineral compositions of the studied samples.
Composition (%)Sample
123
Quartz175064
Microcline141213
Dolomite552810
Calcite020
Pyrite5<11
Kaolinite334
Mica658
Table 2. Values of the initial oil saturation of the samples according to the NMR method.
SampleInitial Oil Saturation, %
Three-dimensional model4.12
14.4
23.41
3 (clay)0.4 (low organic content)
Table 3. Total organic contents (TOC) in the studied samples.
Sample123
Total organic content (TOC)5.2%3.2%1.7%
Table 4. Input parameters of core models in experiments 1–3.
Input ParametersISC-1ISC-2ISC-3
Porosity, %7.26.86.8
Permeability, mD903541
Viscosity, mPa*s (20 °C)20,306
Reservoir temperature25 °C
Table 5. Description of the performed experiments.
ModelModeDescription of the Experiment
1ISC-1Uniform distribution of clay minerals (more than 8%)
2ISC-2Clay layers of 1 cm before zone 3 and 2 cm after it (Figure 5)
3Steam Injection + ISC (ISC-3)Clay layers of 1 cm before zone 3 and 2 cm after it (Figure 5)
Table 6. Oil displacement coefficient for the standard core model combustion.
The Content of Organic Matter in the Model, gWeight of Extracted Oil, gDisplacement Coefficient, %
49.439.880.5
Table 7. SARA analysis of the original oil and produced oil after the standard core model combustion.
SampleSARA Analysis (%)
SaturatesAromaticsResinsAsphaltenes
Original Oil34.8935.5313.5116.07
Produced Oil50.7926.9211.5310.76
Table 8. Oil saturation variation of each model’s zone in ISC-2.
ZoneOil Saturation, %
Before CombustionAfter Combustion
Zone 1№ 14.191.61
Rock
Zone 2№ 14.201.85
Rock
Clay 10.403.55
Zone 3№ 23.945.03
Rock
Clay 20.406.02
Zone 4№ 23.926.51
Rock
Table 9. Oil saturation variation of each model’s zone in ISC-3.
ZoneOil Saturation, %
Before Hydrothermal CombustionAfter Hydrothermal Combustion
Zone 1№ 14.191.47
Rock
Zone 2№ 14.201.73
Rock
Clay 10.401.99
Zone 3№ 23.924.56
Rock
Clay 20.405.24
Zone 4№ 23.935.02
Rock
Table 10. Gas compound concentrations in all experiments (ISC 1–3).
ParametersElementsSymbolISC-1ISC-2ISC-3
Composition of air, mol %Nitrogen
Oxygen
N2i
O2i
CH4
O2
79.04
20.96
1.76
4.6
79.04
20.96
0.15
2.96
79.04
20.96
0.22
7.43
Average gas compositions of produced gases, mol %Methane
Oxygen
Carbon dioxide
Carbon monoxide
Nitrogen
(Calculated)
CO2
CO
N2
17.76
4.21
71.67
9.53
0.44
86.92
7.76
1.44
83.15
Normalization of produced gases, mol %Oxygen
Carbon dioxide
Carbon monoxide
Nitrogen
O2
CO2
CO
N2
4.68
18.07
4.28
72.95
2.96
9.54
0.44
87.05
7.44
7.77
1.44
83.33
Produced (CO2, CO, and N2) and unreacted (O2) gasesUnreacted Oxygen
Carbon dioxide
Carbon monoxide
Nitrogen
O2
CO2
CO
N2
0.273
1.056
0.25
4.18
0.142
0.45
0.021
4.18
0.37
0.39
0.072
4.18
Injected gas volume (scf)Vi-labVi5.2975.2975.297
Burned sand volume (ft3)Vburned-sand-labvi-t0.01420.01730.0180
Table 11. In situ combustion parameters obtained from the experiments (ISC 1–3).
ParametersSymbolISC-1ISC-2ISC-3
O2/Fuel, scf/lbm
m3/kg
O2/fuel1.853.373.85
N (H/C) ratioN0.99944.1482.669
Air/Fuel, scf/lbm
m3/kg
Air/fuel8.8716.1118.40
Oxygen utilizationY0.750.8710.66
Ar, scf/ft3
m3/m3
Ar272.30551.71378.49
Publisher’s Note: MDPI stays neutral with regard to jurisdictional claims in published maps and institutional affiliations.