Article

Design, Heat Transfer, and Visualization of the Milli-Reactor by CFD and ANN

School of Chemical Engineering and Technology, Tianjin University, Tianjin 300350, China
*
Author to whom correspondence should be addressed.
Processes 2022, 10(11), 2329; https://doi.org/10.3390/pr10112329
Submission received: 1 October 2022 / Revised: 25 October 2022 / Accepted: 2 November 2022 / Published: 9 November 2022

Abstract

:
This paper proposes a milli-reactor design method incorporating reactor runaway criteria. Based on Computational Fluid Dynamic (CFD) simulation, neural networks are applied to obtain the optimal reactor structure according to the target reaction requirements. Varma’s theory, the critical Nusselt number for stable operation of the flow reactor, is derived. Inserts of the multi-blade structure are designed and investigated to enhance mixing and heat transfer performance. The flow field and heat transfer capacities are obtained by CFD calculations in the range of R e 50–1800. The internal components increase the heat transfer performance up to 21 times, and the pressure drop up to 16 times. The inclined angle of the blade is recommended to be 45°, which can effectively improve heat transfer without generating excessive pressure drop. By partial least squares regression (PLS) analysis, R e and the number of blades are the most critical factors affecting heat transfer, and the five blades and smaller tilt angles are recommended. The CFD calculation results are in good agreement with the Particle Image Velocimetry (PIV) experimental results.

Graphical Abstract

1. Introduction

With the increasing demands on safety and environmental protection in the fine chemical industry, flow chemistry has become a hot topic in academia and industry as an “enabling technology,” owing to its effectiveness in improving process safety and economics [1,2]. The successful cases of Vertex, Janssen, GlaxoSmithKline, and other companies have demonstrated that continuous production can help reduce carbon emissions, equipment investment, and operating costs and realize in-time monitoring and control product quality during the production process [3].
Early on, fine chemicals were produced continuously in microreactors [4]. Due to their small feature size, microreactors offer various advantages, including high specific surface area, rapid mixing, efficient mass and heat transfer, and safety, which have contributed to the rapid development of microreactors over the past two decades [3,5,6]. However, low throughput, high-pressure drop, and plugging due to small characteristic size are significant challenges for microreactor industrialization [7,8,9,10]. Scaling up to millimeter level is applied in many commercial continuous reactors (such as Corning, Chemtrix) and laboratory research [11]. Although commercial flow reactors have been successfully used in industrial production, they are expensive, cannot be structured for specific reactions, cannot load solid catalysts, and lack flexibility. Incorporating inserts in millimeter pipes to manipulate the flow field in the reactor can effectively improve mass and heat transfer [12,13,14,15]. Such millimeter-scale reactors show great potential due to their low price and industrial manufacturability, especially with the increased use of 3D printing technology in the chemical industry [16].
Commercial flow reactors have excellent mass and heat transfer capabilities because of their complex structural design, and therefore also entail large pressure drops and expensive equipment costs. It makes sense to meet chemical needs cost-effectively and practically while minimizing the overdesign of heat and mass transfer characteristics [17].
Microstructured reactors were incorrectly considered isothermal and intrinsically safe in previous studies [18], which undoubtedly poses significant risks. Especially after scale amplification, heat transfer deteriorates. Determining the stable operating state of the reactor is a critical step in process design [19]. Reactor runaway criteria can be used to determine the boundaries of safe and non-safe zones, guide reactor design, optimize reactor-operating conditions, and improve process safety and stability [20,21]. Since Semenov’s pioneering work, which defined the boundaries of runaway states, numerous attempts have been made to determine new runaway criteria [22,23,24,25]. In the design of the millimeter-scale reactor, considering the interaction of thermodynamic properties of reactants, reaction kinetics, fluid flow, and reaction heat, the heat and mass transfer capacities of the reactor are reasonably improved so that the reactor is located in a parameter non-sensitive region, and the intrinsic safety is realized [10,26].
Once the reactant properties and operating conditions are determined, the flow field in the reactor is the primary determinant of heat and mass transfer [2]. Artificial intelligence algorithms to control the flow field, generate multiple flow configurations through specific structures, and achieve the desired macroscopic performance (drag reduction, improved mixing, heat transfer, etc.) are a new direction with a new gravity [27]. Lv et al. [28] proposed an active approach for the insert’s design, which optimizes enhanced heat transfer and drag reduction.
Although there have been many studies on how to develop various reaction processes in milli-reactors, there are very few reports on how to design milli-reactors. Kockmann et al. [29,30] used classical correlations in microreactor design to determine the minimum channel size to meet mixing, heat transfer, and reaction requirements. Kucherov et al. [31] made customized flow reactors by 3D printing and copper plating on the reactor surface to achieve the reaction requirements. However, in the current study, there is a lack of methods to design and adapt reactor structures to specific reaction requirements. It is well known that enhanced mixing and heat transfer come at the cost of energy dissipation (pressure drop) and that a one-sided pursuit of reactor transfer performance inevitably leads to large pressure drops. The currently available milli-reactors have to use complex structural designs in order to ensure versatility, and are therefore exposed to high-pressure drops. Flow chemistry system development is often limited by the unavailability of suitable pumps. However, different reaction systems require different mixing and heat transfer capabilities; for example, a moderately exothermic class B reaction requires not only moderate heat transfer but also enough residence time. At this point, unacceptable pressure drops may occur if the microreactors are simply connected in series. It is therefore very attractive to keep the reactor running steadily and prevent runaway while keeping the pressure drop as low as possible and preventing over-design through structural design in the reactor design step, taking into account the reaction characteristics. Unfortunately, however, there is very little research on the design of milli-reactors for reaction requirements. Furthermore, considering convenience and practicality, the structure of such a reactor should be simple, easy to manufacture, and the reactor performance should be able to be adjusted by simple parameter changes. Therefore, this paper proposes a millimeter-scale reactor design method that incorporates runaway reactor criteria and designs structural inserts. During reactor development, the reactor’s flow and heat transfer characteristics are studied by CFD simulations. A neural network is trained based on the acquired data. The heat transfer capacity required for the reactor is determined according to the characteristics of the specific reaction combined with the stability criteria. It is used as an objective function to obtain the best structure suitable for the reaction by a trained neural network. By this method, users of the reactor can easily understand the heat transfer and pressure drop characteristics of the reactor and achieve stable operation of the reactor without suffering excessive pressure drop losses. The results of the CFD calculations are compared with the flow field visualization results by particle image velocimetry (PIV) to verify the accuracy of the CFD calculations.

2. Numerical Simulation and Experiment

2.1. Numerical Calculation

2.1.1. Geometric Model

A schematic of the inserts in a millimeter-scale reactor is shown in Figure 1. The center rod’s diameter is 1 mm, and a different number (2~6) of deflectors is connected to the center rod. The thickness (δ) of the deflector is 0.3 mm, and the height (H) of the blade ends is 0.8 mm. The numerical calculations investigate the effects of the number of blades (N), the angle (A) with the central rod, and the blade spacing (P) on the flow and heat transfer in a 3 mm circular tube, respectively, and the relevant design parameters are shown in Table 1. The length of the computational domain is 200 mm and contains at least 40 structural units to be able to capture the rear stabilization characteristics.

2.1.2. Governing Equations and Boundary Conditions

In the current work, the working fluid is water with a R e range of 50–1800, which is considered incompressible Newtonian fluid. Because the small diameter of the pipe is placed horizontally, gravity can be ignored. The constant heat flux at the wall is 2000 W/m2, the temperature variation range is small, and the effect of radiation can be neglected while the physical properties of the fluid remain constant. The model is assumed to be a three-dimensional steady state, and viscous dissipation is not considered. Based on the above assumptions, the controlling equations for the conservation of mass, momentum, and energy can be written as:
U i x i = 0
ρ U i x i + ρ U j U i x j = p x i + x j μ U i x i + ρ τ j i i = 1 3
x i ρ U i c p T λ T x i = 0 i , j = 1 , 2 , 3
τ j i   is the Reynolds stress.
In this paper, the SST k-ω model was chosen.
The tube’s inlet is a fully developed velocity and temperature boundary layer, and the wall of the tube and the inserts are non-slip wall surfaces. The fully developed speed and temperature distribution at the entrance are:
u i n = u c [ 1 ( r r 0 ) 2 ]
T i n = T c + q ˙ R 0 λ [ ( r r 0 ) 2 1 4 ( r r 0 ) 4 ]
The tube outlet is set as a pressure outlet, and backflow is suppressed. Fluent 15 based on the finite volume method is used in this study. The coupled pressure and velocity are calculated by the Couple algorithm. The convergence criterion is 10−5 for the momentum equation and 10−8 for the energy equation.

2.1.3. Data Reduction

The Reynolds number, characterizing the relative influence of inertial and viscous forces, can be calculated by the following equation:
R e = ρ u m D μ
The average convection coefficient can be calculated as
h m = q ˙ T w T m
Among them, the average wall temperature and the average fluid temperature in the full development stage are Tw and Tm, respectively.
The Nusselt number, which characterizes the strength of convective heat transfer, is defined as
N u = h m D λ
The whole tube friction factor is defined as
f = Δ p 1 / 2 ρ u 2 L / D

2.1.4. Grid Generation and Verification of Accuracy

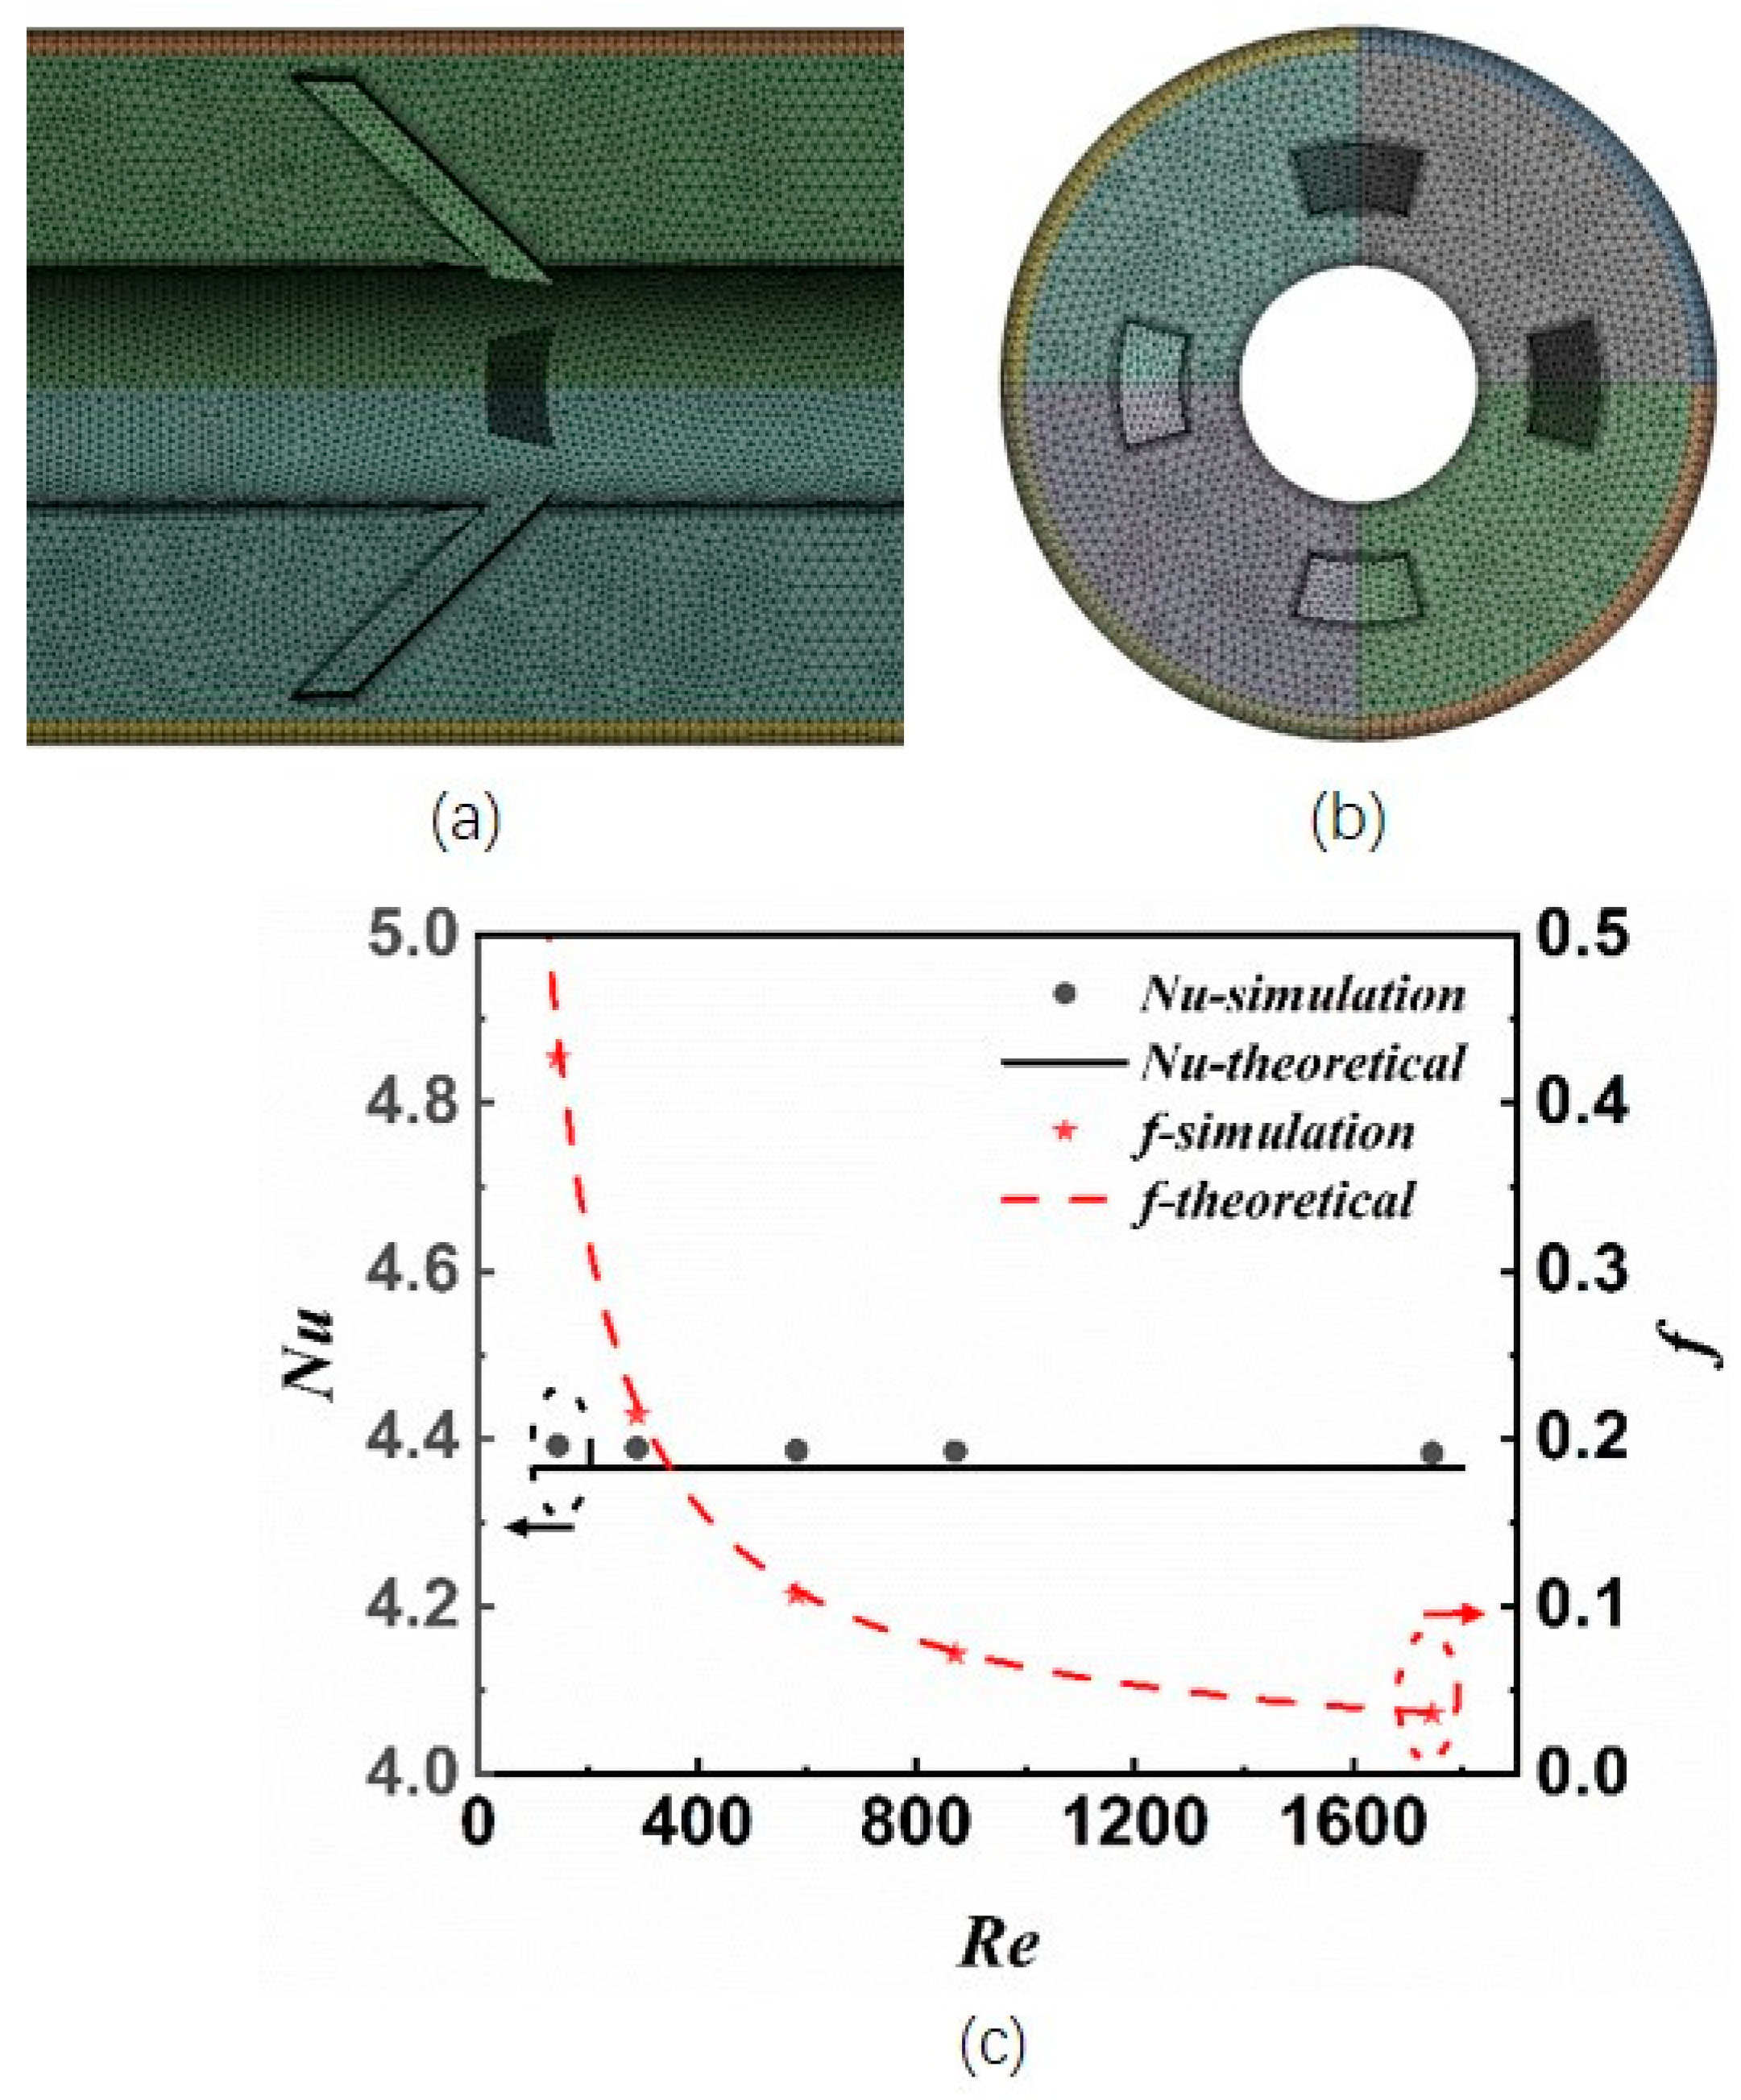
Workbench Mesh generated the 3D tetrahedral mesh, and the expansion layer was added to the wall of the pipe and the insert. In order to verify the mesh independence, for R e = 600, the number of blades is 6; the angle is 45 and the spacing is 2 mm. Three different meshes were generated separately. As shown in Table 2, the relative errors of Nusselt number N u and pressure drop for Grid 2 and Grid 3 are 0.10% and 0.49%. To balance the computational accuracy and computational resources, Grid 2 is utilized. The final grid used is shown in Figure 2a,b.
Theoretical values of Nusselt number (4.36) and friction factor (64/ R e were applied, respectively, to validate the performances of heat transfer and flow in the plain tube. As shown in Figure 2, good agreements were obtained as the max deviations between the simulative and theoretical values were 2.7% for the Nusselt number and 5.0% for the friction factor. Furthermore, we used the laminar model to calculate the heat transfer and pressure drop in the milli-reactor at the same R e up to R e   ≤ 800, and the difference in the results between the laminar model and the k−ω SST was less than 6.5%.

2.2. PIV Visualization Experiment

In this experiment, a model of inserts with N = 4, A = 45°, p = 4 mm was selected to measure the flow structure in the downstream section of the inserts in the range of R e 50–1500.
The 2D2C-PIV system is shown in Figure 3. For the measurement, the test part was a transparent tube with an inner diameter of 3 mm and a wall thickness of 1 mm, which was fixed in a rectangular transparent tank made of plexiglass. The laser-induced fluorescent particles with an average diameter of 1 μm were used as tracers whose specific gravity was about 1.14 g/cm3. The choice of pump was constrained by the low flow rate of the experimental process, the presence of particulate, and the need to achieve high flow stability.
For accurate and stable feeding, a feeding system was designed to feed distilled water and concentrated particle solution by a chromatography preparation pump and a syringe pump, respectively, then mixed by a magnetic stirring tank and entered the test pipeline.
A dual-frame camera operating at 20 Hz was used to record the PIV images. The resolution of the images was 1980 × 1200 pixels with a dynamic range of 12 bits. To obtain a suitable viewing area, a 60 mm camera lens (Niko) with a minimum f-value of 2.8 was used. The tube’s test section was illuminated from the top using a dual-cavity frequency-doubled pulsed Nd: YAG laser, as shown in Figure 4. A set of lenses formed the said light sheet and a light guide arm was applied to adjust the position of the said light sheet. A transparent box made of Plexiglas was designed at the end of the test tube to capture the circular section under one camera condition.

2.3. Stability Criterion

Under general conditions, the Arrhenius equation’s reaction rate increases exponentially as the temperature increases, leading to exponential exotherm and reaction out of control. These conditions are called parameter sensitivities, where tiny deviations in individual parameters lead to rapid reaction rate and temperature increases. The monograph by Varma [32] provides a decent review of parameter sensitivity. This article adopts the explicit criteria perfected by Morbidelli and Varma [32] that have been extended to tubular reactors.
The reaction parameters are characterized by dimensionless numbers:
ψ = D a · B S t
where B is the dimensionless heat of reaction.
B = Δ H r C A 0 ρ c v T 0 · γ
γ is the dimensionless reaction activation energy.
γ = E a R T   · T 0
St represents the relationship between convective heat transfer and flow and is defined as
S t = 4 U L d v ρ c p
Da represents the relationship between reaction rate and residence time.
D a = ρ k T 0 C A 0 m 1 L v
The critical reaction number ψ crit , when ψ > ψ crit will show parameter sensitivity, defined as
ψ c r i t = θ c exp θ c / 1 + θ c / γ 1 B c 0 / B 2 / 3
where θ c is the dimensionless critical temperature, calculated as
θ c = γ 2 γ 2 γ γ 4 4 θ c 0
θ c 0 is the dimensionless initial cooling temperature, defined as
θ c 0 = T c o T o T o · γ
where T c o is the initial temperature of the cooling medium.
Parament B c 0 can be defined as:
B c 0 = θ c 0 m θ c 0 1 + θ c 0 / γ 2 1 + θ c 0 / γ 2 θ c 0
θ c 0 is the critical temperature of the adiabatic reactor, which the following equation can calculate:
0 = m 1 θ c 0 4 + 2 γ m 1 2 γ θ c 0 3 + [ 2 m 1 3 γ γ ( γ                        2 ) ] γ 2 θ c 0 2 + 2 2 m 1 + γ γ 3 θ c 0 + m 1 γ 4
When the reaction is the first reaction (m = 1):
B c 0 = 4 γ γ 4
When γ→ ∞, i.e., when the reaction dimensionless activation energy is tremendous:
B c 0 = 1 + m 2
By combining the equations, the critical Nusselt number of the reaction can be obtained. The reaction is in the parameter insensitive region when the actual N u is greater than N u c .
N u c = 1 ψ c r i t ρ d 2 E a Δ H r k T 0 C A 0 m 4 λ R T   T 0 2

2.4. Neural Network

A large number of results from CFD calculations are used as training data, and a three-layer feedforward neural network (ANN) is used to find relationships between inputs ( R e , P, A, N) and the output ( N u , f / f 0 ). The ANN (artificial neural network) consists of the input layer, hidden layer, and output layer, and the number of neurons in the input layer is determined by the dimension of the input data sample. The ANN has four input layers of normalized neurons ( R e , P, A, and N), a hidden layer with multiple neurons, and an output layer with one output unit ( N u or f / f 0 ). The number of layers and the number of neurons per hidden layer can be adjusted according to the data itself, and these two factors have a significant impact on the ANN results. Our dataset consists of a total of 960 data using 90% of the data trains network, 10% of the data backtest.
Although the ANN can be easily developed to handle multi-output problems, we trained two ANNs for the sake of research simplicity. The data samples are normalized and entered into the network, and the output values for each hidden layer are processed using the Relu activation function.
The loss function used for the whole ANN network is the mean square error loss, which measures the mean square between the predicted and true values of the ANN. The final evaluation metrics are mean square error (abbreviated as MSE) and regression coefficient (abbreviated as Reg), and the formula is defined as follows:
M S E = 1 N t = 1 N X i , A N N X i 2
Reg = 1 t = 1 N X i , A N N X i 2 X i 2

2.5. Milli-Reactor Design Process

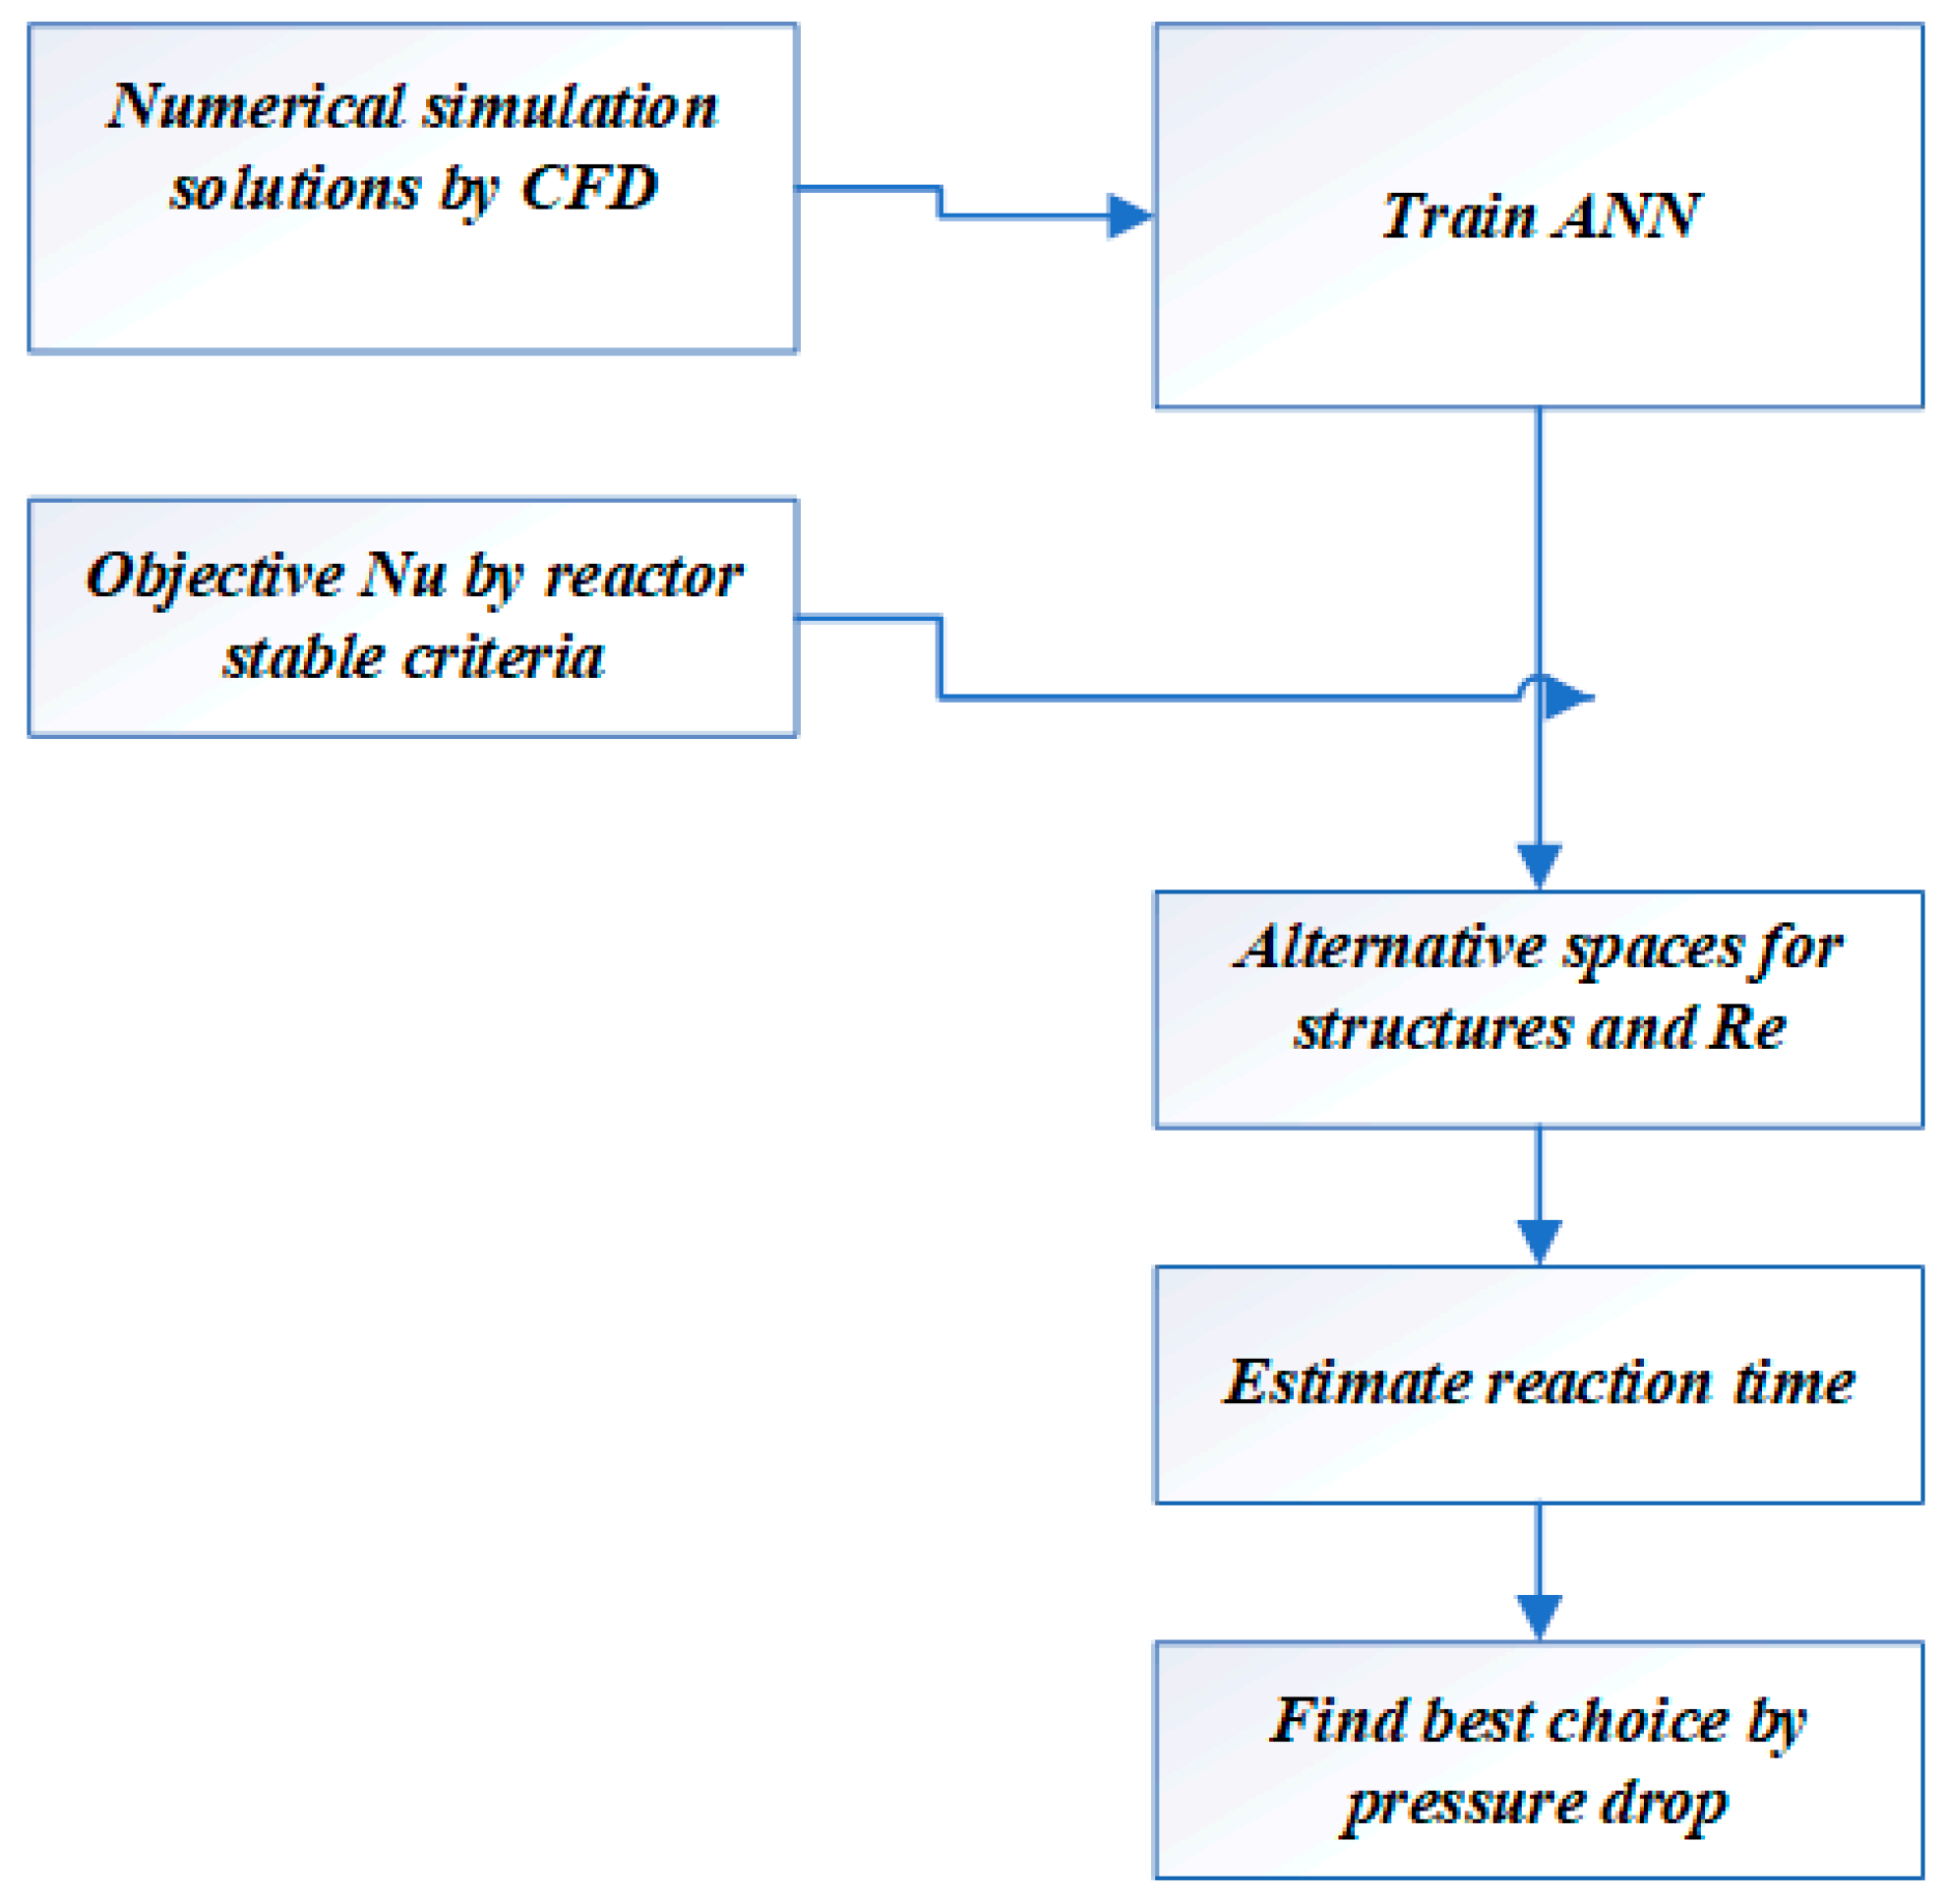
The design flow is illustrated in Figure 4. The first step is to obtain the target N u : first, calculate the critical N u c of the reaction from Equation (18) according to the kinetic and physical data of the reaction, and then correct it to be the N u corresponding to the working fluid as water. The second step is to generate alternative structures and operating parameter variable space by the trained neural network, and the third step is to determine the reaction time. Then, the ideal structure is determined with the pressure drop minimization as the objective function.
N u is obtained through the water as the working fluid in the neural network, and the critical N u c is determined by specific reactants, so N u c needs to be modified to N u while the working fluid is water. The effect of substance properties on N u can be seen in the Dittus–Boelter correlation:
N u = 0.023 R e 0.8 P r 0.3
Thus, the target Nusselt number N u w a t e r is:
N u w a t e r = N u c P r w a t e r P r r e a c t i o n 0.3
In the search for the optimal structure, the feasible R e , structure, and corresponding f are first determined by the trained neural network according to the target N u , and then the optimal structure is determined with the objective of minimizing the pressure drop ΔP.
The reactor length L is determined by the residence time and the average flow rate, and to adjust the deviation of the average flow rate between the existent insert and the empty tube. A correction factor a is introduced.
a = V e m p t y / V w i t h   i n s e r t
The reactor pressure drop ΔP is:
Δ P = 1 2 f a t R e μ 3 ρ 2 d 4

3. Results and Discussion

3.1. Thermal-Hydraulic Characteristics

3.1.1. Heat Transfer Mechanism

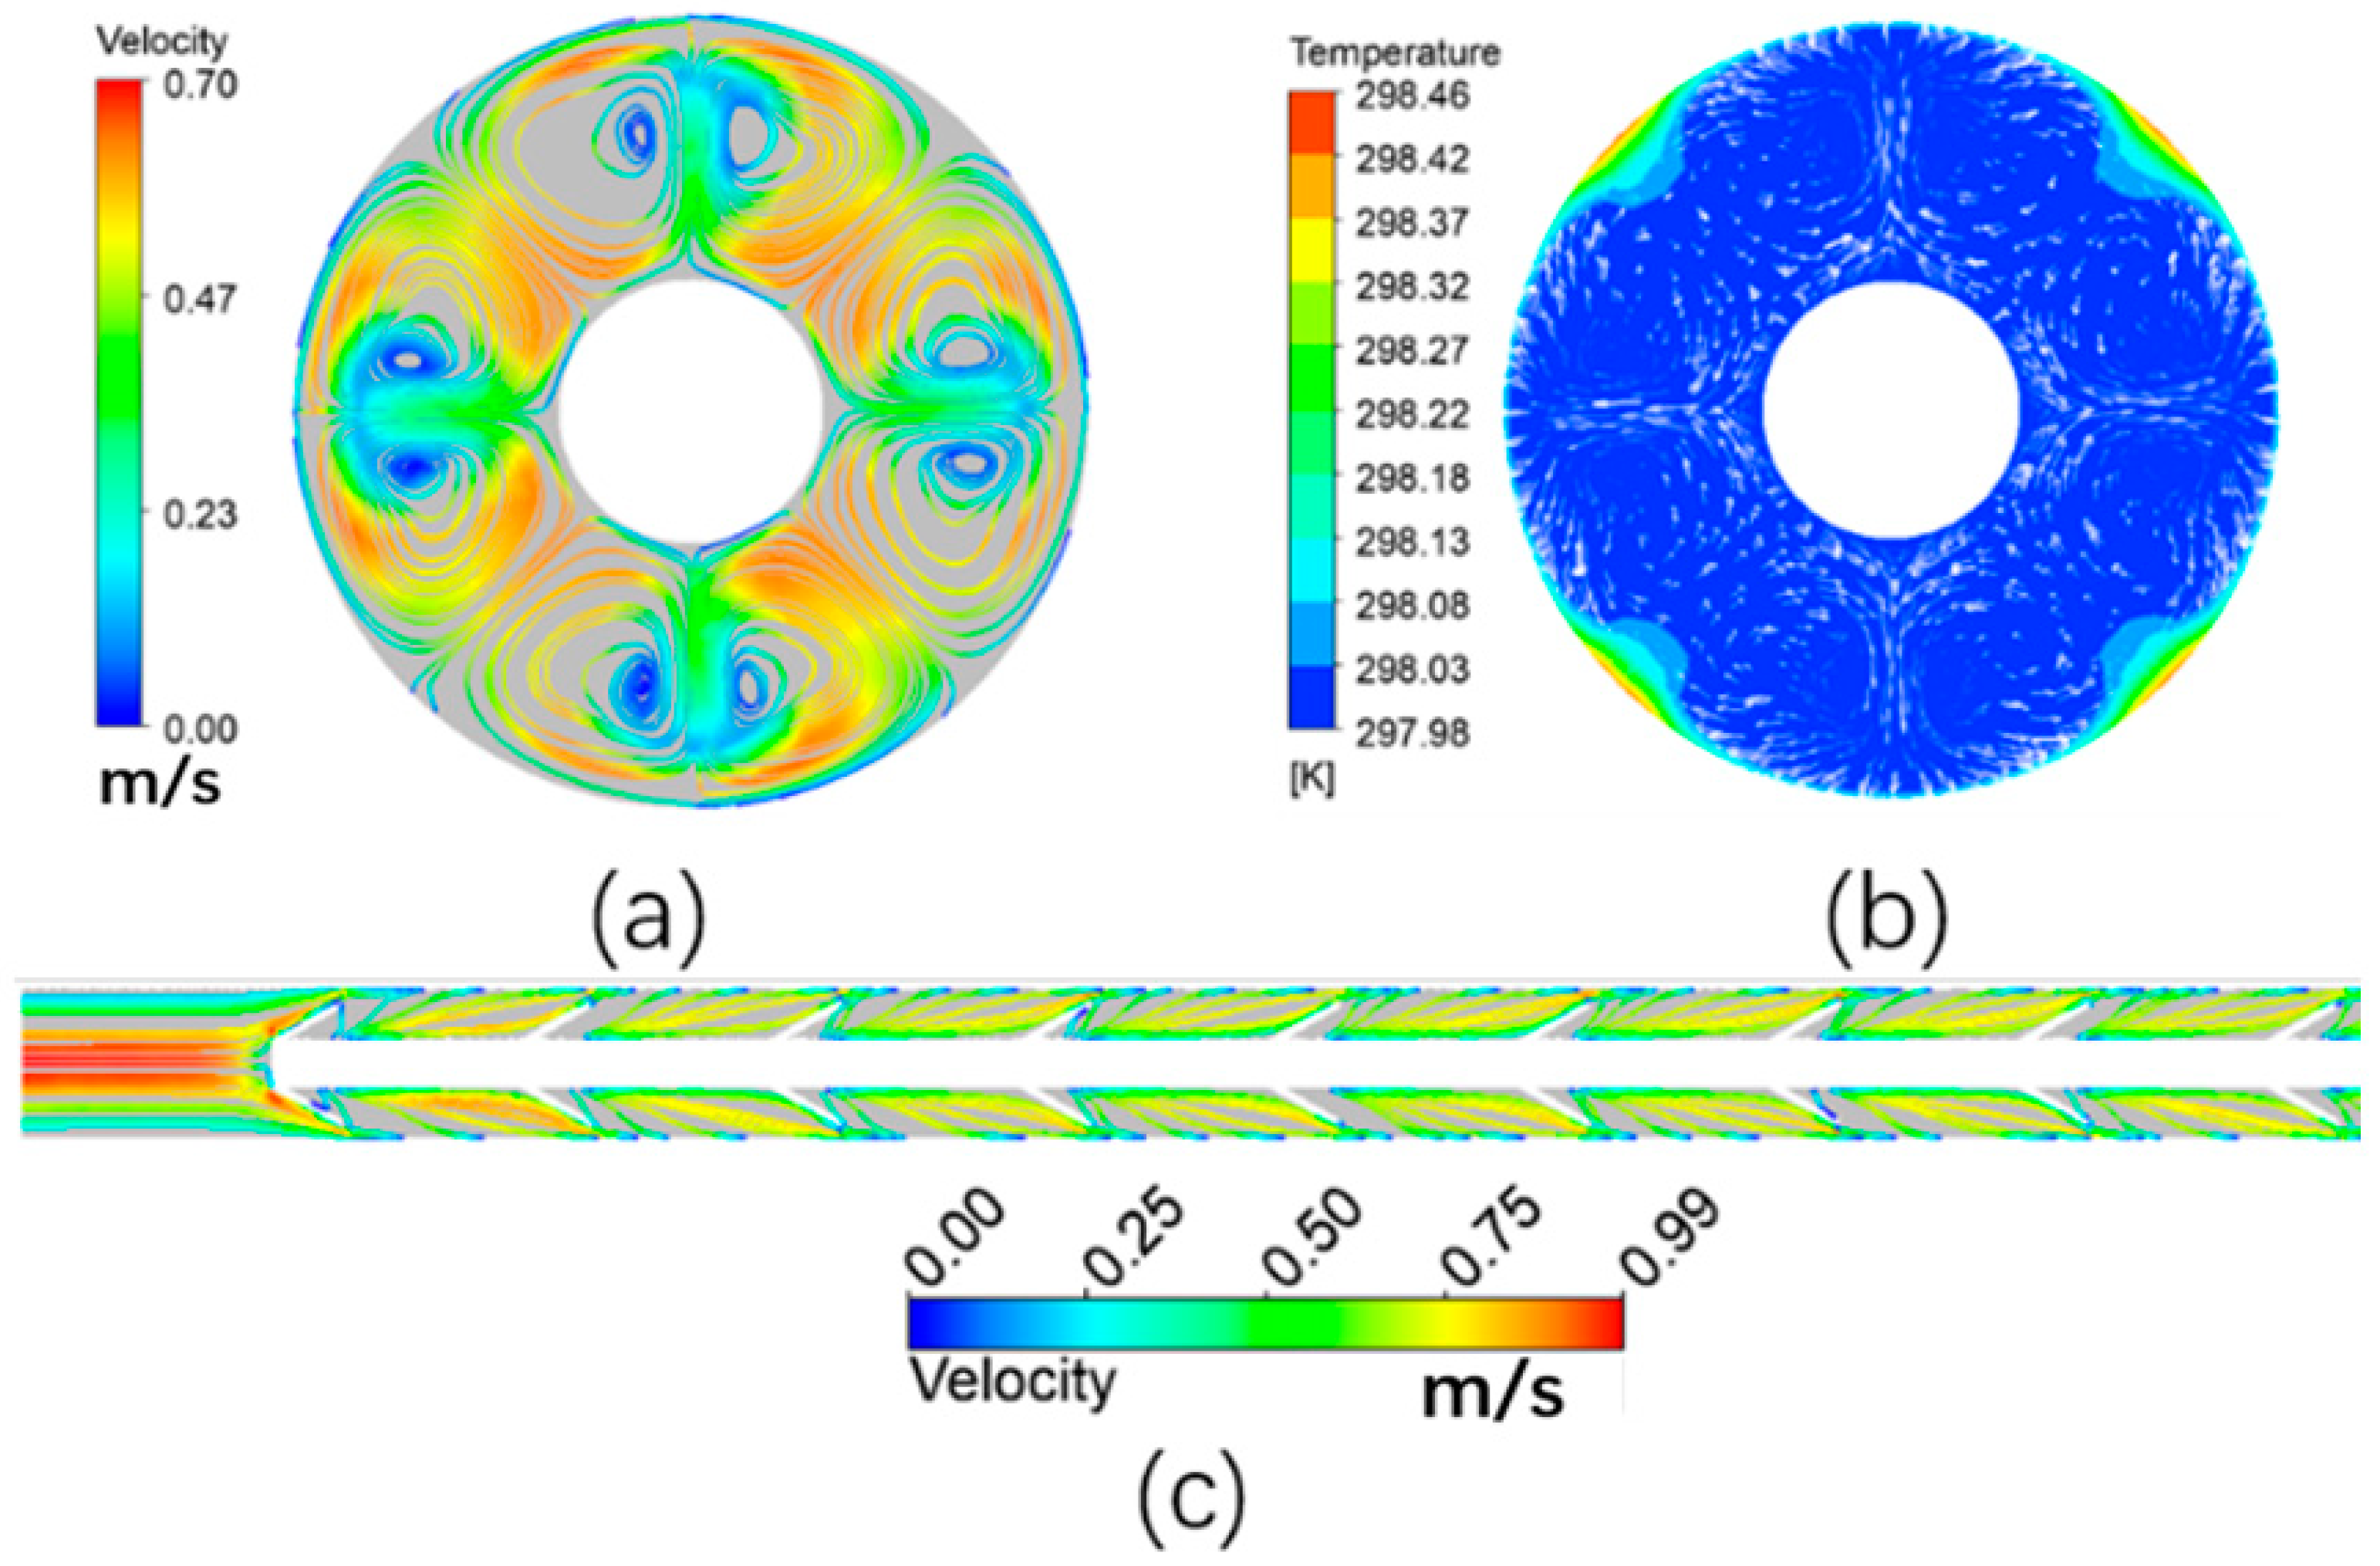
After determining physical properties and operation conditions, the main factor affecting heat transfer is the flow structure. In the heat transfer of the millimeter-scale reactor studied in this work, the main factors affecting heat transfer include vortex structure, deflection of flow direction, and local flow velocity. The insert can be used as a longitudinal vortex generator, and the enhancement of the longitudinal vortex for heat transfer has been discussed in much of the literature [33,34,35]. As shown in Figure 5, the four-bladed insert generates four pairs of vortices in opposite directions, which effectively thin the boundary layer of heat transfer and flow, and at the same time, direct the cold fluid at the center of the pipe toward the wall. The high-temperature fluid at the wall toward the center of the pipe extends the fluid’s flow length and makes the radial temperature distribution more uniform.
Unlike conventional scale pipes, the inner insert volume at the millimeter scale is generally not negligible. In this study, the volume ratio between the empty pipe and the deducted insert part is between 1.13 and 1.18, so the local flow rate is greater than the plain pipe flow rate, resulting in enhanced heat transfer and increased pressure drop.

3.1.2. Effect of Geometric Parameters

The geometric parameters studied mainly include the number of blades, blade pitch, and blade angle in this study. The interaction of the geometric parameters produces a complex flow field, leading to differences in pressure drop and heat transfer performance. Unlike the macroscopic scale results, the heat transfer capacity and a single geometric factor are not always monotonically related; they are influenced by the Reynolds number and other geometric parameters.

Number of Blades

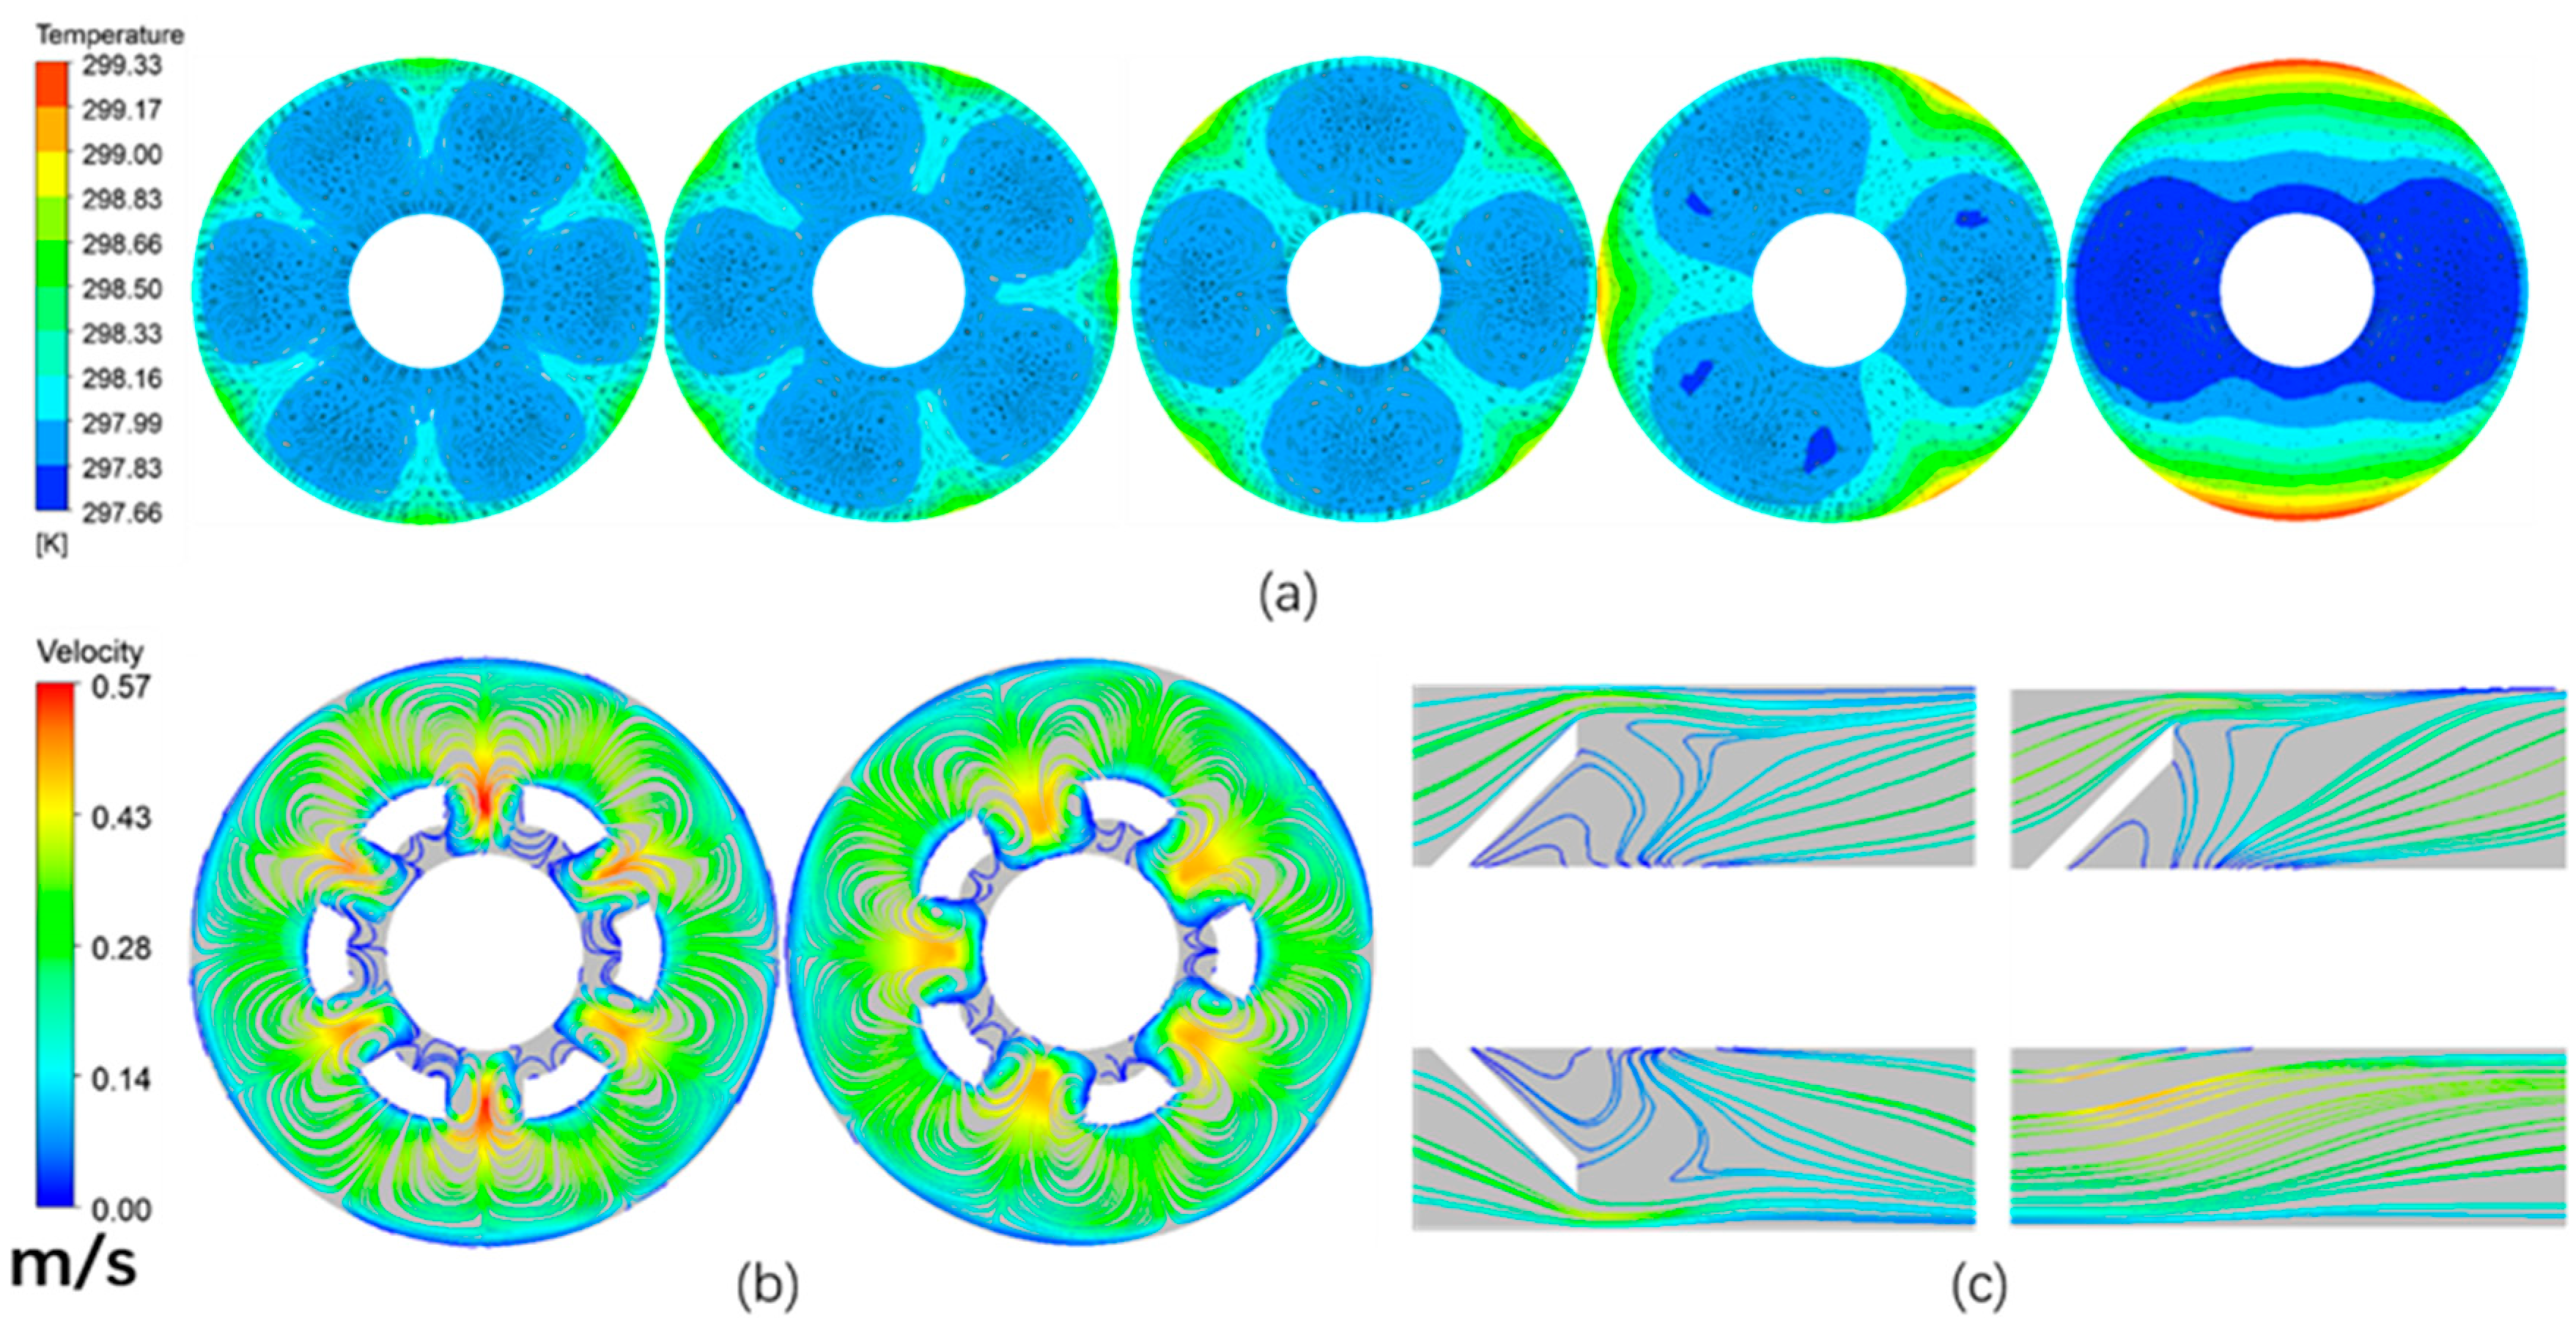
As shown in Figure 6, the Nusselt number increases with the number of blades in most of the region, which is in agreement with the results of the literature [28,36,37]. Figure 7a shows the cross-section’s temperature distribution and tangential velocity vector plot when z = 51 mm, R e = 200, pitch = 3 mm, and blade angle = 45°. Each blade can produce a pair of longitudinal vortices rotating in opposite directions, and the role of longitudinal vortices for heat transfer enhancement has been discussed in the previous section. Also, as the number of blades increases, the temperature gradient at the wall is greater, reducing the area of high temperature, while the cross-sectional temperature is more uniform. More blades produce more longitudinal vortex pairs, and the heat transfer capacity is increased. However, in some regions, the Nusselt number decreases instead when the blades are increased, mainly concentrating on Reynolds number Re > 600, such as in the five-blade to six-blade conversion. As in Figure 7b,c, flow field diagrams at pitch = 3 mm, n = 5, 6, R e = 600, inclination angle = 45°, 15th member axial cross-section and z = 50.4 mm cross-section. It is clear that dead zones and backflow are created at the back of the blades, and this axial vortex makes less cold fluid flow to the wall, reducing the velocity gradient at the wall, which leads to a decrease in heat transfer capacity. Compared to the five-blade, the six-blade has a stronger backflow due to the larger blockage area and denser flow lines at the back of the blade (closer to the center in the cross-sectional view).
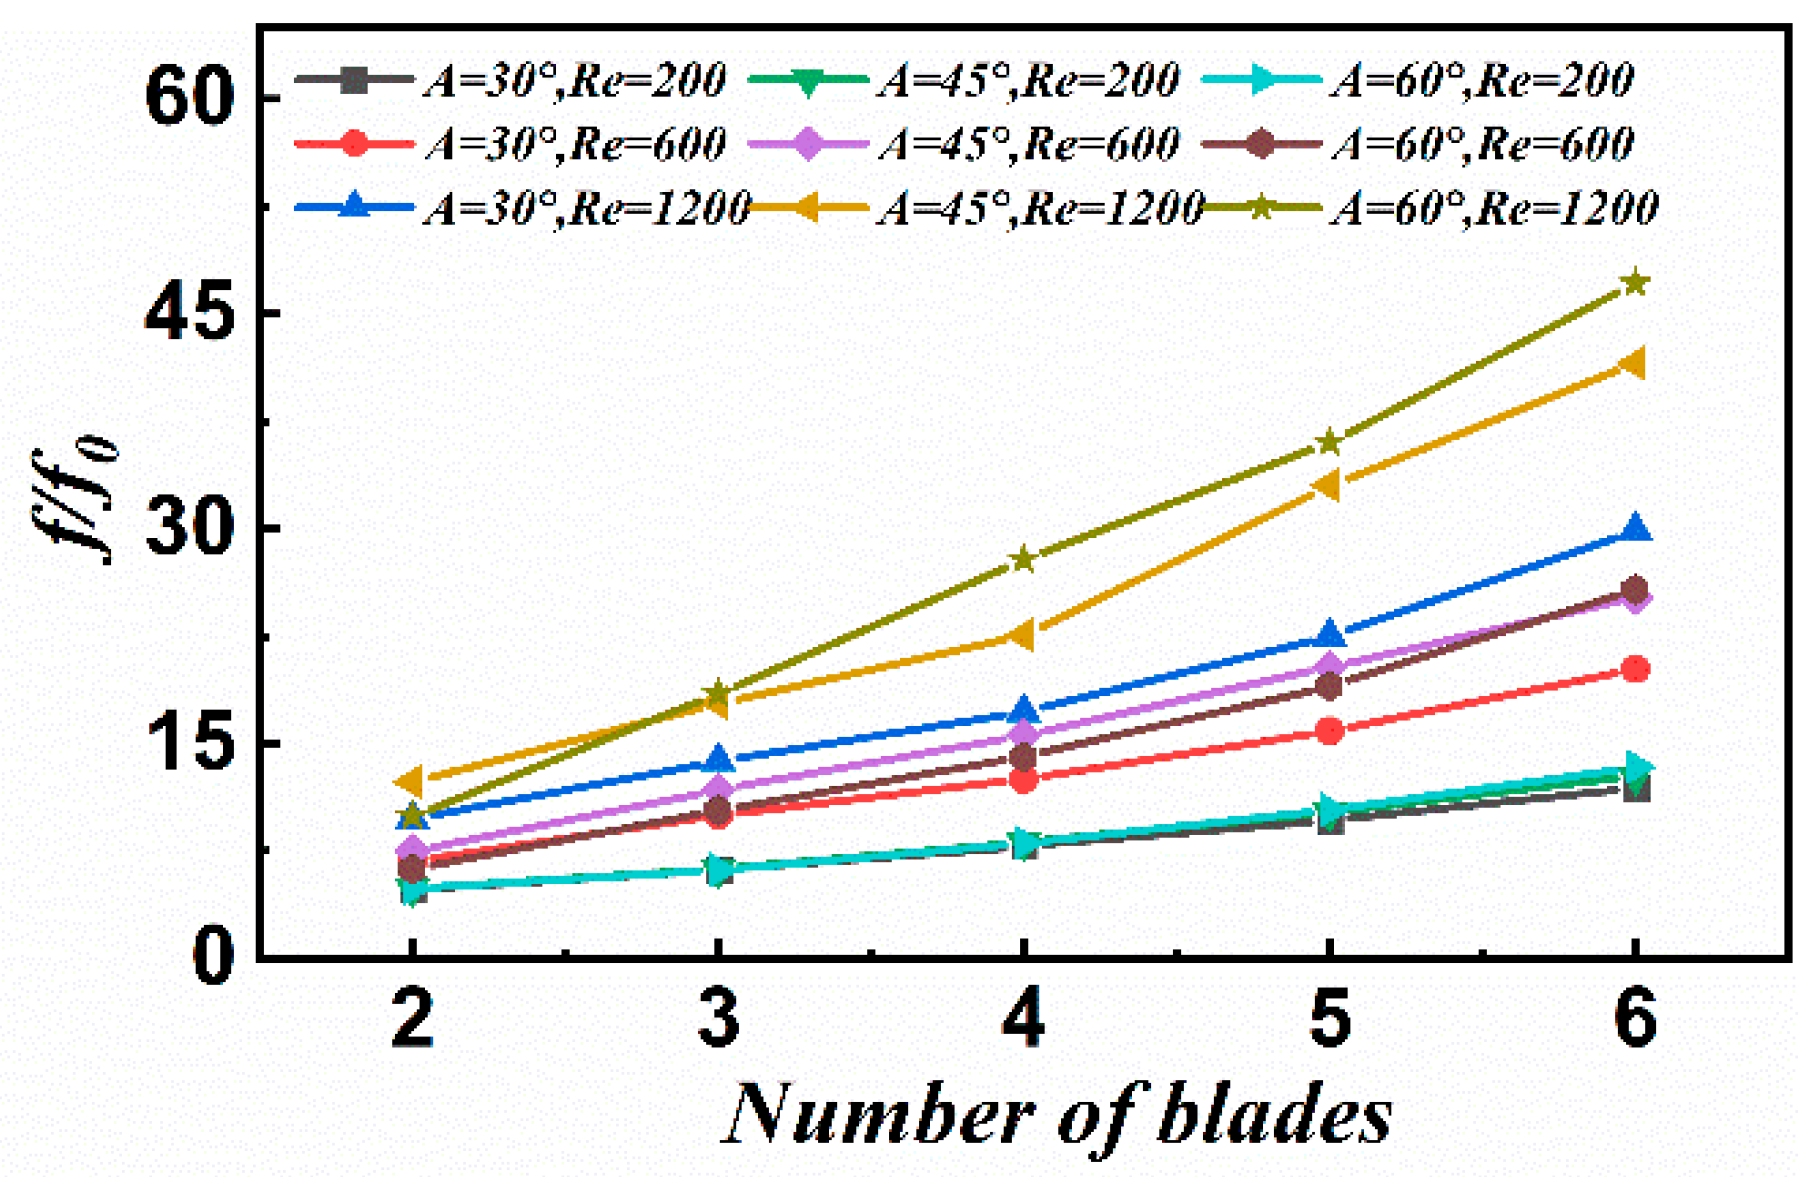
Due to the increase in the blades, the blocking area in the flow direction is larger, while more longitudinal vortices are generated, and these increase the resistance to flow, so that f / f 0 increases with the increase in the blades in all cases, as shown in Figure 8. However, as previously discussed, N u does not always increase with increasing vanes, so an optimal number of vanes exists for different operating conditions.

Angle of Inclination

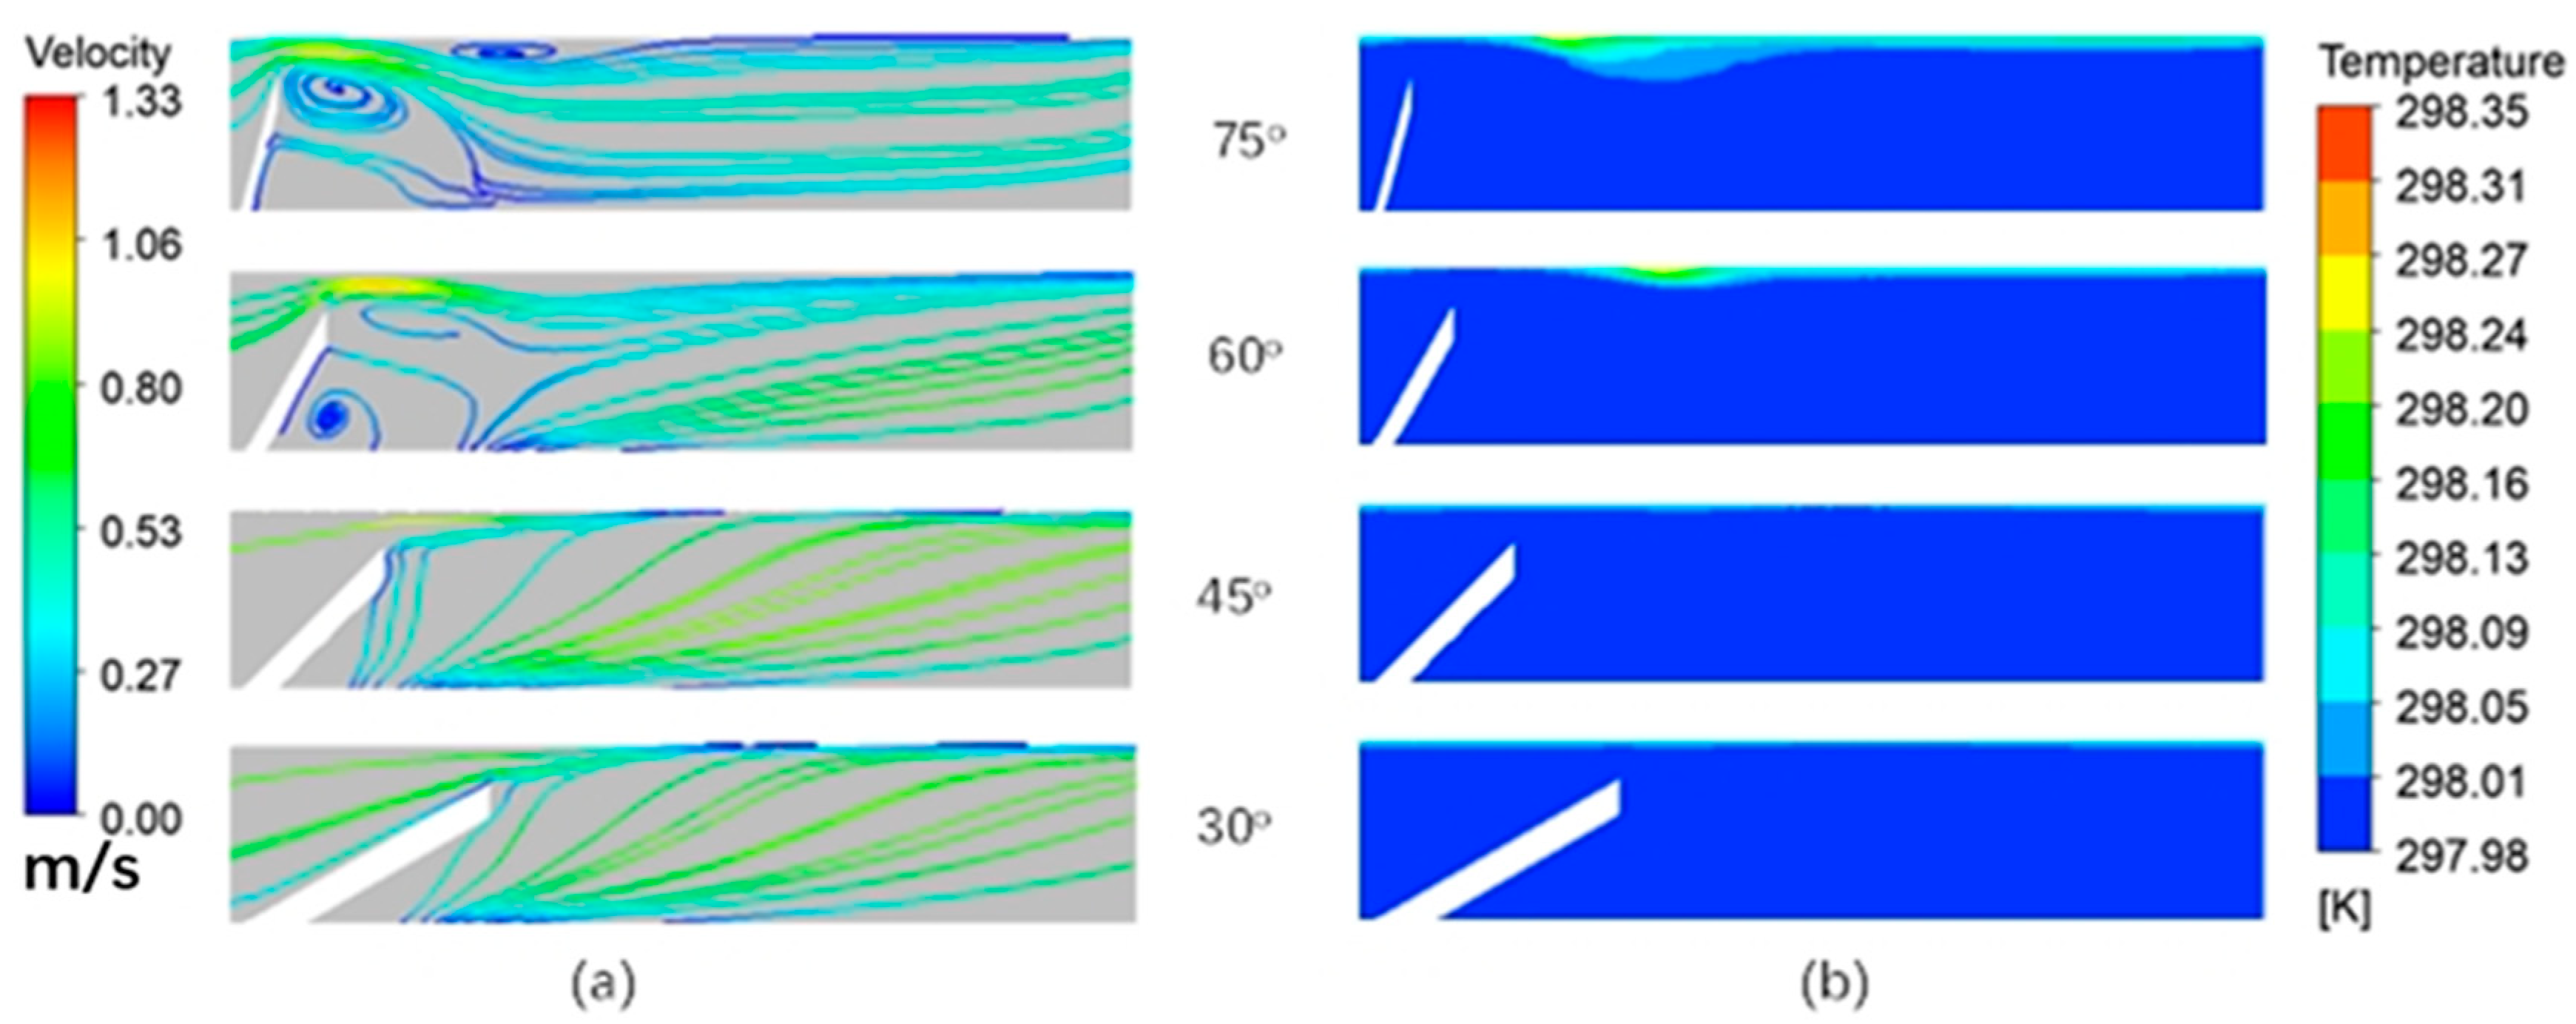
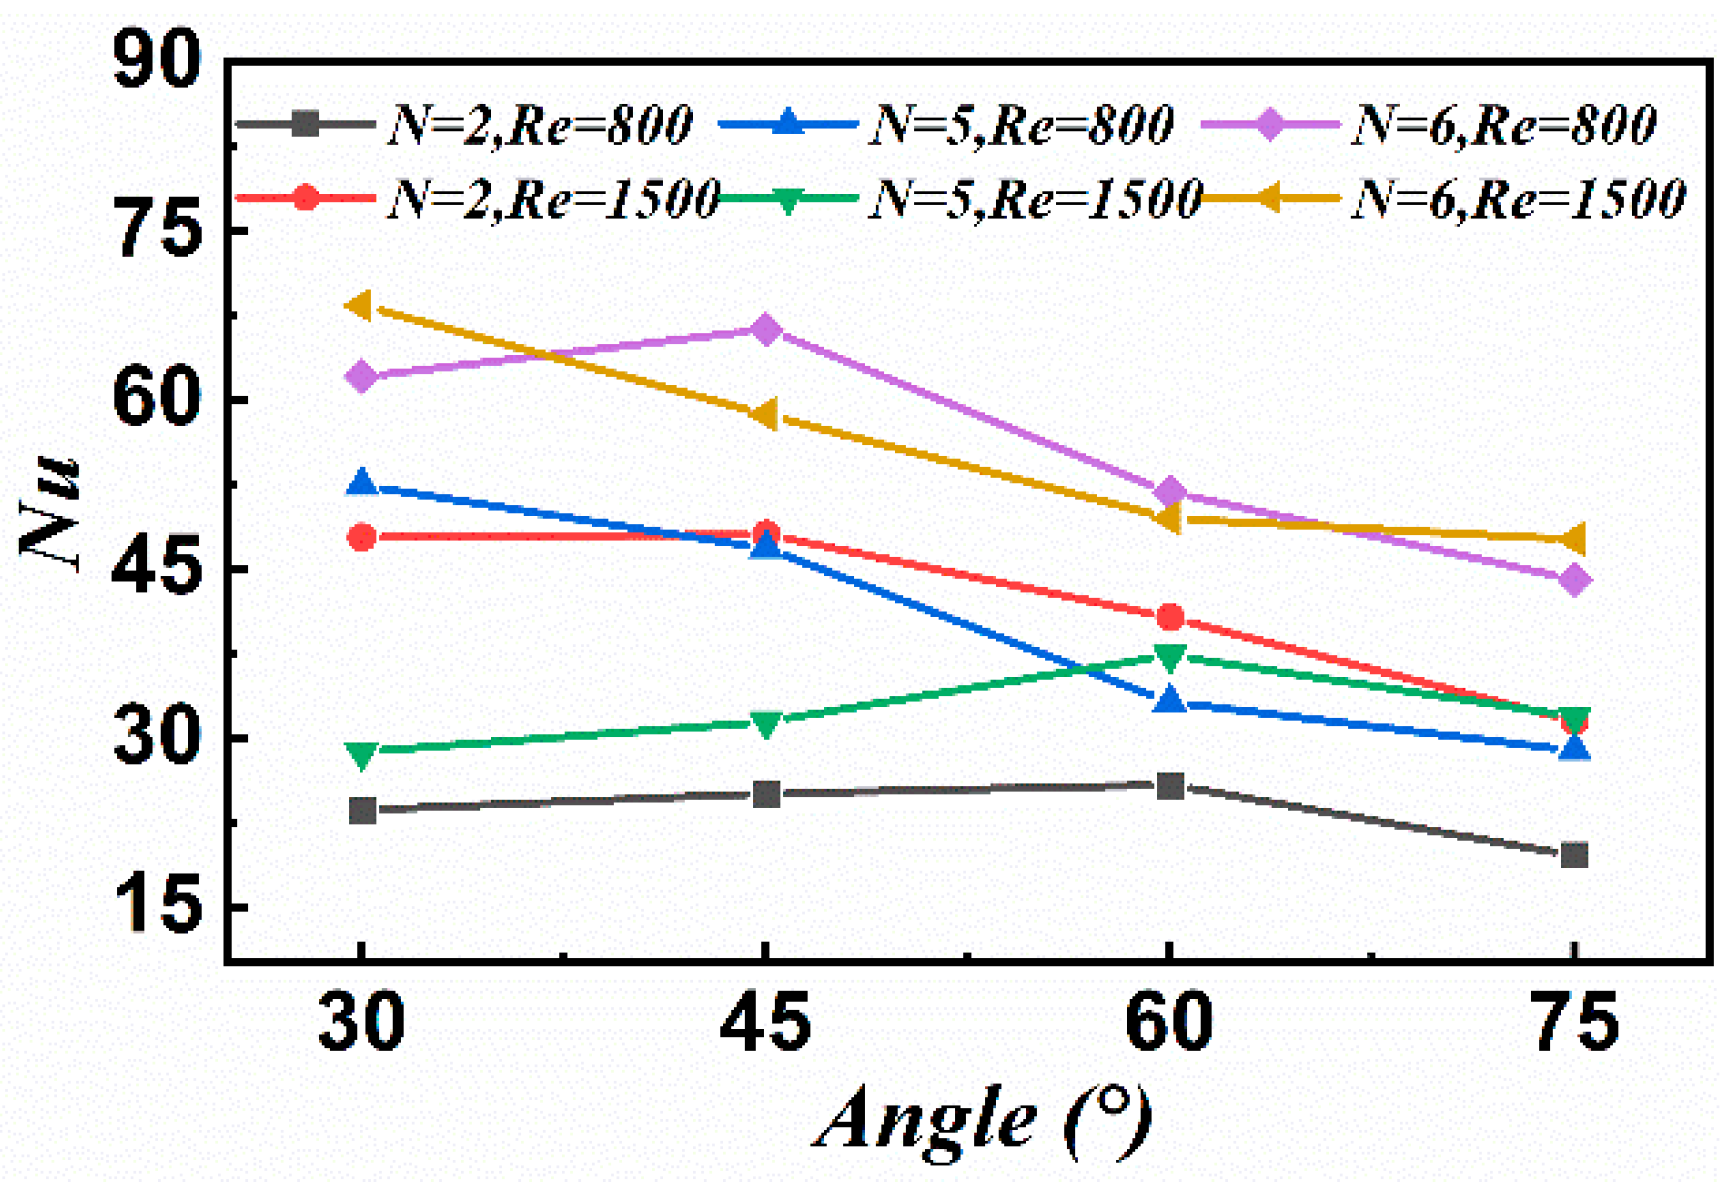
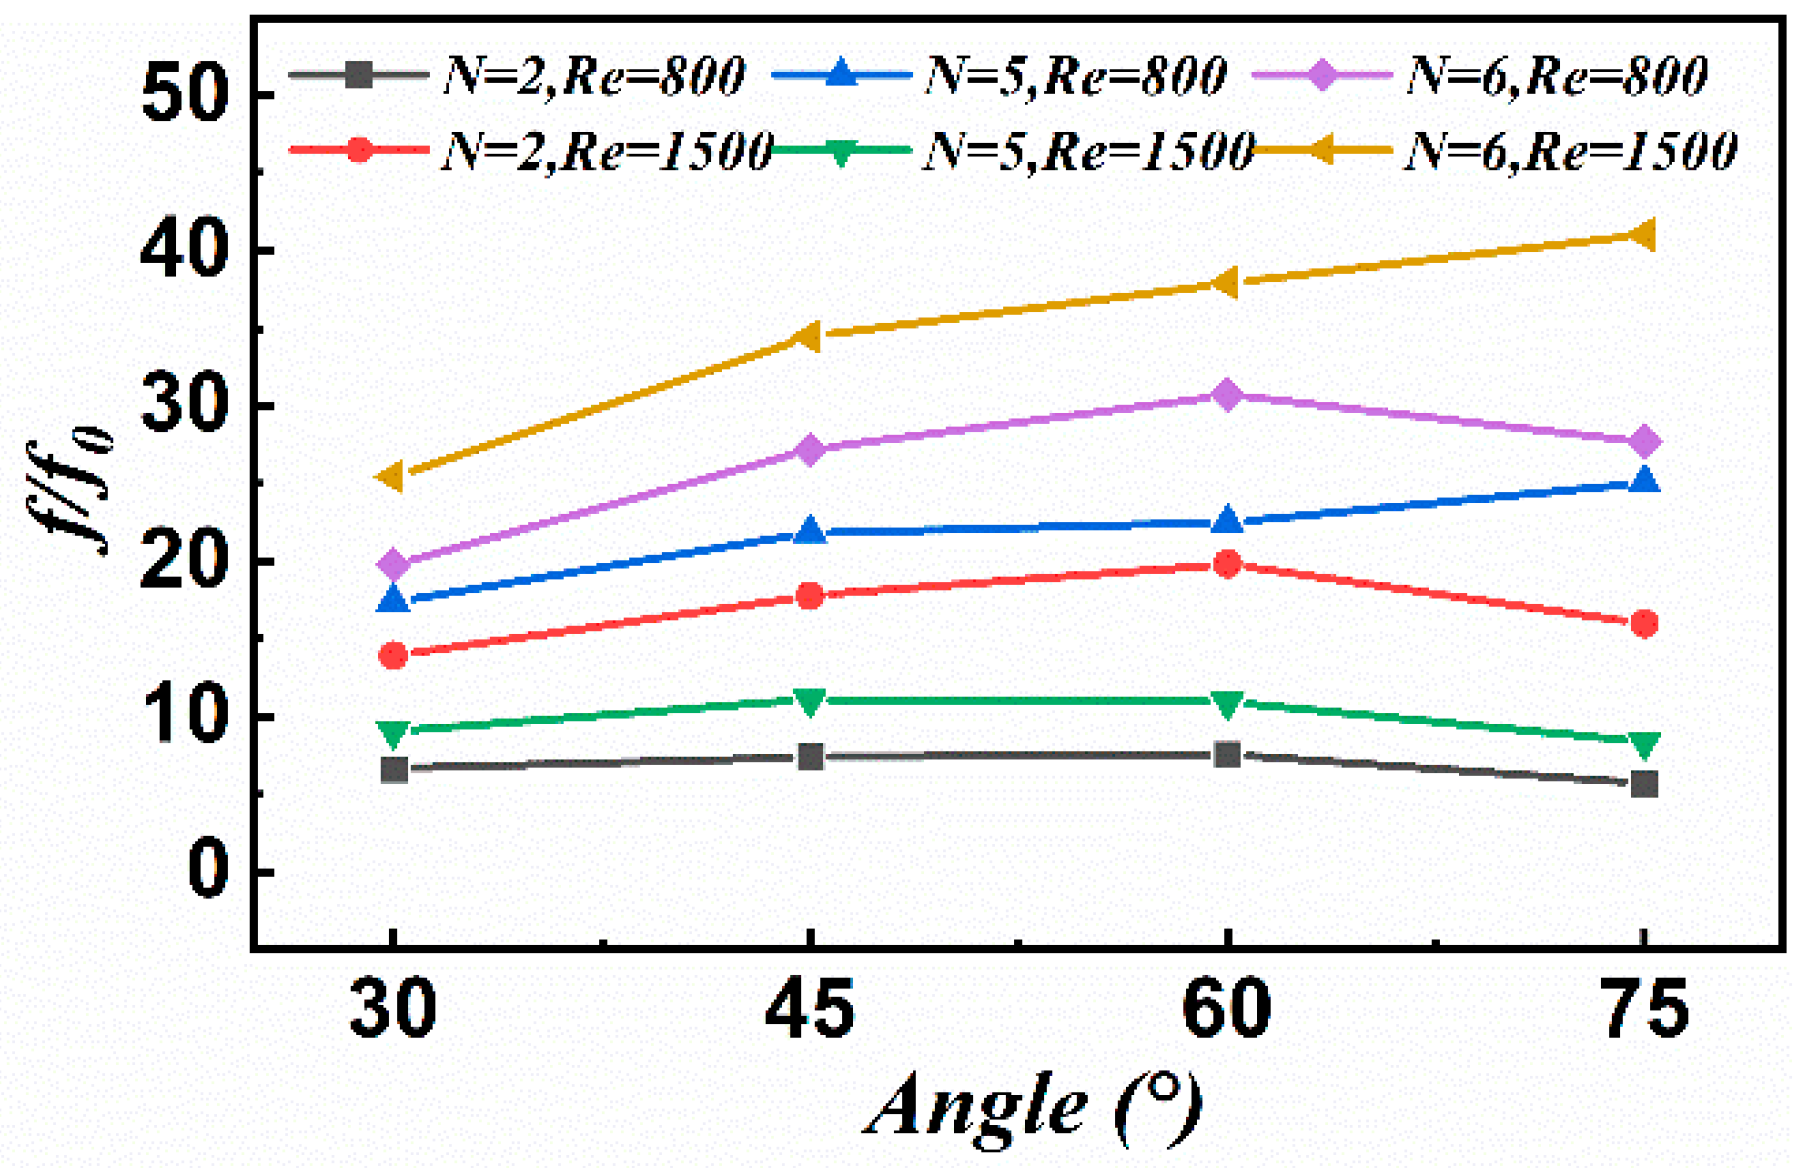
The effect of the inclination angle on heat transfer is not always monotonic for different cases. The blade inclination angle influences the flow and heat transfer in three aspects: (1) It increases the velocity gradient there, reducing the boundary layer’s thickness at the blade trailing edge, and producing a longitudinal vortex. Moreover, the greater the inclination angle, the stronger the effect will be. (2) It guides the fluid to the wall along the flow direction and improves the mixing performance between the hot and cold fluid. The blade length decreases with increasing tilt angle, which is detrimental to this factor. (3) It produces a transverse vortex and dead zone at the back of the blade, weakening the heat transfer. We found that a great blade inclination angle would produce a dead zone more easily, as in Figure 9. Factor 1 and Factor 3 have the opposite effect on the heat transfer, while the same effect on the pressure drop. At six blades, as already discussed above, the more blades will increase the dead zone area and the strength of the reflux Factor 3 becomes the main reason, with the inclination angle increasing heat transfer deterioration while causing greater resistance to flow, f / f 0 , with the increase in inclination angle and increase, as shown in Figure 10 and Figure 11. When the number of blades is five and R e = 1500, the Nusselt number increases with the angle, from 61.2 at 30 to 68.9 at 45°and finally decreases to 43.8 at 75. It reflects the competition between Effect 1 and Effect 3. f / f 0 has a maximum value at 60° because the backflow behind the blades dissipates more energy, while it is meaningless for heat transfer. When the number of blades is two, the maximum N u angle increases to 60° because the number of blades is small, and it is not easy to generate a dead flow zone. At this time, the strength of the longitudinal vortex becomes the leading cause of heat transfer enhancement. When the Reynolds number is low, the longitudinal vortex is more challenging to generate, and the increase in N u with the angle is not significant. At two blades, the fluid’s disturbance effect is limited, so that f / f 0 , although it increases with increasing angle (<60°), is not significant. For all cases, N u is lowest at 75° due to the large dead zone and backflow generated behind the blades, while the effect of directing the cold fluid toward the wall is reduced.

Blade Pitch

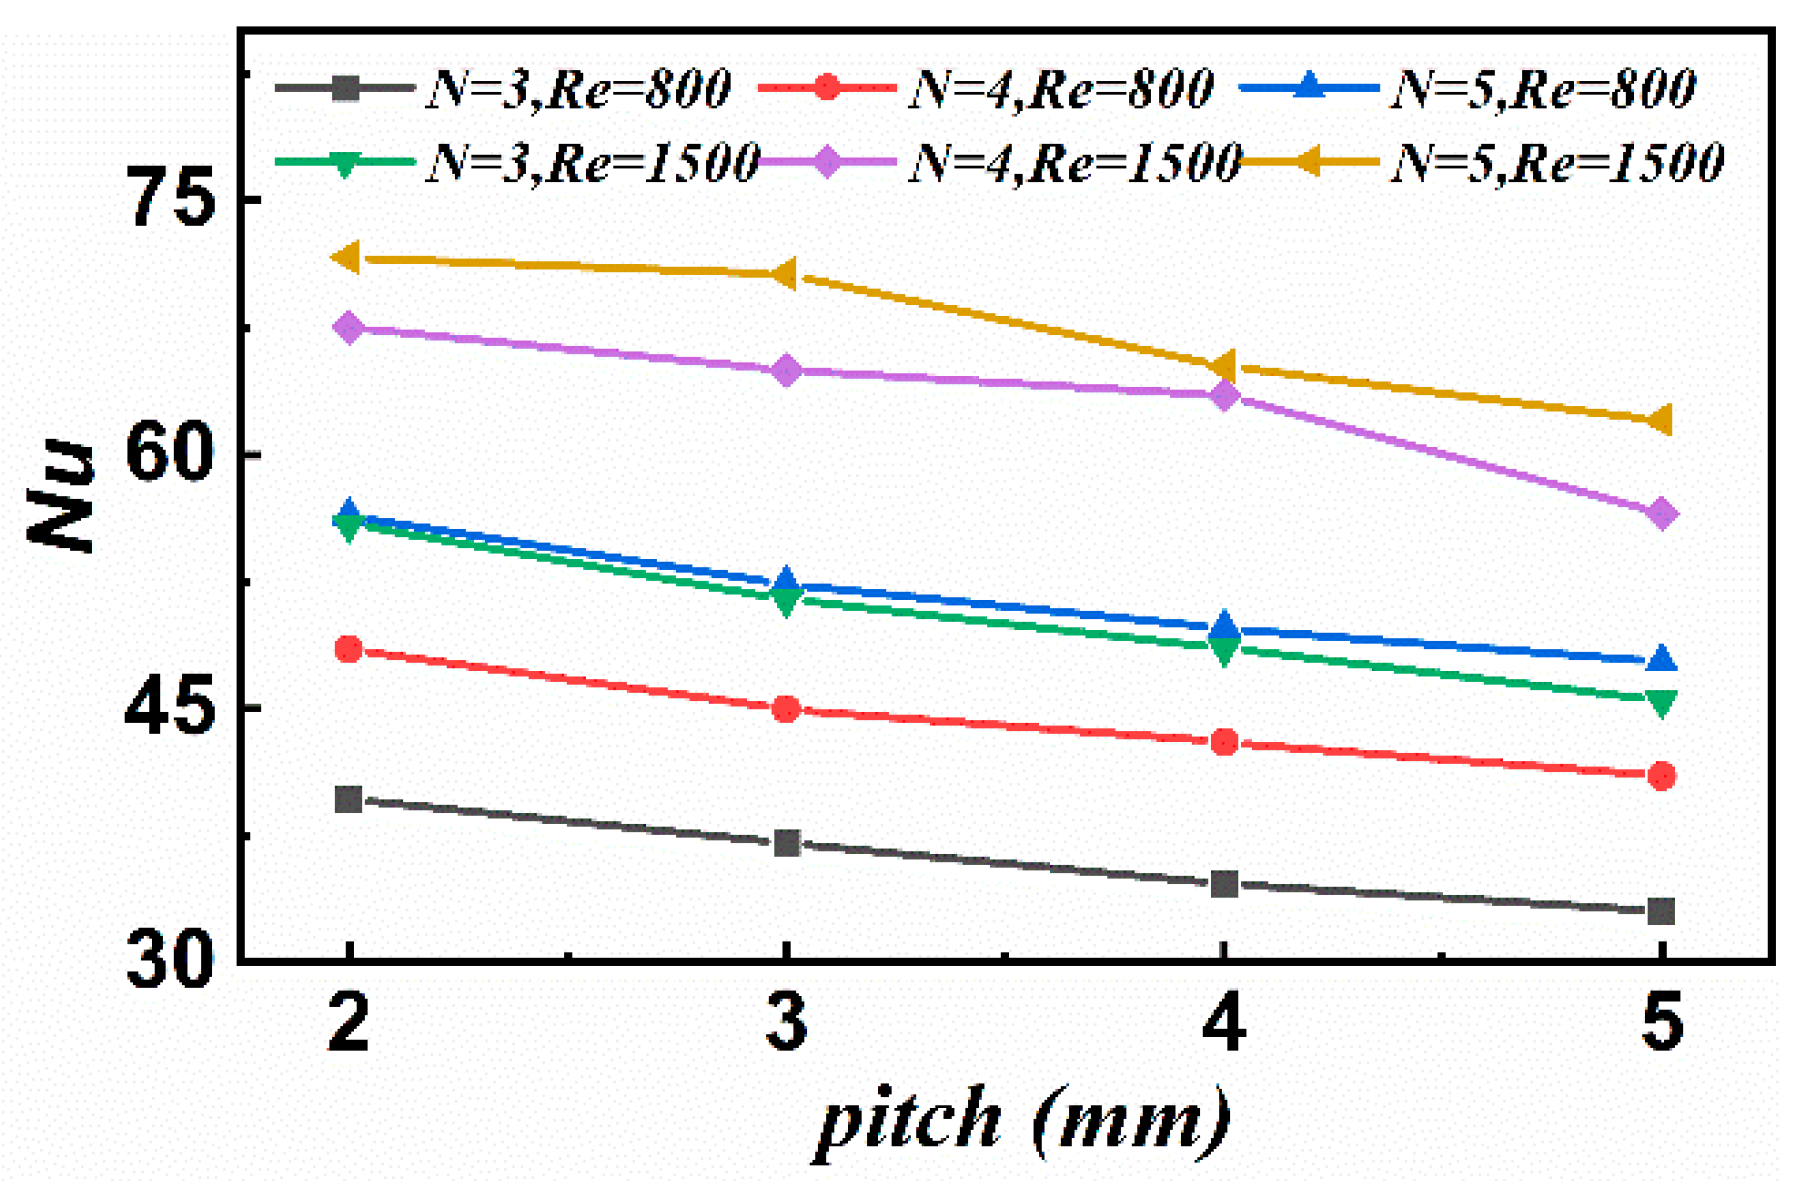
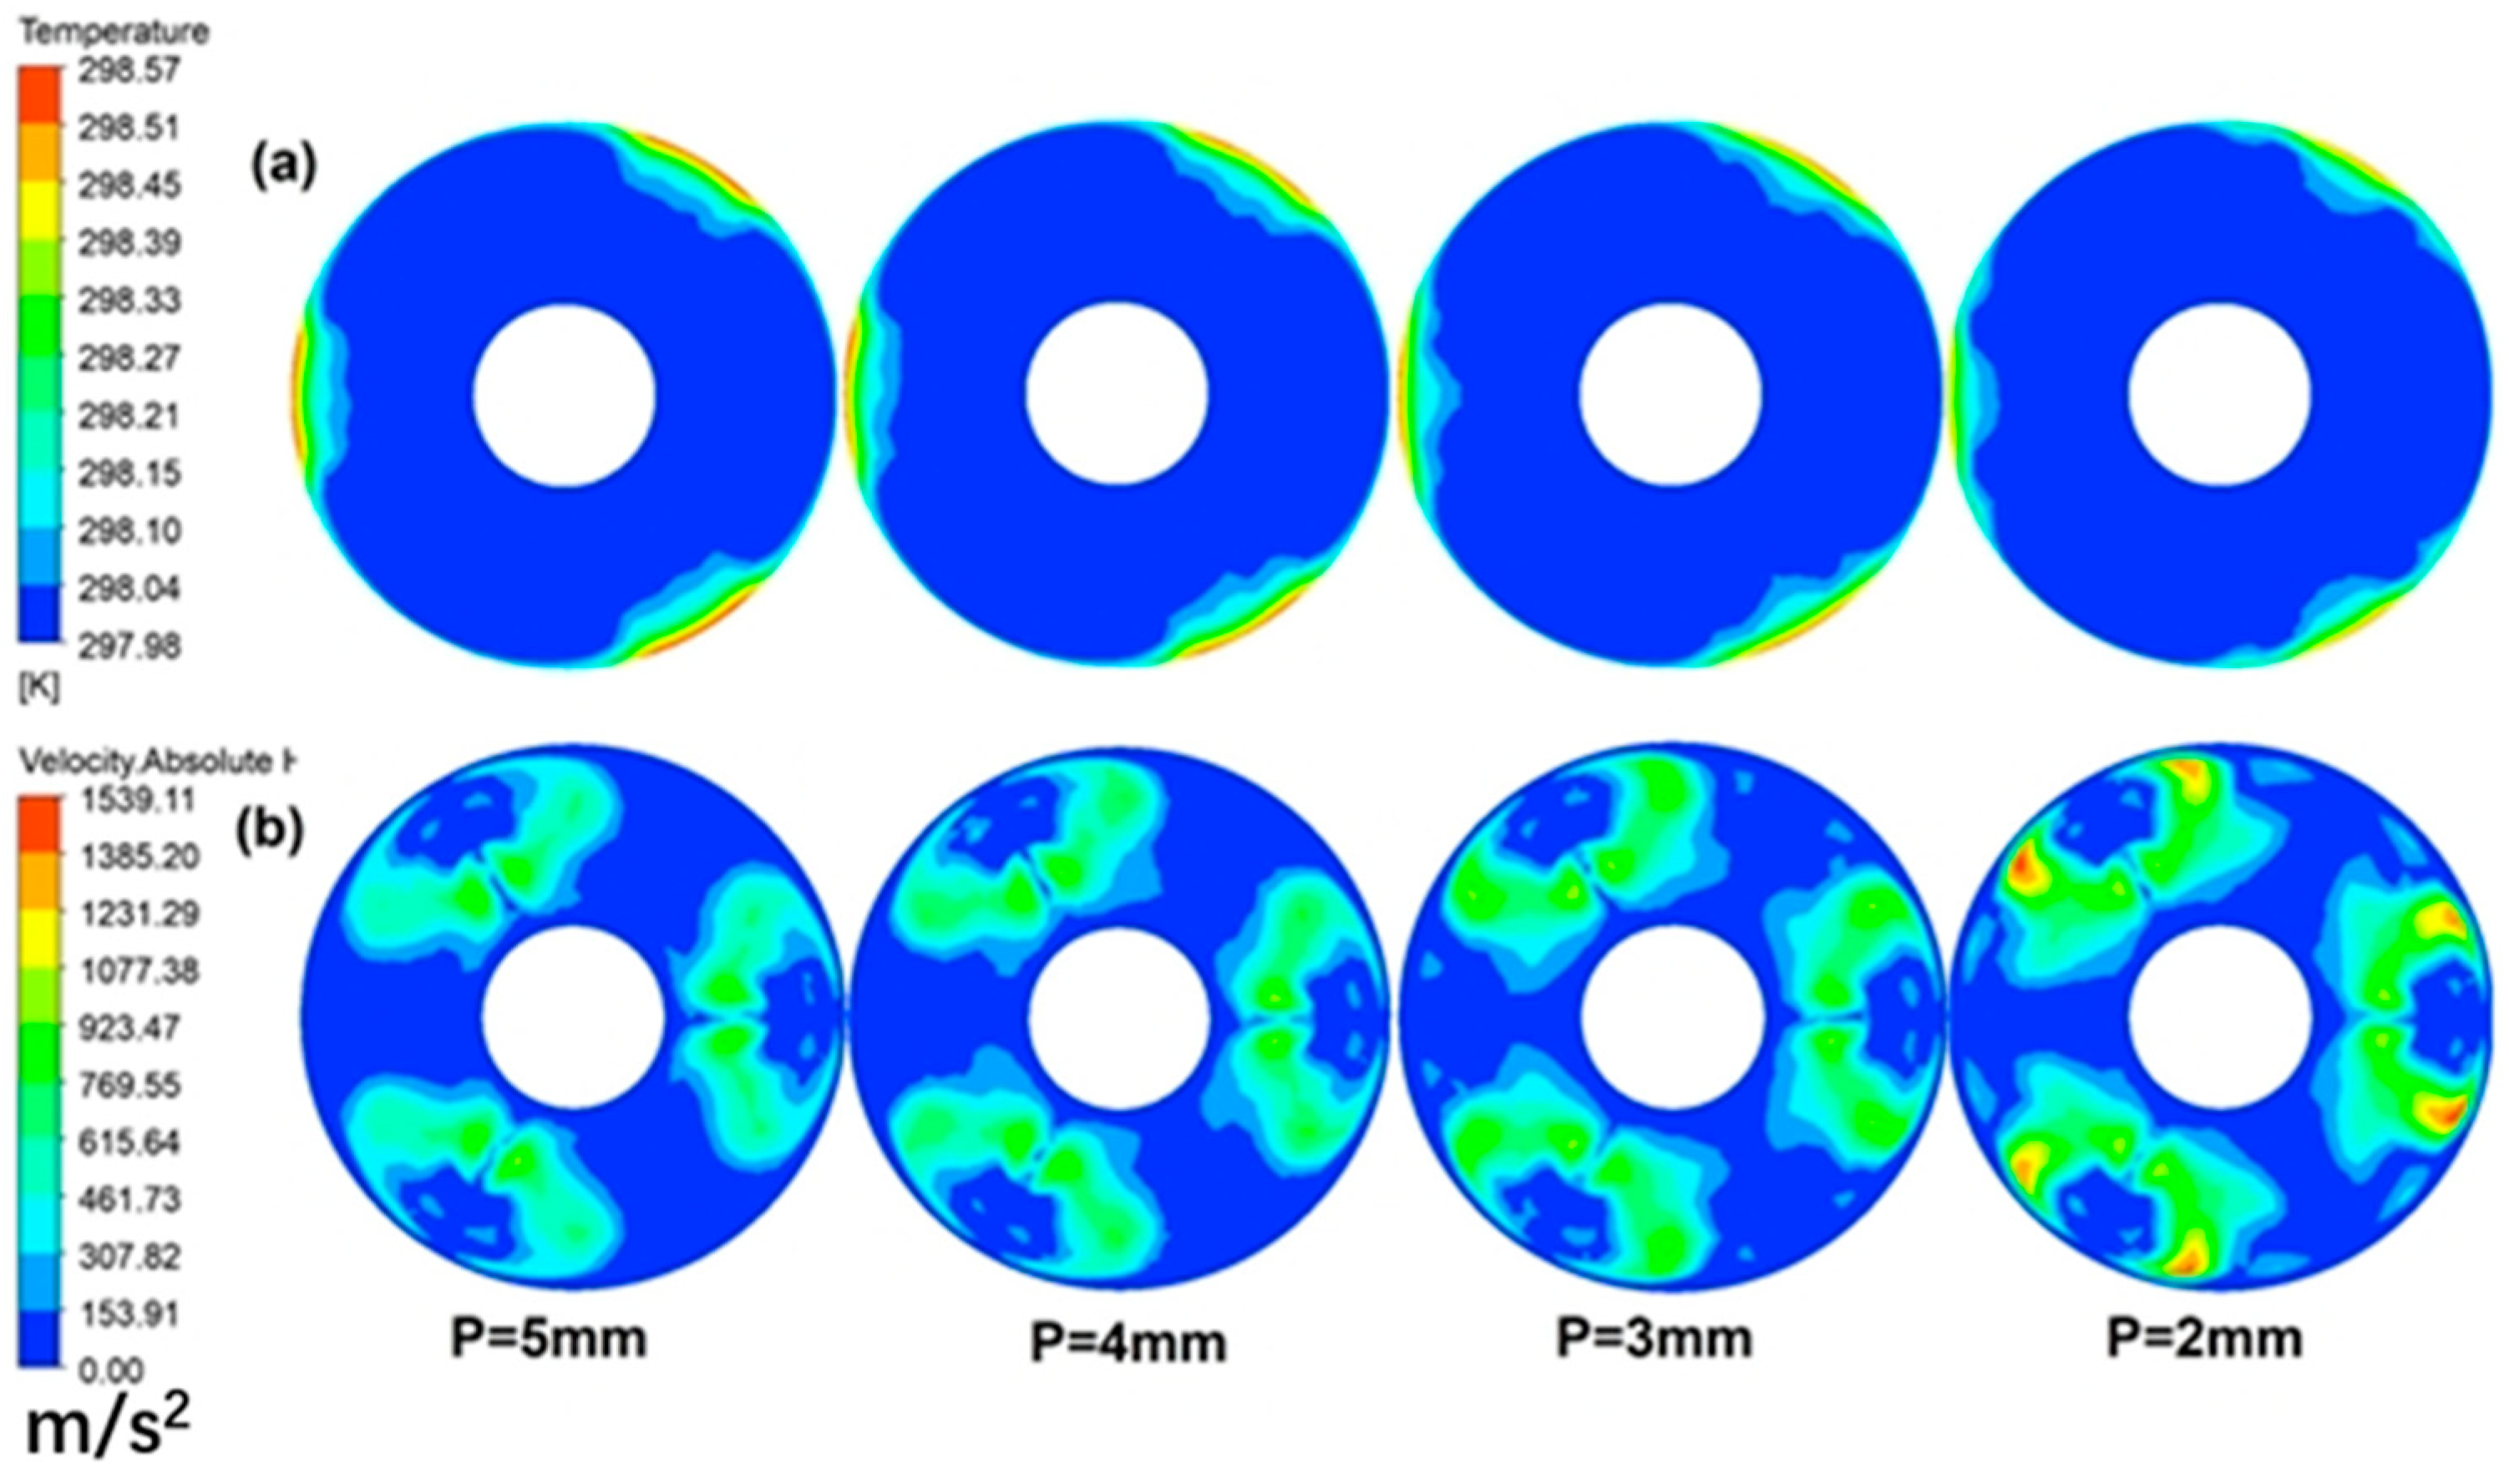
Both the Nusselt number N u and the pressure drop decrease with increasing pitch P, as shown in Figure 12 and Figure 13. The effect of P on the pressure drop is more significant than that of heat transfer. The fluid mixing between the boundary and the core region is adequate at the smaller spacing and higher vortex strength of the fluid, as shown in Figure 14, so that a more uniform temperature distribution can be obtained. More blades are inserted into the tube (with a fixed length) with a smaller pitch, so the number of longitudinal vortices per unit length increases, improving the longitudinal vortices’ strength.

Significance Comparison of Influencing Factors

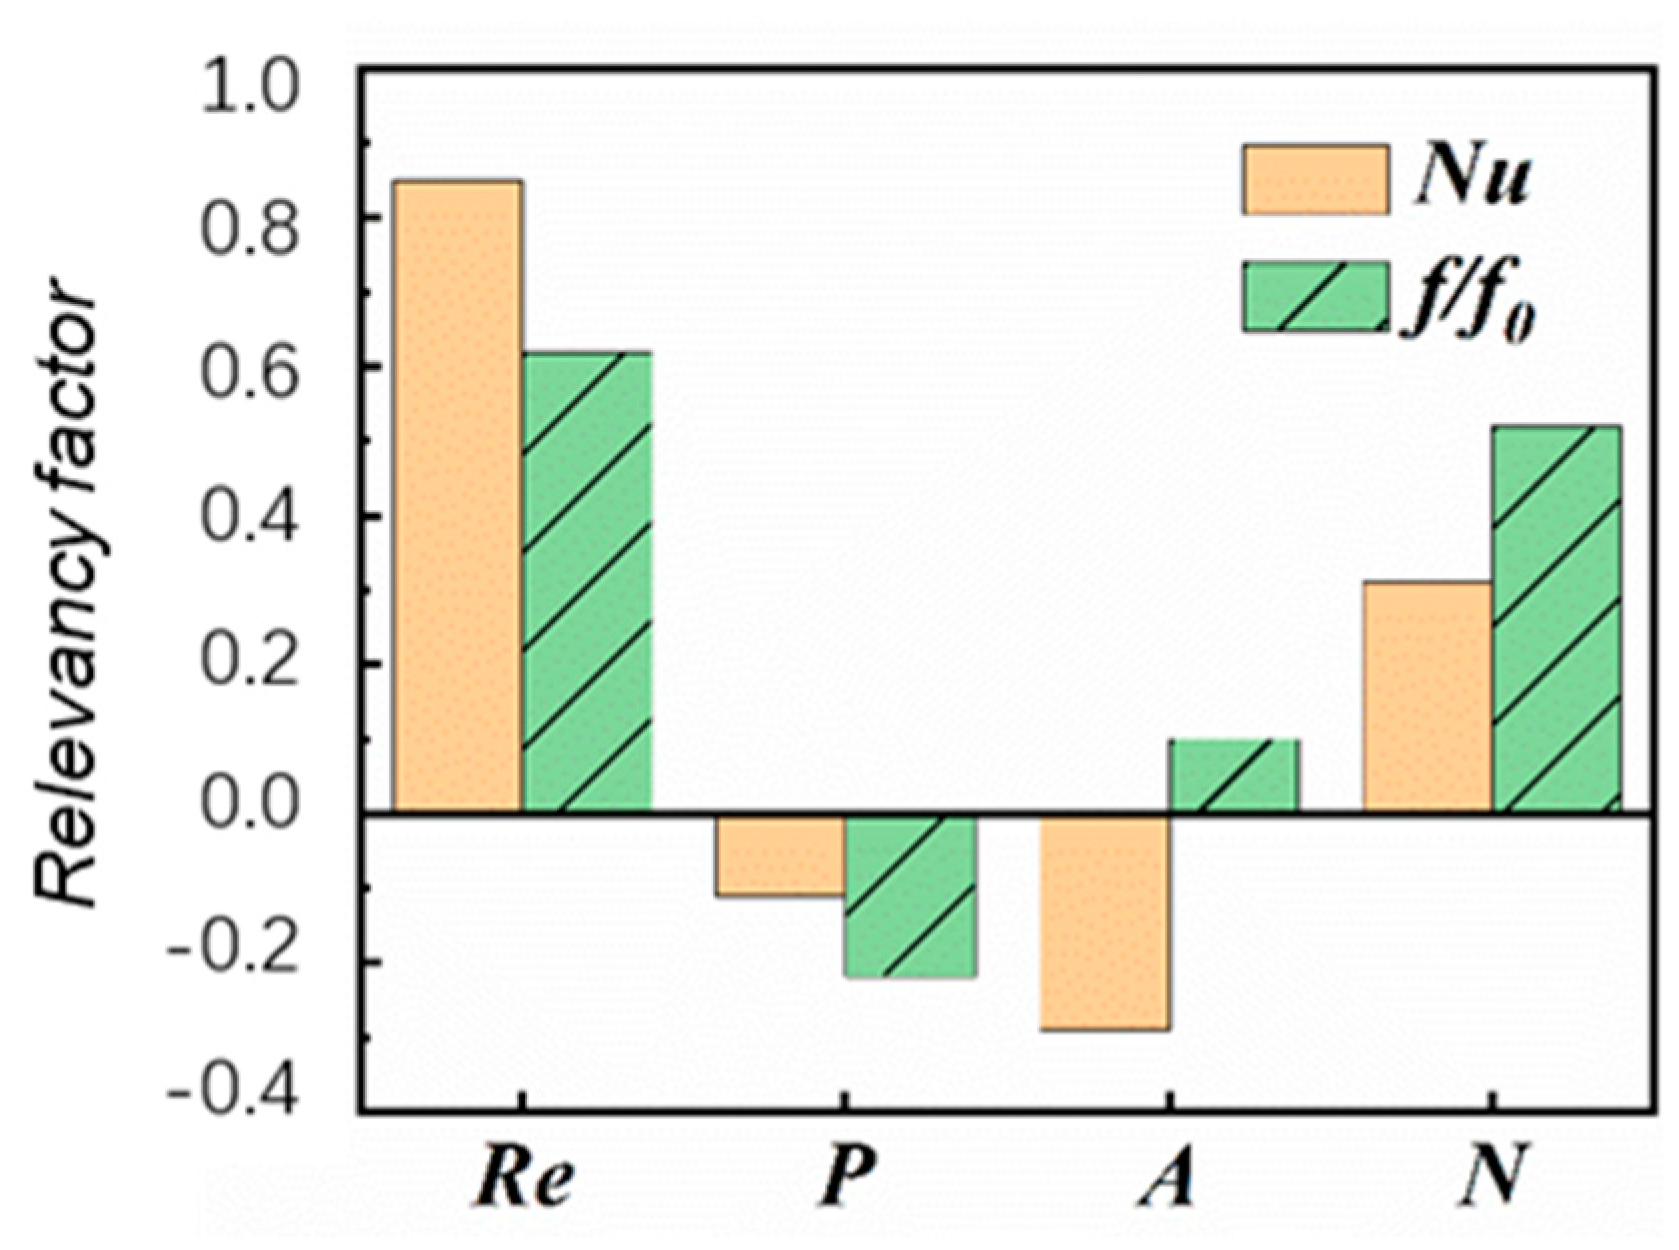
To analyze the influence of different factors on heat transfer and pressure drop, the CFD results were analyzed by partial least squares regression (PLS). For more information on PLS, see supporting materials [38,39,40,41]. The Reynolds number is the most significant factor affecting the heat transfer and pressure drop, far more than the structure parameters, as shown in Figure 15, since the flow velocity directly affects the intensity of the generated vortices and the thickness of the boundary layer. Among the structure parameters, the number of blades on the heat transfer and pressure drop is the most significant, far more than the other two factors; the spacing on the pressure drop is more significant than the heat transfer, so choosing a larger spacing is conducive to improving the economics of the process. The effect of the blade angle on heat transfer is negative, consistent because heat transfer is the worst in all cases at 75°. Also, since large inclination angles can cause unnecessary pressure drop losses, the recommended blade angle is 30° or 45°.

3.2. Comparison between Results from PIV and CFD

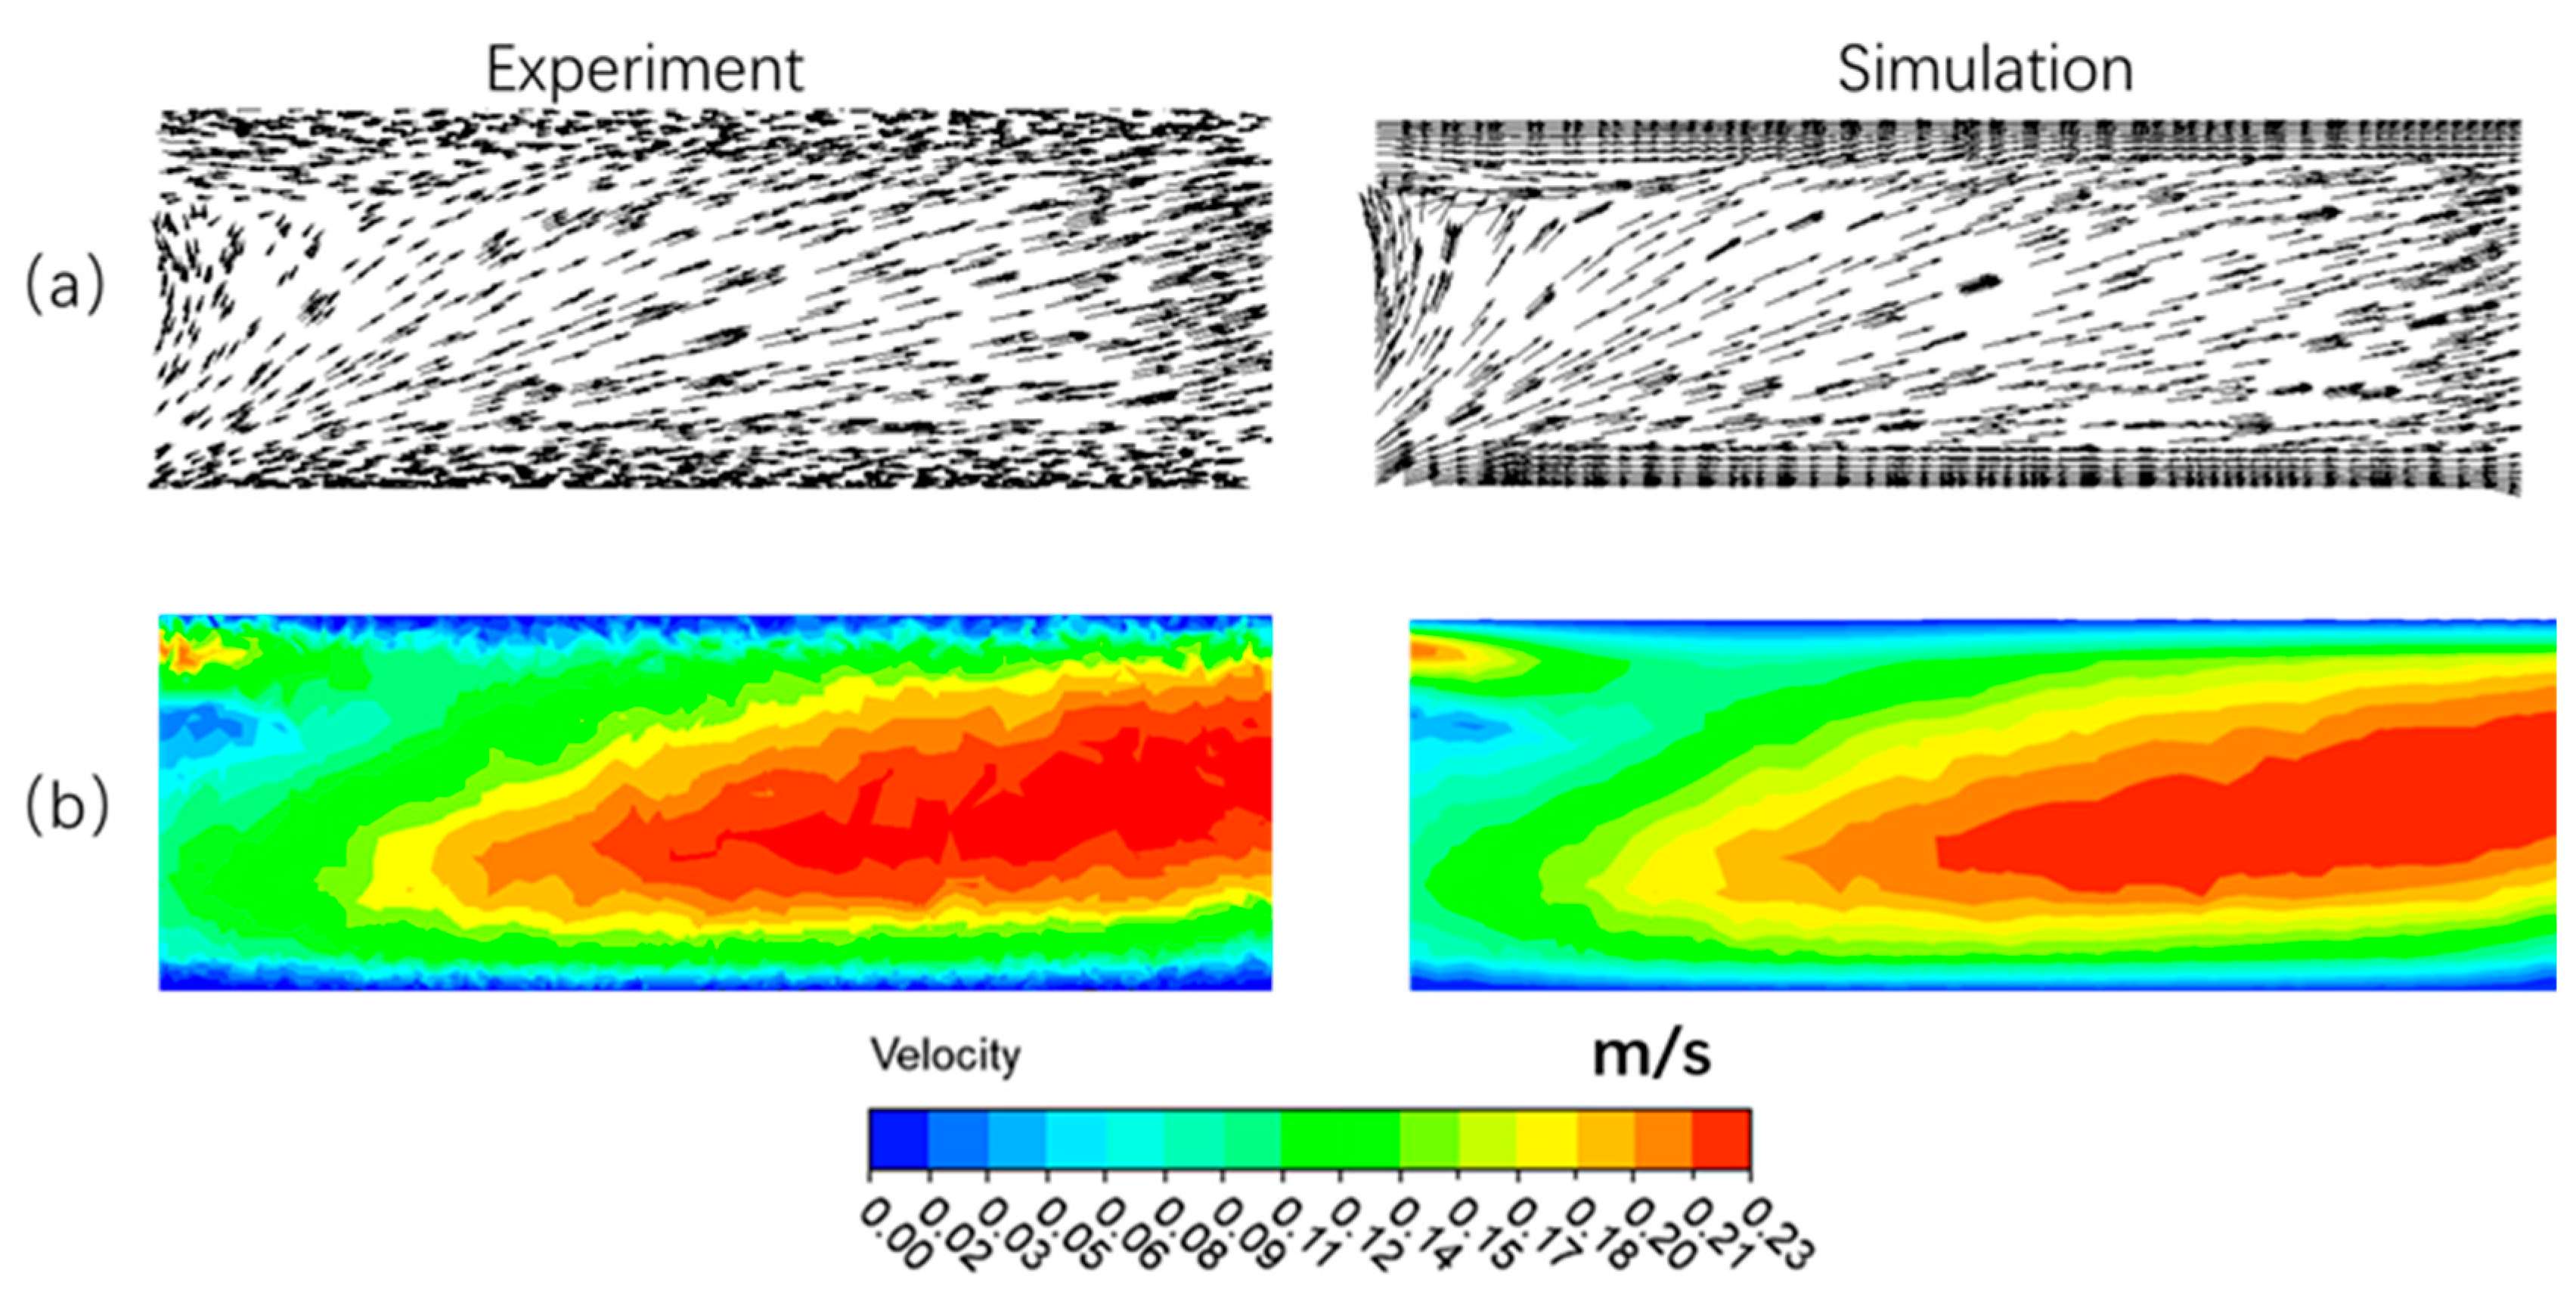
Due to the presence of the insert blocking the light, the plane chosen for the photograph was the upper part of the cross-section of the fifteenth element close to the blade. The fluid flow structures in the experimental and numerical results are generally consistent, as shown in Figure 16a. A significant backflow was generated at the rear of the blade, which caused a thickening of the boundary layer. Figure 16b compares the velocity components of the PIV experimental results with the numerical results, which are almost the same. Therefore, in the circular tube, the flow field obtained from the PIV experiment is consistent with the mathematical model’s flow field.

3.3. Neural Network Results

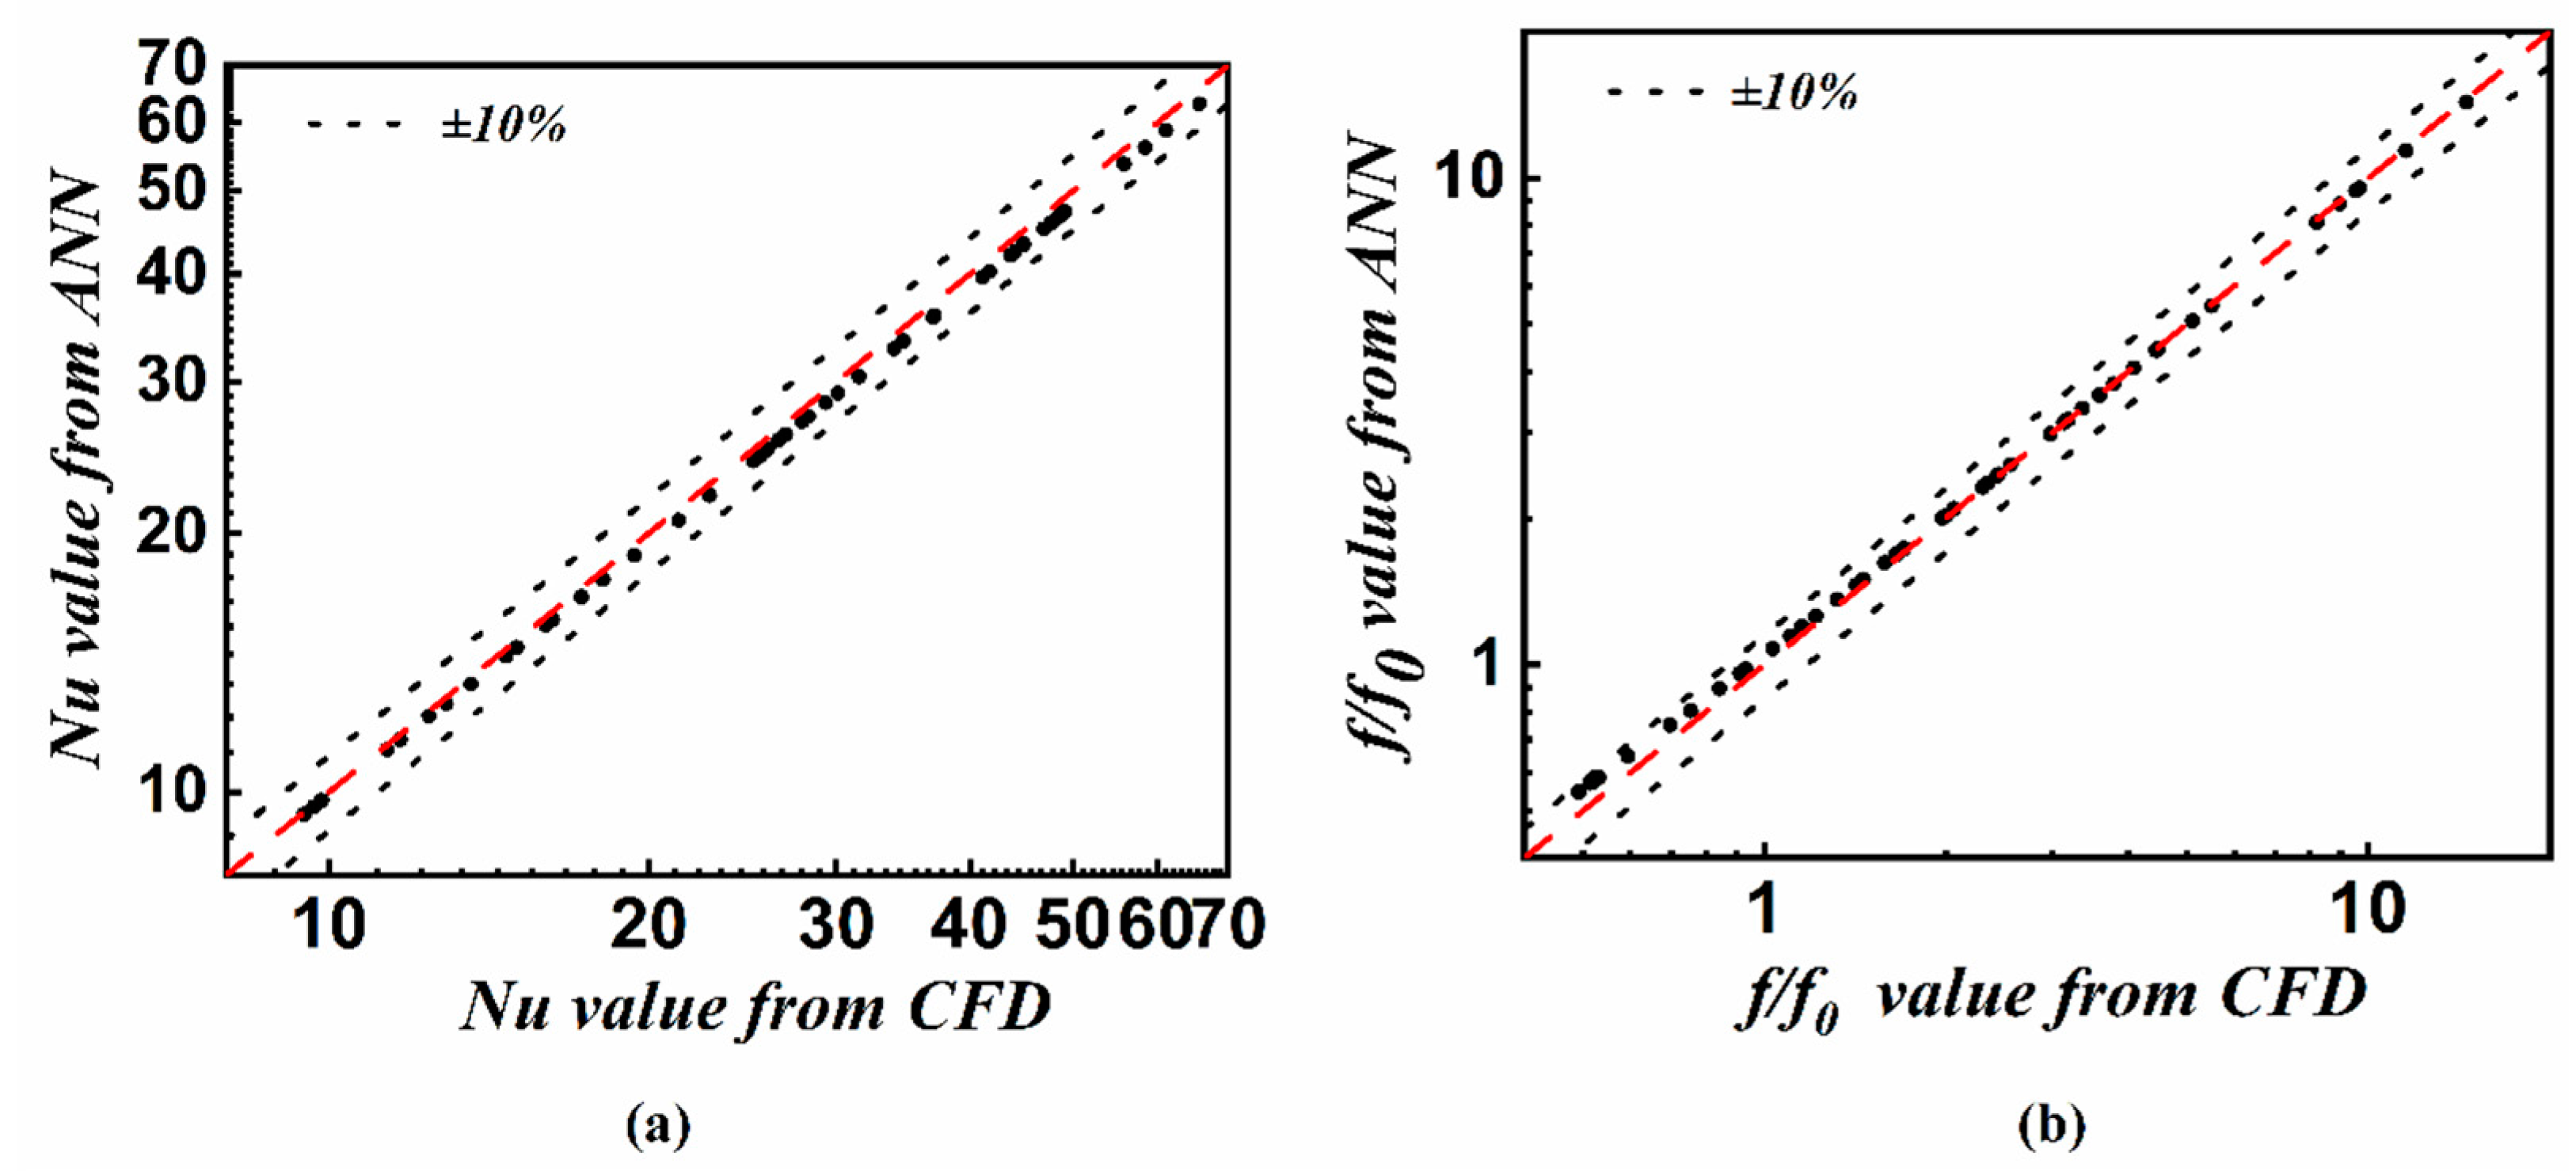
The data samples have two dependent variables that need to be predicted, so two ANNs need to be trained. The number of hidden layers is taken as one and two, and the number of neurons in each hidden layer is one to fifteen. Finally, after different combinations of parameters, two hidden layers with 10 and 7 neurons get the most minor mean square error loss, corresponding to MSNs of N u and f of 14.57 and 0.12, respectively. The maximum relative errors of N u and f / f 0 are 6.54% and 9.13%, respectively. (Figure 17) shows the CFD and ANN results, and the difference between the ANN- and CFD-calculated values of N u and f is within ±10%. Therefore, the whole ANN satisfies the requirements.

3.4. Model Reaction Case

A typical metal–organic synthesis reaction reported in the literature was selected as a model reaction [21]. The kinetic and physical parameters of this reaction were as follows: first-order reaction, reaction enthalpy −180 kJ/mol, half-life 5 s, activation energy 60 kJ/mol, feed concentration 1 mol/L, fluid heat capacity 1 kJ/kg/K, fluid thermal conductivity 0.2 W/m/K, fluid density 1 kg/L, viscosity 1 mPa. The adiabatic temperature increase was 300 K. The reaction temperature was 273.15 K and the cooling water temperature was 263.15 K. By using the Equations (10)–(22), the critical N u c of this reaction can be calculated as 54.2. By Equation (26), it is corrected to a target N u of 57.8 with water as the working medium. Assuming a residence time of 25 s for the reactants in the pipeline, the theoretical conversion under ideal conditions is 96.9%. Finally, by minimizing the pressure drop as the target, it was selected in the alternative space and found to have a structure of 30 degrees, six blades, the pitch 2.5 mm, the length of the tube 6.1 m, N u of 58.0 at R e of 710, and pressure drop of 143,861 Pa.

4. Conclusions and Prospects

Flow chemistry provides a new idea for the continuous production of organic products. In this work, a reactor design method based on the intrinsic safety concept was proposed to reduce the transition design period while ensuring safety. Reactor stability criteria, reaction characteristics determine the target heat transfer capability, and trained neural networks form alternative combinations. Finally, the pressure drop is used as a criterion to select the optimal structure and operating conditions. Chemical engineering experts perform reactor design work, and the chemist or other personnel who want to use it can obtain the optimal structure by simple manipulation.
The heat transfer capacity can be easily regulated by changing the blades’ number, pitch, and angle. The number and intensity of longitudinal vortices, the degree of deflection of the flow, and the backflow are the main mechanisms affecting the heat transfer.
Partial least squares regression analysis determines that the number of blades for heat transfer and pressure drop is the main influencing factor. The blade angle is more sensitive to the pressure drop than the heat transfer, so a 30° or 45° blade should be used.
At this stage, the design of the reactor is discussed only in terms of heat transfer. In the future, the relationship between mass transfer capacity and structure and operating conditions could be considered simultaneously, and a similar approach could easily obtain the optimal structure that satisfies both heat transfer and mixing capacity requirements.

Supplementary Materials

The following supporting information can be downloaded at: https://www.mdpi.com/article/10.3390/pr10112329/s1, Supporting information is available on the PLS.

Author Contributions

Conceptualization, H.L.; methodology, H.L and C.W.; CFD simulation, H.L.; validation, H.L.; Python, H.L; formal analysis, H.L.; writing—original draft preparation, H.L.; writing-review and editing, H.L.; supervision, X.Y. and R.W. All authors have read and agreed to the published version of the manuscript.

Funding

This research received no external funding.

Institutional Review Board Statement

Not applicable.

Informed Consent Statement

Not applicable.

Data Availability Statement

Data was contained within the article.

Conflicts of Interest

The authors declare no competing financial interest.

List of Symbols

Nomenclature
acorrection factor
Ablade angle (°)
Bcoefficient
Bc0parameter
CAconcentration of key component (mol m−3)
Cvheat capacity (J kg−1 K−1)
Dhydraulic diameter (m)
DaIDamköhler number
Eaactivation energy (J mol−1)
ffriction coefficient
hmoverall average heat transfer coefficient (W m−2 K−1)
kreaction rate coefficient (s−1)
k0reaction rate coefficient at T0 (s−1)
Lchannel length (m)
mreaction order
Nblade number
NuNusselt number
N u c critical Nusselt number
Pblade spacing (mm)
PrPrandtl number
rradius (m)
RTgas constant
StStanton number
Ttemperature (K)
T0temperature at reactor inlet (K)
Tctemperature of cooling medium (K)
tRreaction time scale (s)
ummean fluid velocity (m s−1)
Vvolume (m3)
Δppressure difference (Pa)
(−ΔHr)reaction enthalpy (J mol−1)
Greek Symbols
γArrhenius parameter
δthickness of blade
θcdimensionless critical temperature
θ c 0 critical temperature of the adiabatic reactor
νkinematic viscosity (m2s−1)
ρdensity (kgm−3)
ψdimensionless reaction number
μViscosity (Pa s)

References

  1. Wang, X.; Wang, Y.; Li, F.; Li, L.; Ge, X.; Zhang, S.; Qiu, T. Scale-up of microreactor: Effects of hydrodynamic diameter on liquid–liquid flow and mass transfer. Chem. Eng. Sci. 2020, 226, 115838. [Google Scholar] [CrossRef]
  2. Trojanowicz, M. Flow Chemistry in Contemporary Chemical Sciences: A Real Variety of Its Applications. Molecules 2020, 25, 1434. [Google Scholar] [CrossRef] [PubMed] [Green Version]
  3. Wegner, J.; Ceylan, S.; Kirschning, A. Flow Chemistry—A Key Enabling Technology for (Multistep) Organic Synthesis. Adv. Synth. Catal. 2012, 354, 17–57. [Google Scholar] [CrossRef]
  4. Suryawanshi, P.L.; Gumfekar, S.P.; Bhanvase, B.A.; Sonawane, S.H.; Pimplapure, M.S. A review on microreactors: Reactor fabrication, design, and cutting-edge applications. Chem. Eng. Sci. 2018, 189, 431–448. [Google Scholar] [CrossRef]
  5. Mason, B.P.; Price, K.E.; Steinbacher, J.L.; Bogdan, A.R.; McQuade, D.T. Greener approaches to organic synthesis using microreactor technology. Chem. Rev. 2007, 107, 2300–2318. [Google Scholar] [CrossRef] [PubMed]
  6. Wiles, C.; Watts, P. Continuous flow reactors: A perspective. Green Chem. 2012, 14, 38–54. [Google Scholar] [CrossRef]
  7. Jose Nieves-Remacha, M.; Torres, M.; Ruiz-Abad, M.; Rincon, J.A.; Cumming, G.R.; Garcia-Losada, P. Scale-up of N-alkylation reaction using phase-transfer catalysis with integrated separation in flow. React. Chem. Eng. 2019, 4, 334–345. [Google Scholar] [CrossRef]
  8. Penverne, C.; Hazard, B.; Rolando, C.; Penhoat, M. Scale-up Study of Benzoic Acid Alkylation in Flow: From Microflow Capillary Reactor to a Milliflow Reactor. Org. Process Res. Dev. 2017, 21, 1864–1868. [Google Scholar] [CrossRef]
  9. Cherkasov, N.; Al-Rawashdeh, M.M.; Ibhadon, A.O.; Rebrov, E.V. Scale up study of capillary microreactors in solvent-free semihydrogenation of 2-methyl-3-butyn-2-ol. Catal. Today 2016, 273, 205–212. [Google Scholar] [CrossRef] [Green Version]
  10. Kockmann, N.; Roberge, D.M. Scale-up concept for modular microstructured reactors based on mixing, heat transfer, and reactor safety. Chem. Eng. Process.-Process Intensif. 2011, 50, 1017–1026. [Google Scholar] [CrossRef]
  11. Zhang, F.; Cerato-Noyerie, C.; Woehl, P.; Lavric, E.D. Intensified liquid/liquid mass transfer in corning® advanced-flow ™reactors. Chem. Eng. Trans. 2011, 24, 1369–1374. [Google Scholar]
  12. Santana, H.S.; Rodrigues, A.C.; Lopes, M.G.M.; Russo, F.N.; Silva, J.L., Jr.; Taranto, O.P. 3D printed millireactors for process intensification. Chin. J. Chem. Eng. 2020, 28, 180–190. [Google Scholar] [CrossRef]
  13. Potdar, A.; Thomassen, L.C.J.; Kuhn, S. Scalability of 3D printed structured porous milli-scale reactors. Chem. Eng. J. 2019, 363, 337–348. [Google Scholar] [CrossRef]
  14. Zhang, C.; Ferrell, A.R.; Nandakumar, K. Study of a toroidal-helical pipe as an innovative static mixer in laminar flows. Chem. Eng. J. 2019, 359, 446–458. [Google Scholar] [CrossRef]
  15. Santana, H.S.; Silva, J.L., Jr.; da Silva, A.G.P.; Rodrigues, A.C.; Amaral, R.d.L.; Noriler, D.; Taranto, O.P. Development of a New Micromixer “Elis” for Fluid Mixing and Organic Reactions in Millidevices. Ind. Eng. Chem. Res. 2021, 60, 9216–9230. [Google Scholar] [CrossRef]
  16. Parra-Cabrera, C.; Achille, C.; Kuhn, S.; Ameloot, R. 3D printing in chemical engineering and catalytic technology: Structured catalysts, mixers and reactors. Chem. Soc. Rev. 2018, 47, 209–230. [Google Scholar] [CrossRef] [PubMed]
  17. Nagy, Z.K.; El Hagrasy, A.; Litster, J. Continuous Pharmaceutical Processing; Springer International Publishing: Berlin/Heidelberg, Germany, 2020. [Google Scholar]
  18. Westermann, T.; Mleczko, L. Heat Management in Microreactors for Fast Exothermic Organic Syntheses-First Design Principles. Org. Process Res. Dev. 2016, 20, 487–494. [Google Scholar] [CrossRef]
  19. Kummer, A.; Varga, T. Completion of thermal runaway criteria: Two new criteria to define runaway limits. Chem. Eng. Sci. 2019, 196, 277–290. [Google Scholar] [CrossRef]
  20. Jiang, J.J.; Jiang, J.C.; Wang, Z.R.; Pan, Y. Thermal runaway criterion for chemical reaction systems: A modified divergence method. J. Loss Prev. Process Ind. 2016, 40, 199–206. [Google Scholar] [CrossRef]
  21. Haber, J.; Kashid, M.N.; Renken, A.; Kiwi-Minsker, L. Heat Management in Single and Multi-injection Microstructured Reactors: Scaling Effects, Stability Analysis, and Role of Mixing. Ind. Eng. Chem. Res. 2012, 51, 1474–1489. [Google Scholar] [CrossRef]
  22. Ni, L.; Cui, J.; Jiang, J.; Pan, Y.; Wu, H.; Shu, C.-M.; Wang, Z.; Mou, S.; Shi, N. Runaway inhibition of styrene polymerization: A simulation study by chaos divergence theory. Process Saf. Environ. Prot. 2020, 135, 294–300. [Google Scholar] [CrossRef]
  23. Maestri, F.; Copelli, S.; Barozzi, M.; Rota, R. Kinetic-free discontinuous to continuous transformation of fine chemical reactions: A general experimental procedure. Chem. Eng. J. 2020, 395, 125061. [Google Scholar] [CrossRef]
  24. Jiang, X.; Feng, W.; Guo, Z.; Chen, W. Investigation into maximum temperature of synthesis reaction for single kinetically controlled liquid-liquid semibatch reactions with arbitrary reaction order. J. Therm. Anal. Calorim. 2020, 143, 3793–3804. [Google Scholar] [CrossRef]
  25. Kummer, A.; Varga, T.; Nagy, L. Semi-batch reactor control with NMPC avoiding thermal runaway. Comput. Chem. Eng. 2020, 134, 106694. [Google Scholar] [CrossRef]
  26. Kockmann, N.; Gottsponer, M.; Roberge, D.M. Scale-up concept of single-channel microreactors from process development to industrial production. Chem. Eng. J. 2011, 167, 718–726. [Google Scholar] [CrossRef]
  27. Brunton, S.L.; Noack, B.R. Closed-Loop Turbulence Control: Progress and Challenges. Appl. Mech. Rev. 2015, 67, 050801. [Google Scholar] [CrossRef]
  28. Lv, J.Y.; Liu, Z.C.; Liu, W. Active design for the tube insert of center-connected deflectors based on the principle of exergy destruction minimization. Int. J. Heat Mass Transf. 2020, 150, 119260. [Google Scholar] [CrossRef]
  29. Kockmann, N. Scalable Equipment for Process Development. Chem. Ing. Tech. 2012, 84, 646–659. [Google Scholar] [CrossRef]
  30. Roberge, D.M.; Gottsponer, M.; Eyholzer, M.; Kockmann, N. Industrial design, scale-up, and use of microreactors. Chim. Oggi-Chem. Today 2009, 27, 8–11. [Google Scholar]
  31. Kucherov, F.A.; Romashov, L.V.; Ananikov, V.P. Development of 3D+G printing for the design of customizable flow reactors. Chem. Eng. J. 2022, 430. [Google Scholar] [CrossRef]
  32. Varma, A.; Morbidelli, M.; Wu, H. Parametric Sensitivity in Chemical Systems; Cambridge University Press: Cambridge, UK, 1999. [Google Scholar]
  33. Zhu, H.; Tang, T.; Zhao, H.; Gao, Y. Control of vortex-induced vibration of a circular cylinder using a pair of air jets at low Reynolds number. Phys. Fluids 2019, 31. [Google Scholar] [CrossRef]
  34. Habchi, C.; Russeil, S.; Bougeard, D.; Harion, J.-L.; Lemenand, T.; Della Valle, D.; Peerhossaini, H. Enhancing heat transfer in vortex generator-type multifunctional heat exchangers. Appl. Therm. Eng. 2012, 38, 14–25. [Google Scholar] [CrossRef]
  35. Zhai, C.; Islam, M.D.; Simmons, R.; Barsoum, I. Heat transfer augmentation in a circular tube with delta winglet vortex generator pairs. Int. J. Therm. Sci. 2019, 140, 480–490. [Google Scholar] [CrossRef]
  36. Xiao, H.; Wang, X.; Liu, Z.; Liu, W. Optimization of turbulent heat transfer based on exergy destruction minimization principle. In Proceedings of the 4th Thermal and Fluids Engineering Conference, TFEC 2019, Las Vegas, NV, USA, 14–17 April 2019; Begell House Inc.: Danbury, CT, USA, 2019; pp. 1107–1114. [Google Scholar]
  37. Xiao, H.; Wang, J.; Liu, Z.; Liu, W. Turbulent heat transfer optimization for solar air heater with variation method based on exergy destruction minimization principle. Int. J. Heat Mass Transf. 2019, 136, 1096–1105. [Google Scholar] [CrossRef]
  38. Wold, S.; Sjöström, M.; Eriksson, L. PLS-regression: A basic tool of chemometrics. Chemom. Intell. Lab. Syst. 2001, 58, 109–130. [Google Scholar] [CrossRef]
  39. Tian, Z.; Gu, B.; Yang, L.; Lu, Y. Hybrid ANN–PLS approach to scroll compressor thermodynamic performance prediction. Appl. Therm. Eng. 2015, 77, 113–120. [Google Scholar] [CrossRef]
  40. Lee, G.; Han, C.; Yoon, E.S. Multiple-fault diagnosis of the Tennessee Eastman process based on system decomposition and dynamic PLS. Ind. Eng. Chem. Res. 2004, 43, 8037–8048. [Google Scholar] [CrossRef]
  41. Zhu, Q.-X.; Luo, Y.; He, Y.-L. Novel Distributed Alarm Visual Analysis Using Multicorrelation Block-Based PLS and Its Application to Online Root Cause Analysis. Ind. Eng. Chem. Res. 2019, 58, 20655–20666. [Google Scholar] [CrossRef]
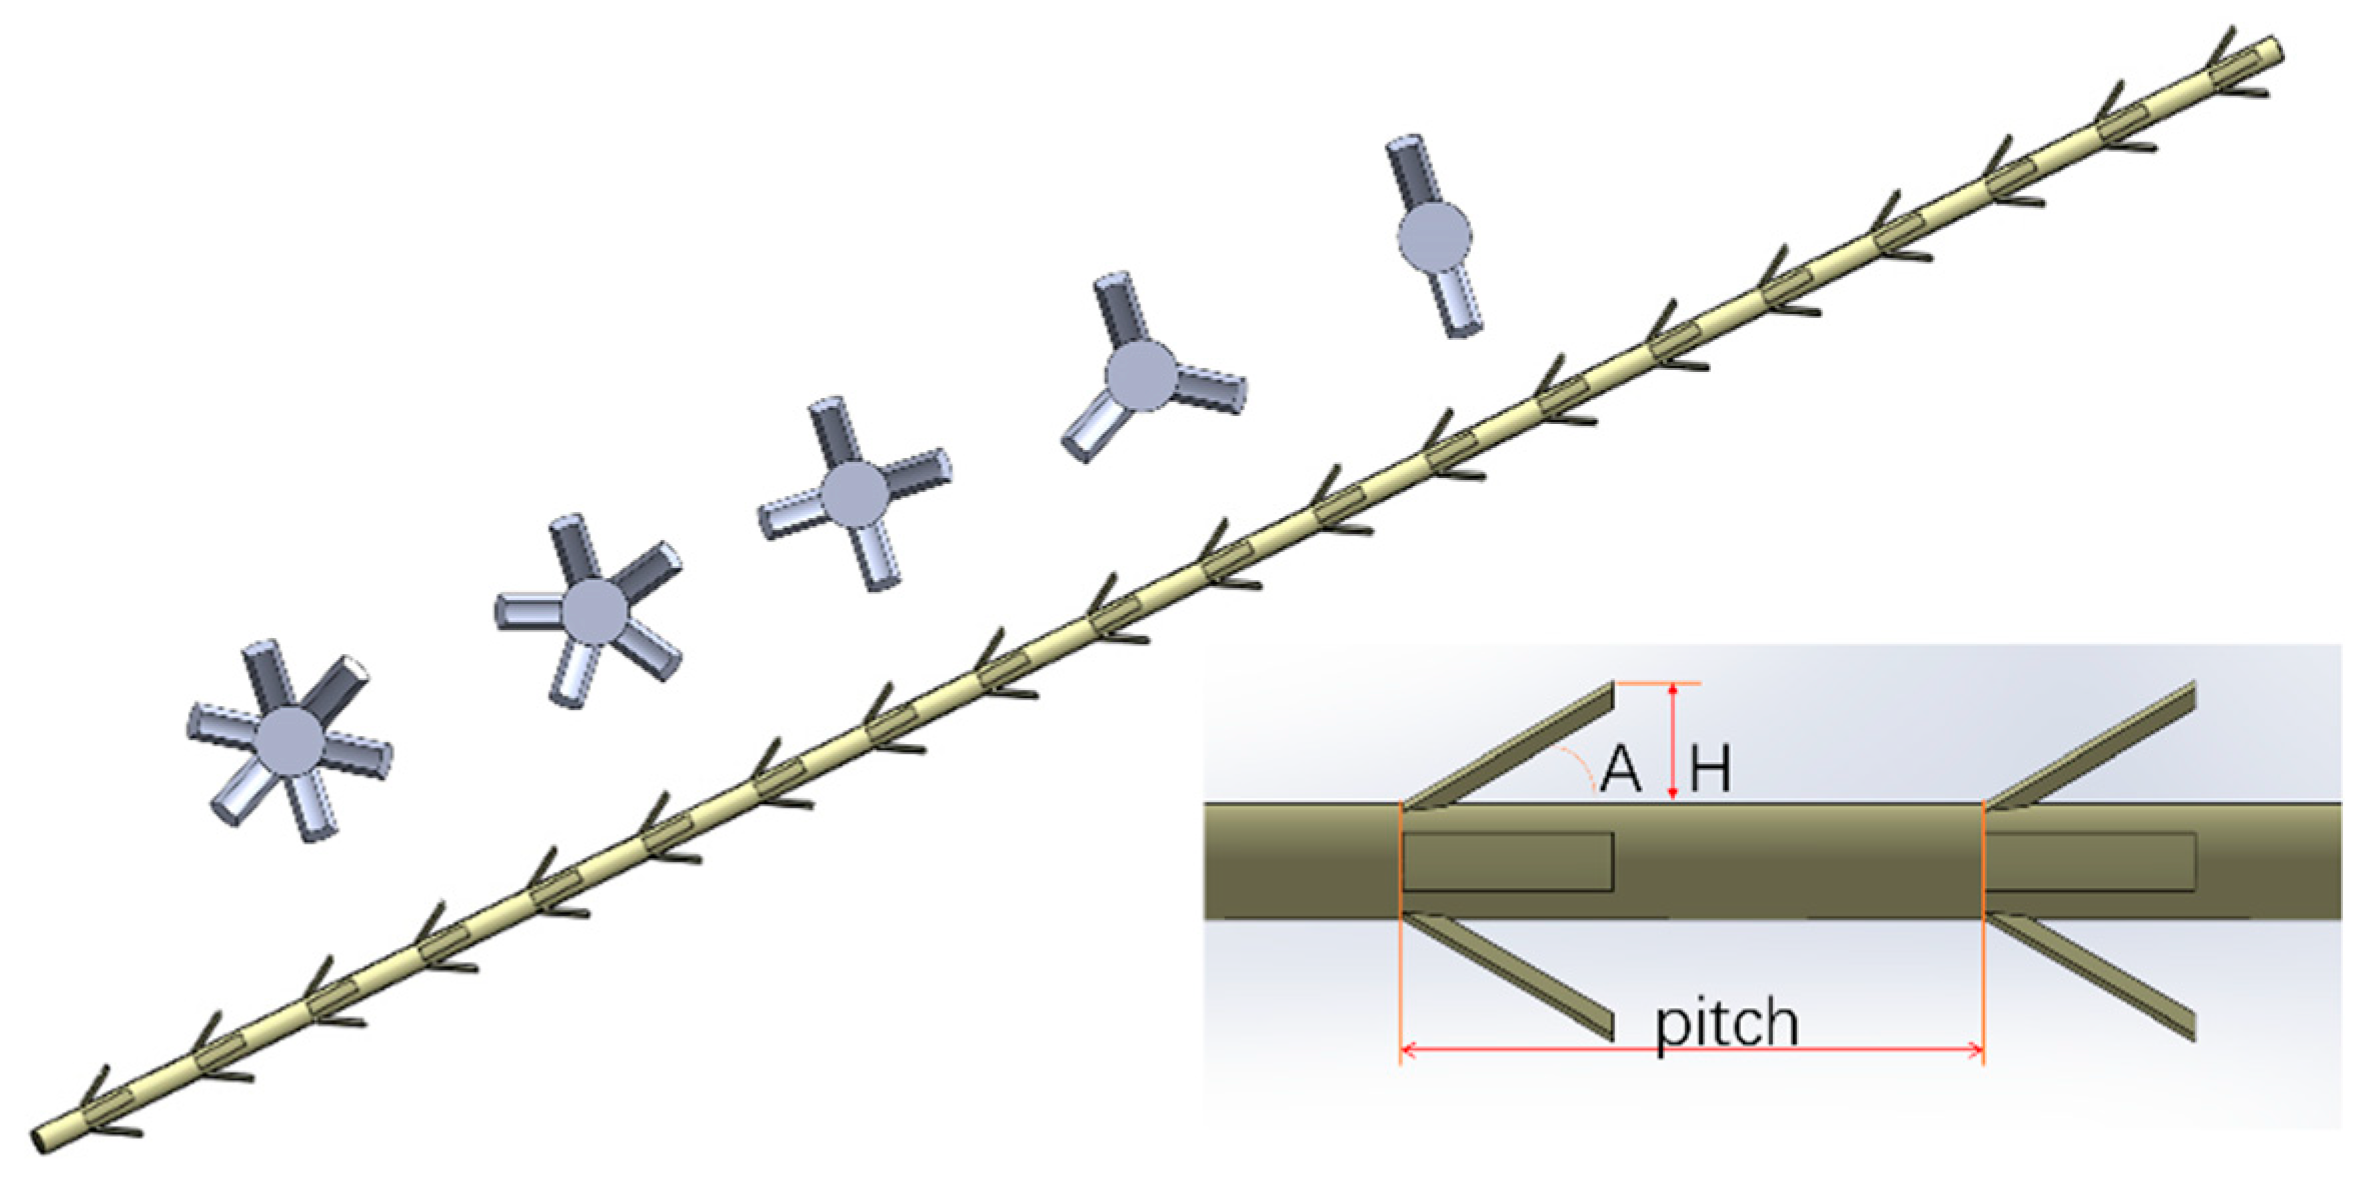
Figure 1. A geometrical model of insert.
Processes 10 02329 g001
Figure 2. (a) Detail view of grid at axial section; (b) Detail view of grid at cross section; (c) Comparisons between numerical results and theoretical values for smooth tube.
Processes 10 02329 g002
Figure 3. Schematic diagram of PIV system: 1 computer, 2 synchronizer, 3 laser, 4 laser head, 5 CCD cameras, 6 light sheet, 7 feeding system, 8 feed tank, 9 syringe pump, 10 magnetic stirring tank.
Processes 10 02329 g003
Figure 4. Map of design process.
Processes 10 02329 g004
Figure 5. Temperature contour and streamline on plane at z = 60 mm (P = 5 mm, A = 30, N = 4): (a) longitudinal swirls generated in tube, (b) temperature distribution, (c) the effect of deflecting flow caused by deflectors, streamline.
Processes 10 02329 g005
Figure 6. Variations of N u with blade number at P = 3 mm.
Processes 10 02329 g006
Figure 7. Temperature contour and streamline:(a) temperature distribution at two, three, four, five, six blades on plane at z = 51 mm (P = 3 mm, A = 45°), R e = 20; (b) streamline on plane at z = 50.4 mm (P = 3 mm, A = 45°, N = 6 (left), N = 5 (right), R e = 600); (c) streamline on YZ plane (P = 3 mm, A = 45°, N = 6 (left), N = 5 (right), R e = 600).
Processes 10 02329 g007
Figure 8. Variations of f/fo with blade number at P = 3 mm.
Processes 10 02329 g008
Figure 9. Temperature contour and streamline at YZ plane (P = 5 mm, N = 5 R e = 1500): (a) streamline; (b) temperature contour.
Processes 10 02329 g009
Figure 10. Variations of N u with deflector angle at P = 5 mm.
Processes 10 02329 g010
Figure 11. Variations of f/fo with deflector angle at P = 5 mm.
Processes 10 02329 g011
Figure 12. Variations of N u with deflector pitch at A = 30°.
Processes 10 02329 g012
Figure 13. Variations of f/fo with deflector pitch at A = 30°.
Processes 10 02329 g013
Figure 14. (a) Temperature contour and (b) Velocity contour at Z = 61 mm plane (P = 2, 3, 4, 5 mm, N = 3, A = 30°, R e = 1200).
Processes 10 02329 g014
Figure 15. Coefficient Plots for N u and f / f 0 .
Processes 10 02329 g015
Figure 16. Schematic diagram of flow fields in a circular tube tested by a PIV experiment and simlulation at R e = 400, N = 4, A = 45°, p = 4 mm: (a) Vectors maps, (b) Velocity contour.
Processes 10 02329 g016
Figure 17. Deviations between CFD simulation results and ANN fitting results: (a) N u and (b) f / f 0 .
Processes 10 02329 g017
Table 1. Parameters of insert.
Number of Blades (N)2, 3, 4, 5, 6
Angle (A) with the central rod30°, 45°, 60°, 75°
Blade spacing (P), mm2, 3, 4, 5
Table 2. Grid independence test.
CellsNuΔP/PaError—NuErrorΔP
Grid 1965379448.55559.7−5.96%2.60%
Grid 21220877351.55445.4−0.10%0.49%
Grid 32581832551.55418.8————
Publisher’s Note: MDPI stays neutral with regard to jurisdictional claims in published maps and institutional affiliations.