Article

Construction and Optimization of Malonyl-CoA Sensors in Saccharomyces cerevisiae by Combining Promoter Engineering Strategies

1
School of Chemical Engineering and Technology, Tianjin University, Tianjin 300350, China
2
Frontiers Science Center for Synthetic Biology, Tianjin University, Tianjin 300350, China
3
Key Laboratory of System Bioengineering, Tianjin University, Ministry of Education, Tianjin 300350, China
*
Authors to whom correspondence should be addressed.
Processes 2022, 10(12), 2660; https://doi.org/10.3390/pr10122660
Submission received: 29 September 2022 / Revised: 2 November 2022 / Accepted: 8 December 2022 / Published: 10 December 2022

Abstract

:
Biosensors can be used for high-throughput screening, real-time monitoring of metabolites, and dynamic regulation of metabolic processes, which have been a popular research direction in recent years. Here, five promoters from Saccharomyces cerevisiae were selected to construct Malonyl-CoA sensors with the fapO/fapR system derived from Bacillus subtilis, and pCCW12 was finally selected for further optimization. Based on pCCW12, a series of sensors with different response sensitivities were obtained by selecting different fapO insertion sites and combining the best two or three of them. Then, through a combination of promoter hybrid, intron insertion, and transcription factor modification strategies, we obtained sensors with different effects, one of which, the H-pCCW12(TFBS)-Cti6~fapR sensor, had the lowest background noise, doubled response range and higher response sensitivity compared to the original sensor. Sensors with different characteristics constructed in this study, can be applied to Malonyl-CoA related high-throughput screening and finer regulation of metabolism. It also proves that the combined application of different promoter engineering strategies is a feasible idea for the precise construction and regulation of biosensors.

1. Introduction

Malonyl-CoA is a key precursor of fatty acid compounds, bio-based products such as 3-hydroxypropionic acid [1], flavonoids such as naringenin [2], polyketides [3], and other important products. It is also a key intermediate in the metabolism of microorganisms. The intracellular Malonyl-CoA biosensor can respond to the Malonyl-CoA concentration, autonomously adjust the expression intensity of the pathway genes guided by it, and realize the dynamic balance of Malonyl-CoA. In turn, the metabolism is directed to the target compound, realizing the efficient biosynthesis of target compounds. In addition, the Malonyl-CoA sensor can be used for high-throughput screening and applied to monitor the changes in intracellular Malonyl-CoA concentration in real-time. Therefore, the construction of Malonyl-CoA biosensors has important practical significance.
The construction of a Malonyl-CoA biosensor in S. cerevisiae requires the use of fapR/fapO elements from Bacillus subtilis (Figure 1) [4,5]. fapO is a transcription factor binding site(TFBS) located on the fatty acid synthesis promoter. The N-terminal domain of fapR protein can specifically bind to fapO and inhibit promoter expression through steric hindrance. The C-terminus of fapR can specifically bind to Malonyl-CoA. When the two bind, the conformation of the N-terminus of fapR will change to be separated from fapO, and the promoter will be expressed at this time. Therefore, the concentration of Malonyl-CoA determines the expression strength of the sensor promoter [4].
In 2014, Xu et al. constructed two Malonyl-CoA sensors with opposite signal output trends in Escherichia coli, obtaining an engineered bacteria with high production of fatty acids [5,6]. Similarly, in 2020, Wen et al. designed a set of biosensors with opposite signal output trends and applied the two different biosensors simultaneously to Komagataella phaffii [7,8], constructing a Malonyl-CoA oscillator and realizing the efficient synthesis of 6-methylsalicylic acid in K. phaffii. In addition, many studies have constructed Malonyl-CoA sensors in S. cerevisiae. Li et al. applied the fapR/fapO system to S. cerevisiae cells for the first time and used the constructed Malonyl-CoA biosensors for high-throughput screening of genes [9]. David et al. achieved dynamic regulation of metabolic processes by applying a Malonyl-CoA sensor, which greatly improved the production of 3-HP in S. cerevisiae [10]. According to the construction process of the Malonyl-CoA sensor, it can be found that the transformation and optimization of the sensor can be considered from three aspects: fapO, fapR, and the promoter used to construct the sensor. Chen et al. hybridized UASTEF1 and COREGAL1 to construct a strong-starting hybrid promoter and obtained a hybrid promoter-based sensor [11]. Dabirian et al. constructed a sensor library with different response ranges by comparing different promoters, changing some insertion sites of fapO and strengthening the inhibitory strength of fapR [12]. There are not many related types of research on the transformation and optimization of sensors, and there is a lack of systematic discussion and combined application of the three transformation factors.
The construction of biosensors based on the fapR/fapO system is also a promoter engineering strategy. The rational design of S. cerevisiae promoters has enabled people to obtain more promoters with a wider range of initiation strengths and finer transcriptional regulation [13]. At present, quite a few researchers have carried out research on promoter engineering and proposed different strategies. Promoter hybridization [14,15,16], which combines the regulatory elements and core components of different S. cerevisiae promoters, is a well-studied strategy to obtain engineered promoters with different strength ranges. These elements can be endogenous to S. cerevisiae [17] or heterologous [18,19]. Studies have shown that introns can promote or inhibit gene expression to a certain extent [20,21]. Cui et al. constructed a library of engineered promoters with different expression strengths by inserting different introns [22]. The strongest promoter, pGPD + RPL23A, was twice as strong as the natural strong promoter, pTPI. Design and modification of transcription factors(TFs) have also been shown to affect expression from native promoters [23,24,25]. The engineered TFs can alter the expression intensity and response to specific signals of promoters that have corresponding TFBSs. In addition to the above methods, researchers have also conducted research on other effective strategies such as random mutation [26,27,28], sequence truncation [29,30], nucleosome removal [31] and synthetic [32]. These promoter engineering strategies may open more possibilities for the construction of sensors if they can be used reasonably.
In this study, we constructed a Malonyl-CoA biosensor in S. cerevisiae cells using the fapR/fapO system and systematically discussed the optimization process of the sensor from three aspects of fapO, fapR and promoter. By changing the insertion site and quantity of fapO and combining different promoter engineering strategies, a series of Malonyl-CoA sensor libraries with different response effects were obtained. Using sensors with different effects in the library can realize high-throughput screening, dynamic regulation of Malonyl-CoA derivative biosynthesis, and real-time monitoring of metabolites. The strategy combining these three directions has successfully obtained a sensor with low background noise, wide response range and relatively high response sensitivity, which could be better used in high-throughput screening. This study also proves the great potential of combining different promoter engineering strategies and provides a direction for future research on promoter engineering.

2. Materials and Methods

2.1. Strains and Medium

S. cerevisiae strain W303-1a (MATa leu2-3,112 trp1-1 can1-100 ura3-1 ade2-1 his3-11,15) was used as the background strain. YPD medium contains 20 g/L peptones, 20 g/L glucose and 10 g/L yeast extract, which is used for yeast cultivation. And a YPD solid medium is supplemented with 15 g/L–20 g/L agar powder. Synthetic dextrose (SD) medium (containing 6.7 g/L yeast nitrogen base without amino acids, 20 g/L glucose and 2 g/L amino acids mix without leucine, tryptophan, uracil, adenine and histidine) was used for the selection and cultivation of engineered strains. And SD solid medium is supplemented with 15 g/L–20 g/L agar powder.
E. coli strain DH5α was used to amplify plasmids. LB medium contains 10 g/L tryptone, 10 g/L NaCl and 5 g/L yeast extract, using 100 mg/L ampicillin as a screening marker for E. coli. And LB solid medium is supplemented with 15 g/L–20 g/L agar powder.

2.2. Plasmid and Strain Construction

Oligo7 was used to design the primers for the experiment, and the primers were synthesized by TsingkeBiotechnologyCo., Ltd. and stored at −20 °C. Phanta® Max Super-Fidelity DNA Polymerase for Polymerase chain reaction (PCR) was purchased from Novizan Biotechnology Co., LTD. Nanjing, China. Plasmids were ligated by Gibson assembly, and Super Fusion Cloning Mix (2×) was purchased from Bestbay Biotechnology Co., Ltd., Tianjin, China, for plasmid assembly. All primers, plasmids, strains and related sequences used or constructed in this study are shown in Tables S2–S5. The schematic diagram of plasmid construction in this study is shown in Figure S1.
Plasmid pXP218 was bought from ATCC and used as the backbone plasmid in this study. All the promoters and terminators required in this study were amplified from the W303-1a strain genome. GFP fluorescent protein was preserved by our laboratory, and fapR was codon-optimized and gene synthesized by General Biology Co., LTD.Anhui, China.

2.3. Analysis of Malonyl-CoA Sensors

The strains were grown in 2 mL of SD liquid medium with corresponding defects (without ura) for 16 h–18 h, and cultivated to logarithmic growth phase at 30 °C, 220 rpm. Isolated 200 uL of bacterial solution into a new 2 mL SD liquid medium, adding different concentrations of fatty acid synthase inhibitor cerulenin to the medium at the same time. After culturing at 30 °C and 220 rpm in a shaker for 2 h, the intensity of fluorescent protein was measured by a multi-function microplate reader. The excitation wavelength is 488 nm, and the absorption wavelength is 525 nm. Three parallels were set for each group of experiments, and the average value of the experimental data was taken. This article artificially defines the ratio of the maximum response fluorescence intensity after the addition of cerulenin to that without addition as the sensitivity, and the concentration of cerulenin added under the maximum fluorescence response intensity is the response range of the sensor. The relevant parameters of all sensors constructed in this study are shown in Table S1.

3. Results and Discussion

3.1. Construction of Malonyl-CoA Sensor

Five natural strong promoters, pTEF1, pFBA1, pENO2, pTDH3 and pCCW12, were selected in S. cerevisiae to construct the Malonyl-CoA biosensor [12,33,34]. Before constructing the biosensor, it was determined whether the protein itself affected the original promoter by comparing the expression of fapR (Figure S2). When fapR was expressed, SV40 nuclear localization signal peptide (NLS) was added to its C-terminus to ensure the transport of fapR into the nucleus. By comparison, it can be found that the expression of fapR has little effect on the original promoter. The strength of the original promoter is also an important reference factor for the construction of the sensor, and pCCW12 has the highest strength among the five promoters.
Then, fapO was inserted into the promoter to verify the effect of inserting fapO on the strength of the promoter (Figure S3). Since previous studies have shown that the sites near the TATA-box have the greatest impact on the promoter [9], we select the upstream and downstream of the TATA-box to insert fapO respectively. Among them, no clear TATA-box was found in the pTEF1 sequence, so 120 bp upstream of ATG of the initiation codon was selected to insert fapO. In theory, the effect of fapO on promoter strength should be as small as possible, which is more conducive to the construction of efficient sensors. By comparison, it can be found that when fapO is inserted into the five promoters, the expression strength of most of the engineered promoters is reduced to varying degrees compared with the original promoter. Among them, the transcriptional activity of pCCW12(up) was the most affected, which was only 74.03% of the original promoter. However, the insertion of fapO did not affect the normal transcriptional function of the promoter.
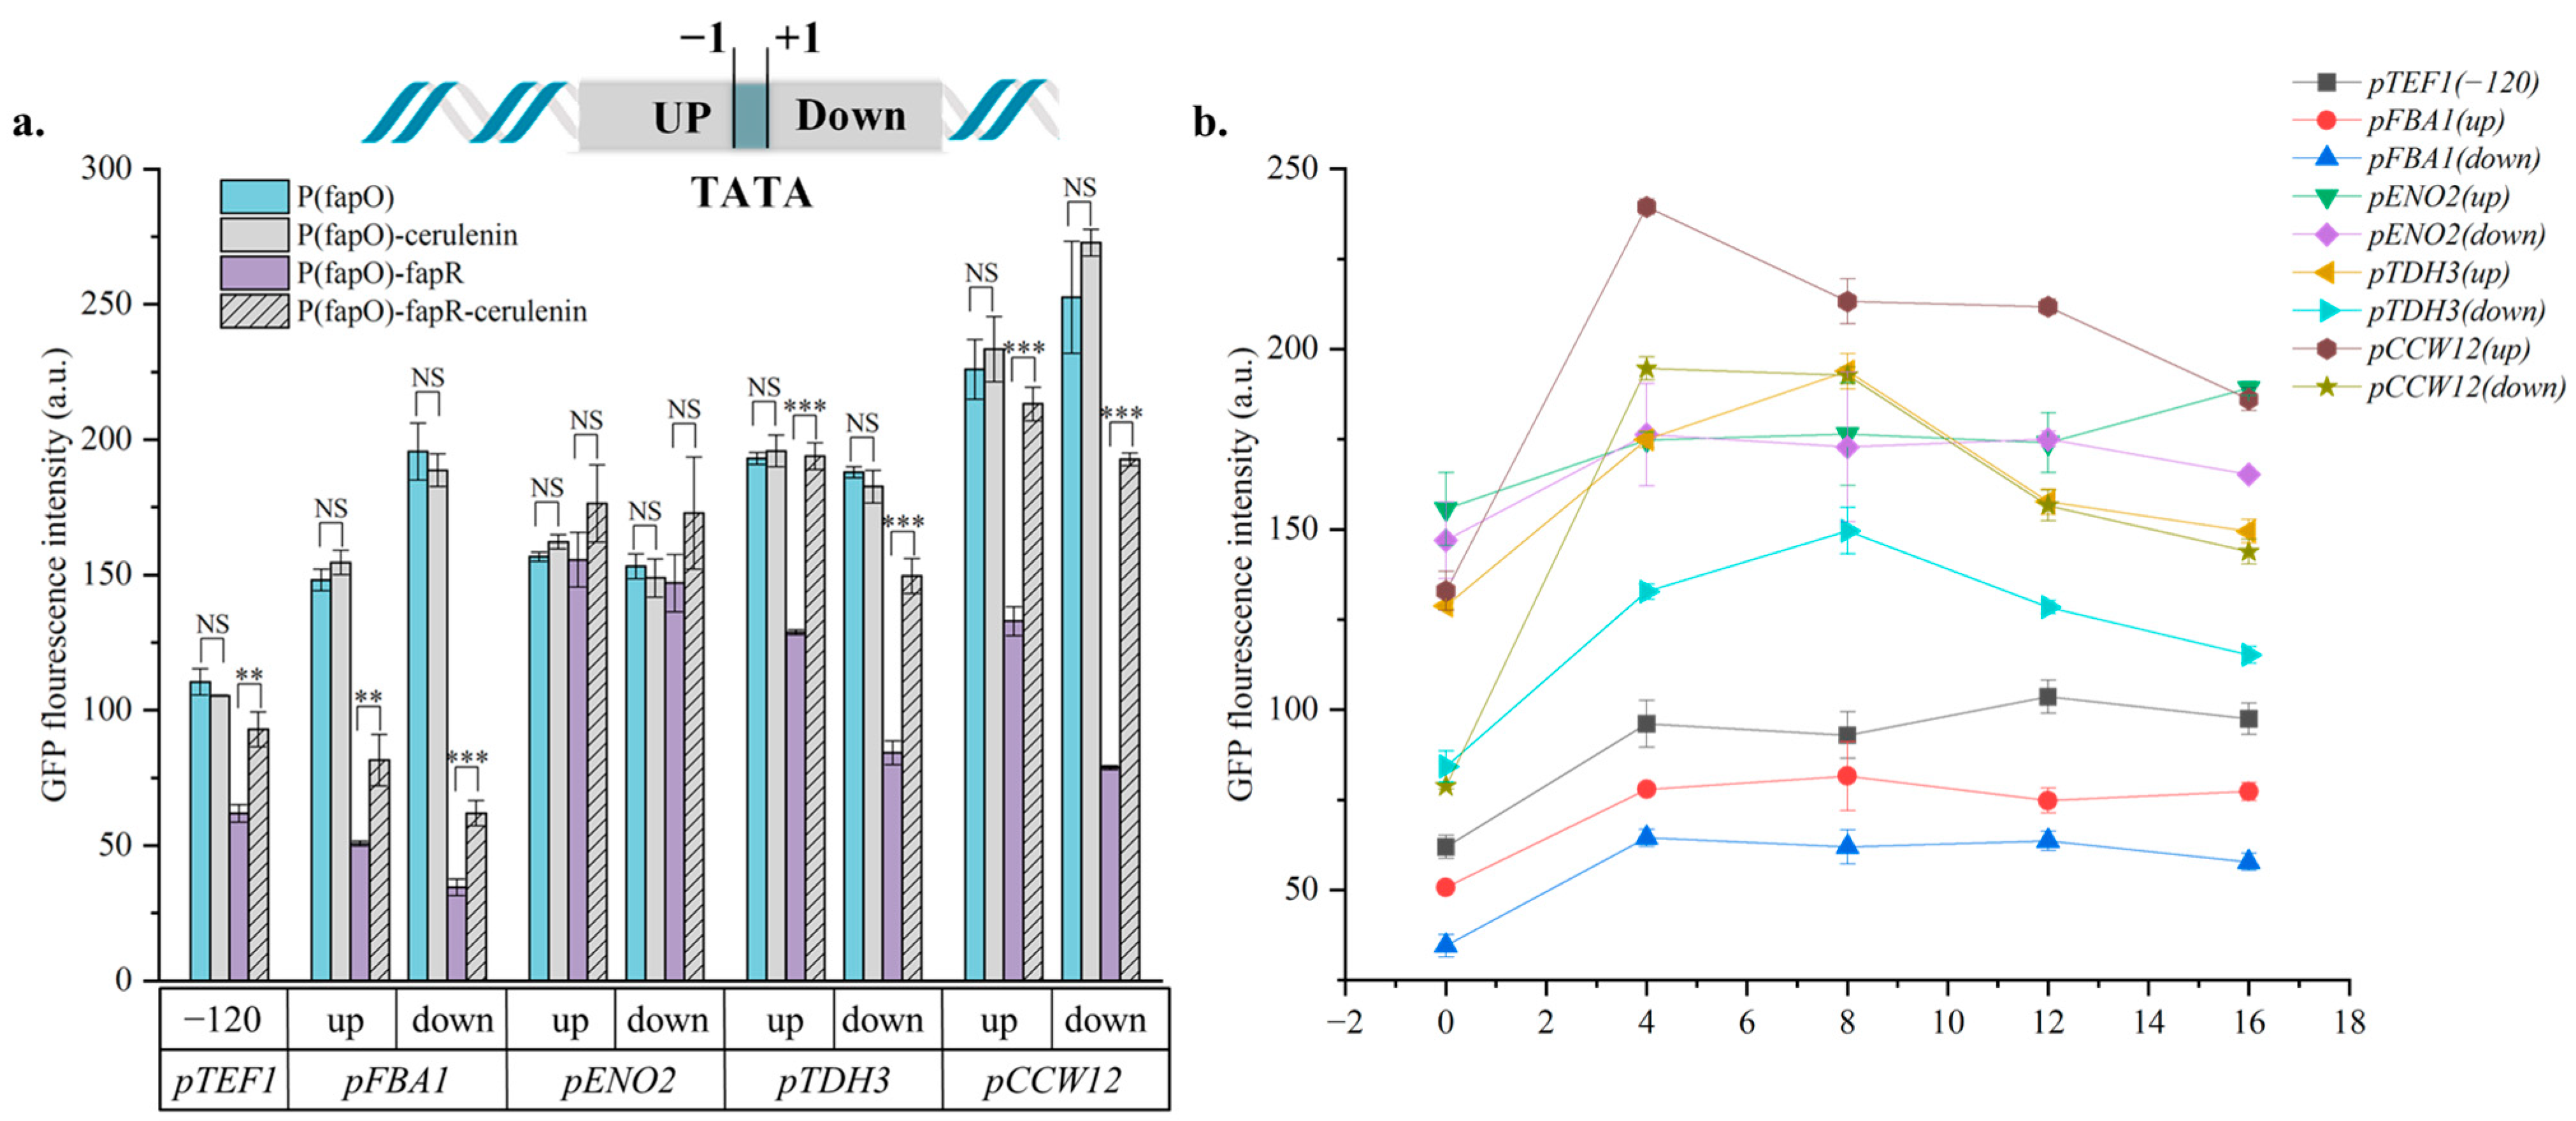
After confirming that all five promoters can construct the sensor, the fapO-inserted promoter-directed fluorescent protein module and the pTEF1-directed fapR expression module were simultaneously expressed (Figure 2a). Before and after adding cerulenin, the fluorescence intensities of strains expressing only fapO and strains expressing fapO/fapR system were compared. It can be found that the fluorescence intensity of strains expressing only fapO has just a slight change before and after the addition of cerulenin, indicating that the engineered promoter itself cannot respond to changes in intracellular Malonyl-CoA concentration. In general, the fluorescence intensity of the strains expressing fapO/fapR systems was significantly different before and after adding cerulenin. The fluorescence intensity of the strains with cerulenin was significantly higher than that of the control group without cerulenin, which proves that the fapO/fapR system worked in the strain. Specifically, among the sensors constructed from these five promoters, the overall pENO2 group wasn’t sensitive to Malonyl-CoA, and the sensors constructed by the pCCW12 responded best to changes in the concentration of Malonyl-CoA. The sensor strain H-pCCW12(down)-fapR had an activation intensity that was 2.47 times higher after the addition of 8 mg/L of cerulenin than before, better than other sensors. Subsequently, to obtain the relative response curve of the sensor to the change of Malonyl-CoA concentration, 0, 4 mg/L, 8 mg/L, 12 mg/L, and 16 mg/L of cerulenin were added to the medium, respectively, examining the fluorescence expression intensity of the strains under different Malonyl-CoA concentrations (Figure 2b). By comparing the response curves, we compiled the three metrics of the above sensors (background noise, response sensitivity and response range) in Table S1. It is found that the sensors constructed by pTEF1 have the lowest response sensitivity (1.50-fold), and the whole curve is relatively flat. Although pFBA1 has the lowest background noise and the widest response range (0–8 mg/L), its sensitivity is very low (up−1.61-fold, down−1.79-fold). Besides, after expressing fapR, the intensity of pFBA1(up) was only 55.07% and pFBA1(down) was 31.67% of that without expressing fapR, even with the addition of cerulenin, such that there was very limited room for subsequent optimization of the sensor. The sensor constructed with pENO2 does not have a regular response curve. The sensors constructed by pTDH3 have the widest response range (0–8 mg/L), and the response sensitivity is (up)−1.50-fold and (down)−1.78-fold, respectively. The sensor constructed by pCCW12 has the highest response sensitivity in the concentration range of 0–4 mg/L, and the high response sensitivity is more conducive to judging the intracellular concentration change of Malonyl-CoA by observing the change in fluorescence intensity. Combining all the experimental results above (Table S1), pCCW12 was finally selected for sensor optimization.

3.2. Optimization of Malonyl-CoA Sensors by Choosing Different fapO Inserting Sites

In the previous section, an fapO insertion site was selected upstream and downstream of the promoter TATA-box, respectively, and it was found that the sensors obtained from different insertion sites had very significant differences, proving that the insertion site of fapO in the promoter can greatly affect the sensor effect (Figure 2). Therefore, in this section, a total of 15 different sites were selected as an insertion site at an interval of 5 bp from the upstream 27 bp of the TATA-box to the downstream 42 bp for the construction of the sensor, selecting a better position through comparative screening (Figure 3a and Figure S4). The results showed that the corresponding strains of the insertion site after 12 bp upstream of the TATA-box had different degrees of response to the concentration change of Malonyl-CoA, and the other upstream insertion sites did not respond significantly to the concentration change of Malonyl-CoA. Such results suggest that the downstream TATA-box may have a greater effect on the promoter. By comparing the fluorescence detection results, it was found that no sensors were successfully constructed at the far upstream sites −27, −22, −17, and −12 of TATA-box and sensors constructed at the far downstream sites 37 and 42 did not respond well, proving that TATA-box has important significance for promoter function. However, the promoter strength of the site −2~7 bp close to the TATA-box was lower than that of other sites. It shows that although TATA-box plays a pivotal role in promoter strength, the choice of the insertion site is not as close to TATA-box as possible, and the selection of an appropriate insertion site can better build an efficient Malonyl-CoA sensor.
Among all the constructed sensor strains, the site with the best response effect was 22 bp downstream of the TATA-box, and the promoter strength after adding cerulenin was 5.64 times that without adding it. Followed by 32 bp and 17 bp downstream of the TATA-box, the promoter strength was 4.53 times and 2.61 times, respectively. Overall, the regulatory effect of the downstream insertion site of the TATA-box is generally better than that of the upstream TATA-box, and this finding may be applied to the modification of other promoters. Observing the P(fapO)-fapR group, it was shown that even when fapR was expressed, the engineered promoter was still expressed to varying degrees, indicating that the inhibitory effect of fapR was not complete. In addition, by comparing P(fapO) and P(fapO)-fapR + Cerulenin, it was shown that even the concentration of cerulenin that can make the sensor achieve the maximum responsiveness cannot restore the activation strength of the promoter to that without fapR expression. This suggests that the promoter transcription may still be partially repressed by fapR expression.
To acquire the strongest potential promoter repression effect while expressing fapR, we continued to combine the three sites with the best response effect (Figure 3b). It was discovered by comparing the fluorescence intensity of the P(fapO) group that the promoter intensity gradually decreased as the number of fapO insertions rose. It shows that the insertion of the fapO will affect the strength of the promoter itself, with more fapO having a stronger effect. Compared with the fluorescence detection results of the P(fapO)-fapR group, it was found that the more fapO in the promoter, the more obvious the inhibitory effect of fapR and fapO on the promoter. The 22/32/17 group had the most potent inhibitory effect. The 32/17 group did not insert fapO at the optimal site, and its inhibitory effect was the weakest compared with the other groups, which proved that the insertion site and the number of fapO in the promoter affected the effectiveness of the sensor. Overall, the increase in the number of fapO enhanced the inhibitory effect on the promoter, resulting in a low recovery efficiency of the fluorescence intensity of the strain after adding cerulenin. The fluorescence intensity of the sensor group P(fapO)-fapR-Cerulenin was approximately 50%~65% of that of P(fapO). The fluorescence intensity of the sensor group P(fapO)-fapR-Cerulenin inserted with three fapOs was only about 30% of that of P(fapO). Stronger inhibition of the promoter did not appear to increase the sensor’s response sensitivity, which was only 3.63-fold in the pCCW12(22/32/17)-fapR strain. Therefore, the promoter is further modified, hoping to improve the response sensitivity of the sensor through promoter engineering strategies such as hybridization, intron insertion, and transcription factor modification.

3.3. Broaden the Regulation Range of Malonyl-CoA Sensors by Combining Promoter Engineering Strategies

According to the literature [33], it was found that the promoter strength can be increased by hybridizing the promoter with TFBS sequences. The best TFBS combination in the article (TFBSpFBA1 + TFBSpGPM1) was selected and hybridized with pCCW12(223217) to construct a sensor strain. Introns may have negative or positive effects on protein expression. Cui et al. [22] constructed an intron-assisted promoter library with different strengths by inserting different introns into the expression module, and the best intron was RPL23A. In this section, the intron RPL23A is combined with the expression module of pCCW12 (223217) to construct a sensor strain, which is designed according to the construction of the expression module in the article (Figure 4a). By comparing the results of fluorescence detection (Figure 4b), it was found that the promoter intensity of pCCW12(TFBS) was 1.32-fold higher than pCCW12(223217), and the response intensity of H-pCCW12(TFBS)-fapR after adding cerulenin was 1.45-fold higher than that of H-pCCW12(223217)-fapR. However, the background noise in the sensor strain was increased and after adding 4 mg/L cerulenin, the promoter strength was only 3.26-fold that before addition, which was lower than the H-pCCW12(22/32/17)-fapR strain (3.63-fold). Then, by comparing the response curves of the two strains (Figure 4d), it was found that the response range of pCCW12(TFBS) increased (0–8 mg/L) and so did the sensitivity (3.72-fold). It was demonstrated that the strategy of fusing TFBS optimized the sensor. Besides, the promoter inserted the intron RPL23A did not improve the expression strength of the promoter as in the article. The strength of pCCW12(Intron) after adding cerulenin was 2.41-fold that before the addition. It is speculated that the effect of introns on different promoters is not the same, and RPL23A may hurt pCCW12.
Based on H-pCCW12(TFBS)-fapR, we tried to fuse fapR with two transcriptional repressors, Cti6 [35] and Gal80 [36], respectively, hoping to increase the inhibitory effect of fapR on the sensor (Figure 4a). By comparison, it is found that the inhibitory effect of fapR fusion Gal80 is too strong, which affects the response of the sensor instead. Compared to H-pCCW12(TFBS)-fapR and H-pCCW12(TFBS)-fapR~Cti6, it was found that after the fusion of the inhibitor Cti6, the inhibitory effect of the sensor strain was increased to the same level as H-pCCW12(22/32/17)-fapR which had the most potent inhibitory effect. However, after adding 4 mg/L cerulenin, pCCW12(TFBS) was affected by the inhibitory effect of fapR~Cti6 and its response was correspondingly reduced, but it was still 1.06-fold higher than H-pCCW12(22/32/17)-fapR. Overall, H-pCCW12(TFBS)-fapR~Cti6 had a 3.95-fold response after adding 4 mg/L cerulenin, which was higher than that of H-pCCW12(22/32/17)-fapR (3.63-fold) and H-pCCW12(TFBS)-fapR (3.26-fold). This proves that the combined use of different promoter engineering is beneficial for the directional optimization of the sensor, but the selection of relevant elements for different strategies deserves further discussion (Figure 4c).
Changing the number of fapO, the promoter strength and the inhibitory effect of fapR may affect the response curve of the sensor, so strains H-pCCW12(223217)-fapR, H-pCCW12(TFBS)-fapR, H-pCCW12 (TFBS)-Cti6~fapR and H-pCCW12(TFBS)-Gal80~fapR medium was supplemented with 0, 2 mg/L, 4 mg/L, 8 mg/L, 12 mg/L cerulenin, respectively, and the four strains′ response curves were shown in Figure 4d. As shown in Figure 4d, changing the number of fapO insertions did not affect the response range of the sensor, while the hybridization of TFBS and the fusion of transcriptional repressor Cti6 doubled the response range of the sensor, and the concentration range of cerulenin was changed to 0–8 mg/L. At the highest point of responsiveness, the response fold of the H-pCCW12(TFBS)-Cti6~fapR strain increased to 4.29 times after adding 8 mg/L cerulenin, which once again proved the feasibility of combining different promoter engineering strategies. In our study, we found that although H-pCCW12(TFBS)-Cti6~fapR achieved sufficiently low background noise and higher response strength, response range and response sensitivity than H-pCCW12(223217)-fapR, the promoter strength and background noise seem to increase and decrease in sync, and the sensor promoter cannot recover its original strength when fapR is expressed. Therefore, improving the response intensity of the sensor, ensuring that the background noise does not increase too much and restoring the strength of the sensor promoter as much as possible may require the study of other strategies. Randomly mutating fapR to select a protein sequence that is more sensitive to Malonyl-CoA binding may be a feasible approach. At the moment when big data is hot, combining machine learning to conduct a wider range of promoter screening and the selection of fapO sequence insertion sites is a direction worth thinking about, and it may be possible to discover more general laws in the process of sensor construction.
Besides, there is also a positive feedback dynamic regulation method—Quorum Sensing (QS), that is, microbial populations detect changes in cell density in the environment through chemical signaling molecules secreted by cells. As the cell density increases, it triggers the process of cell-related gene expression. Although researchers have not yet fully understood the mechanism of S. cerevisiae’s quorum-sensing regulation, some studies have used heterologous elements to construct a heterologous QS system in S. cerevisiae for metabolic regulation [37,38]. Using the QS system to positively regulate the expression of target product genes and the Malonyl-CoA sensor to negatively regulate the expression of competing pathways. Combined with appropriate static regulation strategies, it may be possible to achieve an efficient synthesis of target products based on ensuring cellular homeostasis.

4. Conclusions

This study systematically optimized the construction of the Malonyl-CoA biosensor in S. cerevisiae, including the discussion and optimization of fapO, fapR and promoter. By comparing the sensors constructed by 15 insertion sites upstream and downstream of the promoter sequence, we found that the downstream sequences of TATA-box may be more conducive to the construction of efficient sensors. At the same time, combining different promoter engineering strategies to transform the sensor is more conducive to the directional optimization of the sensor. The Malonyl-CoA sensor library constructed in this paper contains sensors with different response effects. In future research, according to experimental needs, high-throughput screening or metabolic dynamic regulation, selecting appropriate sensors for application can promote the biosynthesis of Malonyl-CoA derivatives and related research.

Supplementary Materials

The following supporting information can be downloaded at: https://www.mdpi.com/article/10.3390/pr10122660/s1, Figure S1: Schematic diagram of plasmids constructed in this study; Figure S2: Effect of fapR expression on the original promoter; Figure S3: Changes in expression intensity after fapO inserting into promoters; Figure S4: GFP fluorescence detection results of engineering promoters and sensor strains with ineffective fapO insertion sites; Table S1: Comparative evaluation of main parameters of sensor strains; Table S2: Primers used in this study; Table S3: Plasmids used in this study; Table S4: Strains used in this study; Table S5: Sequence used in this study.

Author Contributions

Conceptualization, S.H., C.Z. and W.L.; Methodology, S.H.; Data curation, S.H.; Writing-original draft, S.H.; Writing—Review & Editing, Z.Z. and C.Z.; Resources, C.Z. and W.L.; Supervision, C.Z. and W.L.; Validation, Z.Z.; Funding acquisition, C.Z. and W.L. All authors have read and agreed to the published version of the manuscript.

Funding

This work was financially supported by the National Key Research and Development Program of China (No. 2021YFC2101000 and 2019YFA0905100).

Institutional Review Board Statement

Not applicable.

Informed Consent Statement

Not applicable.

Data Availability Statement

Not applicable.

Conflicts of Interest

The authors declare that they have no conflict of interest.

References

  1. Liu, C.; Ding, Y.; Xian, M.; Liu, M.; Liu, H.; Ma, Q.; Zhao, G. Malonyl-CoA pathway: A promising route for 3-hydroxypropionate biosynthesis. Crit. Rev. Biotechnol. 2017, 37, 933–941. [Google Scholar] [CrossRef] [PubMed]
  2. Yang, Y.; Lin, Y.; Li, L.; Linhardt, R.J.; Yan, Y. Regulating malonyl-CoA metabolism via synthetic antisense RNAs for enhanced biosynthesis of natural products. Metab. Eng. 2015, 29, 217–226. [Google Scholar] [CrossRef] [PubMed]
  3. Zheng, K.; Xie, C.; Hong, R. Bioinspired iterative synthesis of polyketides. Front. Chem. 2015, 3, 32. [Google Scholar] [CrossRef] [PubMed] [Green Version]
  4. Schujman, G.E.; Guerin, M.; Buschiazzo, A.; Schaeffer, F.; Llarrull, L.; Reh, G.; Vila, A.; Alzari, P.M.; De Mendoza, D. Structural basis of lipid biosynthesis regulation in Gram-positive bacteria. EMBO J. 2006, 25, 4074–4083. [Google Scholar] [CrossRef]
  5. Xu, P.; Wang, W.; Li, L.; Bhan, N.; Zhang, F.; Koffas, M.A.G. Design and kinetic analysis of a hybrid promoter–regulator system for malonyl-CoA sensing in Escherichia coli. ACS Chem. Biol. 2013, 9, 451–458. [Google Scholar] [CrossRef]
  6. Xu, P.; Li, L.; Zhang, F.; Stephanopoulos, G.; Koffas, M. Improving fatty acids production by engineering dynamic pathway regulation and metabolic control. Proc. Natl. Acad. Sci. USA 2014, 111, 11299–11304. [Google Scholar] [CrossRef] [Green Version]
  7. Wen, J.; Tian, L.; Xu, M.; Zhou, X.; Zhang, Y.; Cai, M. A Synthetic Malonyl-CoA Metabolic Oscillator in Komagataella phaffii. ACS Synth. Biol. 2020, 9, 1059–1068. [Google Scholar] [CrossRef]
  8. Wen, J.; Tian, L.; Liu, Q.; Zhang, Y.; Cai, M. Engineered dynamic distribution of malonyl-CoA flux for improving polyketide biosynthesis in Komagataella phaffii. J. Biotechnol. 2020, 320, 80–85. [Google Scholar] [CrossRef]
  9. Li, S.; Si, T.; Wang, M.; Zhao, H. Development of a Synthetic Malonyl-CoA Sensor in Saccharomyces cerevisiae for Intracellular Metabolite Monitoring and Genetic Screening. ACS Synth. Biol. 2015, 4, 1308–1315. [Google Scholar] [CrossRef]
  10. David, F.; Nielsen, J.; Siewers, V. Flux Control at the Malonyl-CoA Node through Hierarchical Dynamic Pathway Regulation in Saccharomyces cerevisiae. ACS Synth. Biol. 2016, 5, 224–233. [Google Scholar] [CrossRef]
  11. Chen, X.; Yang, X.; Shen, Y.; Hou, J.; Bao, X. Screening Phosphorylation Site Mutations in Yeast Acetyl-CoA Carboxylase Using Malonyl-CoA Sensor to Improve Malonyl-CoA-Derived Product. Front. Microbiol. 2018, 9, 47. [Google Scholar] [CrossRef] [PubMed] [Green Version]
  12. Dabirian, Y.; Li, X.; Chen, Y.; David, F.; Nielsen, J.; Siewers, V. Expanding the Dynamic Range of a Transcription Factor-Based Biosensor in Saccharomyces cerevisiae. ACS Synth. Biol. 2019, 8, 1968–1975. [Google Scholar] [CrossRef] [PubMed]
  13. Jin, L.-Q.; Jin, W.-R.; Ma, Z.-C.; Shen, Q.; Cai, X.; Liu, Z.-Q.; Zheng, Y.-G. Promoter engineering strategies for the overproduction of valuable metabolites in microbes. Appl. Microbiol. Biotechnol. 2019, 103, 8725–8736. [Google Scholar] [CrossRef] [PubMed]
  14. Blazeck, J.; Garg, R.; Reed, B.; Alper, H.S. Controlling promoter strength and regulation in Saccharomyces cerevisiae using synthetic hybrid promoters. Biotechnol. Bioeng. 2012, 109, 2884–2895. [Google Scholar] [CrossRef]
  15. Blazeck, J.; Miller, J.; Pan, A.; Gengler, J.; Holden, C.; Jamoussi, M.; Alper, H.S. Metabolic engineering of Saccharomyces cerevisiae for itaconic acid production. Appl. Microbiol. Biotechnol. 2014, 98, 8155–8164. [Google Scholar] [CrossRef]
  16. Wang, J.; Zhai, H.; Rexida, R.; Shen, Y.; Hou, J.; Bao, X. Developing synthetic hybrid promoters to increase constitutive or diauxic shift-induced expression in Saccharomyces cerevisiae. FEMS Yeast Res. 2018, 18, foy098. [Google Scholar] [CrossRef]
  17. Guarente, L.; Yocum, R.R.; Gifford, P. A GAL10-CYC1 hybrid yeast promoter identifies the GAL4 regulatory region as an upstream site. Proc. Natl. Acad. Sci. USA 1982, 79, 7410–7414. [Google Scholar] [CrossRef] [Green Version]
  18. Feng, X.; Marchisio, M. Novel S. cerevisiae Hybrid Synthetic Promoters Based on Foreign Core Promoter Sequences. Int. J. Mol. Sci. 2021, 22, 5704. [Google Scholar] [CrossRef]
  19. Purvis, I.J.; Chotai, D.; Dykes, C.W.; Lubahn, D.B.; French, F.S.; Wilson, E.M.; Hobden, A.N. An androgen-inducible expression system for Saccharomyces cerevisiae. Gene 1991, 106, 35–42. [Google Scholar] [CrossRef]
  20. Yoshimatsu, T.; Nagawa, F. Effect of artificially inserted intron on gene expression in Saccharomyces cerevisiae. DNA Cell Biol. 1994, 13, 51–58. [Google Scholar] [CrossRef]
  21. Hoshida, H.; Kondo, M.; Kobayashi, T.; Yarimizu, T.; Akada, R. 5´-UTR introns enhance protein expression in the yeast Saccharomyces cerevisiae. Appl. Microbiol. Biotechnol. 2017, 101, 241–251. [Google Scholar] [CrossRef]
  22. Cui, X.; Ma, X.; Prather, K.L.; Zhou, K. Controlling protein expression by using intron-aided promoters in Saccharomyces cerevisiae. Biochem. Eng. J. 2021, 176, 108197. [Google Scholar] [CrossRef]
  23. Shimizu-Sato, S.; Huq, E.; Tepperman, J.M.; Quail, P.H. A light-switchable gene promoter system. Nat. Biotechnol. 2002, 20, 1041–1044. [Google Scholar] [CrossRef]
  24. Louvion, J.-F.; Havaux-Copf, B.; Picard, D. Fusion of GAL4-VP16 to a steroid-binding domain provides a tool for gratuitous induction of galactose-responsive genes in yeast. Gene 1993, 131, 129–134. [Google Scholar] [CrossRef]
  25. McIsaac, R.S.; Silverman, S.J.; McClean, M.N.; Gibney, P.A.; Macinskas, J.; Hickman, M.J.; Petti, A.A.; Botstein, D. Fast-acting and nearly gratuitous induction of gene expression and protein depletion in Saccharomyces cerevisiae. Mol. Biol. Cell 2011, 22, 4447–4459. [Google Scholar] [CrossRef] [PubMed]
  26. Alper, H.; Fischer, C.; Nevoigt, E.; Stephanopoulos, G. Tuning genetic control through promoter engineering. Proc. Natl. Acad. Sci. USA 2005, 102, 12678–12683. [Google Scholar] [CrossRef] [PubMed] [Green Version]
  27. Nevoigt, E.; Kohnke, J.; Fischer, C.R.; Alper, H.; Stahl, U.; Stephanopoulos, G. Engineering of promoter replacement cassettes for fine-tuning of gene expression in Saccharomyces cerevisiae. Appl. Environ. Microbiol. 2006, 72, 5266–5273. [Google Scholar] [CrossRef] [Green Version]
  28. Yuan, Y.; Zhao, H. Directed evolution of a highly efficient cellobiose utilizing pathway in an industrial Saccharomyces cerevisiae strain. Biotechnol. Bioeng. 2013, 110, 2874–2881. [Google Scholar] [CrossRef]
  29. Ruohonen, L.; Penttilä, M.; Keränen, S. Optimization of Bacillus α-amylase production by Saccharomyces cerevisiae. Yeast 1991, 7, 337–346. [Google Scholar] [CrossRef]
  30. Ruohonen, L.; Aalto, M.K.; Keränen, S. Modifications to the ADH1 promoter of Saccharomyces cerevisiae for efficient production of heterologous proteins. J. Biotechnol. 1995, 39, 193–203. [Google Scholar] [CrossRef]
  31. Raveh-Sadka, T.; Levo, M.; Shabi, U.; Shany, B.; Keren, L.; Lotan-Pompan, M.; Zeevi, D.; Sharon, E.; Weinberger, A.; Segal, E. Manipulating nucleosome disfavoring sequences allows fine-tune regulation of gene expression in yeast. Nat. Genet. 2012, 44, 743–750. [Google Scholar] [CrossRef] [PubMed]
  32. Redden, H.; Alper, H.S. The development and characterization of synthetic minimal yeast promoters. Nat. Commun. 2015, 6, 7810. [Google Scholar] [CrossRef] [PubMed] [Green Version]
  33. Li, Z. Characterization of Promoters from Saccharomyces cerevisiae and Escherichia coli and Application in Metabolic Engineering. Beijing Institute of Technology, 2015. Available online: https://www.ckcest.cn/default/es3/detail/1003/dw_thesis_copy/e387acd6d014df8e2a43f2206b20b7df (accessed on 20 April 2022).
  34. Partow, S.; Siewers, V.; Bjørn, S.; Nielsen, J.; Maury, J. Characterization of different promoters for designing a new expression vector in Saccharomyces cerevisiae. Yeast 2010, 27, 955–964. [Google Scholar] [CrossRef] [PubMed]
  35. Aref, R.; Schüller, H.-J. Functional analysis of Cti6 core domain responsible for recruitment of epigenetic regulators Sin3, Cyc8 and Tup1. Curr. Genet. 2020, 66, 1191–1203. [Google Scholar] [CrossRef] [PubMed]
  36. Tagoj, M.N.; Comino, A.; Komel, R. Fluorescence based assay of GAL system in yeast Saccharomyces cerevisiae. FEMS Microbiol. Lett. 2005, 244, 105–110. [Google Scholar] [CrossRef] [Green Version]
  37. Yang, X.; Liu, J.; Zhang, J.; Shen, Y.; Qi, Q.; Bao, X.; Hou, J. Quorum sensing-mediated protein degradation for dynamic metabolic pathway control in Saccharomyces cerevisiae. Metab. Eng. 2021, 64, 85–94. [Google Scholar] [CrossRef] [PubMed]
  38. Williams, T.; Averesch, N.; Winter, G.; Plan, M.; Vickers, C.; Nielsen, L.; Krömer, J. Quorum-sensing linked RNA interference for dynamic metabolic pathway control in Saccharomyces cerevisiae. Metab. Eng. 2015, 29, 124–134. [Google Scholar] [CrossRef]
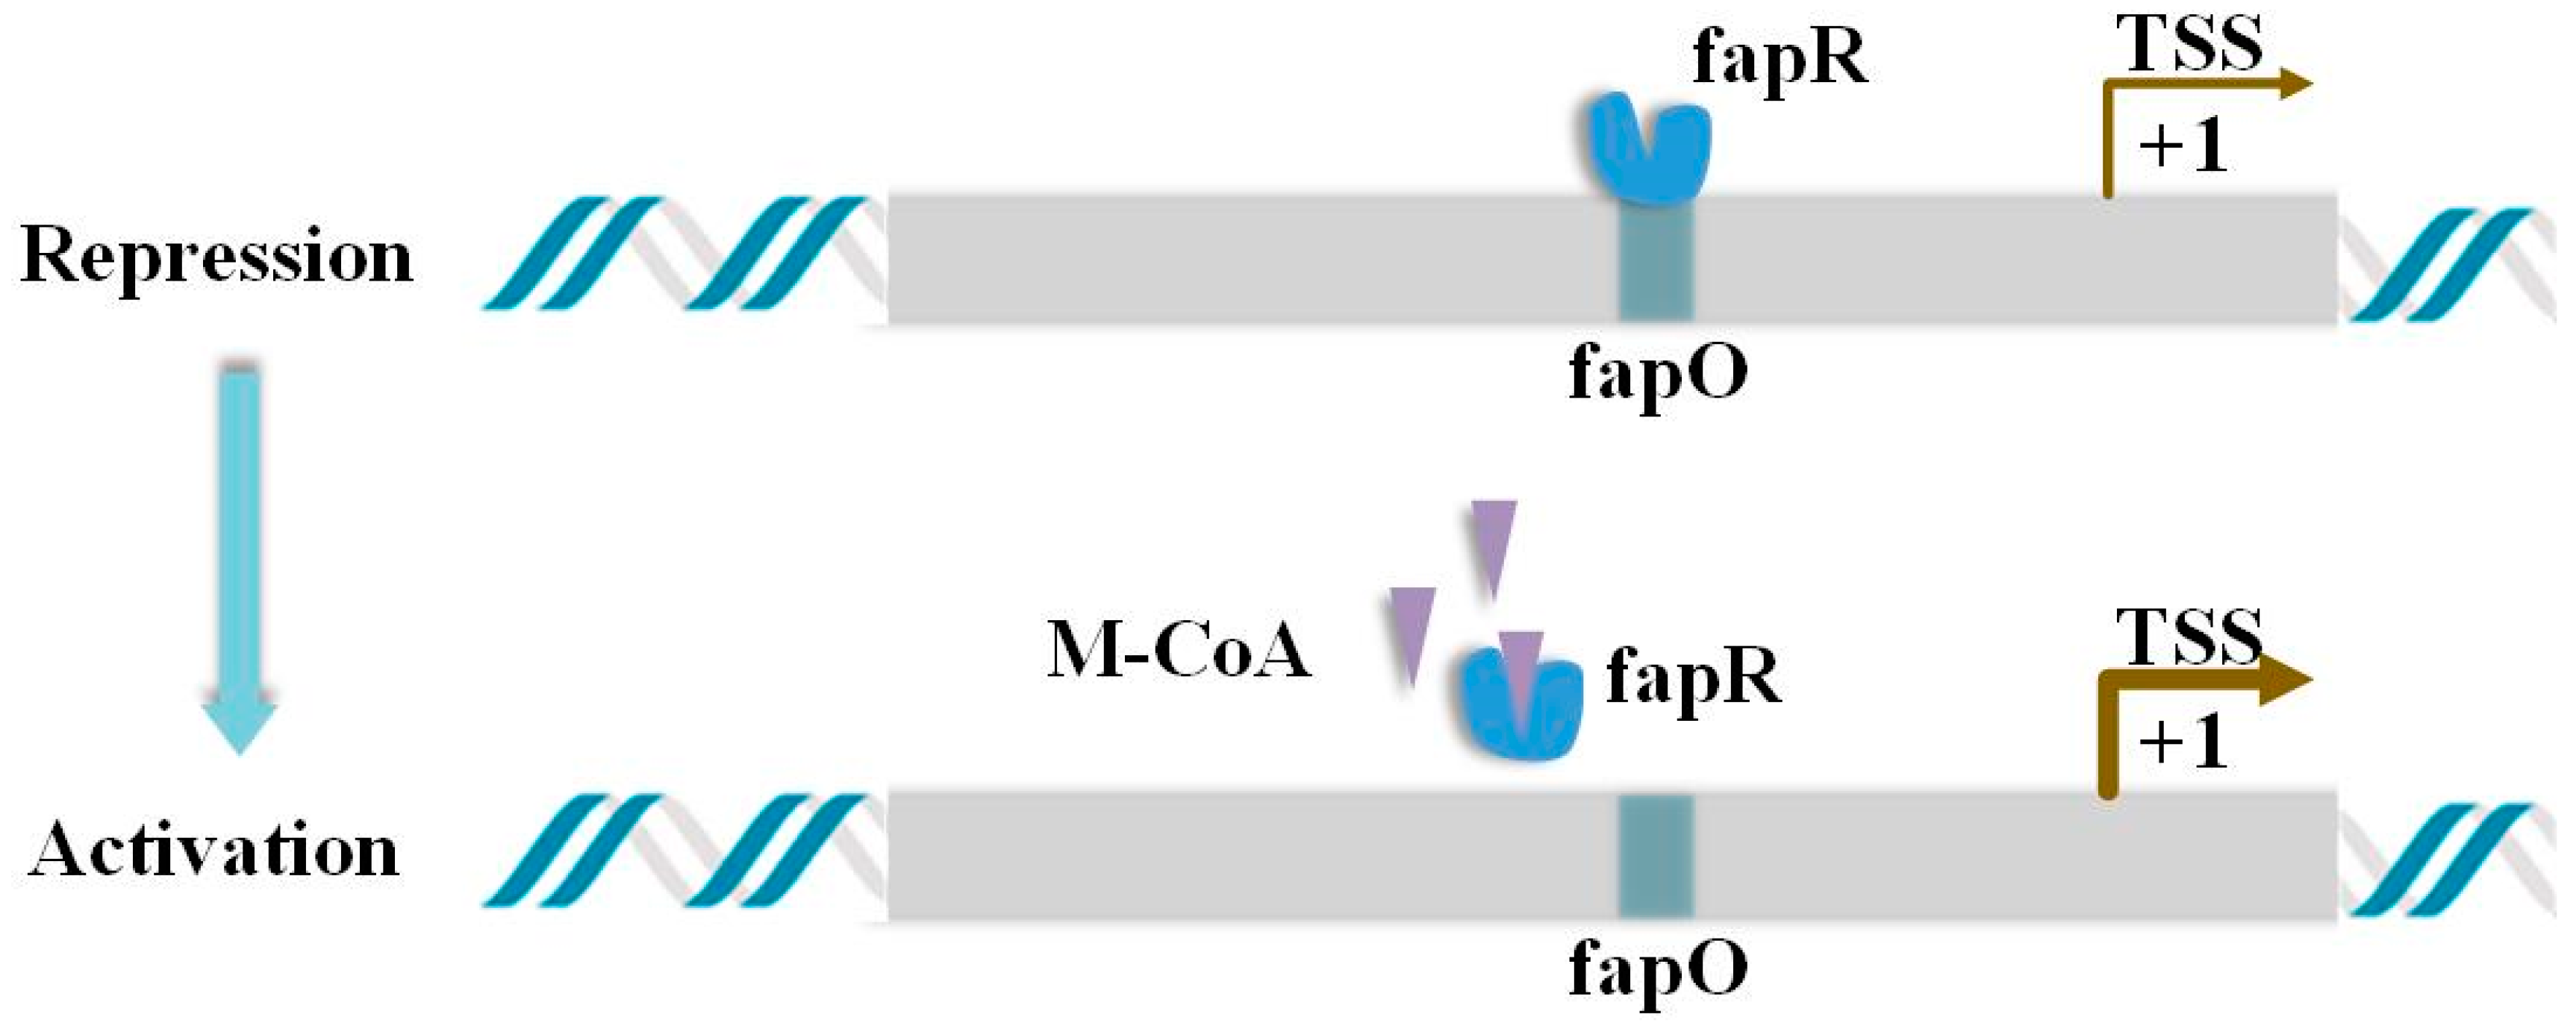
Figure 1. Regulatory mechanism of fapO/fapR elements. The grey area represents the promoter sequence containing the fapO binding site. When fapR binds to fapO in the sequence, transcription is inhibited. When the intracellular concentration of M-CoA increases, M-CoA binds to fapR, so that fapR is allosterically separated from fapO, and transcriptional inhibition is abolished.
Processes 10 02660 g001
Figure 2. Construction of Malonyl-CoA biosensor. (a) Engineering promoters and sensor strains’ GFP fluorescence detection results. pTFE1 selects 120 bp upstream of ATG as the insertion site, and other promoters select a site upstream (−2) or downstream (7) of TATA-box to insert fapO. Assessing changes in fluorescence levels 2 h after addition of 8 mg/L cerulenin in engineered promoter strains expressing fapR or not, (b) Response curves of different sensors. The response curves of the previously constructed sensor strains were obtained by adding 0, 4, 8, 12, 16 mg/L cerulenin. Error bars represent the standard deviation of three independent experiments. Statistical significance was determined by One-way ANOVA test, ns: non-significant, ** p < 0.01, *** p < 0.001.
Processes 10 02660 g002
Figure 3. GFP fluorescence detection results of engineered promoters and sensor strains. (a) Different fapO insertion sites. (b) Combination of sites with better performance. Comparison of the fluorescence intensity of the engineered promoters and the response to 4 mg/L cerulenin addition after expressing fapR. Error bars represent the standard deviation of three independent experiments.
Processes 10 02660 g003
Figure 4. Optimization methods with different promoter engineering strategies. (a) Strategy design combining different promoter engineering. In detail, TFBS means TFBSpFBA1 + TFBSpGPM1, 5′UTR comes from pTEF1, and intron is RPL23A. (b) The results of GFP fluorescence detection by engineering promoters and sensors which were combined with promoter engineering strategies hybrid or intron inserting. (c) Fluorescence detection results of modified fapR sensor strains. (d) Response curves of sensor strains H-pCCW12(223217)-fapR, H-pCCW12(TFBS)-fapR, H-pCCW12(TFBS)-Cti6~fapR and H-pCCW12(TFBS)-Gal80~fapR. Error bars represent the standard deviation of three independent experiments. Statistical significance was determined by One-way ANOVA test, ns: non-significant, * p < 0.05, ** p < 0.01, *** p < 0.001.
Processes 10 02660 g004
Publisher’s Note: MDPI stays neutral with regard to jurisdictional claims in published maps and institutional affiliations.