Article

Research on the Application of Coal Gasification Slag in Soil Improvement

1
Guoneng Xinjiang Chemical Co., Ltd., Urumqi 831499, China
2
School of Chemical and Environmental Engineering, China University of Mining and Technology (Beijing), Beijing 100083, China
3
School of Mining Engineering, Taiyuan University of Technology, Taiyuan 030024, China
4
Sujiagou Coal Co., Ltd., Dalat County, Ordos 014300, China
*
Author to whom correspondence should be addressed.
Processes 2022, 10(12), 2690; https://doi.org/10.3390/pr10122690
Submission received: 20 October 2022 / Revised: 26 November 2022 / Accepted: 29 November 2022 / Published: 13 December 2022

Abstract

:
SEM, particle size analysis, and contaminant content of coarse coal gasification slag (CCGS) produced by Shenhua Xinjiang Chemical Co., Ltd. were measured, respectively, and the physicochemical properties of the soil after improvement using gasification slag were investigated in this paper. The results showed that the slag was porous, the particle size was small and the pollutant content was extremely low. Its pollutants were closely related to the pollutants in the raw coal. The coarse slag had a limited effect on soil particle size and texture improvement; the soil water retention performance increased with the increase of proportion of the slag, while pH and conductivity decreased; the improvement effect on soil SOM and available potassium was remarkable; the larger the proportion of the slag, the stronger the effect on maintaining soil alkali-hydrolyzed nitrogen, ammonium nitrogen, and available phosphorus. However, the effect was small, and increased the ion content, especially the cation in soil, and the sum of the eight soil ions before and after evaporation decreased. The results demonstrated that the CCGS generated by the corporation is feasible for soil improvement, and the study has important reference value for the comprehensive utilization of coal gasification slag.

1. Introduction

The 2021 China Mineral Resources Report pointed out that China’s coal consumption was 4.3 billion tons in 2020, accounting for 56.8% of the energy consumption, and will remain the main energy source in China [1].
Coal gasification slag (CGS) is a residue of molten liquid material formed after a series of complex physicochemical changes of ash and additives during the gasification of coal in a vaporizer under high temperature and pressure, which is obtained by cooling in an excitation chamber [2]. With the increase of coal production in China and the rapid development of coal chemical processing technology, the production of coal gasification slag has increased dramatically [3]. The annual output of CGS is over 33 million tons [4]. Among them, coarse slag is discharged regularly in liquid form through an air-locked slag trap, while the fine slag is discharged from the gasifier with the wastewater and settled into the slag outlet through the settling separator. The coarse slag accounts for more than 60% to 80%, and is the main object of disposal.
There is no satisfactory disposal method for CGS, which is usually disposed by backfill into the ground in China, which may cause pollution and ecological damage to the environment and occupy a large area of land resources, changing their original nature. It is of great significance to understand the nature of CGS, which can guide the recycling utilization and harmless treatment of CGS.
For this purpose, a large number of scholars at home and abroad have studied the properties of CGS. In the literature [4], the nature of CGS produced by a gasifier invented by China Academy of Launch Vehicle Technology used by Luxi Chemical Co., Ltd., a Texaco gasifier used by Weihe Chemical Co., Ltd., Xianyang Chemical Co., Ltd., Shenmu Chemical Co., Ltd., a gasifier of multi-nozzle opposed coal plasma gasification used by Hualu Hengsheng Chemical Co., Ltd., and a Shell gasifier used by Yixiang Chemical Co., Ltd. were studied. It was found that the gasification process, composition of raw coal, ash content and other factors significantly affect the CGS composition, and different gasification slags have different properties. Yang et al. [5] and Zhao et al. [6] analyzed the chemical composition and mineral composition of fine slag produced by the Texaco gasifier, GSP (Gaskombiant Schwarze pumpe) gasifier and four-nozzle CWS gasifier used by Ningxia Coal Group. Shuai et al. [2] studied the chemical composition and phase composition of CGS from various gasifiers such as Xianyang Texaco gasifier and Shenmu Texaco gasifier and concluded that the main components of both coarse and fine slags were SiO2, Al2O3, Fe2O3, CaO, and residual carbon. Many studies demonstrate that CGS is generally a solid waste [6].
Yin et al. [7] studied the CGS of the Texaco gasifier using a scanning electron microscope (SEM) and petrographic analysis, and found that CGS is porous. Li [8] obtained similar results as Yin Acosta [9], and found that CGS had both a smooth surface and a porous matrix. The density of the coarse slag was 2.5857 g/cm3 and the specific surface area was 1.066 m2/g, with a predominantly smooth surface. The surface of the particles have edges and corners, which promote the melting and sintering of slag particles [5,7]; Wu et al. [10] studied the morphology of coarse and fine slags produced by the gasification of coal plasma in entrained flow beds under a microscope by oil immersion and found that CGS had both bright carbon particles and greyish-dark glassy particles, and the coarse slag samples had significantly fewer bright carbon particles than fine slags [11,12].
The residual carbon content is related to the type of coal, the gasification process conditions and operating conditions, and varied considerably between the different types of CGS. In general, the length of time that fine slag stays in the bed is shorter than that of coarse slag, resulting in the higher residual carbon content in fine slag than coarse slag and lower mechanical strength than coarse slag. In addition, the distribution of residual carbon in coarse and fine slag is not uniform [13].
It can be seen from the above studies that the characteristics of CGS vary from region to region due to the influence of raw materials and the preparation process. Xinjiang Chemical Co., Ltd. currently has a 680,000 ton/year coal-based new materials project in operation, with an annual output of 1,011,400 tons of general solid waste, of which 431,700 is coarse gasification slag, which is the main target for kackfill. In this study, the characteristics of CGS produced by Shenhua Xinjiang Chemical Co., Ltd. in Ganquanbao Industrial Zone, Urumqi, Xinjiang Uygur Autonomous Region, China were studied in terms of its microstructure, typical pollutants, and the feasibility for soil improvement. The study aimed to provide a strong scientific basis for the safe utilization of CCGS, which is of significance for green development of coal industry.

2. Overview of the Case Study Area

Shenhua Xinjiang Chemical Co., Ltd. was established in 2011. The 680,000 tons per year coal-based new material project is located on the east of No.1 Road and the south side of No.3 Road in Ganquanpu Industrial Zone, Urumqi, Xinjiang Uygur Autonomous Region. The total investment is 22 billion RMB. It is a key demonstration project of China Shenhua Coal-to-Liquid and Chemical Co., Ltd., and a key industrial project in Xinjiang. The project aims to give full play to the advantages of rich coal resources in Xinjiang, producing high value-added olefin products. The project started construction in July 2013, began commissioning a test run at the end of May 2016, produced qualified methanol on 17 June 2016, SHMTO device feeding on 23 September 2016, officially smoothed the whole process on 3 October 2016, and the production of qualified polyolefin products for the commercial operation was officially realized in 2017. The coal gasification system uses coal from Hongshaquan Coal Mine and Heishan coal mine, east of Junggar Basin, Xinjiang, and oxygen (purity vol % ≥ 99.6) as raw materials. Pressurized plasma gasification of coal gasification and the chilling process of General Electric Shenhua Gasification Technology Co., Ltd. was adopted to produce crude syngas with CO and H2 as active ingredients. Gasification slag is discharged from the bottom of the furnace.

3. Sample Collection and Treatment

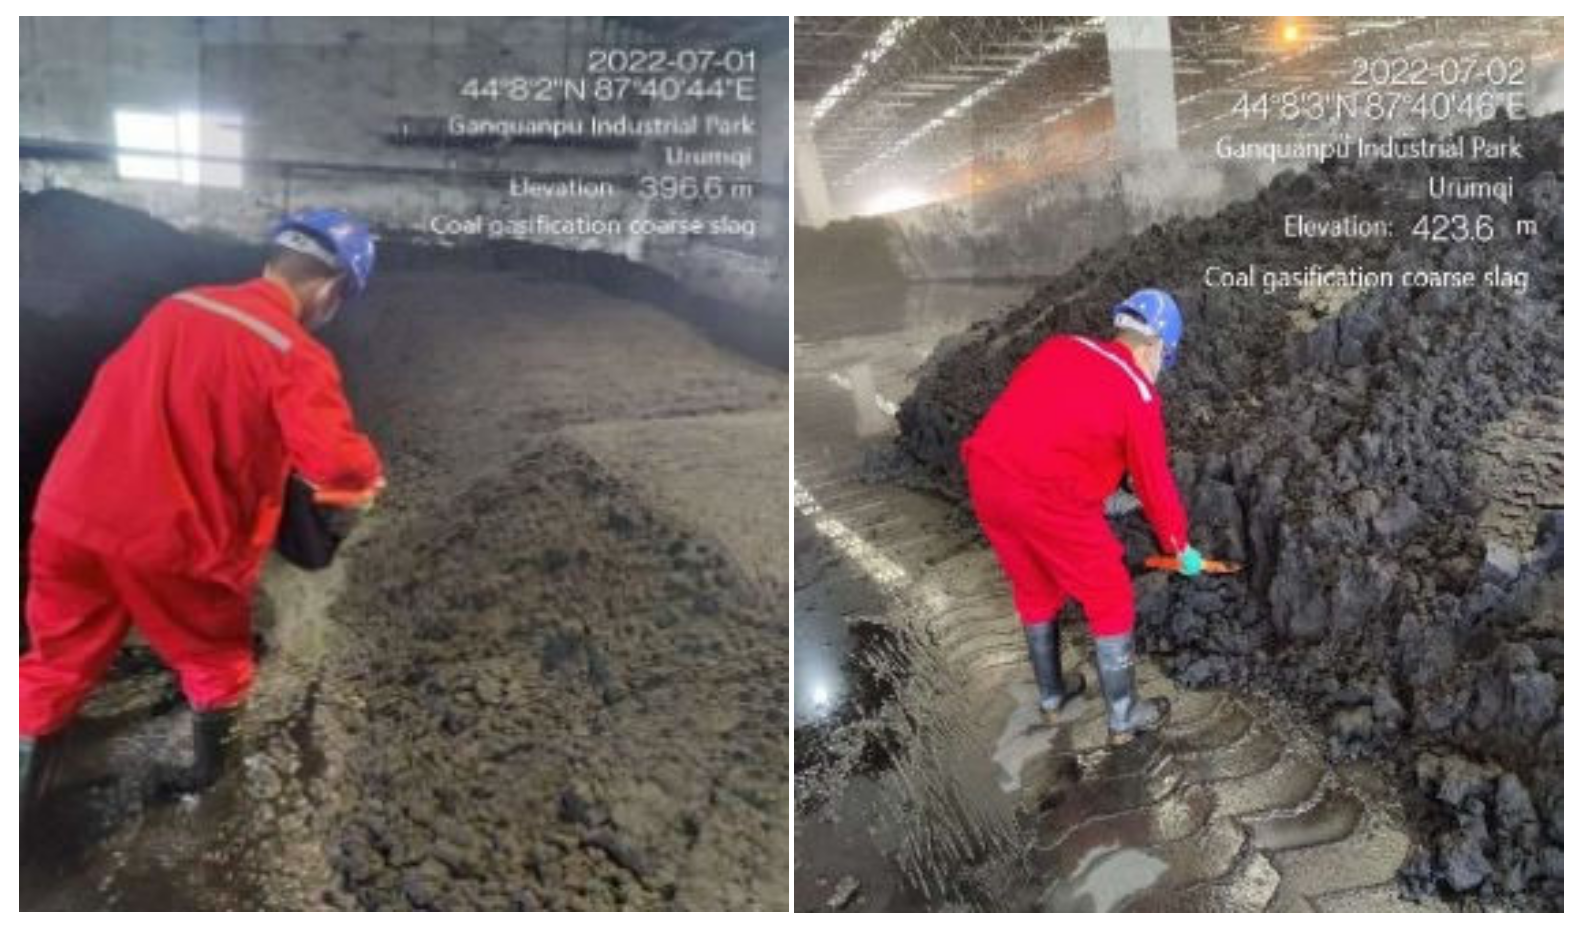
3.1. Sample Collection

Before collecting samples, it was necessary to first understand the generation process of coarse coal gasification slag (CCGS) in order to determine the sampling plan. The generation process of CCGS is as follows: the high temperature coarse coal and gas leaving the reaction chamber and the liquid slag enter the quench chamber together. The slag is solidified in the water bath and sinks to the bottom of the gasifier. The slag water flows into the slag trap, and relatively clean water at the upper part returns to the bottom of the quench chamber of the gasifier. Through this water circulation, the slag, and other solids at the bottom of the chilling chamber, are flushed to the slag trap. The slag trap outlet valve is opened, the water and slag in the slag trap is replaced with cleaner water, and the slag and water is sent to the slag machine in the slag tank. After the CGS is pulled out by the slag scraper, there is a temporary slag field, and the slag water containing the fine slag is sent to the first vacuum flash separator of the black water flash system. Therefore, the CCGS is collected at the slag tank and slag field. Sampling was done in strict accordance with the industrial solid waste sampling technical standard (HJ/T 20-1998).
Field sampling photos are shown in Figure 1.

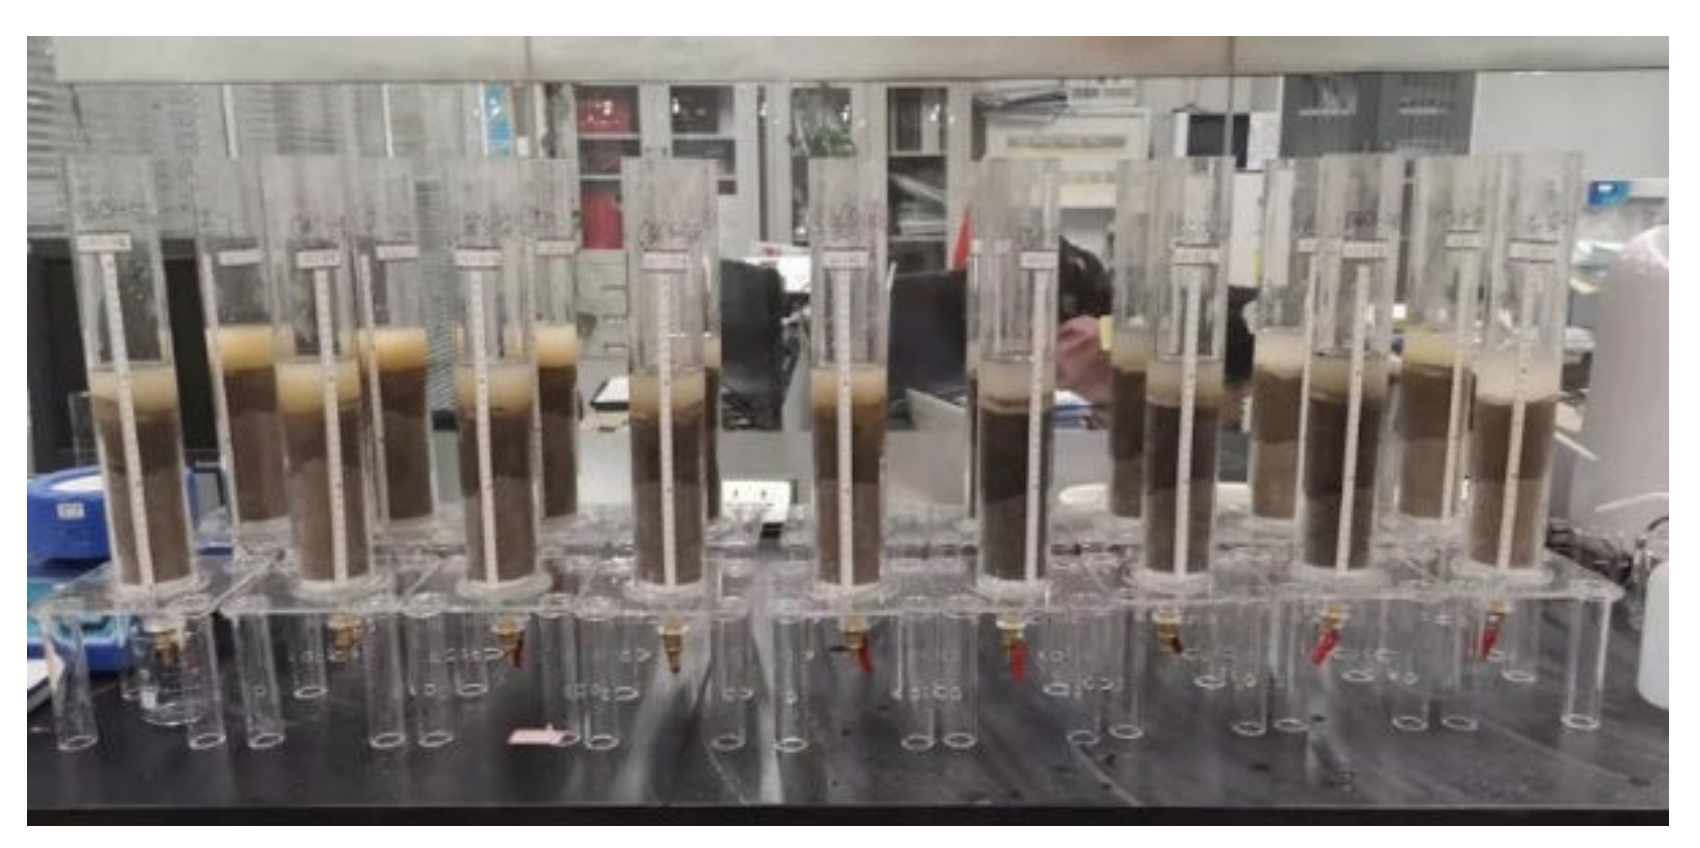
3.2. Sample Treatment and Analysis

Abnormal matters were removed from the CCGS samples. Samples were kept away from the light, dried naturally and stored properly for testing. The CGS samples were made into a dispersion. After ultrasonic dispersion, samples were directly dropped on the conductive adhesive on the sample holder or on another conductive media on the sample holder for scanning electron microscope observation and analysis. According to the relevant standards, the particle size distribution of CCGS was analyzed by a laser particle size analyzer. A PHS-3E pH meter, 723 visible spectrophotometer, AFS-933 atomic fluorescence spectrometer, inductively coupled plasma emission spectrometer (ICP) ICP-5000, PXSJ-216 ion meter were used to measure the pH value and heavy metal content of the CGS.
The CCGS samples were directly dried and crushed to particle size less than 10 mm. The coal samples were divided into 100–150 g by the method of coning and quartering to prepare the analysis samples. When the coal samples were crushed, the 100–150 g analysis coal gasification crude slag samples must be crushed to less than 0.15 mm, and the particle size of 0.10–0.15 mm is required to be more than 70%. The crushed coal samples were sealed and stored in a wide mouth bottle, and the testing was completed within 30 days.

4. Testing Results of CCGS

4.1. Microscopic Characterization

The scanning electron microscope result (Figure 2) shows that the coarse slag particles of coal gasification are angular, uneven in size, amorphous carbon block distribution, and the surface is composed of irregular porous structure, showing honeycomb holes and large roughness. This morphology is related to the formation of water quenching of coarse slag in the molten state of silicon and aluminum. Porous structure can be considered as applied to adsorption, including pollution control or water and fertilizer research.
It can be seen from the particle size distribution curve of CCGS in Figure 3 that the particle size distribution of CCGS is between 2.8–1022 μm, and mainly distributed between 20–500 μm.

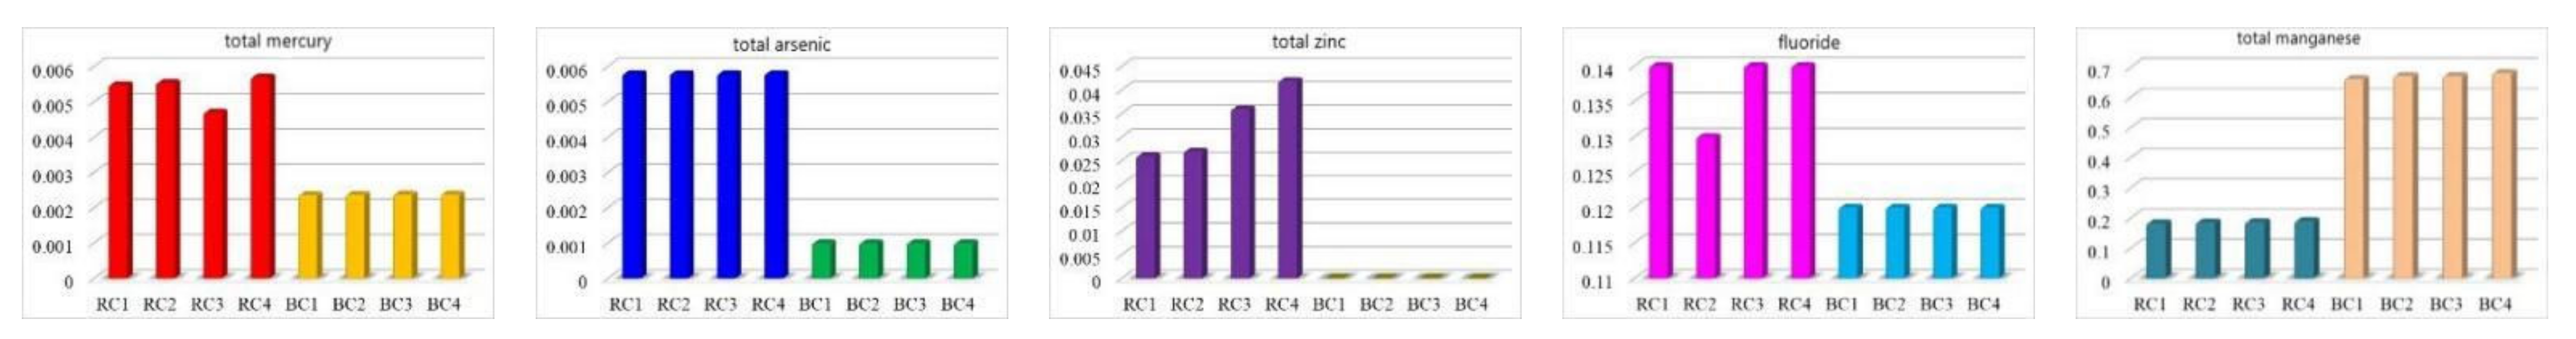
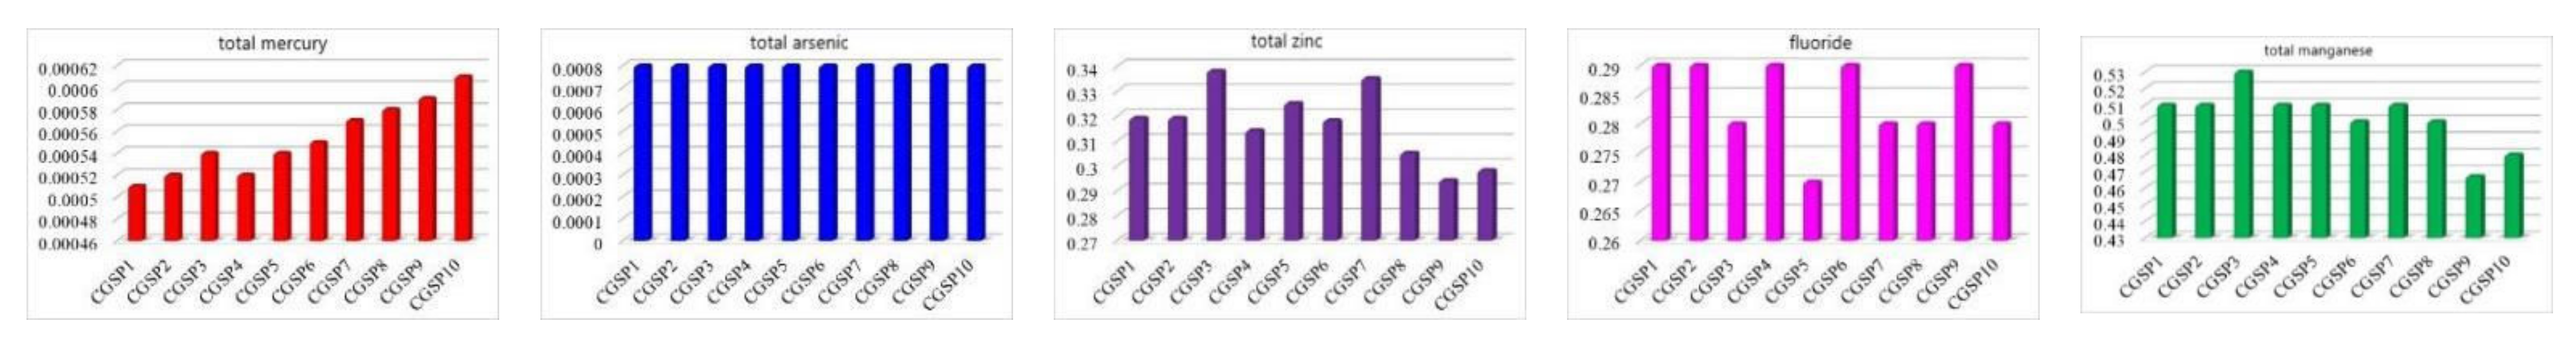
4.2. Pollutant Content

4.2.1. Raw Coal Analysis

Throughout the gasification process, raw coal particles will be heated and decomposed in a short time. Volatiles also volatilizes when heated, which deepens the degree of graphitization of carbon and produce char. Then, the interior of the particles is filled with the gasification agent (H2O, O2), and the gasification reaction proceeds accordingly. Then, the gas will be generated, discharged, and collected. At the same time, the graphitization is further deepened. The coal char particles gradually enter the critical state of crushing, and the conditions remains unchanged after reaching this state. The coal char particles naturally begin to break after exceeding the critical state. The formation of slag is closely related to this process, which is formed by homogeneous and heterogeneous reactions between coal char particles and residual minerals.
According to the company’s production process of CCGS, it can be determined that the main sources of pollutants in CCGS are: (1) raw coal mainly composed of Hongshaquan coal and Heishan coal; (2) additives that play a role in regulating viscosity during gasification; and (3) water sources, such as clean water for the grinding pool, and coal to olefin (MTO) wastewater.
In the above pollutant sources, the main component of the additive is sodium lignosulfonate, without special odor, non-toxic, soluble in water and alkali. So, the presence of characteristic pollutants risk was excluded preliminarily; the clean water in the grinding tank mainly includes high-quality reclaimed water, MTO wastewater, and the reuse water used for washing pipelines. The composition of MTO wastewater is relatively complex. The water contains a variety of organic compounds (methanol, dimethyl ether, etc.), and has the characteristics of low calorific value and low COD, so the existence of characteristic pollutants in the wastewater cannot be preliminarily judged.
It can be seen from the coal gasification process that the characteristic pollutants in the CCGS are closely related to the substances in the raw coal. Therefore, it was necessary to carry out industrial analysis (moisture content, ash content, volatile, and fixed carbon) of the raw coal first, and the analysis results are shown in Figure 4.
According to the results of Figure 4 and the classification of Chinese coal and the ash composition table of Chinese coal, Hongshaquan coal and Heishan coal belong to bituminous coal. Hongshaquan coal has a high ash content and low volatility. A high ash content means that the coal consumption in the gasification process increases. Correspondingly, the workload of the gasifier and ash treatment system also increases. In terms of volatile matter, the content of coal with a low degree of coalification becomes higher, i.e., the ‘younger’ the coal, the better its reactivity in gasification, and the more efficient it will be throughout the gasification process. Compared with Hongshaquan coal, Heishan coal has the characteristics of low ash, low sulfur, and is of good quality.
Coal ash is a very complex inorganic mixture whose composition is usually represented by oxides. Coal ash is composed of SiO2, Al2O3, Fe2O3, CaO, MgO, Na2O, K2O, TiO2, etc. SiO2, Al2O3 and TiO2 are acidic oxides, while Fe2O3, CaO, MgO, Na2O and K2O are alkaline oxides.
Acid oxide has the ability to increase the ash melting temperature: the higher the acid oxide content, the higher the melting temperature. The effect of alkaline oxide is the opposite: the higher the content, the lower the melting temperature. The chemical composition of coal ash has an important influence on the formation of slag in the gasification process of raw coal through the melting temperature. The gasifier provides a high-temperature and high-pressure environment. The raw coal produces physical and chemical changes in this environment, and eventually produces solid matter, namely, the slag. The ash composition analysis of raw coal is shown in Figure 5. Compared with Heishan coal, the content of acidic oxides in Hongshaquan coal is higher and the content of alkaline oxides is lower. The above chemical composition content factors are the reason why the melting temperature of Hongshaquan coal is higher than that of Heishan coal. Overall, the chemical substances and composition in the coal sample not only affect its own melting characteristics, but also inhibit or accelerate the gasification process.
In addition, it can also be seen that the main components of the raw coal used in coal gasification production by Xinjiang Chemical Co., Ltd. are fixed carbon and dry ash-free volatiles, do not contain radioactive substances, and contain a small amount of silicon, aluminum, iron, calcium, potassium, sodium, nickel, magnesium, manganese, titanium and other oxides, and may contain arsenic, mercury, lead and other characteristic pollutants. Therefore, it can be preliminarily estimated that characteristic pollutants can exclude the influence of radioactive pollutants.
Figure 6 shows test results of pH, fluoride, total chromium, hexavalent chromium, total cyanide, total mercury, total arsenic, total cadmium, total lead, total nickel, total zinc, total copper, total manganese, total beryllium, total silver, sulfide, alkyl mercury and other characteristic pollutants in Hongshaquan coal and Heishan coal. The samples of Hongshaquan coal were recorded as RC1, RC2, RC3 and RC4, respectively, and the samples of Heishan coal were recorded as BC1, BC2, BC3 and BC4, respectively. It is important to note that total cadmium, total chromium, total lead, total nickel, total cyanide, total copper, hexavalent chromium, total beryllium, total silver, methyl mercury and ethyl mercury were not detected.
It can be seen from the test results that only six items of total mercury, total arsenic, total zinc, total manganese, fluoride and pH were detected in the raw coal, and total zinc was only detected in the Hongshaquan coal sample, and not detected in the Heishan coal sample. It can be preliminarily estimated that if other pollutants other than these six items are detected in the CGS, it is not related to the raw coal and is deemed to be related to other materials. According to the Integrated Wastewater Discharge Standard (GB 8978-1996), the total mercury, total arsenic, total zinc, total manganese, fluoride, and pH requirements are 0.05 mg/L, 0.5 mg/L, 2.0 mg/L, 2.0 mg/L, 10 mg/L, 6-9, respectively. It can be seen that the content does not exceed the standard requirements. If these six types of pollutants are detected to exceed the standard in the test results of CCGS, it may be other materials that introduce the pollutants.

4.2.2. Contents of Characteristic Pollutants in CCGS

The pH, fluoride, total chromium, hexavalent chromium, total cyanide, total mercury, total arsenic, total cadmium, total lead, total nickel, total zinc, total copper, total manganese and other characteristic pollutants of CCGS were characterized. The samples used for the detection of characteristic pollutants in CCGS were labeled as CGSP1, CGSP2, CGSP3, CGSP4, CGSP5, CGSP6, CGSP7, CGSP8, CGSP9 and CGSP10, respectively. Total cadmium, total chromium, total lead, total nickel, total cyanide, total copper, hexavalent chromium, total beryllium, total silver, methyl mercury and ethyl mercury were not detected.
The test results are shown in Figure 7. Through the data, it was found that the characteristic pollutants in the CCGS are: total mercury, total arsenic, total zinc, total manganese, fluoride, and pH. This is consistent with the characteristic pollutants detected in raw coal. Moreover, except that the pH of raw coal and CCGS is roughly the same, the remaining characteristic pollutants decreased significantly. It is speculated that the characteristic pollutants in raw coal may be distributed to other by-products or recycled materials, such as fine coal gasification slag; It is speculated that under this process condition, other materials except raw coal introduce less pollution. All the pollution did not exceed the standard GB 8978-1996. The dimensionless quantities obtained by comparing the measured values with the standard requirements were characterized, and the average values were taken. It was found that the dimensionless quantities corresponding to total mercury, total arsenic, total zinc, total manganese, and fluoride were 0.01, 0.002, 0.16, 0.26 and 0.03, respectively. Therefore, content of various pollutants was far below the standard requirements and the slag is feasible for secure application.

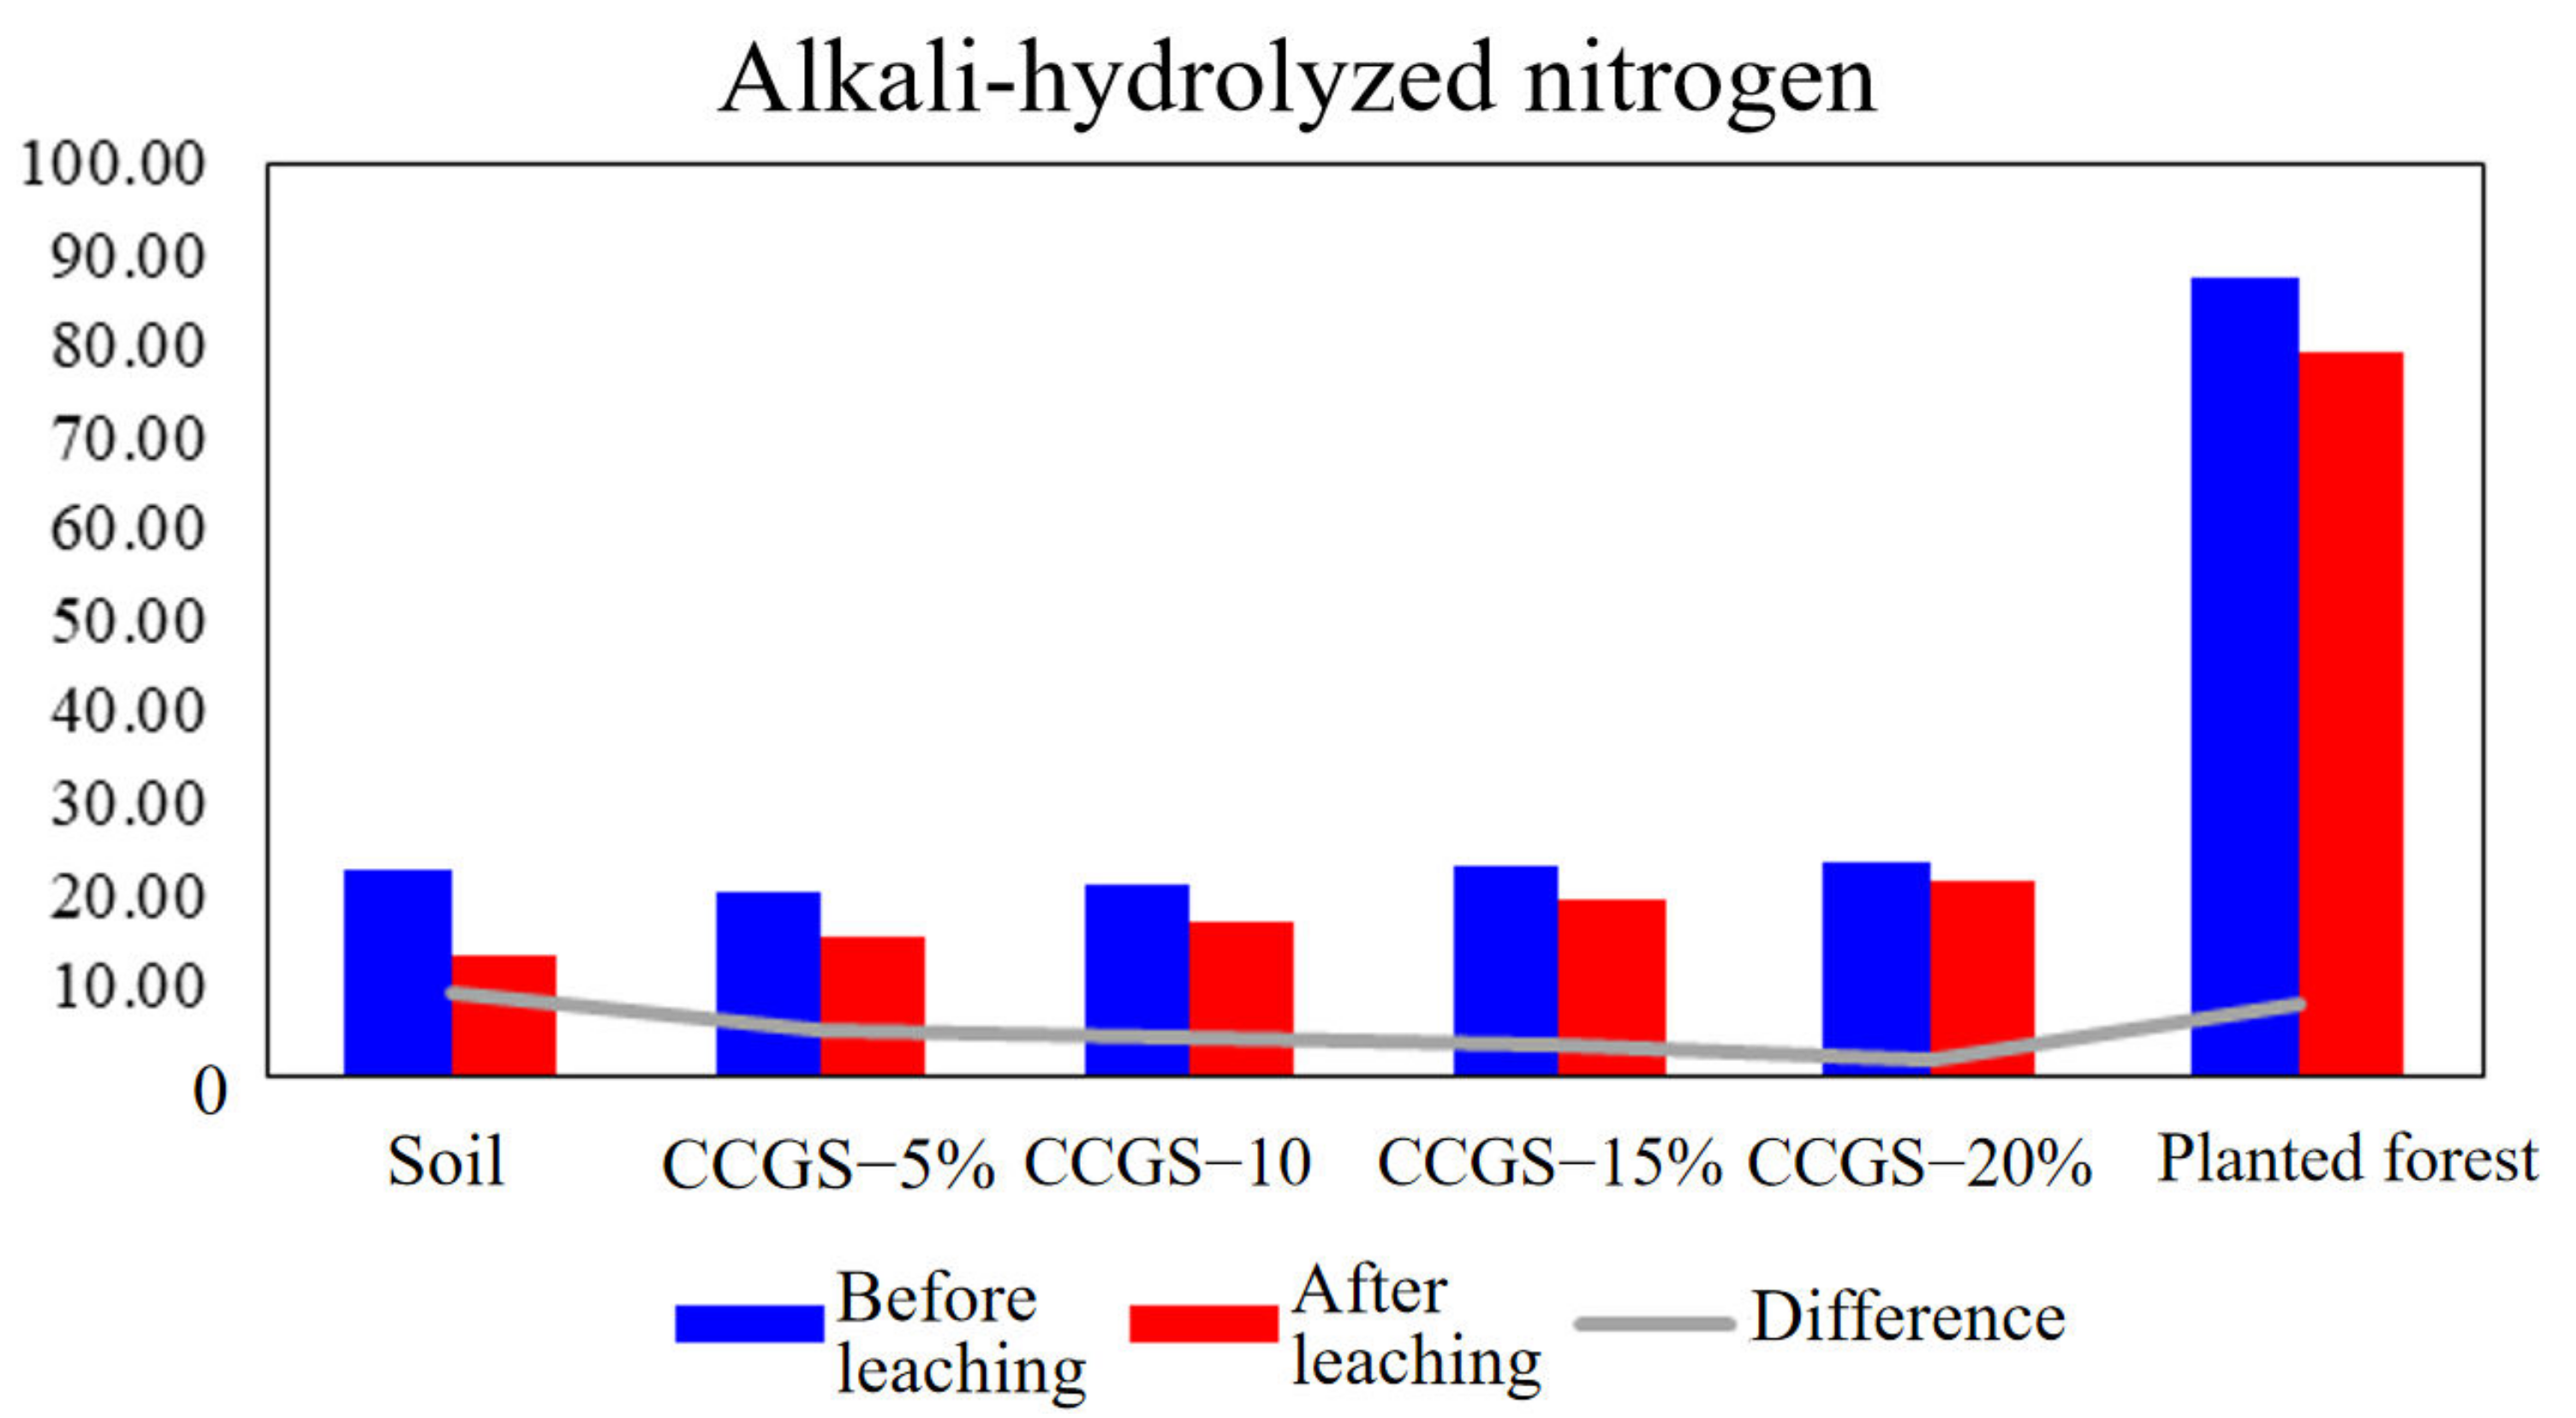
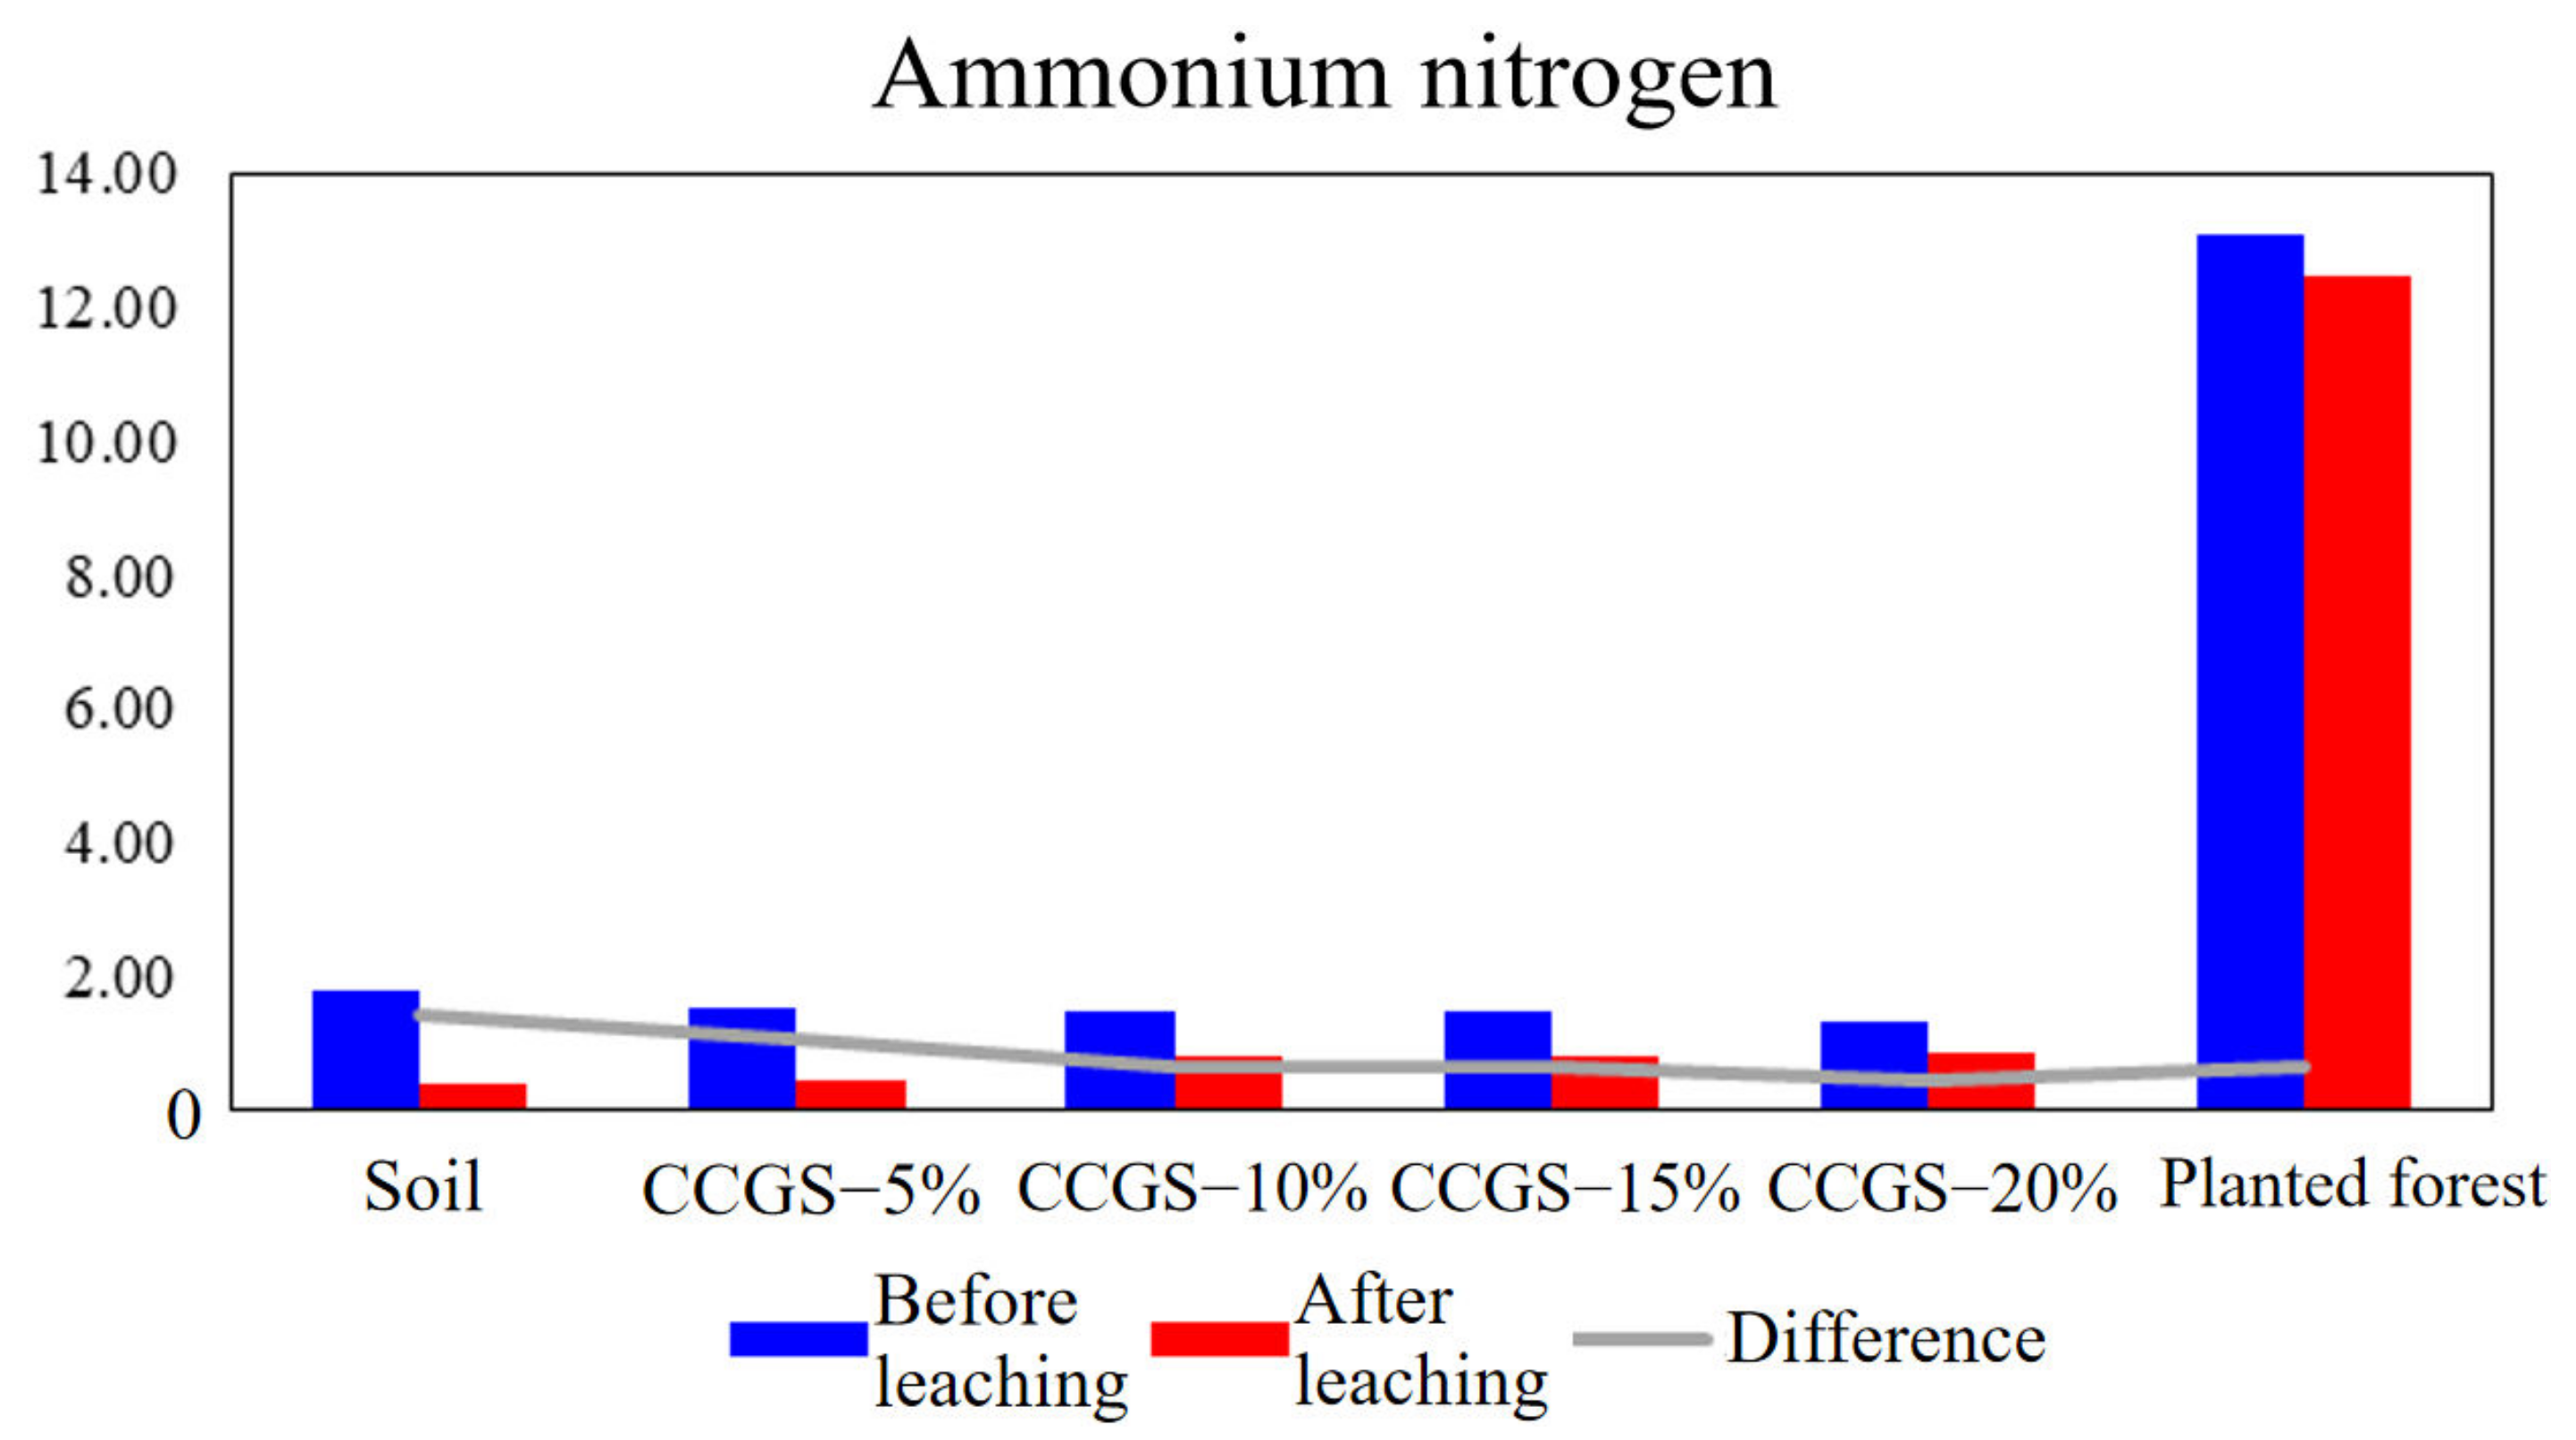
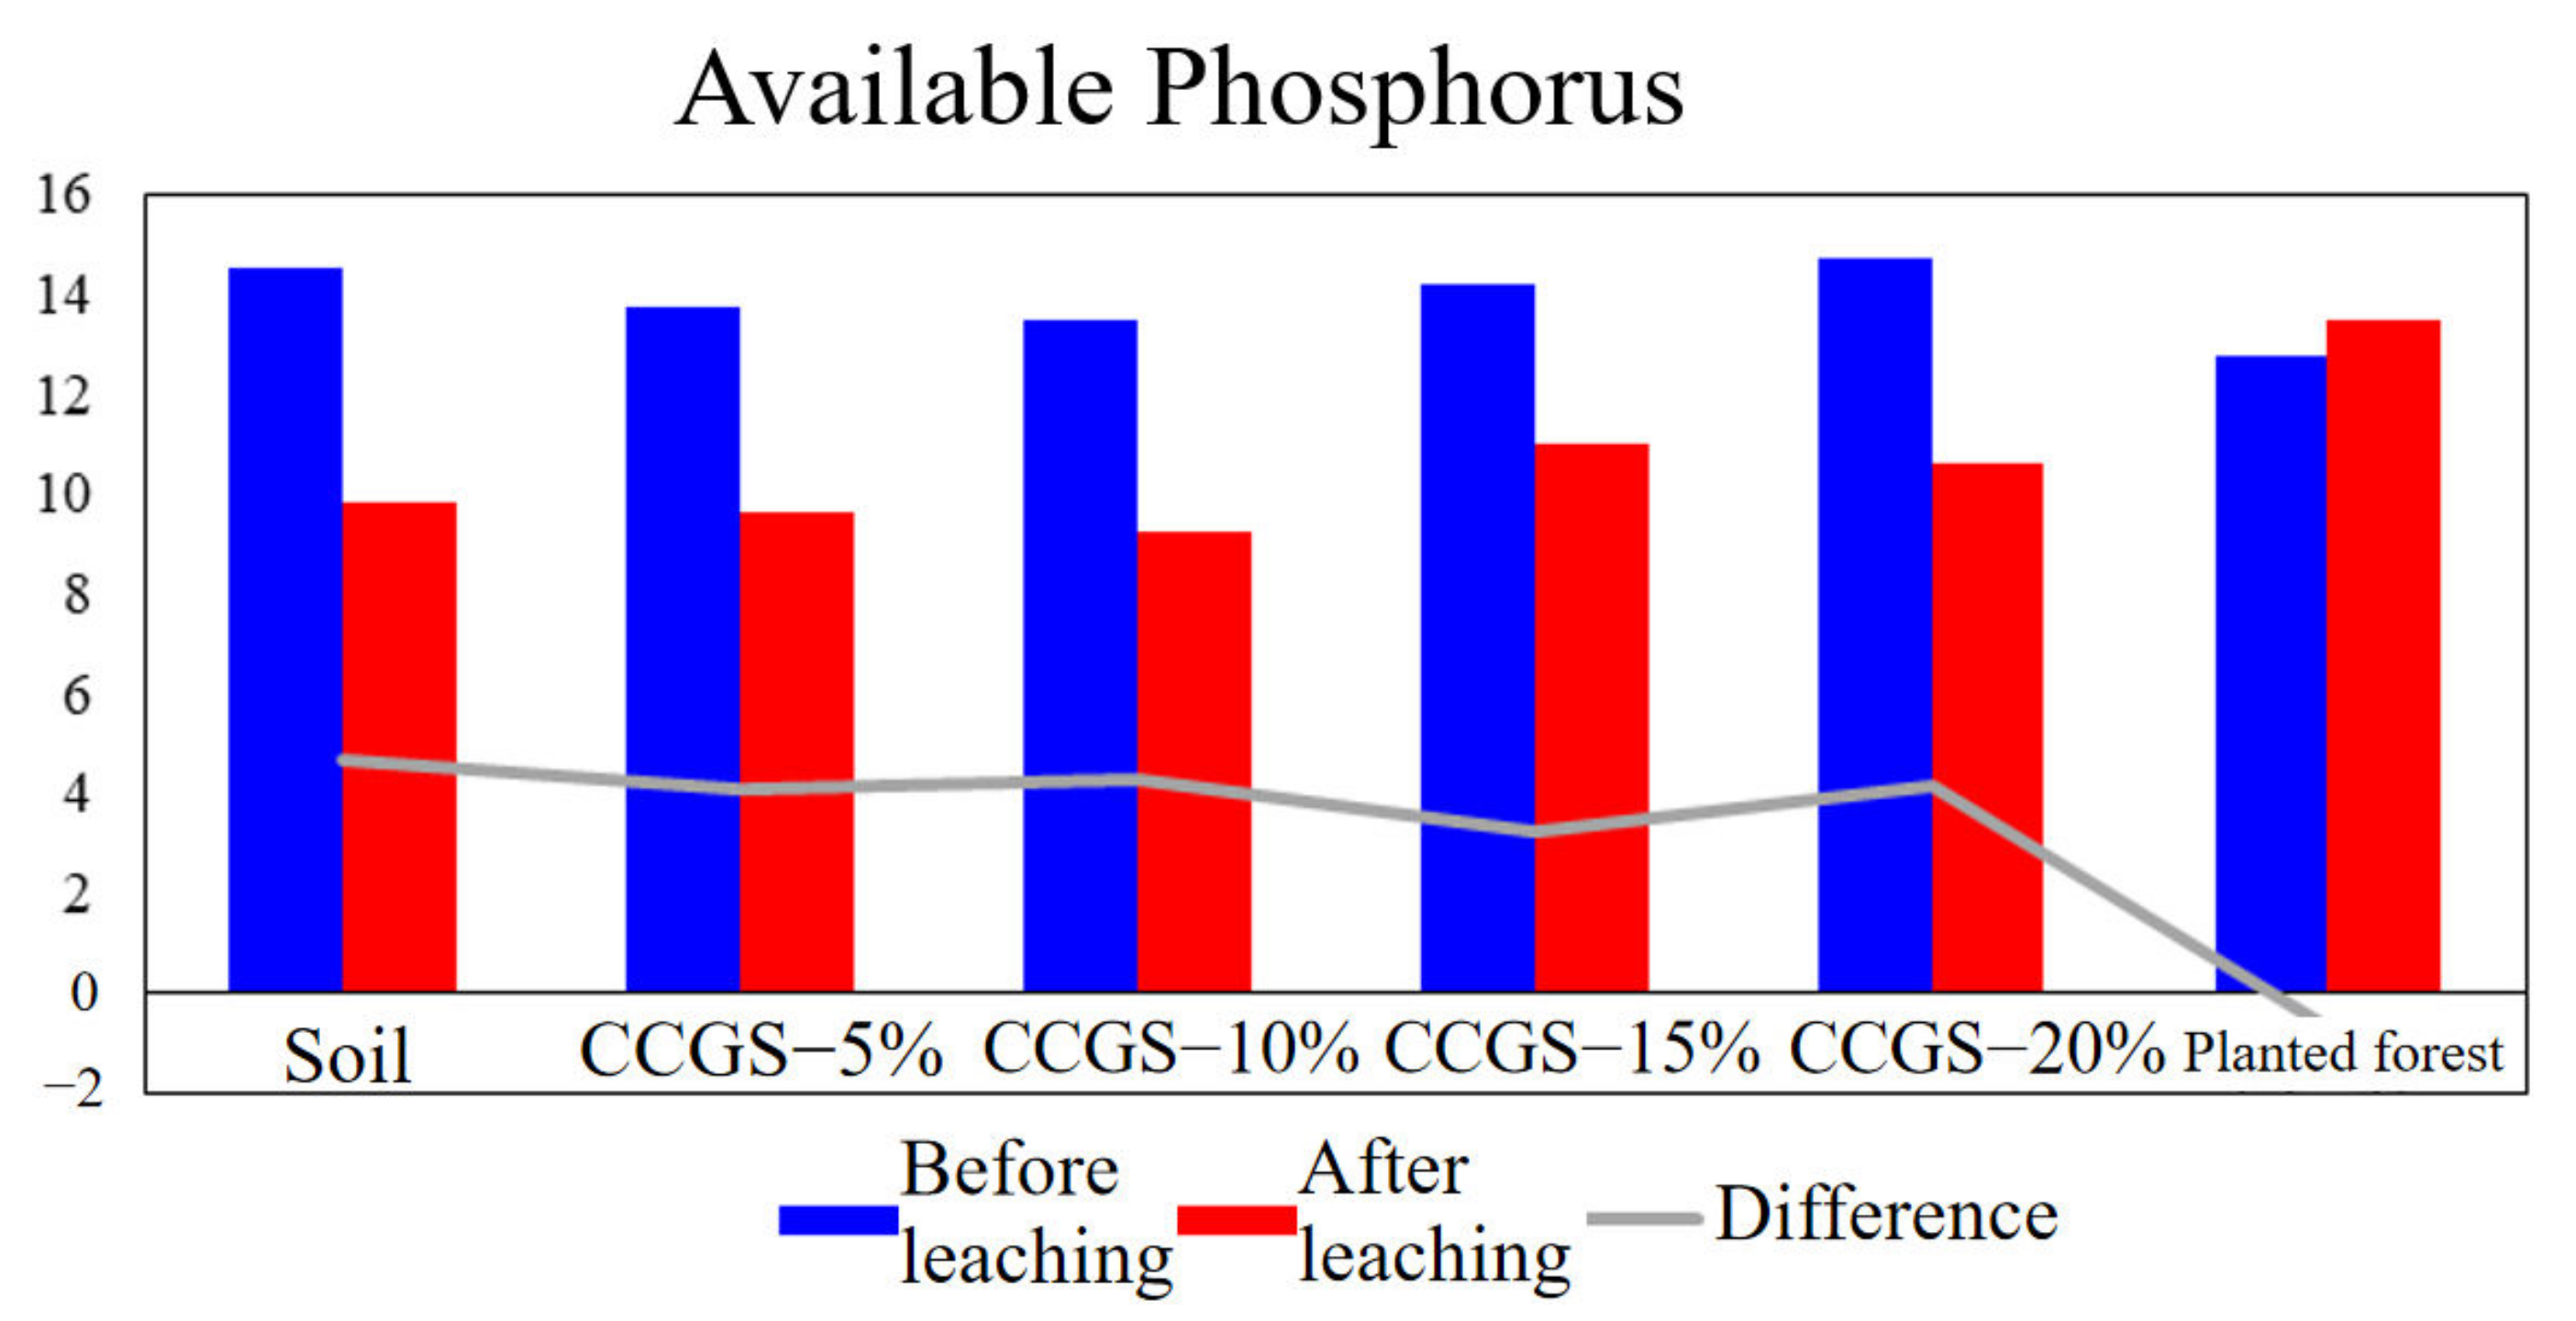
5. Feasibility Study of Gasification Slag Soil Improvement

The above research results show that the contents of the CCGS pollutants do not exceed the standard, and it was preliminarily determined that it was applicable to be used for soil improvement. The feasibility of gasification slag for soil improvement was further studied in this paper.
First, soil samples were collected at the Hongshaquan open-pit mine in June 2020, and soil samples were collected from the dump and reclaimed planted forest in the mining area as shown in Figure 8. An ‘S’-shaped sampling route was used, and a soil auger was adopted to take 0~20 cm at the surface soil (because the surface 0~20 cm soil nutrient distribution and change are most obvious and most representative). The samples were placed in plastic bags, labelled, and soil samples were sent back to the laboratory, placed in a cool and ventilated area to air dry. After air drying, the large soil blocks were broken, the plant roots, deadwood, leaves, animal and plant residues and stones in the soil were picked out. After sieving with a 2 mm sieve, they were sealed and stored in plastic bags for the testing of soil basic physical and chemical properties, and soil improvement-related experiments.
In order to explore the effect of CCGS on soil water and fertilizer retention, the infiltration test of different treatments of improved materials was carried out by intermittent soil column leaching method, the characteristics of soil water content and soil fertility after leaching were analyzed, the mechanism of water and fertilizer retention of improved materials was further studied, and the water and fertilizer retention capacity of the improved materials with different ratios and pure soil was comprehensively compared and analyzed. The design of the soil column experiment is as follows: the soil column experiment was set up with four CCGS gradients (5%, 10%, 15%, 20%), and the soil column without the improved material was used as the control. Three parallel tests were performed for each ratio, as shown in Figure 9.
(1) Soil particle size distribution with different content of CCGS
The soil particle sizes of the evenly dispersed soil samples were measured by laser particle size analyzer. According to the United States Department of Agriculture (USDA) soil texture classification system, the measured particle size distribution data were divided into three categories: sand (0.05~2 mm), silt (0.002~0.05 mm), and clay (<0.002 mm). As shown in Figure 10 and Table 1, the CCGS is mainly composed of sand, and the clay content is almost zero. The soil in the study area is mainly composed of sand, and the sand volume accounts for 75.60%. The percentage volume of silt and clay is relatively low. After adding CCGS, the soil is mainly sand. It can be seen that CCGS has a relatively poor effect on soil particle size and texture improvement.
(2) Effect of CCGS on soil water retention performance with different CCGS content
As shown in Figure 11, after adding CCGS, the soil water retention performance is better than that of the original soil from the dump of open pit mine and increases with the increase of CCGS content. In terms of the soil-water retention effect, 20% CCGS was better, but compared with planted forest, the results showed that regardless of whether CCGS is added or not, the soil moisture content is higher than that of CCGS, which may be related to the high content of fine sandy particles and coarse silty particles in the soil, less clayey particles and organic matter. The uniform and coarse single particles were rapidly settled in the water and arranged neatly and closely, appearing to have the nature of hardened pulp.
(3) Effect of CCGS on soil pH under different CCGS content before and after leaching
It can be seen from Figure 12 that pH value of soil decreased after adding CCGS before leaching, and the pH value of soil with 20% CCGS was the lowest, and there was no significant difference in pH value between different CCGS content. After leaching, the soil pH value increased. Compared with the CCGS, the soil pH was higher than that of the CCGS regardless of whether the CGS was added or not. The soil pH values of 15% and 20% CCGS were lower, and the difference was close to the CCGS. In terms of soil pH, 20% CCGS had the best effect.
(4) Effects of CCGS on soil electrical conductivity (EC) under different CCGS content before and after leaching
Soil electrical conductivity is an indicator of soil water-soluble salt, and soil water-soluble salt is an important attribute of soil, which is the factor to determine whether salt ions in soil influence crop growth. The analysis of water-soluble salts in soil is of great significance to understand the salt dynamics, the impact on crop growth and the formulation of improvement measures. As shown in Figure 13, the soil EC was high before leaching, and the electrical conductivity decreased with the increase of CCGS content. The soil electrical conductivity was low after leaching, and the electrical conductivity decreased with the increase of CCGS content. Compared with the planted forest sample, the conductivity value was low, and a 20% CCGS effect was best for the soil EC.
(5) Effect of CCGS on soil fertility with different CCGS content after leaching
1) Effects of CCGS on soil organic matter with different CCGS content after leaching
The carbon content in the CCGS is very high, and these residual carbons may be derived from the volatile substances of the original coal pyrolysis, partial gasification carbon and/or unreacted pyrolysis carbon. From Figure 14, it can be seen that a 20% CCGS content has the best improvement effect on soil organic matter (SOM), and the SOM content of CCGS is higher than that of the planted forest sample.
2) Effects of CCGS on soil nitrogen with different CCGS content after leaching
As shown in Figure 15, before and after leaching, with different CCGS content, the content of alkali-hydrolyzed nitrogen changed significantly, and the difference gradually decreased with the increase of CCGS content. The research showed that with the addition of CCGS, the soil alkali-hydrolyzed nitrogen could be maintained, and the higher the CCGS content, the stronger the maintenance effect. Taking the planted forest sample as the expected goal of improvement, it can be found that the addition of CCGS can improve the retention of soil alkali-hydrolyzable nitrogen after leaching, but the content of alkali-hydrolyzable nitrogen is not as high as that of the planted forest sample.
As shown in Figure 16, before and after leaching, the content of ammonium nitrogen changed significantly with different CCGS contents, and the difference gradually decreased with the increase of CCGS content. The results showed that the addition of CGS could maintain the soil ammonium nitrogen, and the higher the content of CCGS, the stronger the retention effect. Taking the planted forest sample as the expected target of improvement, it can be found that when the CCGS is 20%, the retention effect of ammonium nitrogen is better than that of the planted forest sample, but the content is far less than that of the planted forest sample.
3) Effects of CCGS on soil phosphorus with different CCGS content after leaching
As shown in Figure 17, before and after leaching, under different mixing ratio, the relative change of available phosphorus content is not obvious, and the difference decreases with the increase of CCGS content. Studies have shown that the addition of CCGS can keep the soil-available phosphorus, and the higher the CCGS content, the stronger the retention effect. Taking the planted forest sample as the expected goal of improvement, it can be found that when the amount of CCGS is 20%, the retention effect on available phosphorus is better than that of planted forest, and the content is close to that of the planted forest sample.
4) Effect of CCGS on soil potassium with different CCGS content after leaching
As shown in Figure 18, before and after leaching, the content of available potassium changed significantly with different CCGS content, and the difference increased with the increase of CGS content. The results showed that the addition of CGS had a weak effect on soil available potassium, and the higher the content of CGS, the weaker the effect. Taking planted forest as the expected goal of improvement, it can be found that when the amount of CGS is 10–15%, the retention effect of available potassium is better than that of the planted forest sample, and the content is close to that of the planted forest sample.
(6) Salt control performance
1) Cations
It can be seen from Figure 19 that the addition of CGS increased the content of magnesium ions, potassium ions and sodium ions in the soil. The calcium ions, magnesium ions, potassium ions and sodium ions in the soil before evaporation and after adding CGS were higher than those after evaporation. The content of calcium ion, magnesium ion and potassium ion increased after evaporation in the treated group of planted forest samples, while sodium ion decreased. The addition of CGS was able to reduce the content of calcium ion and potassium ion in soil after evaporation but had no effect on other cations.
2) Anions
From Figure 20, it can be seen that the addition of CCGS has a weak effect on the anion content in the soil, but the carbonate ions appear in the soil after evaporation and the soil mixed with CGS, and the evaporation brings the carbonate ions. However, the content of the ions decreases with the increase of the content of CCGS. The chloride ions and bicarbonate ions in the soil before evaporation and the soil mixed with CGS are lower than those after evaporation. The content of sulfate ion decreased with the addition of CCGS. There was no carbonate ion before and after evaporation in the treatment group of planted forest. The addition of CGS had a poor effect on the weakening of soil anion content compared with planted forest samples.
In summary, the addition of CCGS increases the ion content, but mainly acts on soil cations, and has a relatively weak effect on soil anions. The sum of the eight ions in the soil before and after evaporation is reduced, as shown in Figure 21 and Figure 22.

6. Conclusions

There are very few studies on the application of CCGS in soil improvement. In this paper, the characteristics of CCGS and its feasibility in soil improvement were studied, which fills the gap in related research. The following conclusions were obtained:
(1) CCGS produced by Shenhua Xinjiang Chemical Co., Ltd. presents honeycomb holes with high roughness. The particle sizes of CCGS are mainly between 20–500 μm;
(2) The raw coal is bituminous coal, the coal quality of Heishan coal is beneficial to gasification, and the characteristic pollutants in the CCGS are closely related to the raw coal;
(3) There are no radioactive pollutants in the CCGS, and the content of various pollutants does not exceed the standard, which can be used for environmentally friendly applications;
(4) The CCGS is applicable for soil improvement. The effect of CCGS on soil particle size and texture improvement is limited. The CCGS has a certain effect on soil water retention performance, and increases with the increase of CCGS content, while the pH and conductivity values decrease; the improvement effect of SOM and available potassium was remarkable; the higher the CCGS content, the stronger the effect on maintaining soil available nitrogen, ammonium nitrogen and available phosphorus, but the effect is smaller. CCGS can increase the ion content, especially the soil cation. The soil anion effect is relatively weak: before and after evaporation, the soil’s total eight ions decreased.

Author Contributions

Conceptualization, R.Z., X.L. and K.Z.; methodology, all authors; validation, X.L. and P.W.; formal analysis, X.L. and P.W.; investigation, X.L. and K.Z.; resources, R.Z. and X.L.; data curation, P.X. and H.Z.; writing—original draft preparation, R.Z., X.L., K.Z. and P.W.; writing—review and editing, P.W.; visualization, X.L.; supervision, R.Z. project administration, K.Z.; funding acquisition, K.Z. All authors have read and agreed to the published version of the manuscript.

Funding

This research was funded by [National Natural Science Foundation of China] grant number [42177037].

Data Availability Statement

Data is available from the authors upon reasonable request.

Conflicts of Interest

The authors declare no conflict of interest.

References

  1. Ministry of Natural Resources. China Mineral Resources Report; Geological Publishing House: Beijing, China, 2021. [Google Scholar]
  2. Shuai, H. Intrinsic Characteristics of CGS and Phase Evolution during CRN Process; Xi’an University of Architecture and Technology: Xi’an, China, 2015. [Google Scholar]
  3. Zhu, J.F.; Li, J.; Yan, L.; Shang, Y.; Wang, Y.; Li, Q.; Wang, J. Research progress and application prospect of coal gasification slag resource utilization. Clean Coal Technol. 2021, 27, 11–21. [Google Scholar]
  4. Yuan, H. Fundamental Research on Intrinsic Characteristics and Application of Coal Gasification Slag; Xi’an University of Architecture and Technology: Xi’an, China, 2020. [Google Scholar]
  5. Yang, S.; Shi, L.J. Component analysis and comprehensive utilization of coal gasification fine slag. Coal Chem. Ind. 2013, 4, 34–36, 43. [Google Scholar]
  6. Zhao, Y.B.; Wu, H.J.; Zhang, X.B.; Liu, H.G.; Jing, Y.H.; Yuan, Y. Preparation of Porous Ceramics from Coal Gasification Residue. Clean Coal Technol. 2016, 22, 7–11. [Google Scholar] [CrossRef]
  7. Yin, H.F.; Tang, Y.; Ren, Y. Basic characteristics and application of Texaco gasifier slag. Coal Convers. 2009, 32, 30–33. [Google Scholar]
  8. Li, G.Y.; Zhang, T.; Huo, L. Basic Performance and Application of LurgiCGS “C”. In Proceedings of the First Symposium on Solid Waste Treatment and Eco-Environmental Materials for the Establishment of Solid Waste Branch of China Silicate Society, Beijing, China, August 2015; China Silicate Society: Beijing, China, 2015. [Google Scholar]
  9. Acosta, A.; Aineto, M.; Iglesias, I.; Romero, M.; Rincón, J. Physico-chemical characterization of slag waste coming from GICC thermal power plant. Mater. Lett. 2001, 50, 246–250. [Google Scholar] [CrossRef] [Green Version]
  10. Wu, T.; Gong, M.; Lester, E.; Wang, F.; Zhou, Z.; Yu, Z. Characterisation of residual carbon from entrained-bed coal water slurry gasifiers. Fuel 2007, 86, 972–982. [Google Scholar] [CrossRef]
  11. Xu, S.Q.; Zhou, Z.J.; Gao, X.X.; Yu, G.; Gong, X. The gasification reactivity of unburned carbon present in gasification slag from entrained-flow gasifier. Fuel Process. Technol. 2009, 90, 1062–1070. [Google Scholar] [CrossRef]
  12. Hu, W.H. Basic Research on Activation Separation and Resource Utilization of Aluminum-Silicon Components in Coal Gasification Slag; University of Chinese Academy of Sciences: Hangzhou, China, 2019. [Google Scholar]
  13. Shang, Z.F.; Ma, J.L.; Zhang, J.; Xu, D.Y.; Zhang, L.Y.; Zhou, J.Q.; Duan, X.Y.; Zhang, X.M. Research status and utilization technology prospect of CGS. Solid Waste Pollut. Control. Technol. 2017, 7, 712–717. [Google Scholar]
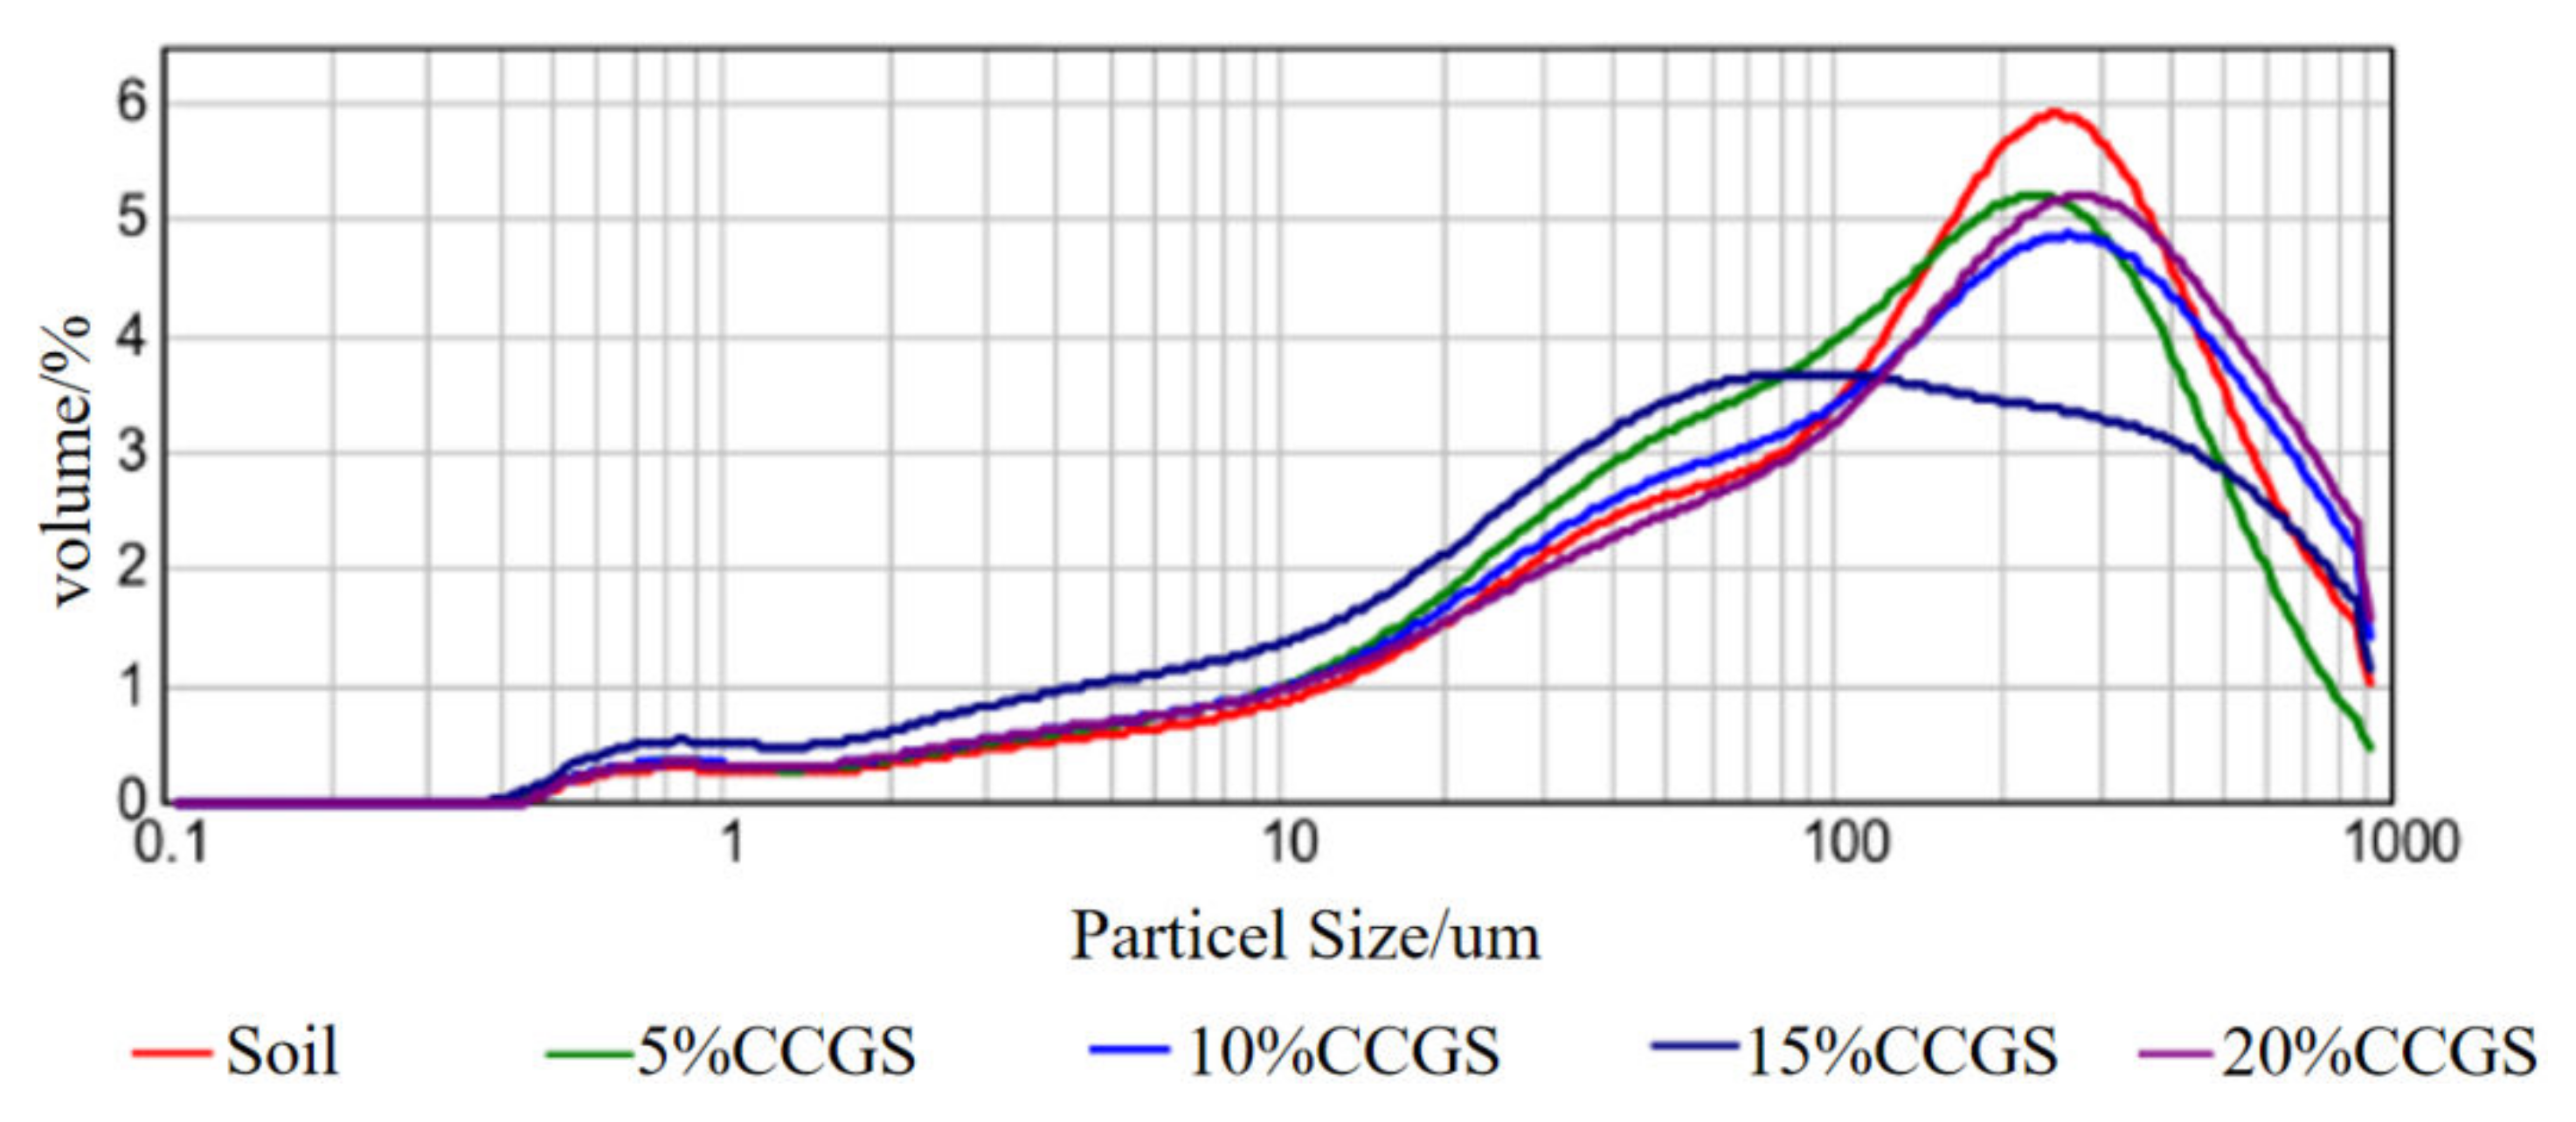
Figure 1. Photos of field sampling.
Processes 10 02690 g001
Figure 2. Scanning electron microscope image of CCGS.
Processes 10 02690 g002
Figure 3. Particle size distribution curve of CCGS.
Processes 10 02690 g003
Figure 4. Raw coal industrial analysis (note: ad means air dry; Cl is chlorine; N is nitrogen; H is hydrogen; C is carbon; FC is fixed carbon; V is volatile; A is ash; M is moisture; the figure does not contain the characteristics of the two coal char residues which are both 2, the arsenic (ω(Asad)) of Hongshaquan coal sample is 1 μg/g, and that of Heishan coal sample is 3 μg/g).
Processes 10 02690 g004
Figure 5. Chemical composition of raw coal ash.
Processes 10 02690 g005
Figure 6. Analysis results of pollutants in Hongshaquan and Heishan coal samples.
Processes 10 02690 g006
Figure 7. Test results of CCGS pollutants.
Processes 10 02690 g007
Figure 8. Sampling.
Figure 8. Sampling.
Processes 10 02690 g008
Figure 9. Soil column experiment.
Processes 10 02690 g009
Figure 10. Effect of CCGS on soil particle size distribution with different CCGS content.
Processes 10 02690 g010
Figure 11. Effect of CCGS on soil water retention performance.
Processes 10 02690 g011
Figure 12. Effects of CCGS on soil pH.
Processes 10 02690 g012
Figure 13. Effects of CCGS on soil EC.
Processes 10 02690 g013
Figure 14. Effect of CCGS on SOM.
Processes 10 02690 g014
Figure 15. Effect of CCGS on alkali-hydrolyzed nitrogen.
Processes 10 02690 g015
Figure 16. Effect of CCGS on ammonium nitrogen.
Processes 10 02690 g016
Figure 17. Effect of CCGS on Available Phosphorus.
Processes 10 02690 g017
Figure 18. Effect of CCGS on available potassium.
Processes 10 02690 g018
Figure 19. Changes of cation.
Processes 10 02690 g019
Figure 20. Changes of anions.
Processes 10 02690 g020
Figure 21. Changes of anion and cation.
Processes 10 02690 g021
Figure 22. Changes of eight ions.
Processes 10 02690 g022
Table 1. Soil particle size distribution under different content of CCGS.
TreatmentClayey Particles
(<0.002 mm, %)
Silty Particles
(0.05~0.002 mm,%)
Sandy Particles
(2~0.05 mm,%)
Soil100%2.222.275.6
CCGS100%05.3294.68
5%1.3122.3176.39
10%1.220.2778.53
15%1.118.5480.35
20%0.8617.0282.12
Publisher’s Note: MDPI stays neutral with regard to jurisdictional claims in published maps and institutional affiliations.

