
Queuing Models for Analyzing the Steady-State Distribution of Stochastic Inventory Systems with Random Lead Time and Impatient Customers


Abstract
:1. Introduction
2. Related Work
2.1. Inventory Models with Impatient Customers
2.2. Queuing Models with Impatient Customers
2.3. Queuing and Inventory Models with Different Approaches
3. Mathematical Background
3.1. Stochastic Processes and Queuing Models
3.1.1. Markov Chain
3.1.2. Long-Run Distribution (Stationary Distribution)
3.2. Single-Server Markovian Queuing Model with Impatient Customers
- The input process, the probability distribution of the type of arrivals of customers in time;
- The service distribution, the probability distribution of the random time to serve a customer (or group of customers in the case of a batch service);
- The queue discipline, the number of servers, and the customer service order.
3.2.1. Balance Equations
3.2.2. Solution of the Balance Equations
- ;
- :
3.2.3. Performance Measures
3.3. Finite Queuing–Inventory Models with Impatient Customers under a Deterministic Order Size
3.3.1. Steady-State Distribution for Queuing Inventory Models with Impatient Customers
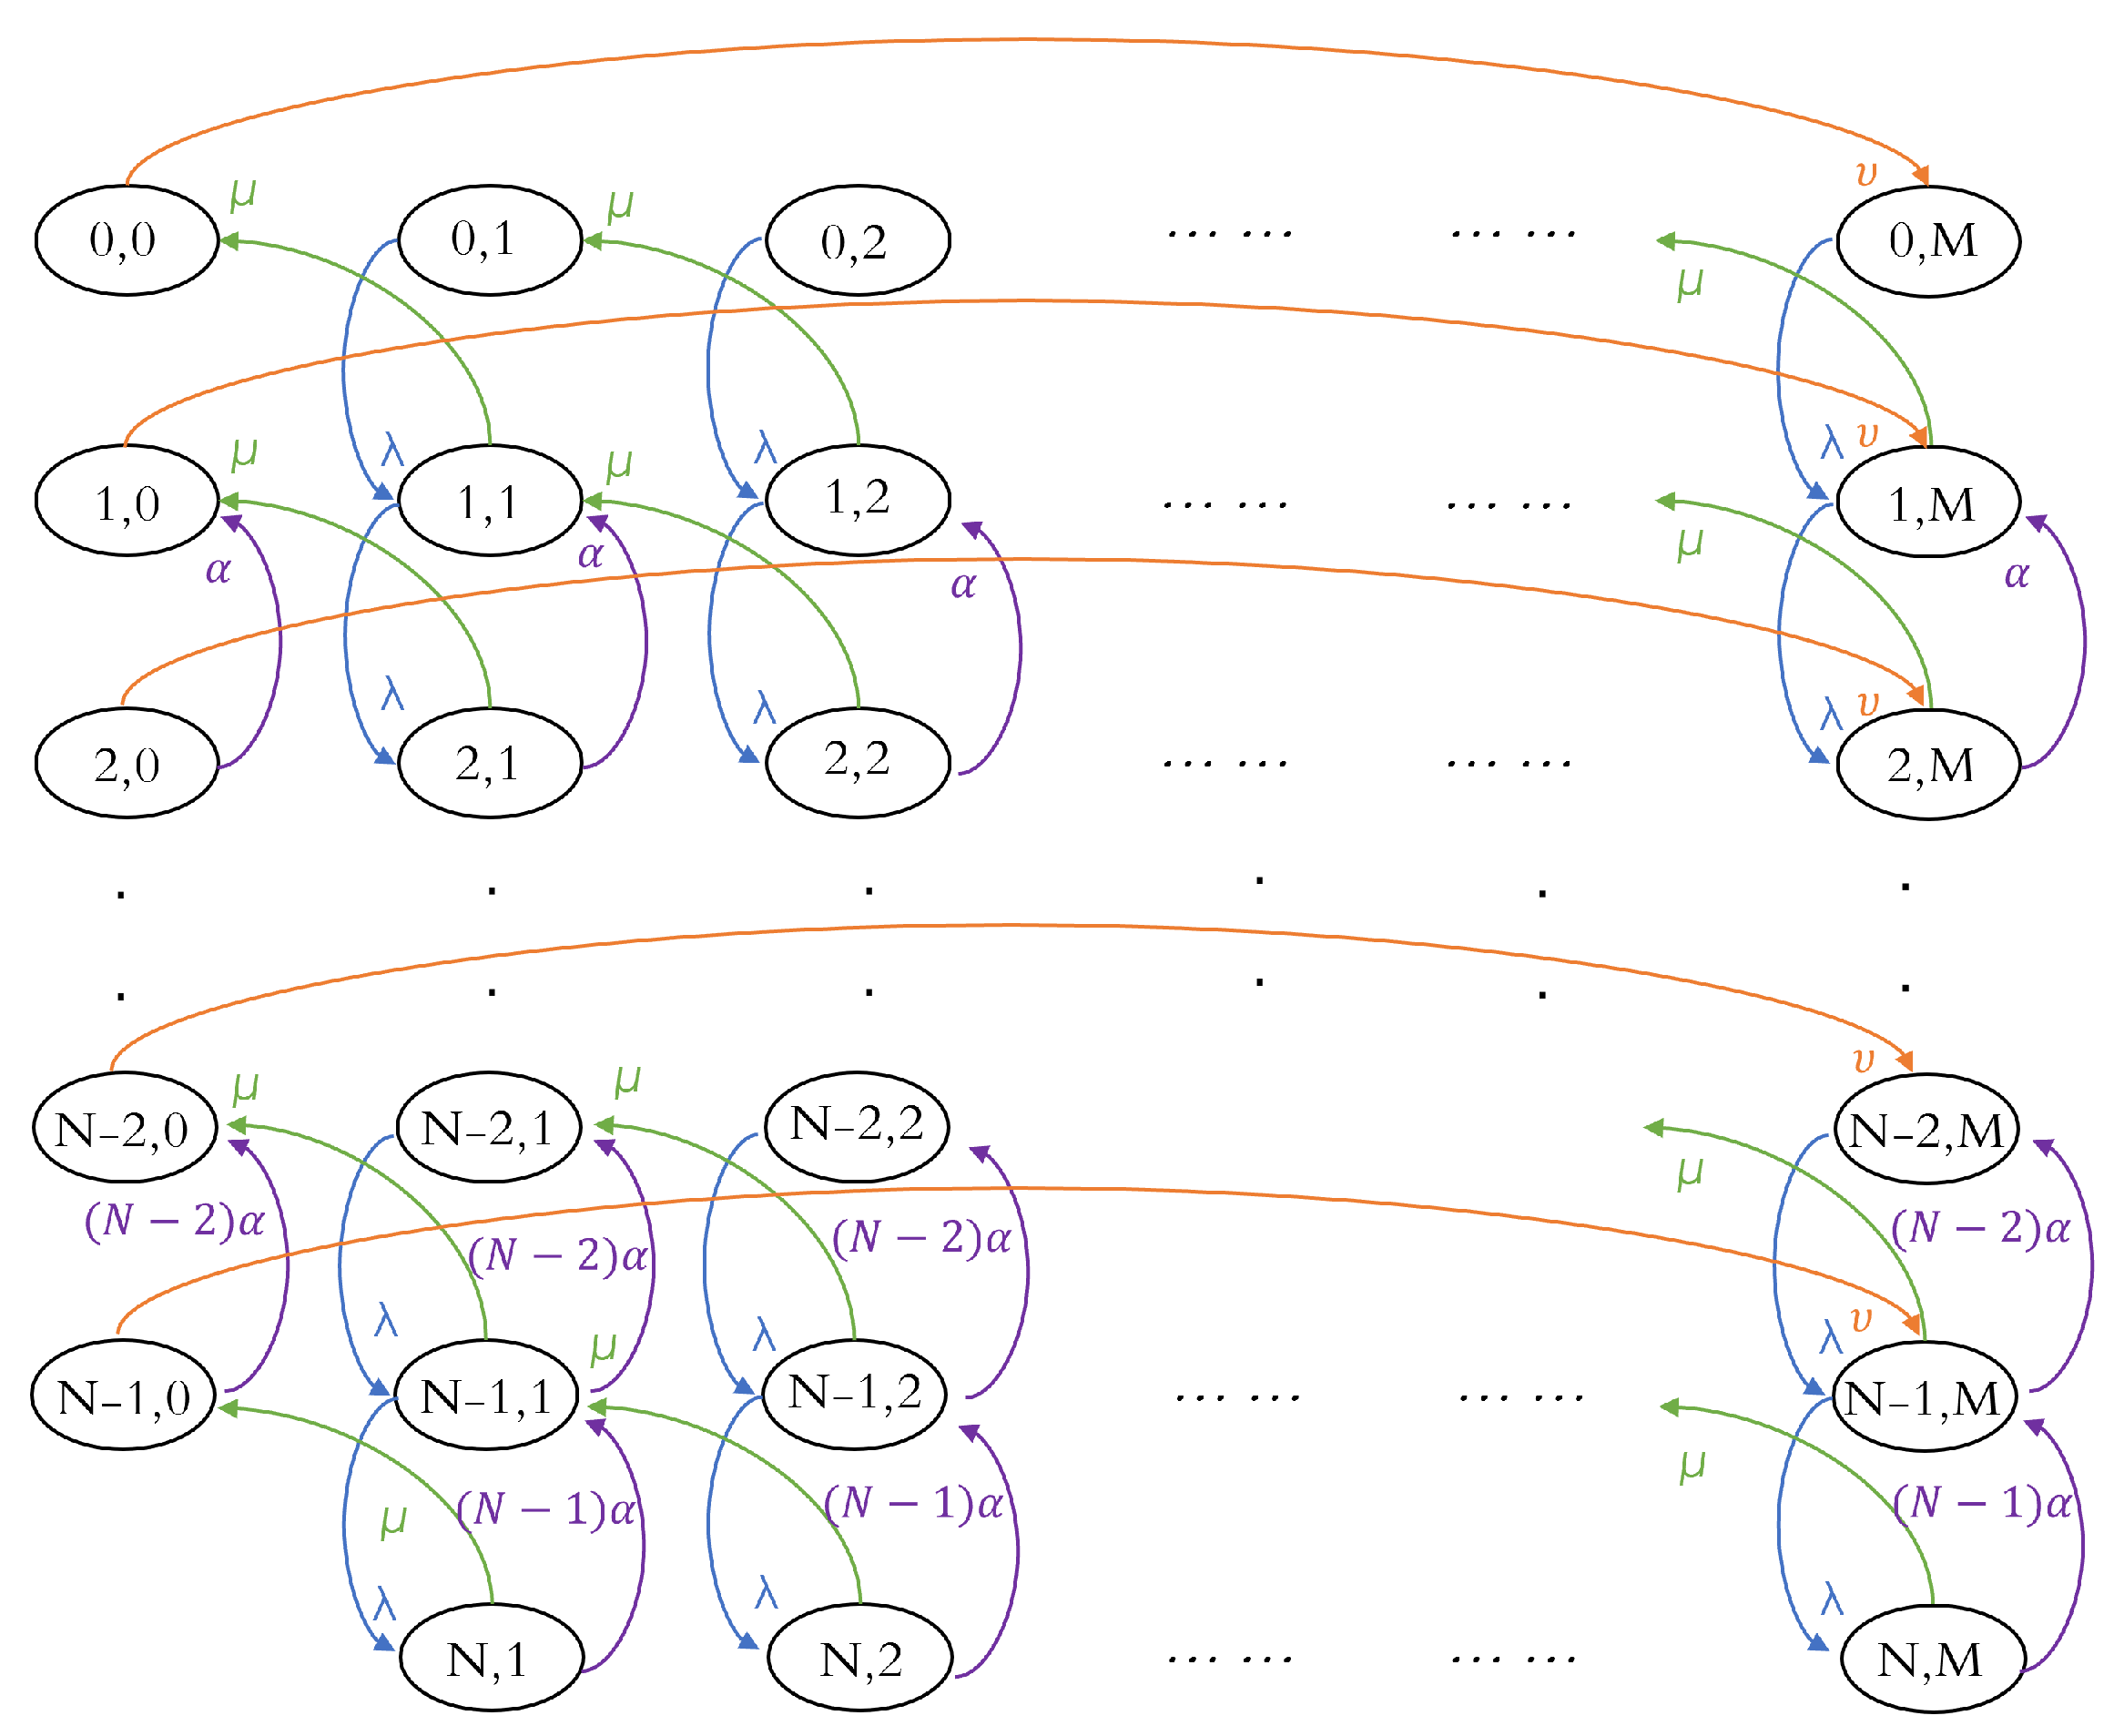
Rate Diagram
3.3.2. Performance Measure
- Average inventory level:
- Average number of new orders:
- Number of cycles:
- Lost sales for new customers:
- Lost sales for impatient customers:
- Lost sales per cycle for new customers:
- Lost sales per cycle for the impatient customer:
- Quality of service for new customers:
- Quality of service for impatient customers:
- Effective arrival rate:
- The average number of customers in the queuing system:
- The average number of customers waiting in line (or in the queue):
- The average waiting time for a customer:
- Sojourn time:
- The waiting time in Q before the departure:
Balance Equations
Algorithm for Solving Balance Equations
3.3.3. Finite Queuing–Inventory Models with Impatient Customers under a Random Order Size
Balance Equations
4. Results and Discussion
| Algorithm 1 Pseudocode for solving balance equations in terms of a steady-state distribution. |
|
4.1. Experiments with Impatient Customers under a Deterministic Order Size
4.2. Experiments with Impatient Customers under a Constant Order Size
5. Conclusions
Author Contributions
Funding
Institutional Review Board Statement
Informed Consent Statement
Data Availability Statement
Acknowledgments
Conflicts of Interest
References
- Whitehead, T.A.; Found, P. Exploratory Research into Supply Chain Voids within Welsh Priority Business Sectors; Centre for Concurrent Enterprise, University of Nottingham Business School: Nottingham, UK, 2007. [Google Scholar]
- Marand, A.J.; Li, H.; Thorstenson, A. Joint inventory control and pricing in a service-inventory system. Int. J. Prod. Econ. 2019, 209, 78–91. [Google Scholar] [CrossRef]
- Olhager, J. The role of the customer order decoupling point in production and supply chain management. Comput. Ind. 2010, 61, 863–868. [Google Scholar] [CrossRef]
- Gills, B.; Thomas, J.Y.; McMurtrey, M.E.; Chen, A.N. The Challenging Landscape of Inventory Management. Am. J. Manag. 2020, 20, 39–45. [Google Scholar]
- Biuki, M.; Kazemi, A.; Alinezhad, A. An integrated location-routing-inventory model for sustainable design of a perishable products supply chain network. J. Clean. Prod. 2020, 260, 120842. [Google Scholar] [CrossRef]
- Kotb, K.; El-Ashkar, H.A. Quality control for feedback M/M/1/N queue with balking and retention of reneged customers. Filomat 2020, 34, 167–174. [Google Scholar] [CrossRef]
- Jain, M.; Kumar, P.; Sanga, S.S. Fuzzy Markovian modeling of machining system with imperfect coverage, spare provisioning and reboot. J. Ambient Intell. Humaniz. Comput. 2021, 12, 7935–7947. [Google Scholar] [CrossRef]
- Hammoudan, Z. Production and Delivery Integrated Scheduling Problems in Multi-Transporter Multi-Custumer Supply Chain with Costs Considerations. Ph.D. Thesis, Belfort-Montbéliard, Belfort, France, 2015. [Google Scholar]
- Helmes, K.L.; Stockbridge, R.H.; Zhu, C. Continuous inventory models of diffusion type: Long-term average cost criterion. Ann. Appl. Probab. 2017, 27, 1831–1885. [Google Scholar] [CrossRef] [Green Version]
- Zhao, N.; Lian, Z. A queueing-inventory system with two classes of customers. Int. J. Prod. Econ. 2011, 129, 225–231. [Google Scholar] [CrossRef]
- Melikov, A.; Ponomarenko, L.; Bagirova, S. Analysis of queueing-inventory systems with impatient consume customers. J. Autom. Inf. Sci. 2016, 48, 53–68. [Google Scholar] [CrossRef]
- Deep, K.; Jain, M.; Salhi, S. Performance Prediction and Analytics of Fuzzy, Reliability and Queuing Models: Theory and Applications; Springer: Berlin/Heidelberg, Germany, 2018. [Google Scholar]
- Porteus, E.L. Foundations of Stochastic Inventory Theory; Stanford University Press: Redwood City, CA, USA, 2002. [Google Scholar]
- Krishnamoorthy, A.; Shajin, D.; Lakshmy, B. On a queueing-inventory with reservation, cancellation, common life time and retrial. Ann. Oper. Res. 2016, 247, 365–389. [Google Scholar] [CrossRef]
- Melikov, A.; Ponomarenko, L. Multidimensional Queueing Models in Telecommunication Networks; Springer: Berlin/Heidelberg, Germany, 2014. [Google Scholar]
- Bhat, U.N. An introduction to Queueing Theory: Modeling and Analysis in Applications; Springer: Berlin/Heidelberg, Germany, 2008; Volume 36. [Google Scholar]
- Benjaafar, S.; Gayon, J.P.; Tepe, S. Optimal control of a production–Inventory system with customer impatience. Oper. Res. Lett. 2010, 38, 267–272. [Google Scholar] [CrossRef]
- Wang, K.; Li, N.; Jiang, Z. Queueing system with impatient customers: A review. In Proceedings of the 2010 IEEE International Conference on Service Operations and Logistics, and Informatics, Qingdao, China, 15–17 July 2010; pp. 82–87. [Google Scholar]
- Al-Begain, K.; Heindl, A.; Telek, M. Analytical and Stochastic Modeling Techniques and Applications. In Proceedings of the 15th International Conference, ASMTA 2008, Nicosia, Cyprus, 4–6 June 2008; Springer: Berlin/Heidelberg, Germany, 2008; Volume 5055. [Google Scholar]
- Artalejo, J.R.; Gómez-Corral, A. Retrial Queueing Systems: A Computational Approach; Springer: Berlin/Heidelberg, Germany, 2008. [Google Scholar]
- Yue, W.; Takahashi, Y.; Takagi, H. Advances in Queueing Theory and Network Applications; Springer: Berlin/Heidelberg, Germany, 2009. [Google Scholar]
- Baccelli, F.; Bremaud, P. Elements of Queueing Theory: Palm Martingale Calculus and Stochastic Recurrences; Springer Science & Business Media: Berlin/Heidelberg, Germany, 2013; Volume 26. [Google Scholar]
- Altman, E.; Yechiali, U. Analysis of Customers’ Impatience in Queues with Server Vacations. Queueing Syst. 2006, 52, 261–279. [Google Scholar] [CrossRef] [Green Version]
- Heyman, D.P.; Sobel, M.J. Stochastic Models in Operations Research: Stochastic Optimization; Courier Corporation: North Chelmsford, MA, USA, 2004; Volume 2. [Google Scholar]
- Choi, T.M. Handbook of EOQ Inventory Problems: Stochastic and Deterministic Models and Applications; Springer: Berlin/Heidelberg, Germany, 2013; Volume 197. [Google Scholar]
- Allen, A. Statistics and Queuing Theory with Computer Science Applications; Academic Press: Cambridge, MA, USA, 1990; Volume 2. [Google Scholar]
- Tulsian, P. Quantitative techniques: Theory and Problems; Pearson Education: Delhi, India, 2006. [Google Scholar]


| 2.672 cust | |
| 5.118 unit | |
| 3.174 new order | |
| 3.676 lost cust | |
| 1.158 lost cust per cycle | |
| 0.926 ≈ 93% | |
| 46.324 cust entering | |
| 0.058 ≈ 2 days | |
| 0.125 ≈ 4 days | |
| 14.581 impatient cust | |
| 4.593 impatient cust per cycle | |
| 0.708 ≈ 71% | |
| 1.823 | |
| 0.039 ≈ 1 day |
| N = 10, M = 10, = 50, = 40, = 5 | ||||||||||
|---|---|---|---|---|---|---|---|---|---|---|
| 25 | 30 | 35 | 40 | 45 | 50 | 55 | 60 | 65 | 70 | |
| 5.30 | 4.62 | 3.98 | 3.41 | 2.93 | 2.52 | 2.18 | 1.90 | 1.68 | 1.49 | |
| 5.18 | 5.13 | 5.09 | 5.05 | 5.02 | 5.00 | 4.98 | 4.97 | 4.96 | 4.95 | |
| 2.30 | 2.68 | 3.00 | 3.27 | 3.49 | 3.66 | 3.80 | 3.91 | 4.00 | 4.07 | |
| 5.38 | 4.94 | 4.75 | 4.70 | 4.73 | 4.81 | 4.89 | 4.97 | 5.05 | 5.12 | |
| 2.34 | 1.85 | 1.58 | 1.44 | 1.36 | 1.31 | 1.29 | 1.27 | 1.26 | 1.26 | |
| 0.89 | 0.90 | 0.91 | 0.91 | 0.91 | 0.90 | 0.90 | 0.90 | 0.90 | 0.90 | |
| 44.62 | 45.06 | 45.25 | 45.30 | 45.27 | 45.20 | 45.11 | 45.03 | 44.95 | 44.88 | |
| 0.12 | 0.10 | 0.09 | 0.08 | 0.06 | 0.06 | 0.05 | 0.04 | 0.04 | 0.03 | |
| 21.60 | 18.31 | 15.28 | 12.63 | 10.40 | 8.58 | 7.10 | 5.92 | 4.98 | 4.22 | |
| 9.39 | 6.85 | 5.10 | 3.87 | 2.98 | 2.34 | 1.87 | 1.52 | 1.25 | 1.04 | |
| 0.57 | 0.63 | 0.69 | 0.75 | 0.79 | 0.83 | 0.86 | 0.88 | 0.90 | 0.92 | |
| 4.32 | 3.66 | 3.06 | 2.53 | 2.08 | 1.72 | 1.42 | 1.18 | 1.00 | 0.84 | |
| 0.10 | 0.08 | 0.07 | 0.06 | 0.05 | 0.04 | 0.03 | 0.03 | 0.02 | 0.02 | |
| N = 10, = 50, = 60, = 40, = 5 | |||||||||
|---|---|---|---|---|---|---|---|---|---|
| M | 2 | 5 | 10 | 15 | 20 | 25 | 30 | 35 | 40 |
| 1.67 | 1.83 | 1.90 | 1.93 | 1.94 | 1.95 | 1.96 | 1.96 | 1.96 | |
| 0.98 | 2.47 | 4.97 | 7.47 | 9.97 | 12.48 | 14.98 | 17.48 | 19.98 | |
| 13.87 | 7.09 | 3.91 | 2.70 | 2.06 | 1.67 | 1.40 | 1.21 | 1.06 | |
| 17.37 | 8.93 | 4.97 | 3.47 | 2.67 | 2.18 | 1.85 | 1.61 | 1.43 | |
| 1.25 | 1.26 | 1.27 | 1.28 | 1.30 | 1.31 | 1.32 | 1.33 | 1.35 | |
| 0.65 | 0.82 | 0.90 | 0.93 | 0.95 | 0.96 | 0.96 | 0.97 | 0.97 | |
| 32.63 | 41.07 | 45.03 | 46.53 | 47.33 | 47.82 | 48.15 | 48.39 | 48.57 | |
| 0.05 | 0.04 | 0.04 | 0.04 | 0.04 | 0.04 | 0.04 | 0.04 | 0.04 | |
| 4.89 | 5.62 | 5.92 | 6.04 | 6.10 | 6.13 | 6.16 | 6.18 | 6.19 | |
| 0.35 | 0.79 | 1.52 | 2.24 | 2.96 | 3.68 | 4.40 | 5.12 | 5.84 | |
| 0.90 | 0.89 | 0.88 | 0.88 | 0.88 | 0.88 | 0.88 | 0.88 | 0.88 | |
| 0.98 | 1.12 | 1.18 | 1.21 | 1.22 | 1.23 | 1.23 | 1.24 | 1.24 | |
| 0.03 | 0.03 | 0.03 | 0.03 | 0.03 | 0.03 | 0.03 | 0.03 | 0.03 | |
| 2.583 cust | 2.751 cust | |
| 3.520 unit | 10.096 unit | |
| 5.437 new order | 2.924 new order | |
| 6.171 lost cust | 3.256 lost cust | |
| 1.135 lost cust per cycle | 1.091 lost cust per cycle | |
| 0.877 ≈ 88% | 0.946 ≈ 95% | |
| 43.829 cust entering | 56.744 cust entering | |
| 0.0589 ≈ 2 days | 0.052 ≈ 2 days | |
| 0.125 ≈ 4 days | 0.2 ≈ 6 days | |
| 13.928 impatient cust | 10.483 impatient cust | |
| 2.562 impatient cust per cycle | 3.512 impatient cust per cycle | |
| 0.721 ≈ 72% | 0.825 ≈ 83% | |
| 1.741 | 2.097 | |
| 0.0397 ≈ 1 day | 0.037 ≈ 1 day |
| N = 10, = 50, = 60, = 40, = 5 | |||||||||
|---|---|---|---|---|---|---|---|---|---|
| M | 2 | 5 | 10 | 15 | 20 | 25 | 30 | 35 | 40 |
| 1.60 | 1.75 | 1.84 | 1.88 | 1.91 | 1.92 | 1.93 | 1.94 | 1.94 | |
| 0.78 | 1.72 | 3.35 | 5.00 | 6.65 | 8.32 | 9.98 | 11.64 | 13.31 | |
| 16.51 | 10.52 | 6.56 | 4.77 | 3.74 | 3.08 | 2.62 | 2.28 | 2.01 | |
| 20.66 | 13.20 | 8.27 | 6.04 | 4.77 | 3.94 | 3.37 | 2.94 | 2.61 | |
| 1.25 | 1.26 | 1.26 | 1.27 | 1.27 | 1.28 | 1.29 | 1.29 | 1.30 | |
| 0.59 | 0.74 | 0.83 | 0.88 | 0.90 | 0.92 | 0.93 | 0.94 | 0.95 | |
| 29.34 | 36.80 | 41.73 | 43.96 | 45.23 | 46.06 | 46.63 | 47.06 | 47.39 | |
| 0.05 | 0.05 | 0.04 | 0.04 | 0.04 | 0.04 | 0.04 | 0.04 | 0.04 | |
| 4.58 | 5.26 | 5.66 | 5.84 | 5.94 | 6.00 | 6.04 | 6.08 | 6.10 | |
| 0.28 | 0.50 | 0.86 | 1.23 | 1.59 | 1.95 | 2.31 | 2.67 | 3.03 | |
| 0.91 | 0.89 | 0.89 | 0.88 | 0.88 | 0.88 | 0.88 | 0.88 | 0.88 | |
| 0.92 | 1.05 | 1.13 | 1.17 | 1.19 | 1.20 | 1.21 | 1.22 | 1.22 | |
| 0.03 | 0.03 | 0.03 | 0.03 | 0.03 | 0.03 | 0.03 | 0.03 | 0.03 | |
Publisher’s Note: MDPI stays neutral with regard to jurisdictional claims in published maps and institutional affiliations. |
© 2022 by the authors. Licensee MDPI, Basel, Switzerland. This article is an open access article distributed under the terms and conditions of the Creative Commons Attribution (CC BY) license (https://creativecommons.org/licenses/by/4.0/).
Share and Cite
Alnowibet, K.A.; Alrasheedi, A.F.; Alqahtani, F.S. Queuing Models for Analyzing the Steady-State Distribution of Stochastic Inventory Systems with Random Lead Time and Impatient Customers. Processes 2022, 10, 624. https://doi.org/10.3390/pr10040624
Alnowibet KA, Alrasheedi AF, Alqahtani FS. Queuing Models for Analyzing the Steady-State Distribution of Stochastic Inventory Systems with Random Lead Time and Impatient Customers. Processes. 2022; 10(4):624. https://doi.org/10.3390/pr10040624
Chicago/Turabian StyleAlnowibet, Khalid A., Adel F. Alrasheedi, and Firdous S. Alqahtani. 2022. "Queuing Models for Analyzing the Steady-State Distribution of Stochastic Inventory Systems with Random Lead Time and Impatient Customers" Processes 10, no. 4: 624. https://doi.org/10.3390/pr10040624
APA StyleAlnowibet, K. A., Alrasheedi, A. F., & Alqahtani, F. S. (2022). Queuing Models for Analyzing the Steady-State Distribution of Stochastic Inventory Systems with Random Lead Time and Impatient Customers. Processes, 10(4), 624. https://doi.org/10.3390/pr10040624