Article

Main Technical and Economic Guidelines to Implement Wind/Solar-Powered Reverse-Osmosis Desalination Systems

by
Vicente J. Subiela-Ortín
*,
Baltasar Peñate-Suárez
and
Juan A. de la Fuente-Bencomo
Water Department, Canary Islands Institute of Technology (ITC), Playa de Pozo Izquierdo, s/n, 35119 Santa Lucía, Gran Canaria, Spain
*
Author to whom correspondence should be addressed.
Processes 2022, 10(4), 653; https://doi.org/10.3390/pr10040653
Submission received: 10 February 2022 / Revised: 15 March 2022 / Accepted: 17 March 2022 / Published: 28 March 2022
(This article belongs to the Special Issue Desalination Processes by Renewable Energy (RE))

Abstract

:
The use of renewable energy for desalination started in the 1980s, in order to provide a sustainable water supply in windy/sunny areas with water shortages. Nevertheless, this initiative has been generally limited to the R&D field and prototypes, with few units operating under real conditions. The research tradition in this field carried out by the Canary Islands Institute of Technology, based on pilot facilities, resulted in wide expertise on practical issues, as well as a deep knowledge on the state of the art. This paper deals with the most relevant technical aspects to be considered in the optimal design and operation of wind/photovoltaic (PV)-powered reverse-osmosis (RO) systems, focusing on practical indications: appropriate pre-treatment, the use and selection of the RO energy recovery system (ERD), the selection of an energy storage system, key recommendations for the O&M actions in wind- and PV-powered RO systems (extracted from the experience of operating different units in remote locations (PV and RO) and coastal areas (wind and RO)), and an identification of the pros and cons of hybrid systems. A selection of economic data is given, indicating the main aspects of the minimization of the cost of water. Finally, the paper mentions the latest advances in the involved technologies.

1. Introduction

Water stress alleviation is a rising worldwide objective, particularly for certain regions of Middle Eastern and North African (MENA) countries, as is the case for Gaza [1,2,3] and for the outermost islands (such as the Canary Islands, Spain) [4,5,6]. Thus, desalination is becoming a more and more relevant industrial sector, with increasing competitiveness at both the economic and technical levels. As is generally known, one of the most important disadvantages is that desalination is a high-energy demand process, in terms of heat or electricity. The reduction of the environmental and economic implications of this energy dependence is a common and priority objective for all sectors.
Renewable Energy (RE) technologies are under a similar process of continuous improvement, offering high performance and economic products. Given the abundance of solar and wind resources in arid regions, the research, case studies and other initiatives which are applicable to desalination as a sustainable and autonomous water supply are more and more recurrent [7,8,9]. Despite this environmentally friendly contribution to the world’s water shortage, autonomous desalination by RE requires the solution of the technological challenge of matching the constant power demand of a desalination plant with the variable and unpredictable power generation from an RE system, at reasonable costs, and maintaining the water quality of the produced water. The RE desalination combinations have been responding to this inquiry since the beginning, generating a wide set of R&D activities [10].
The use of desalination plants driven by renewable energy sources (RES) is a technique that has been implemented for more than three decades. Specifically, solar photovoltaic-powered RO plants were first studied on a commercial scale in Saudi Arabia in 1981, when a 3.2 m3/d SWRO desalination plant coupled to an 8 kWp (kWatt peak) PV system was installed in Jeddah [11].
In the 1980s, not long after the commencement of the commercial markets for both RO desalination and PV power generation, the first projects combining them to use RE for desalination emerged, generally with public financial support. Several reports were published on the design and implementation of these plants, and on the experiences of their operation. The “Desalination Guide Using Renewable Energies” (1998), edited by the Centre for Renewable Energy Sources (CRES) in Greece on behalf of the European Commission, presented the first comprehensive review and comparison with other combinations of RE with desalination. An update of this information was published by García-Rodríguez [12], including a list of 20 PV-RO plants. This paper presented a valuable and extensive collection of references on all possible combinations of RE with desalination processes published up to 2003. At the same time, Tzen and Morris [13] reviewed the status of technologies for desalination and decentralized power supply with regard to the most promising couplings, such as PV-RO. Five years later, Tzen et al. [14] made a worldwide count of small-scale desalination systems (up to a capacity of 50 m3/day), and found 32 systems combining PV-RO, but most of these systems were installed for research and demonstration purposes, and operated under non-commercial conditions.
PV-RO systems have been implemented in different regions, e.g., remote areas of the Libyan Desert; isolated areas of Jordan, Tunisia and Morocco; and outlying areas in Australia. When considering commercial photovoltaics for connection to an RO system, PV-RO has previously been regarded as not being a cost-competitive solution when compared to conventionally powered desalination. However, the decline in PV costs over the past years has changed this outlook. The distance to the national electric grid at which PV energy is competitive with conventional energy depends on the RO plant capacity, and on the salt concentration of the feed [15,16,17,18].
Despite the many technological improvements of recent years, however, the conversion efficiencies of PV modules remain low, rarely exceeding 15–16% [19]. In addition to such low efficiencies, the retail price for PV modules in 2008 stood at €4.70 and USD 4.83 per Wp in the European and US markets, respectively [20], and currently the Wp can be between €0.6 to €2, making the solar sub-unit cost a key factor in the economic feasibility of PV-RO desalination.
Ghermandi and Messalem [8] investigated the current developments in the field of solar-powered RO desalination on the basis of the analysis of 79 experimental and design units worldwide. They concluded that PV-RO desalination is mature for commercial implementation. Although no standard design approach has been developed, the technical feasibility of different design concepts was demonstrated in a relatively large number of case studies. Battery-less systems that directly couple the PV modules to variable-speed DC pump motors seemed to have the highest potential for energy-efficient and cost-effective small-scale PV-RO desalination. Some concern was expressed regarding the long-term performance and reliability of such systems.
For PV-RO systems to transition to large-scale applications, a reliable operation strategy and control system is needed in order to allow efficient energy use despite variation in solar power. Thomson and Infield [21] presented a variable-operation PV-RO system that can adapt to a PV array power output without using batteries.
The wider applicability of PV-RO on both the large-scale and small-scale still remains limited by high-energy costs, which needs to be addressed by improving the energy efficiency of PV-RO systems. According to a review by Shalaby [22], the specific energy consumption for experimental PV-RO desalination systems varies between 1.1 and 16.3 kWh/m3, depending on system size, use of batteries, feed water source (seawater or brackish water), pre-treatment, and type of energy recovery device, if any. Table 1 shows a list of PV powered desalination systems [23,24].
In order to address energy efficiency, researchers have considered each of the two components separately, while very few studies have focused on improving the coupling of PV and RO.
Raval and Maiti [25,26] introduced a simple yet innovative concept to improve the efficiency of both PV and RO by capturing thermal energy from the PV panel and using it to heat flowing feed water, simultaneously lowering the temperature of the PV module and increasing the temperature of the RO feed.
Ghafoor et al. [27] carried out a study for the development and experimental investigation of a 500-L h−1 decentralized photovoltaic (PV-RO) system. Based on the running load of the RO system, a 2 kWp PV system was coupled with an RO plant through a 5 kVA hybrid inverter. The experiments were conducted in terms of no tracking and three-point manual PV tracking, and the cooling or non-cooling of the PV system. The results showed 18% higher daily PV energy using PV tracking and 10% higher PV energy from the cooling of the PV panels.
One of the weakest points of the PV-RO technology is the cost of the water produced; there is a wide range of costs, depending on the salinity of the feed water and the capacity of the RO plant, among other variables. The water cost for operating systems commissioned after the year 2000 with a nominal water production of over 1 m3/d are 3.0–10.6 €/m3 for seawater, and 2.5–9.8 €/m3 for brackish waters [28].
Although the grade of development of these technologies is remarkable, there are still several gaps and issues to investigate. The purpose of this paper is to present the lessons learnt by the Canary Islands Institute of Technology (ITC) based on the know-how acquired throughout R&D activities on solar PV- and/or wind RO-powered desalination carried out by the Water Department of the Research and Development Division. A review of the main technical aspects is performed, focusing on the real operation details and practical recommendations. For the basic description of the installation and operation of these systems, the reader can consult previous references.

2. Preliminary Sizing and Appropriate Range of the RO Nominal Capacity

2.1. Generalities

The range of capacities of an RO desalination system is basically limited by the size of commercial membrane elements (2.5–8”, with different lengths); thus, the minimum possible capacity production is a micro-RO unit with one element of the minimum size (a diameter of 2.5” and a length of 14”), and the daily production would be 600 L. As high-pressure vessels are assembled in structures or racks and installed in parallel, SWRO plants have a high modularity; thus, the current nominal capacities reach 100,000 m3/d, or even higher [29]. This broad set of water productions and associated power demands leads to the identification of the most appropriate RE generation system to be coupled.
The efficiency in SWRO is the most important factor to reduce operation costs. This mainly depends on the type of membranes used, the rack design, the efficiency of the high-pressure pumps (feed and booster) and the performance of the energy recovery system, which converts most of the energy from the brine output (at very few bars less than the input flow to the membranes) in the pressuring part of the feed flow. This system allows the high-pressure pump to operate with only part of the feed flow; the rest is pressured up by the pressure exchanger and a booster pump. Intensive research is underway on the development of ERD units specially designed for small-capacity systems, as described by the researchers of the ITC [30].

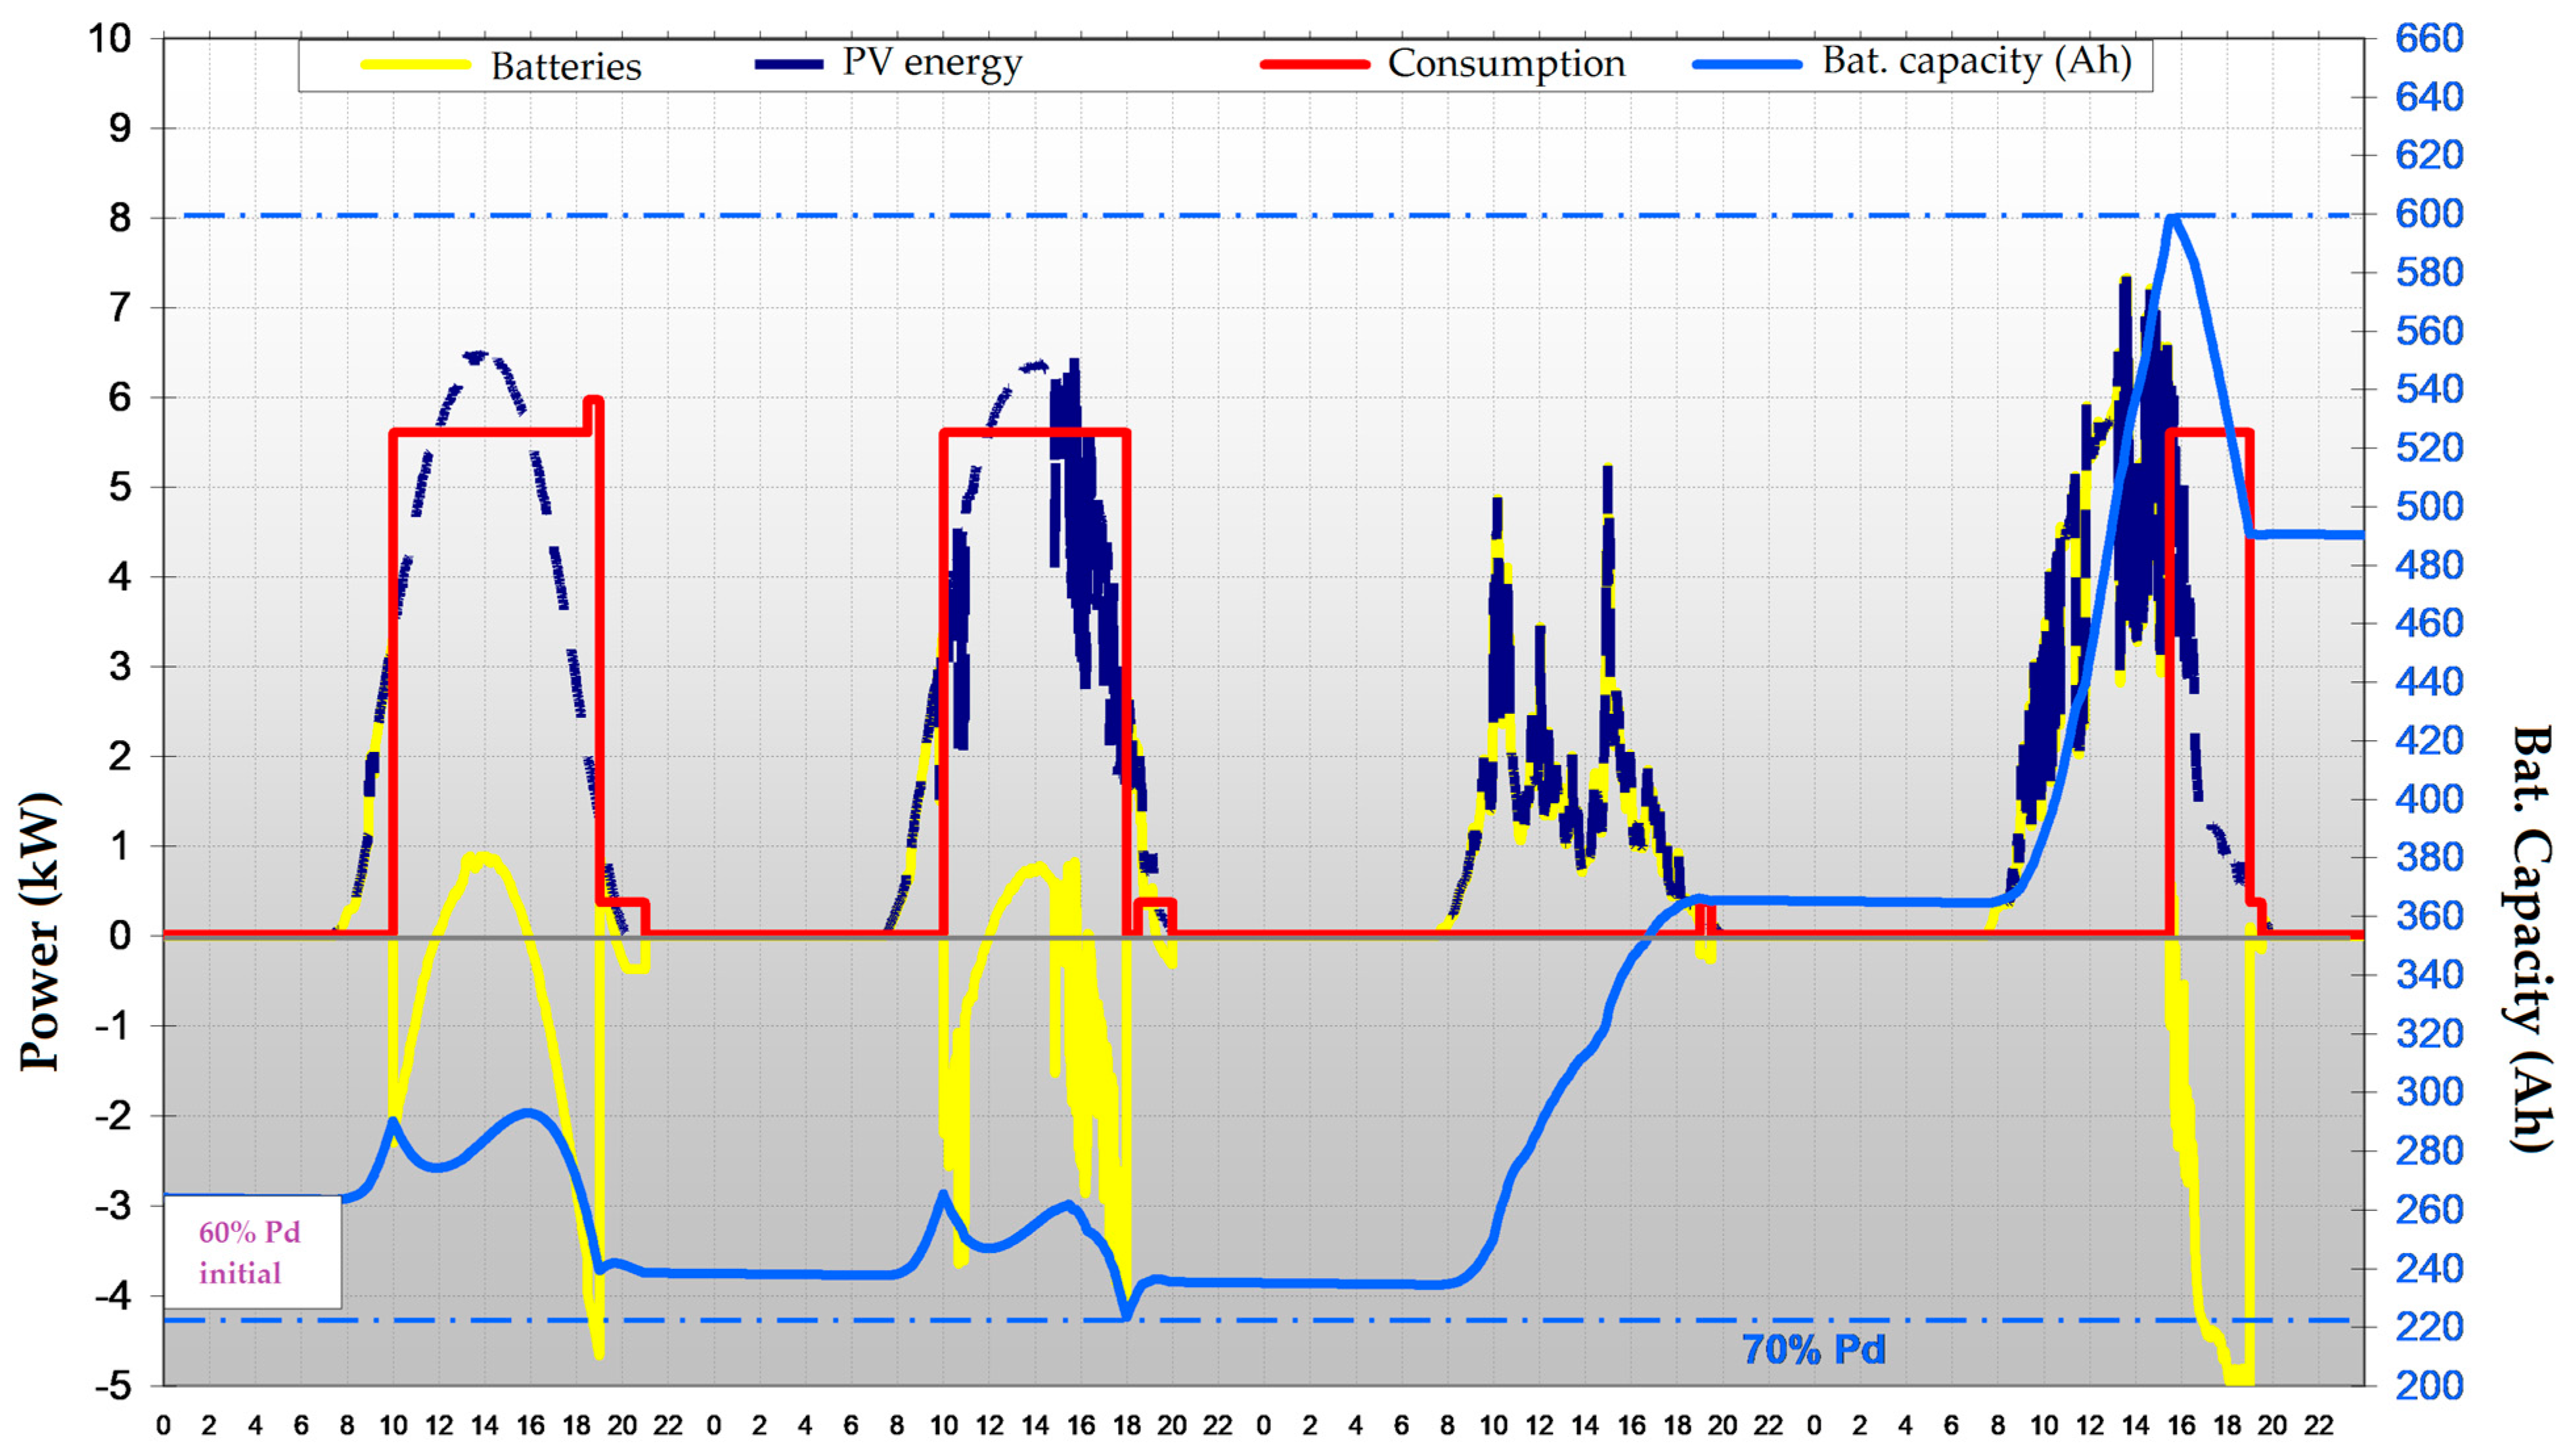
2.2. Off-Grid PV-Driven Reverse-Osmosis Desalination Systems

Concerning PV-RO, more than 40 systems have been tested in the world, most of them just for R&D activities, and have been reviewed by the ITC [9]. All of them are in the range of 4 to 2000 L/h; this production is associated with the number of daily operation hours per day (about 5–8 h, depending on the place and the day of the year); in other words, the daily production is 25–33% of an on-grid RO plant with the same hourly capacity operating 24 h/day.
The greater the water production, the greater the power supply requirements; hence, large RO units need large PV fields, large capacity batteries and power converters. Considering a reference case of 1 m3/h RO unit, the estimated power demand and size of the associated components is presented in Table 2.
The maximum capacity of a PV-RO system is mainly delimited by the commercial size of the electric converters (see Table 3) for stand-alone operation. According to this list of maximum capacities and the reference values from Table 2, an estimated value of the water production capacity can be calculated (see the second and third rows for SW and BW, respectively, in Table 3). These values are an orientation for a mono-phasic RO unit; they can be extended for a three-phase PV supply, which includes one inverter per phase. This means that the maximum output power to the RO plant can be increased up to threefold (three inverters), along with, consequently, its nominal capacity. Nevertheless, under a modular concept of several units in parallel, larger systems can be implemented.
In the case of hybrid PV-diesel systems, specific models of inverters are commercialized for large off-grid electricity supplies (up to 2500 kVA) [31].

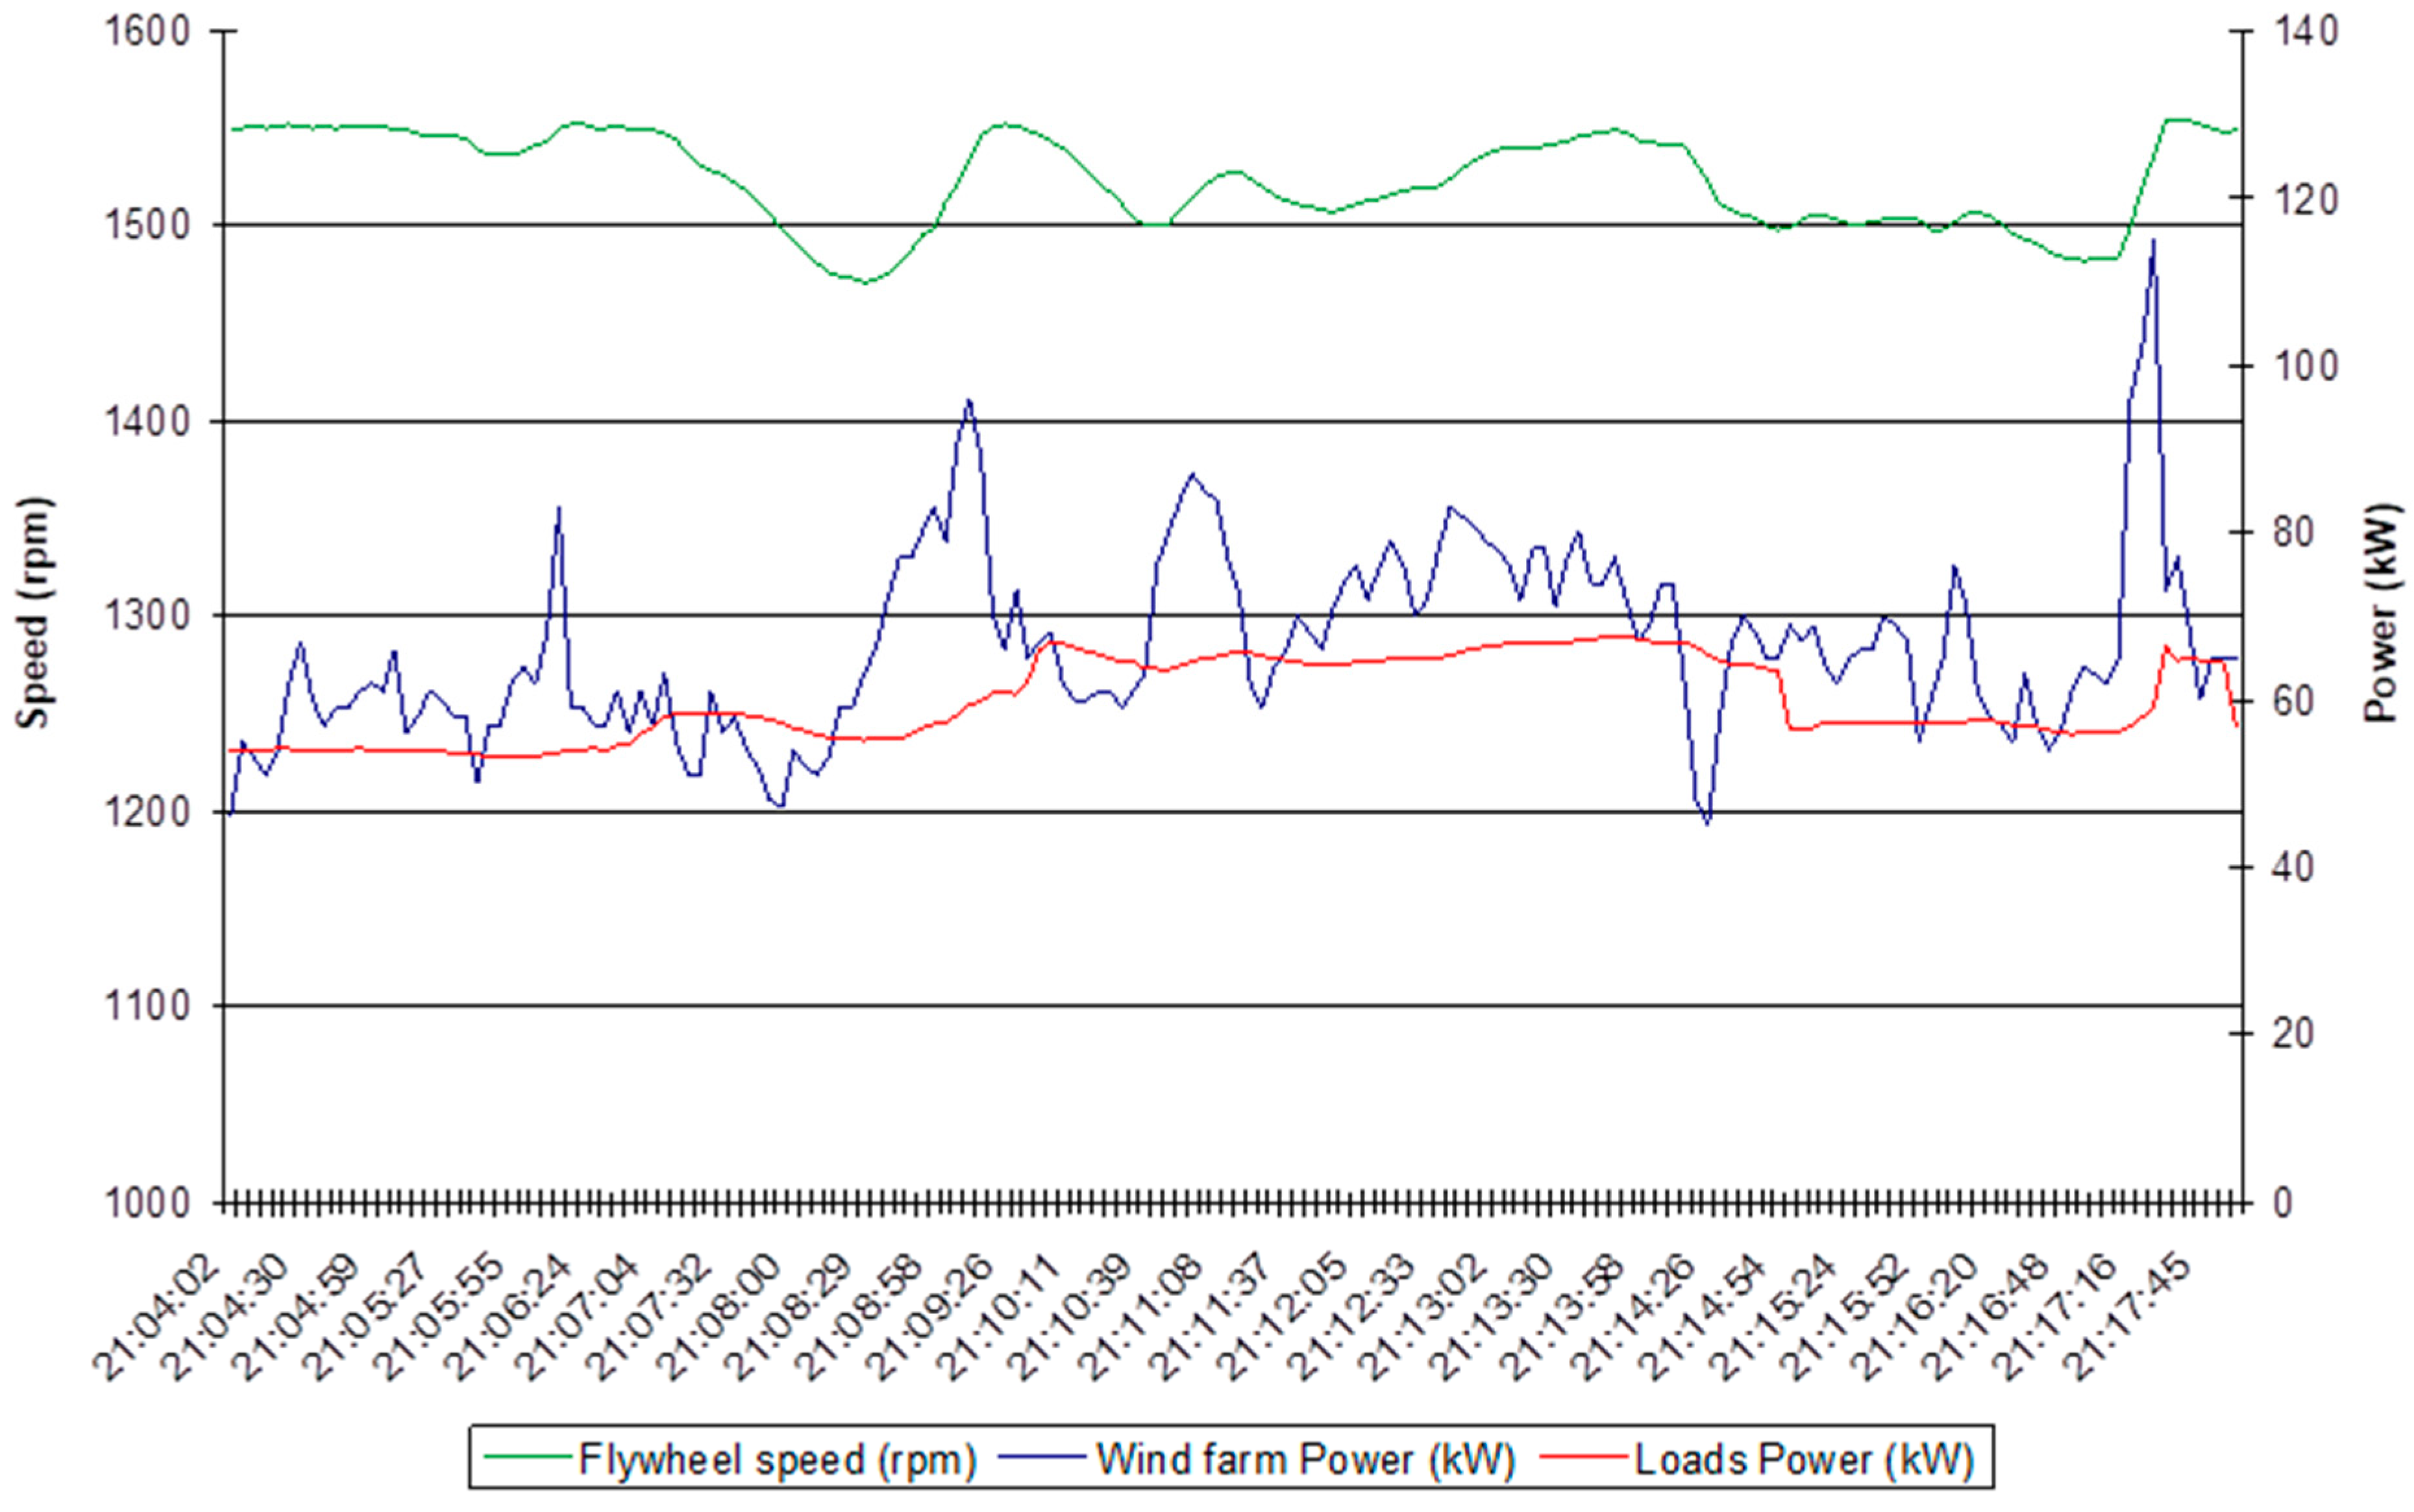
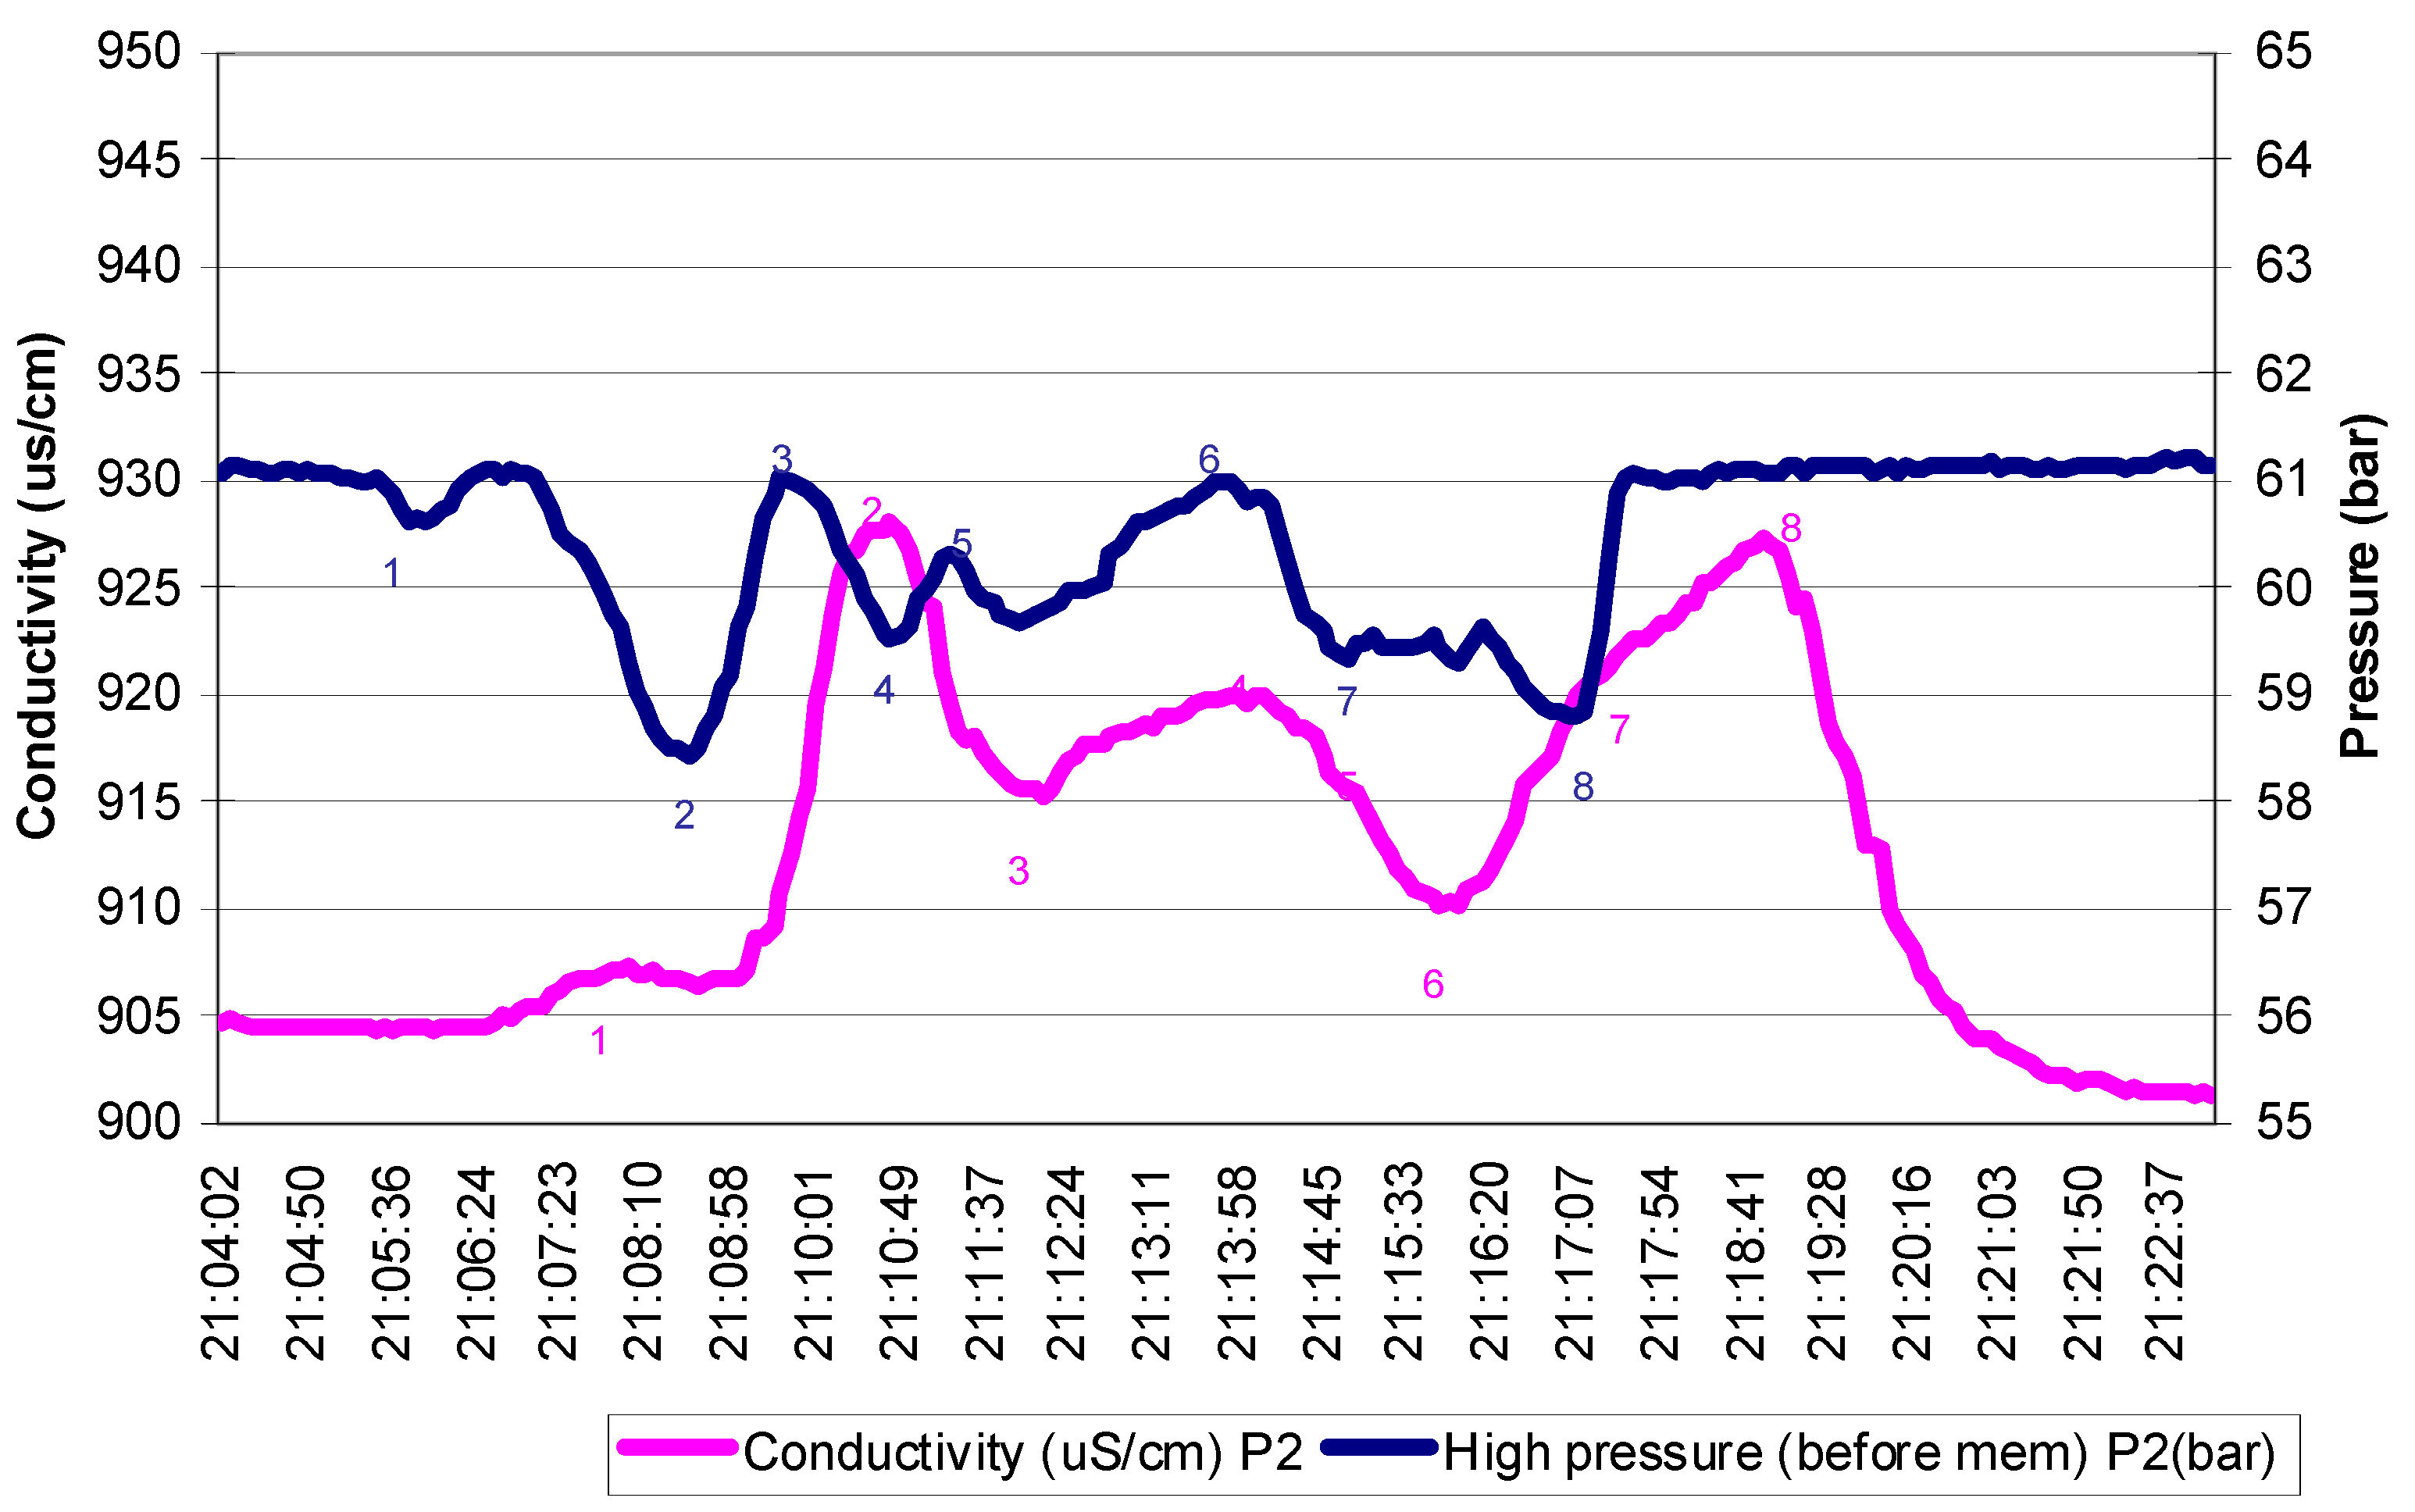
2.3. Wind-Driven Reverse-Osmosis Desalination Systems

Regarding the sizing, Peñate et al. [32] published a case study of the wind-driven desalination technology used in the Canary Islands. The authors analyzed three wind turbines with different power output to supply an SWRO of 1000 m3/d nominal capacity. The proposed system uses conventional batteries as energy storage, which are able to guarantee 6 h of water production at nominal conditions. The recommended nominal power of a wind turbine is 225 kW. According to this study, an estimation of the ratio of nominal wind power to the water production is 5 kW/ (m3/h).
The maximum SWRO plant capacity to be driven by wind energy will be limited to the nominal power of the associated off-grid wind farm. In the Canary Islands, there is a modality of the association of an SWRO plant and a wind farm located in proximity. Both facilities are on-grid; however, an important percentage (at least 50%) of the electricity generated by the wind system is consumed by the plant, leading to a favorable net energy balance.
The main disadvantage of wind-driven RO systems is the irregularities (fluctuations and interruptions) of the available wind power, which forces the SWRO installation to vary the power demand or even halt its operation. This variable and discontinuous working could lead to operational issues and higher requirements of maintenance, such as a reduction of the lifespan of the equipment, more frequent membrane replacements, and higher consumptions of chemicals. For an appropriate assessment of these effects, long-term tests (several years) should be carried out under variable power supplies.
The incorporation of energy storage systems is a key element to match the power demanded and generated on the very short term—few seconds and below one second (supercapacitors, flywheel, compressed air)—and in the medium–long term, i.e., hours/days (batteries, hydrogen, pumped hydro storage) [33].
Regarding wind-powered RO units, the maximum commercial capacity is theoretically much higher than for PV-RO, as all of the main components (wind generators, converters, energy storage systems, and SWRO plants) are available at the medium and large scales, and at the lower area requirement for the same energy generation. The reason for the absence of these systems is that a 24/365 on-grid connection is more economically viable. After testing a 200 m3/d SWRO system for R&D purposes, relevant results were obtained by the cooperative work conducted by the University of Las Palmas de Gran Canaria and the ITC within the framework of the SDAWES European project:
  • The identification of recommendations for wind-driven desalination systems [34].
  • The identification of the RO operation oscillations under variable frequencies of the isolated grid due to the low wind speed conditions: pressure (59–61 bar), water conductivity (900–925 µS/cm), and product flow (890–980 L/h; 89–98% of the nominal point) [35].
  • Stability in power balance under low-wind conditions [36].

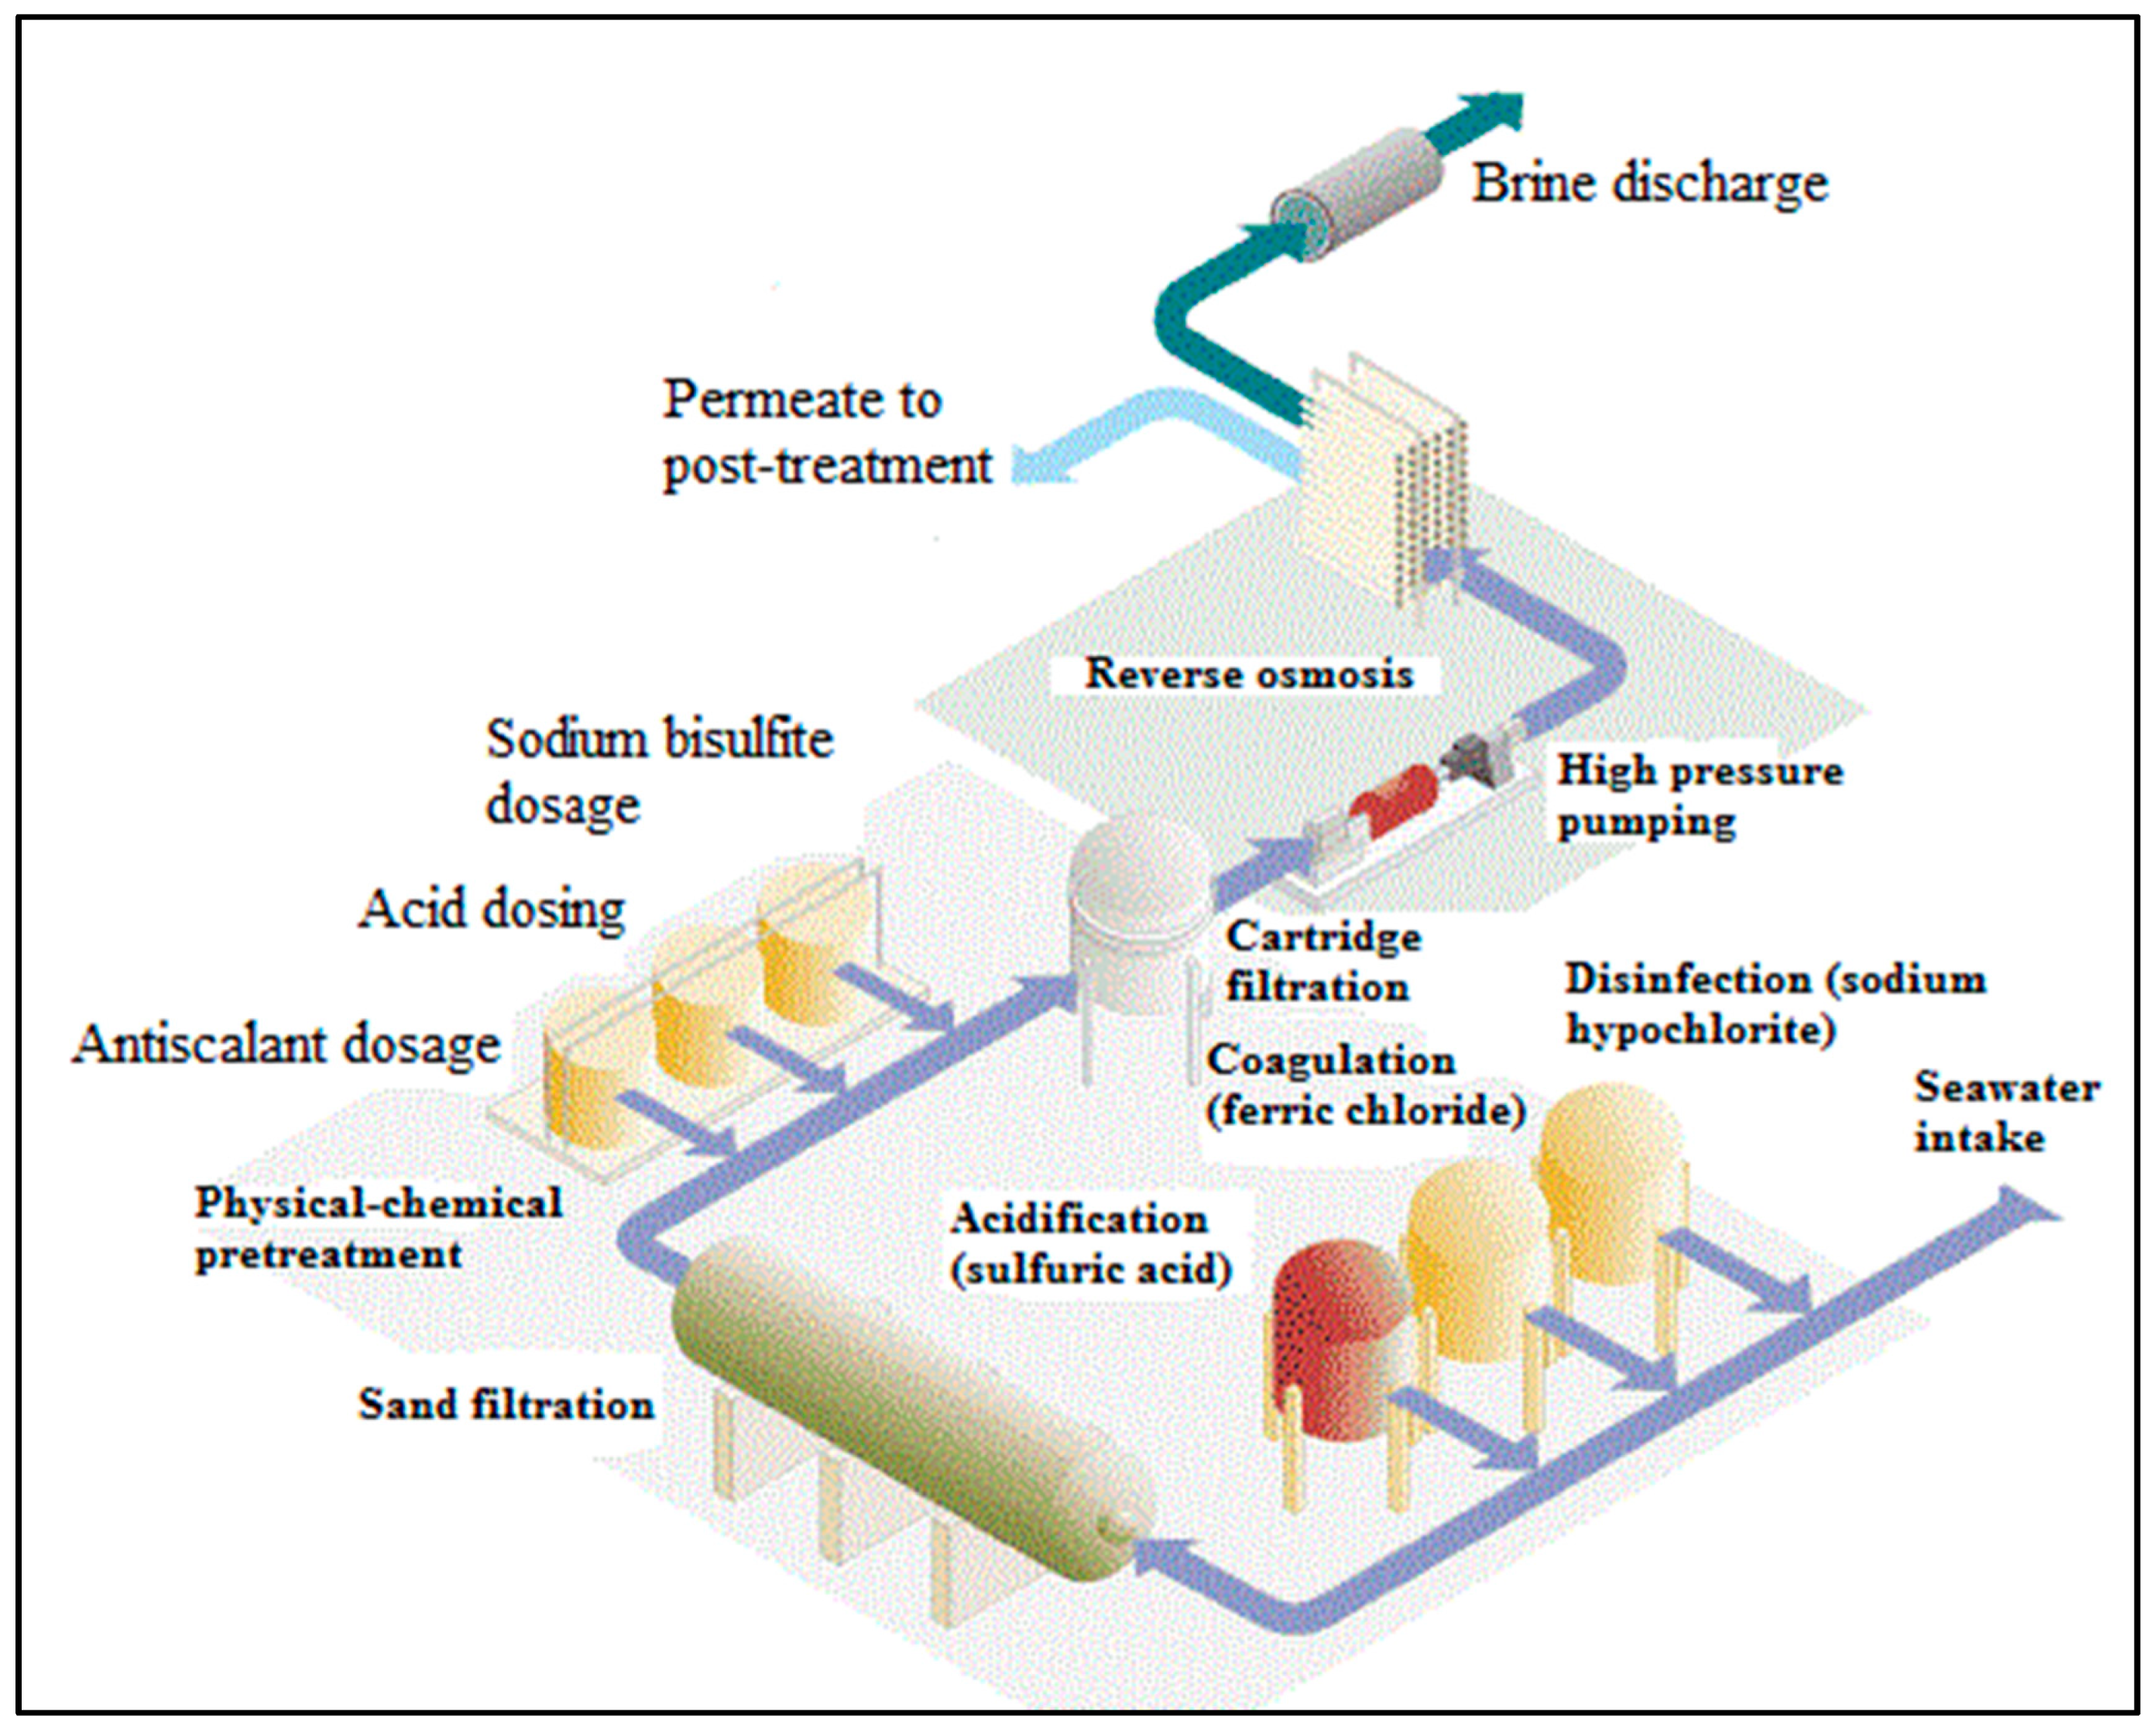
3. Appropriate Pre-Treatment

RO plant pre-treatment is an essential part of this technology in order to obtain a better quality of feed water for the membranes, better performance in terms of product quality, lower energy consumption, and a longer membrane lifespan. The pre-treatment is designed for each plant, and depends on the physical and chemical properties of the raw water and its required flow.

3.1. General Recommendations

Considering the operation under an RE supply, the main recommendations to be taken into account are the following:
  • A direct raw water intake from the sea should be avoided in order to prevent the introduction of organic matter and suspended solids. The recommended solution for the medium and low scale is to dig a coastal well, thereby using the ground as a natural pre-filter.
  • Chemical product requirements should be limited insofar as possible, in order to reduce the external dependence, as RE-driven autonomous systems are normally located in remote areas.
  • We should select a medium–low RO recovery ratio in the design in order to reduce the pre-treatment requirements, selecting a value below the results from simulations: 75–80% for brackish water (the normal recovery is 85–90%), and 35–40% for seawater (the usual recovery is 43–45%).

3.2. Physical Pre-Treatment

Physical pre-treatment consists of a multi-layer filter (loose stone–sand–anthracite) and a cartridge filter. The selection of the dimensions is made from the feed flow; they are preferably oversized in order to guarantee the filtering, enlarge the operation and reduce the maintenance. This point is particularly important in operations in brackish waters, where there may be relevant variability in the raw water quality.
A very particular case of physical pre-treatment was installed in an operating PV-RO unit in Tunisia, where a natural cooling process of the raw water, coming from an artesian well at more than 37 °C, was included in order to reduce the temperature before reaching the membranes [9].
One innovation in the physical pre-treatment is the use of Ultra-Filtration (UF) membranes. For the case of very-high-turbidity brackish waters, the researchers of the UFTEC project [37] concluded upon several advantages of this option, such as a reduction in the use of chemical products and an increase of the net flux. On the other hand, the inclusion of UF in large commissioned SWRO units is recommended in order to obtain significant savings in capital costs (more than 30%), and to achieve similar operation costs to conventional pretreatments, such as pressure or gravity filters [38]. In any case, UF is not a simple solution, and should be proposed after the evaluation of all possible alternatives.

3.3. Chemical Pre-Treatment

Chemical pre-treatment includes different processes for different purposes, and the application and dosing of the chemical products will depend on the characteristics of each feed water. A detailed presentation of the treatments is provided in Table 4.
Figure 1 shows a scheme with the physical and chemical pretreatments commonly used in the reverse osmosis process.

4. Brine Energy Recovery

One of the key factors of the successful design of a PV/Wind RO desalination system is the minimization of the power demand. A minimal energy consumption in RO will reduce the generation system, battery capacity, and thus the investment costs. The specific energy consumption can be reduced by selecting a low-energy membrane element type, the use of high efficiency pumps, and mainly by incorporating an energy recovery device (ERD). However, most of the international market addresses medium- and large-capacity (on-grid) SWRO plants, and there are few options for small units (see Table 5). It is expected that companies will consider new developments for small RO units as soon as there is a higher demand for RE-powered RO systems. The ITC (Canary Islands Institute of Technology) has tested different small ERD units for RO plants under 30 m3/d [30].
As complementary information, a new technology is intended to reduce the energy consumption and increase the recovery: closed-circuit desalination (CCD). CCD technology can be applied to both sea and brackish water; regarding seawater, a specific energy consumption under 2 kWh/m3 was obtained, and it is expected to achieve less than 1.5 kWh/m3 for an average product water quality of 500 ppm [45].

5. Energy Storage Systems

One of the main components of an isolated solar- or wind-powered small RO system is the energy storage unit. For long periods (hours), the widely used option is batteries; currently, there are different technologies available: Pb-Acid, NaS, Ni-Cd, and more recently, Li ion. On the other hand, pumped water storage such as hydro power plants can provide the best solution for large systems, as happens on the island of El Hierro, Spain, where a 1.5 MW hydro-wind power plant can supply more than 60% of the electricity demand of the island (10,000 inhabitants) [46]. Hydrogen generation could be another long-term energy back-up option.
Because the fluctuations in RE power affect off-grid frequency, a regulation system is required to balance the ups and downs from the generation system along the short periods (seconds or less) of these situations. There are different options: flywheels, super-capacitors, and compressed air, among others. More details about the advantages and limits of these technologies can be found in reference [33].
The main reason to include a back-up system is the necessity to match a variable power generation system with the constant power demand of an RO unit. Figure 2 illustrates the role of a flywheel as an energy storage system on an off-grid wind RO system (in the case of a project tested at the ITC facilities [35]). The rapid fluctuations in frequency varied the pressured flow to the membranes, modifying the inlet pressure and affecting the product water flow and conductivity: the greater the inlet pressure, the lower the water product conductivity, and vice versa (see Figure 3).
Figure 4 presents the effect of batteries in a PV-RO autonomous unit (a system installed in Tunisia [47]). The batteries are charged whenever the solar power is higher than the RO power, and are discharged to supply power when the solar power cannot cover the RO demand. On very low-radiation days, the RO unit remains halted, and all of the energy produced goes to the batteries.
Energy back-up allows the storage of energy from the generation system when the RO unit is off, and during the periods of a surplus of power production. This energy will be used to complement the supply during low-power PV/wind periods, enlarging the daily operation time of the autonomous RO plant.
Battery-less PV-RO systems have hardly been tested; batteries can be inexistent or minimized provided that the RO unit is set up to operate with a variable power demand [48,49].
Regarding a wind-RO combination without energy storage, there is also a lack of experience [50]. The frequent oscillations of wind power would lead to consequent rapid variations in the operation point of the RO unit and a high number of start–stop cycles. This situation would cause a high variation in the operation pressure and flow inside the pressure vessels; these high/low pressure cycles would probably reduce the performance of the RO unit, thus potentially leading to the following problems: the shorter lifespan of the membranes, an increase of unexpected failures, a higher level of maintenance requirements, and lower levels of product water quality and quantity.

6. Recommendations for Autonomous RE Desalination Plants in Remote Locations

This section introduces a set of recommendations to be considered when an isolated PV/wind-powered RO system is designed, in order to identify the key elements for the best technical solution based on local conditions.

6.1. Information to Be Gathered on Local Conditions

The minimum or main data and issues to be collected are listed in Table 6 (a selection from [50]). An appropriate collection of information regarding the local conditions will allow us to carry out a design adapted to them, as each location has its own particularities.

6.2. General Concept of the Design

Given the restrictions associated with remote locations, a specific analysis and way of thinking must be considered in order to reach a sustainable and stable operation. The design of the whole installation should be created under a philosophy of low-maintenance and maximum autonomy:
(a)
Indications regarding the O&M team include preliminary steps along the commissioning and first weeks of operation will require an active implication of external installers, including the comprehensive training of the local team who will progressively assume the O&M tasks. The simpler the operation and understanding of the system (being user friendly), the longer the successful operation the installation will have.
(b)
Indications regarding the equipment include the inclusion of spare parts for the main components and the most common hydraulic and electric elements, as well as the use of tough and high-quality materials.
The RO configuration allows many options; nonetheless, those with the minimum energy requirements should be selected. Additionally, there should be an appropriate selection of the RO modules, including the latest-generation membranes, with high performances in terms of salt rejection, energy consumption and permeated flow.

6.3. Operation and Maintenance

The long-term operation of an autonomous RO system requires the appropriate maintenance of the whole installation. Manufacturers of equipment include the most common troubleshooting actions as part of the operation handbooks. The main aim of the preventive maintenance is to identify deviations from the operation parameters in order to avoid failures. Specific venting and cleaning actions must be considered in order to prevent damage from the environmental conditions of the temperature, air quality and moisture, particularly on the PV panels and in the electrical components.
Regarding the RO unit, the key parameters to be controlled are the flows, the pressures, and the raw and product water’s conductivity; in the case of the components of the generation system (the PV or wind option), the key components are the output voltage and current. Batteries to be used as an energy storage system require specific attention to check whether each module is within the correct operational range. Furthermore, the wiring connections and conduits must be inspected periodically in order to check if they are properly clean, secure and uncorroded.
Table 7 shows a list of the most common issues and the recommended corrective actions in the RO unit.
From the practical experience drawn from different ITC projects [4,9,34,35,36,47,50,51], the main issues to be controlled in wind/PV-powered RO desalination systems are summarized in Table 8 and Table 9.

7. Wind-PV (Hybrid) Systems

The combination of solar and wind resources in the same system allows for more available power for the RO plant, and consequently, more operation time and water production, improving the quality of the water service supply in order to guarantee demand. Furthermore, the problems derived from discontinuous operation could be reduced or partially avoided under a hybrid generation system. On the other hand, the main drawback is the complexity of the system in terms of installation, maintenance and control.
The main pros and cons of hybrid generation systems are presented in Table 10.
There are very few examples of off-grid hybrid PV/wind-powered RO systems. Table 11 summarizes the main data of two R&D examples.
Hybrid systems can achieve higher stability by incorporating diesel generation. On the other hand, and within the medium scale, RO units can be considered as a deferrable load associated to a water reservoir, in order to guarantee the stability of a micro-grid (Bognar et al., 2013). The critical limitation of this option is the high number of parameters that need to be controlled: the variable demand of electricity, the variable power from PV fields and wind farms, energy storage management, and the partial dependence on the diesel generator to maintain the stability of the electricity supply throughout the whole year. SMA and ZIGOR technologies provide DC/AC converters with output powers of hundreds of kW, and even over one MW, under their philosophy of micro-grids. Hydrogen storage and the associated DC generation by fuel cells could play a future key role in the energy management of micro-grids. Figure 5 illustrates a basic scheme with a multigeneration (wind + PV + diesel − optional-) system.

8. Economics

8.1. Generalities

One of the main disadvantages of RE-powered desalination is the high associated costs, not only CAPEX but also OPEX. Considering a conventional RO unit connected to the grid as a reference for comparison, the capital expenses of a PV/wind RO plant are mainly affected by the following items:
  • The low nominal capacity of the desalination plant and the associated economic scale factor, particularly in PV-driven RO installations.
  • The additional investment for all of the components of the stand-alone generation system.
The operation expenses are much higher in comparison with conventional on-grid large RO plants due to the specific situations derived from discontinuous operation. On the other hand, the number of annual operation hours depends on the available energy; thus, it is lower than the operation time of the conventional on-grid RO units, reducing the water production.
The combination of all of these factors leads to high values of the PV/wind’s produced water cost in comparison with the water cost from conventional SWRO plants, commonly in the range of 0.5–1.1 USD/m3 [53].

8.2. CAPEX Review

Table 12 summarizes the specific investment costs, which prove useful as a reference or for calculations. Over the past ten years, both PV and wind components have reduced in CAPEX costs substantially, benefitting the implementation of off-grid systems.
The operation and maintenance costs will depend on the local labor cost, the replacement frequency of the durable elements such as membranes or filters, the required demand of consumables (such as chemical products), the location of the system, and the costs associated with transport.

8.3. Calculation of the Desalinated Water Costs

A general list of the elements to be taken into consideration in order to calculate the total cost of the installation is given in Table 13. The water costs can be calculated based on the net annual economic balance and the total water production.
The water cost of a PV/wind RO system depends on the following elements:
  • The size of the facility;
  • The local wind/solar resources;
  • The quality and salinity of the raw water;
  • The factors associated with the location: transport, the proximity to a place with spare parts and a consumables supply, and the availability of skilled operators for corrective maintenance, among others).
Table 14 summarizes a set of the main installation data and water costs for several systems and locations; due to the diversity of locations, technologies, capacities, types of raw water and the year of commissioning, the values of the water cost are in a very wide range: 1.8–10.3 €/m3. Short-term perspectives (2030) estimate the wind- and PV (balanced by battery and power-to-gas storage)-driven SWRO water cost to be 1–2 €/m3, whilst the forecast for fossil fuel-powered SWRO plants is 0.6–1.9 €/m3 [56].

8.4. Optimization of the Water Cost

The identification of the minimum water cost must, on the one hand, consider all of these points in order to be realistic; on the other hand, we should consider all of the possible alternatives for a given case in order to reach the optimal combination. Furthermore, a specific analysis of each component of the cost will be helpful in order to ascertain the potential savings, which will be different for each location and set of local circumstances.
The main elements suggested for the comparison of alternatives are presented in Table 15.
Complementarily, an appropriate calculation of the water cost must include social and environmental costs. As a remarkable reference, a specific methodology to analyze the sustainability of 14 conventional SWRO plants (on-grid supply) concluded that the levelized water cost increases from USD 0.53 to 0.67 $/m3 (in the best case) and from 1.94 to USD 2.68 $/m3 (in the worst case) when social and environmental aspects are included [61]; this means an estimated increment of 19% to 38% in the water cost.

9. Future Perspectives

Over the last two decades, there has been an evolution of RE-based technologies towards higher R&D interest, leading to more economical and efficient options. The increasing integration of renewable energy sources in the energy supply of the water production sector will lead to more secure and sustainable seawater desalination, particularly in mega-SWRO desalination plants [62]. On the other hand, PV/wind-driven RO autonomous desalination will have a relevant presence as part of the energy–water nexus; this section highlights the key issues to be considered in that role.

9.1. Technical Keys

The future tendencies of RE-powered technologies will be based on the following topics:
  • The reduction of energy consumption: There is a progressive upgrading process in energy saving and its associated exceptional results (below 2 kWh/m3) using ultra-low-energy membrane elements, high-performance pumps, a salinity gradient, and very efficient energy recovery systems. The lower the energy demand, the greater the operation time for the same available energy; this progression will open an interesting path to optimize RE-powered RO desalination [61,63].
  • The performance of RO operations: The latest tendencies in membrane technologies (intermediate stages, a higher size of modules, advances in nano- and ultra-filtration as pre-treatment options) could lead to a higher performance of RO operations, reducing the specific energy consumption space requirements and maintenance costs, and increasing the product water quality and the lifespan of membrane elements and installations;
  • Design optimization: This involves the use of special techniques—such as metaheuristics—to find the optimal design of the whole system [60,64].
  • The latest advances in wind energy involve an increment in the unitary power, improvements in the output power control power, advance monitoring, and preventive maintenance.
  • The latest advances in PV energy involve better performances at competitive costs thanks to a wider and broader commercial offers, the use of one or two axes of solar-tracking structures, an increment of unitary power for off-grid inverters [31], and the use of DC supply to power the RO unit [65].
  • There are indications to improve the design, durability and quality of components and reduction of O&M costs by minimizing the time to repair and reinstall failed equipment, along with preventive maintenance schedules, particularly regarding inverters, a key component which is responsible for up to 36% of the energy loss and 43–70% of PV power plant service requests [66].
  • The use of hybrid generation systems: The preferable option is mainly, but not only, based on PV and wind power. The incorporation of wind energy balances the lack of solar power during low solar radiation and nighttime periods, extending the available energy, and thus the operation time and associated water production [60,64,67,68].
  • The latest advances in control systems involve the incorporation of genetic algorithms [68], the forecast of wind and solar resources, and the use of machine learning techniques [68,69,70,71,72,73,74] to predict the performance and to control the autonomous RO units, allowing more accurate and efficient operation.
  • Energy storage: The advances in cutting-edge batteries, fuel cells and hydrogen storage will allow long-term, stable and flexible energy storage for an optimal matching of generated and demanded power [65,75,76].
  • Integration into micro-grids: The simultaneous supply of water and electricity by RO plants coupled to hybrid micro-grids in isolated places that can both cover the demands and extend the penetration of RE sources [77]. Furthermore, the inclusion of a RO unit, as a controllable load, in a micro-grid will contribute to a more stable supply.

9.2. Economic Keys

The future of RE-powered desalination will depend on how economical the produced water may be. According to Abunayyan [78], some SWRO plants in GCC (Gulf Cooperation Council) countries have achieved water costs in the range of 28–48 US cents per m3.
Despite there being a significant difference in comparison with the water cost from conventional desalination, there are several situations to be considered:
  • The capex of RE technologies has been decreasing over the past few years; it is expected to reach a value of EUR 1 per installed watt (referred to the whole PV system) within a few years [58].
  • There is a rising market and new commercial opportunities derived from the climate crisis, and indications from the IPCC to reduce greenhouse effect emissions.
  • The volatility of oil prices, the increasing difficulty to discover new reserves, and uncertain future prices could lead to a crisis as soon as oil demand overcome the offer.
  • The future water crisis derived from climate change, particularly relevant in countries with historical water shortage, will increase the demand for autonomous and RE-driven desalination systems.
  • Very attractive water costs can be expected, considering the recent lowest water levelized tariffs in on-grid SWRO plants: about USD 0.3 per cubic meter (Hassyan plant) [79]. This is possible thanks to the high capacity of the plant (more than 450,000 m3/d), the use of low-cost energy and the selection of the most efficient and reliable technologies.

9.3. Other Aspects

The expansion and progression of renewable energy desalination, and the case of PV/wind-powered RO systems will not only require technical and economic aspects but also complementary measures to make it a reality:
  • Social component: There is a specific necessity for autonomous water supply in developing regions associated with cooperation projects, wherein the social issues must be specifically considered from the beginning of the project [51]. The long-term success of the system will strongly depend on the following social aspects:
    • The analysis of the social reality of the beneficiary community in order to adapt the project to the local conditions and incorporate their participation and commitment.
    • The involvement of local authorities to give them a relevant role in the decisions and, ideally, to achieve a contribution to cover either part of the initial investment and/or the assumption of the O&M expenses.
    • The appropriate selection of people to be trained to assume the management and maintenance tasks of the system.
  • Environmental component: The integration of RE resources, such as wind and/or solar energy, in the operation of RO plants curbs (or at least, highly reduces) CO2 emissions associated with conventional on-grid RO plants. Nonetheless, brine discharge must be assessed and considered, particularly in inland locations; evaporation ponds, the blending with raw water for appropriate dilution and later disposal, or even the watering of crops adapted to high-salinity water, could be adopted as actions to curb or restrict the environmental impact of brine discharge [51].
  • Political component: Decision makers, who are normally the key group amongst the stakeholders to start a project, suffer from an important lack of information on and knowledge of these technologies. Therefore, dissemination activities and introductory training courses are essential items for the creation of the necessary awareness. A complete vision of the barriers and suggested proposals is given in [80].

10. Conclusions

A general vision of the technical and economic aspects of solar- and wind-powered reverse osmosis has been given. Indications and recommendations on the pre-treatment, energy recovery, generation system, and energy storage have been presented. Furthermore, a short set of guidelines for the design, operation and maintenance of autonomous RO units has also been included.
To summarize, the main aspects to be considered in order to implement a PV/wind RO system would be the following:
  • The high importance of the appropriate identification of the local characteristics in order to carry out a tailor-made design and a correct O&M plan. This is particularly critical when the system is installed in developing countries.
  • The suitable selection of high-quality materials and main components.
  • The inclusion of an energy recovery unit for seawater, and an energy storage system.
  • The use of a beach well as the feed water intake for SWRO is much more favorable.
  • Wherever there is the simultaneous availability of relevant solar and wind resources, it makes sense to consider hybrid systems.
  • The consideration of an integral concept of the project to include all of the elements associated with the cost.
  • The latest advances in membranes and generation technologies have produced more efficient and economical products, leading to more competitive costs. The set of recommendations presented in this document may also be considered as a basic set of ideas to reduce water costs.
The future perspective of solar/wind-driven RO is extremely promising, especially if environmental and demographic aspects are considered: in this century, the prices of fossil fuels are likely to increase, climate change will continue to lead to water shortages, and the world population will continue to grow. On the other hand, the rising competence in the solar and wind markets will produce a more extensive and attractive offer of technologies and equipment. Nonetheless, it is imperative to boost R&D activities to find the best and most economical solutions for a broad, sustainable water supply.

Author Contributions

Conceptualisation: V.J.S.-O. and B.P.-S.; methodology, V.J.S.-O.; investigation, V.J.S.-O. and B.P.-S.; data curation, V.J.S.-O.; writing—original draft preparation, V.J.S.-O. and J.A.d.l.F.-B.; writing—review and editing, V.J.S.-O. and J.A.d.l.F.-B.; supervision, V.J.S.-O., J.A.d.l.F.-B. and B.P.-S. All authors have read and agreed to the published version of the manuscript.

Funding

This research was co-founded by the European Regional Development Fund—ERDF—within the projects: EERES4WATER (EAPA_1058/2018) Interreg Atlantic Area Program, and E5DES (MAC2/1.1a/309) Interreg MAC 2014–2020 Program.

Institutional Review Board Statement

Not applicable.

Informed Consent Statement

Not applicable.

Data Availability Statement

The data presented in this study are available in the list of references. For additional information about the study, you can contact the corresponding author.

Acknowledgments

The corresponding author is very grateful to the University of Seville, and particularly to his tutor, Lourdes García-Rodríguez, for the opportunity of completing his professional career with his PhD thesis (base text for this paper). Complementary, this study is the result of a long trajectory (1997–2014) within the Water Department of the Canary Islands Institute of Technology (ITC); and the interaction with many engineers and professionals from local (case of the University of Las Palmas de Gran Canaria) national and international entities, focused on projects in the field of “renewable energy driven desalination”; thus, the corresponding author expresses his gratitude to all of them, particularly to Baltasar Peñate (current Head of the Water Dept. and co-tutor of the mentioned PhD).

Conflicts of Interest

The authors declare no conflict of interest.

References

  1. Baalousha, H. Desalination status in the Gaza Strip and its environmental impact. Desalination 2006, 196, 1–12. [Google Scholar] [CrossRef]
  2. El Sheikh, R.; Ahmed, M.; Hamdan, S. Strategy of water desalination in the Gaza Strip. Desalination 2003, 156, 39–42. [Google Scholar] [CrossRef]
  3. Mogheir, Y.; Foul, A.A.; Abuhabib, A.; Mohammad, A. Assessment of large scale brackish water desalination plants in the Gaza Strip. Desalination 2013, 314, 96–100. [Google Scholar] [CrossRef]
  4. Subiela, V.J.; De La Fuente, J.A.; Piernavieja, G.; Peñate, B. Canary Islands Institute of Technology (ITC) experiences in desalination with renewable energies (1996–2008). Desalin. Water Treat. 2009, 7, 220–235. [Google Scholar] [CrossRef]
  5. Gómez-Gotor, A.; Del Río-Gamero, B.; Prado, I.P.; Casañas, A. The history of desalination in the Canary Islands. Desalination 2018, 428, 86–107. [Google Scholar] [CrossRef]
  6. Prieto-Prado, I.; Del Río-Gamero, B.; Gómez-Gotor, A.; Pérez-Báez, S. Water and energy self-supply in isolated areas through renewable energies using hydrogen and water as a double storage system. Desalination 2018, 430, 1–14. [Google Scholar] [CrossRef]
  7. Charoset, C. A review of membrane processes and renewable energies for desalination. Desalination 2009, 245, 214–231. [Google Scholar] [CrossRef]
  8. Ghermandi, A.; Messalem, R. Solar-driven desalination with reverse osmosis: The state of the art. Desalin. Water Treat. 2009, 7, 285–296. [Google Scholar] [CrossRef] [Green Version]
  9. Subiela, V.; Peñate, B.; Castellano, F.; Rodríguez, F. Solar PV powered RO systems. In Renewable Energy Applications for Freshwater Production; CRC Press/Francis&Taylor Group: Boca Raton, FL, USA, 2012; Volume 8, pp. 135–160. [Google Scholar]
  10. Partners of the Project. Prodes Project. Available online: http://www.prodes-project.org/ (accessed on 14 May 2018).
  11. Boesch, W.W. World’s first solar powered reverse osmosis desalination plant. Desalination 1982, 41, 233–237. [Google Scholar] [CrossRef]
  12. García-Rodríguez, L. Renewable energy applications in desalination: State of the art. Sol. Energy 2003, 75, 381–393. [Google Scholar] [CrossRef]
  13. Tzen, E.; Morris, R. Renewable energy sources for desalination. Sol. Energy 2003, 75, 375–379. [Google Scholar] [CrossRef]
  14. Tzen, E.; Theofilloyianakos, D.; Kologios, Z. Autonomous reverse osmosis units driven by RE sources experiences and lessons learned. Desalination 2008, 221, 29–36. [Google Scholar] [CrossRef]
  15. Carvalho, P.C.M.; Carvalho, L.A.D.; Filho, J.J.H.; Oliveira, R.S.H. Feasibility study of photovoltaic powered reverse osmosis and pumping plant configurations. IET Renew. Power Gener. 2013, 7, 134–143. [Google Scholar] [CrossRef]
  16. Davis, L.W. The Economic Cost of Global Fuel Subsidies. National Bureau of Economic Research, 2013. Available online: http://www.nber.org/papers/w19736 (accessed on 21 March 2022).
  17. Fthenakis, V.; Atia, A.A.; Morin, O.; Bkayrat, R.; Sinha, P. New prospects for PV powered water desalination plants: Case studies in Saudi Arabia. Prog. Photovolt. Res. Appl. 2016, 24, 543–550. [Google Scholar] [CrossRef]
  18. Shatat, M.; Worall, M.; Riffat, S. Opportunities for solar water desalination worldwide: Review. Sustain. Cities Soc. 2013, 9, 67–80. [Google Scholar] [CrossRef]
  19. Goetzberger, A.; Hebling, C.; Schock, H.-W. Photovoltaic materials, history, status and outlook. Mater. Sci. Eng. R Rep. 2003, 40, 1–46. [Google Scholar] [CrossRef]
  20. Solarbuzz. Price Survey. Available online: http://www.solarbuzz.com (accessed on 12 July 2008).
  21. Thomson, M.; Infield, D. A photovoltaic-powered seawater reverse-osmosis system without batteries. Desalination 2003, 153, 1–8. [Google Scholar] [CrossRef]
  22. Shalaby, S.M. Reverse osmosis desalination powered by photovoltaic and solar Rankine cycle power systems: A review. Renew. Sustain. Energy Rev. 2017, 73, 789–797. [Google Scholar] [CrossRef]
  23. Bundschuh, J.; Kaczmarczyk, M.; Ghaffour, N.; Tomaszewska, B. State-of-the-art of renewable energy sources used in water desalination: Present and future prospects. Desalination 2021, 508, 115035. [Google Scholar] [CrossRef]
  24. Ahmed, F.E.; Hashaikeh, R.; Hilal, N. Solar powered desalination—Technology, energy and future outlook. Desalination 2019, 453, 54–76. [Google Scholar] [CrossRef] [Green Version]
  25. Raval, H.D.; Maiti, S. A Novel Photovoltaic Powered Reverse Osmosis with Improved Productivity of Reverse Osmosis and Photovoltaic Panel. J. Membr. Sci. Res 2015, 1, 113–117. [Google Scholar]
  26. Raval, H.D.; Maiti, S. Ultra-low energy reverse osmosis with thermal energy recovery from photovoltaic panel cooling and TFC RO membrane modification. Desalin. Water Treat. 2014, 57, 1–10. [Google Scholar] [CrossRef]
  27. Ghafoor, A.; Munir, A.; Ahmed, T.; Nauman, M.; Amjad, W. Investigation of hybrid solar-driven desalination system employing reverse osmosis process. Desalin. Water Treat. 2020, 178, 32–40. [Google Scholar] [CrossRef]
  28. Subiela, V.J.; Peñate, B.; García-Rodríguez, L. Design recommendations and cost assessment for non-stop off-grid plants of seawater desalination based on PV-driven with wind/diesel energy backup. Desalin. Water Treat. 2020, 181, 80–100. [Google Scholar] [CrossRef]
  29. Water Technology. Available online: https://www.water-technology.net/projects/israel/ (accessed on 14 May 2018).
  30. Peñate, B.; Subiela, V.; Melián, G.; de la Fuente, J. Energy recovery devices for reverse osmosis low water production capacity desalination plants (<100 m3/d). In Proceedings of the EuroMed 2010 EDS Conference “Desalination for Clean Water & Energy”, Tel Aviv, Israel, 3–7 October 2010. [Google Scholar]
  31. SMA. SMA Website. Available online: www.sma.de/en (accessed on 14 May 2018).
  32. Peñate, B.; Castellano, F.; Bello, A.; García-Rodríguez, L. Assessment of a stand-alone gradual capacity reverse osmosis desalination plant to adapt to wind power availability: A case study. Energy 2011, 36, 4372–4384. [Google Scholar] [CrossRef]
  33. Koohi-Kamali, S.; Tyagi, V.; Rahim, N.; Panwar, N.L.; Mokhlis, H. Emergence of energy storage technologies as the solution for reliable operation of smart power systems: A review. Renew. Sustain. Energy Rev. 2013, 25, 135–165. [Google Scholar] [CrossRef]
  34. Subiela, V.J.; Carta, J.A.; González, J. The SDAWES project: Lessons learnt from an innovative project. Desalination 2004, 168, 39–47. [Google Scholar] [CrossRef]
  35. Carta, J.; González, J.; Subiela, V. Operational analysis of an innovative wind powered reverse osmosis system installed in the Canary Islands. Sol. Energy 2003, 75, 153–168. [Google Scholar] [CrossRef]
  36. Carta, J.; González, J.; Subiela, V. The SDAWES project: An ambitious R&D prototype for wind-powered desalination. Desalination 2004, 161, 33–48. [Google Scholar] [CrossRef]
  37. UFTEC Partners. UFTEC Website. EC European Commission, Life Programme. Available online: http://www.life-uftec.eu (accessed on 23 May 2018).
  38. Knops, F.; Kahne, E.; Román, A.; Rubio, M. Technological Innovations in Pretreatment with membranes. In III International Desalination Seminar; ALADYR: Antofagasta City, Chile, 2012. [Google Scholar]
  39. Available online: http://novena.asambleamurcia.es/sites/external/murcia_agua/cap15.2.htm (accessed on 15 March 2022).
  40. Danfoss. Danfoss Website. Available online: www.danfoss.com (accessed on 10 May 2018).
  41. KSB. SALINO Pressure Center. Available online: https://www.ksb.com/salino-en/downloads (accessed on 10 May 2018).
  42. SPECTRA Watermakers. Available online: www.spectrawatermakers.com (accessed on 10 May 2018).
  43. Energy Recovery. Available online: www.energyrecovery.com (accessed on 10 May 2018).
  44. Peñate, B.; de la Fuente, J.; Barreto, M. Operation of the RO Kinetic® energy recovery system: Description and real experiences. Desalination 2010, 252, 179–185. [Google Scholar] [CrossRef]
  45. Stover, R.L.; Efraty, N. Low-Energy Consumption with Closed-Circuit Desalination. IDA J. Desalin. Water Reuse 2012, 4, 12–19. [Google Scholar] [CrossRef]
  46. Gorona del Viento. Available online: www.goronadelviento.es (accessed on 23 May 2018).
  47. Peñate, B.; Subiela, V.J.; Vega, F.; Castellano, F.; Domínguez, F.J.; Millán, V. Uninterrupted eight-year operation of the autonomous solar photovoltaic reverse osmosis system in Ksar Ghilène (Tunisia). Desalin. Water Treat. 2015, 55, 3141–3148. [Google Scholar] [CrossRef]
  48. Thomson, M.; Infield, D. Laboratory demonstration of a photovoltaic-powered seawater reverse-osmosis system without batteries. Desalination 2005, 183, 105–111. [Google Scholar] [CrossRef]
  49. Miranda, M.S.; Infield, D. A wind-powered seawater reverse-osmosis system without batteries. Desalination 2003, 153, 9–16. [Google Scholar] [CrossRef]
  50. Subiela, V.J.; Banat, F. Region identification and site selection. In ADIRA Handbook, A Guide to Autonomous Desalination System Concepts; Seval Sözen, S.T., Ed.; European Union: Brussels, Belgium, 2007; Chapter 2. [Google Scholar]
  51. Subiela, V.J.; Peñate, B. Autonomous Desalination and Cooperation. The Experience in Morocco Within the ADIRA Project. In Black Sea Energy Resource Development and Hydrogen Energy Problems; Springer: Berlin/Heidelberg, Germany, 2011; pp. 319–337. [Google Scholar]
  52. Tzen, E. Successful Desalination RES Plants Worldwide (Seminar of the ADU-RES Project). Hammamet (Tunisia). 2005. Available online: http://www.adu-res.org/pdf/CRES.pdf (accessed on 7 May 2018).
  53. Water Department, ITC, Canary Islands Institute of Technology. Data from Purchased Equipment for R&D Projects on Wind/PV Powered Seawater Reverse Osmosis Desalination; ITC: Gran Canaria Island, Spain, 2007. [Google Scholar]
  54. Water Department, ITC, Canary Islands Institute of Technology. Own Data from Purchased Systems Installed in Morocco (ADIRA Project, MEDA Water Programme, EC); ITC: Gran Canaria Island, Spain, 2007. [Google Scholar]
  55. ATERSA. ATERSA Shop. Available online: https://atersa.shop/ (accessed on 21 June 2018).
  56. Caldera, U.; Bogdanov, D.; Breyer, C. Desalination Costs Using Renewable Energy Technologies. In Renewable Energy Powered Desalination Handbook; Elsevier: Amsterdam, The Netherlands, 2018; pp. 287–329. [Google Scholar]
  57. Ghaffour, N.; Venkat Reddy, K. The True Cost of Water Desalination: Review and Evaluation. In Proceedings of the IDA World Congress, Dubai, United Arab Emirates, 7–12 November 2009. [Google Scholar]
  58. IRENA. IRENA Publications. Available online: http://www.irena.org/publications/2015/Dec/Renewable-Desalination-Technology-Options-for-Islands (accessed on 20 May 2018).
  59. Koklas, P.A.; Papathanassiou, S.A. Component sizing for an autonomous wind-driven desalination plant. Renew. Energy 2006, 31, 2122–2139. [Google Scholar] [CrossRef]
  60. Wu, B.; Maleki, A.; Pourfayaz, F.; Rosen, M.A. Optimal design of stand-alone reverse osmosis desalination driven by a photovoltaic and diesel generator hybrid system. Sol. Energy 2018, 163, 91–103. [Google Scholar] [CrossRef]
  61. Lior, N.; Kim, D. Quantitative sustainability analysis of water desalination—A didactic example for reverse osmosis. Desalination 2018, 431, 157–170. [Google Scholar] [CrossRef]
  62. Juma bin Jarsh Al Falasi, M. Water-Energy Nexus in Abu Dhabi: An Opportunity to Accelerate the Transition to a Green Economy; IDA Global Connections Summer: Topsfield, MA, USA, 2021. [Google Scholar]
  63. Touati, K.; Salamanca, J.; Tadeo, F.; Elfil, H. Energy recovery from two-stage SWRO plant using PRO without external freshwater feed stream: Theoretical analysis. Renew. Energy 2017, 105, 84–95. [Google Scholar] [CrossRef]
  64. Zarzo, D.; Prats, D. Desalination and energy consumption. What can we expect in the near future? Desalination 2018, 427, 1–9. [Google Scholar] [CrossRef]
  65. Maleki, A.; Pourfayaz, F.; Ahmadi, M.H. Design of a cost-effective wind/photovoltaic/hydrogen energy system for supplying a desalination unit by a heuristic approach. Sol. Energy 2016, 139, 666–675. [Google Scholar] [CrossRef]
  66. Karavas, C.-S.; Arvanitis, K.G.; Kyriakarakos, G.; Piromalis, D.D.; Papadakis, G. A novel autonomous PV powered desalination system based on a DC micro grid concept incorporating short-term energy storage. Sol. Energy 2018, 159, 947–961. [Google Scholar] [CrossRef]
  67. Hacke, P.; Lokanath, S.; Williams, P.; Vasan, A.; Sochor, P.; TamizhMani, G.; Shinohara, H.; Kurtz, S. A status review of photovoltaic power conversion equipment reliability, safety, and quality assurance protocols. Renew. Sustain. Energy Rev. 2018, 82, 1097–1112. [Google Scholar] [CrossRef]
  68. Bourouni, K.; Ben M’Barek, T.; Al Taee, A. Design and optimization of desalination reverse osmosis plants driven by renewable energies using genetic algorithms. Renew. Energy 2011, 36, 936–950. [Google Scholar] [CrossRef]
  69. Gupta, R.; Kumar, R.; Bansal, A.K. BBO-based small autonomous hybrid power system optimization incorporating wind speed and solar radiation forecasting. Renew. Sustain. Energy Rev. 2015, 41, 1366–1375. [Google Scholar] [CrossRef]
  70. Yang, D.; Kleissl, J.; Gueymard, C.; Pedro, H.T.; Coimbra, C.F. History and trends in solar irradiance and PV power forecasting: A preliminary assessment and review using text mining. Sol. Energy 2018, 168, 60–101. [Google Scholar] [CrossRef]
  71. Liu, H.; Mi, X.; Li, Y. Smart deep learning based wind speed prediction model using wavelet packet decomposition, convo-lutional neural network and convolutional long short term memory network. Energy Convers. Manag. 2018, 166, 120–131. [Google Scholar] [CrossRef]
  72. Sharma, A.; Kakkar, A. Forecasting daily global solar irradiance generation using machine learning. Renew. Sustain. Energy Rev. 2018, 82, 2254–2269. [Google Scholar] [CrossRef]
  73. Cabrera, P.; Carta, J.A.; González, J.; Melián, G. Artificial neural networks applied to manage the variable operation of a simple seawater reverse osmosis plant. Desalination 2017, 416, 140–156. [Google Scholar] [CrossRef]
  74. Cabrera, P.; Carta, J.A.; González, J.; Melián, G. Wind-driven SWRO desalination prototype with and without batteries: A performance simulation using machine learning models. Desalination 2018, 435, 77–96. [Google Scholar] [CrossRef]
  75. Little, M.; Thomson, M.; Infield, D. Electrical integration of renewable energy into stand-alone power supplies incorporating hydrogen storage. Int. J. Hydrogen Energy 2007, 32, 1582–1588. [Google Scholar] [CrossRef]
  76. Siddiqui, O.; Dincer, I. Examination of a new solar-based integrated system for desalination, electricity generation and hydrogen production. Sol. Energy 2018, 163, 224–234. [Google Scholar] [CrossRef]
  77. Astolfi, M.; Mazzola, S.; Silva, P.; Macchi, E. A synergic integration of desalination and solar energy systems in stand-alone microgrids. Desalination 2017, 419, 169–180. [Google Scholar] [CrossRef]
  78. Abunayyan, M. The Elements Needed to Achieve Lower Desalination Tariffs; IDA Global Connections Summer: Topsfield, MA, USA, 2021. [Google Scholar]
  79. Technical Review Middle East. DEWA Receives Record Low Tariff Hassyan Sea Water RO Plant. Available online: https://www.technicalreviewmiddleeast.com/power-a-water/water-a-environment/dewa-receives-record-low-tariff-hassyan-sea-water-ro-plant (accessed on 15 March 2022).
  80. PRODES Partners. Roadmap. Available online: http://www.prodes-project.org/fileadmin/Files/ProDes_Road_map_on_line_version.pdf (accessed on 14 May 2018).
Figure 1. Schematic diagram of physical and chemical pre-treatment in an SWRO desalination plant (source: own elaboration adapted from [39]).
Processes 10 00653 g001
Figure 2. Selection of monitored data from an off-grid wind-powered SWRO system.
Processes 10 00653 g002
Figure 3. Evolution of the pressure inlet to the membranes and the product water conductivity under a variable power supply period.
Processes 10 00653 g003
Figure 4. Selection of 4-day monitored data from an off-grid PV-powered RO system.
Processes 10 00653 g004
Figure 5. Basic scheme with a multigeneration system. Source: [28].
Processes 10 00653 g005
Table 1. Photovoltaic installations used in desalination since 2011 [24,25].
CountryYearFeed WaterPermeate Production [m3/d]
Australia2011BW4.8
USA2012BW75
Egypt2012BW5
Jordan2012BW5.7
Jordan2012BW5.7
Tunisia 2013BW1800
Qatar 2013SW12,000
Vanuatu2013SW96
Vanuatu2013SW96
Mexico2014BW840
Mexico2014BW48
Brazil2014BW3600
UAE2015SW200
India2015BW1.04
India2015BW1.068
India2015BW1.68
India2015SW0.64
Qatar2015BW100
Malaysia2016BW5.1
Jordan2016BW13–63
Turkey2017SW24
Cape Verde2021SW120
Table 2. Rough estimation of size for the main components of a PV-RO system.
Type of Feed Water & Associated Power Demand for a Nominal Flow of 1 m3/hEnergy Storage to Cover One Day Operation (8 h) Without Solar EnergyPV Field to Feed the Energy Storage (70% of Efficiency and 5 Peak Solar Hours)Inverter Power (Internal Efficiency: 0.9)
Seawater (SW), 4 kW (3 kW for RO—with ERD—and 1 kW for the feed water pump)667 Ah (4000 W × 8 h/48 V)9.1 kWp (4 kW/0.7 × 8 h = 45.7 kWh; 45.7 kWh/5 h)4.4 kW (4 kW/0.9)
Brackish Water (BW), 2–2.5 kW334 Ah4.5 kWp2.2 kW
Table 3. Maximum capacities of inverters and the associated RO capacity.
PowerReferenceAssociated RO Capacity
24 kW3 phase off-grid system [31]5.7 m3/h (SW)
11.36 m3/h (BW)
Table 4. Summary of the chemical pre-treatment.
TreatmentObjectivePossible CompoundsRecommended Dosing
ChlorinationBiocide to avoid foulingNaClO or Ca(ClO)2 or Cl2ODepending on the type of raw water and the physical pre-treatment
AcidificationpH adjustment to prevent scaling and enhance the biocide activityH2SO4, HNO3, or HClThe required for a pH of 5.5–6
Anti-scaling dosingAvoid the solid deposits of low solubility salts (BaSO4, CaSO4, SrF2, among others)Na hexametaphosphate, among many other compoundsDepending on the concentration of the low solubility salts and the recovery ratio
De-chlorinationAvoid damage to the membranes due to the presence of free chlorineEither active carbon filter or sodium meta-bisulphite dosingDosing is regulated by measuring the residual free chlorine or REDOX
FlocculationIncrease the retention of particles in case of high levels of suspended solidsFeCl3 or Al2(SO4)3Optimal dosing adjusted experimentally until reaching the appropriate turbidity
Table 5. Summary of the energy recovery systems.
Manufacturer/ModelBrine Flow [m3/h]Efficiency (%)ReferenceSEC * (kWh/m3)
Danfoss i-Save7–52 (several models)Up to 93–95[40]n.a.
KSB/4 in 1 system12.6n.a.[41]n.a.
Danfoss (APP-APM, Axial Piston Pump-Motor)3.1n.a.[30]2.16
Clarck pump24 L/h (product flow)n.a.[42]3.6
ERI45–6896.1–97.8[43]2.35
RO Kinetic8 and 40Close to 98[44]2–2.5
(*) SEC (Specific Energy Consumption) data from four different tested energy recovery systems [30].
Table 6. List of the basic information to be collected.
Raw Water and Energy Data
Physical PropertiesChemical PropertiesRE ResourcesWater Demand
  • Available raw water flow, particularly relevant for inland wells, affected by seasonal variations
  • Conductivity
  • SDI
  • pH
  • chemical composition,
  • microbial presence
  • Horizontal solar radiation (Monthly mean values)
  • Wind speed (Monthly mean values)
  • Current energy supply
  • Monthly profile
  • Water uses
  • Current water supply
Other Data
Geographic informationState of possible existent infrastructure of water & energy supplyEconomic dataSocial data
  • Location of target village and distribution of houses and collective buildings (health center, schools and others)
  • Location of relevant points: wells, nearest city, fountains (consumption points), built water tanks
  • Wells
  • Pumps
  • Piping system
  • Reservoirs
  • Electric generation
  • Local grid
  • Price of water
  • Price of diesel
  • Price of electricity
  • Labor activity
  • Population and seasonal variations
Table 7. Most common operation issues in RO plants.
IndicationPossible CausesRecommended Actions
1. Increase of the specific energy consumptioni. Loss of efficiency in pumps
ii. Reduction in product flow
iii. Reduction in inlet pressure
iv. Increase in pressure drop through the membranes (fouling or scaling)
i. Check the internal components of the pump (impeller, bearings, fan) to find friction points and/or overheating
ii. See indication 3
iii. Check pressure drop in filters and clean or replace filtering material
iv. Chemical cleaning or replacement of affected modules
2. Increase of the product water conductivityv. Malfunction in membrane elements
vi. Possible brine leakage inside the pressure vessels
v. Replacement of damaged elements
vi. Check the internal connections between elements for possible damage in O rings.
3. Reduction of the product flowvii. Insufficient feed flow
viii. Insufficient inlet pressure to membranes
ix. Product flow to brine current
vii. Check feed pump, pressure drop in filters, or level of raw water well
viii. Check the high-pressure pump
Table 8. Main operational problems after testing a wind-powered SWRO system.
ComponentProblemSolution
Synchronous machine coupled to the flywheelDifficult starting of the stand-alone grid under low wind conditions.
Insufficient power in specific moments (under a high decrease of wind speed).
Overheating and excessive friction losses.
Inclusion of a variable speed starting-up motor to initiate the movement.
Proposed replacement of the installed flywheel by a friction-less (vacuum operation) high-speed flywheel.
Selection of tough and efficient mechanical supports and bearings.
Wind generatorCorrosion on the outside metal components.
Failure in the blade motors due to the continuous regulation of the pitch angle to control the output power.
Selection of specific high quality materials.
Consider extra motors as spare parts. Improvements on the control software to minimize the stress on the blade motors.
Feed water systemVariations in the feed water pressure due to the variable connection of the different RO units.Extend the operation range of feed pressure to the RO units.
RO plantsSudden reduction of operation pressure after stops.Proposed installation of an automatic needle valve for appropriate pressure control.
Control systemMalfunction in control PC due to the simultaneous monitoring and control software in the same hardware.Suggested use of specific control and monitoring software in different hardware.
Table 9. Main operational problems after installing and running PV-powered RO systems.
ComponentProblemSolution
PV fieldCorrosion on metallic surfaces.
Solar tracking systems were damaged due to wind load.
Proposed use of other materials for structures.
Installation of plastic walls as windbreakers.
BatteriesFailure of module.Replacement by a new module; meanwhile, operation without the damaged module was temporally implemented but at lower DC voltage (updating of control and converters setup was required).
ConvertersHigh local temperature (50 °C) in Tunisia.Construction of a partially buried building to use the soil as natural thermal isolation.
RO plantsHigh temperature of raw water (>35 °C) in Tunisia
Reduction in the water quality and quantity in comparison with the nominal values after 8 years of operation
Water production is higher than demand.
Installation of a feed water tank before the RO membranes to store feed water and slightly reduce the temperature.
Proposed increase of the frequency of chemical cleanings.
Proposed use of water surplus by sending water to nearby communities, services or for watering. Another option would be to use part of the electricity to power other loads, such as lighting.
Control systemStart/stop sequences of RO unit and batteries operation are not optimal.New control software setup is recommended.
Table 10. Pros and cons of hybrid PV/wind-powered desalination systems.
ProsCons
More power at all times, i.e., more energy per day.Not all locations are appropriate, since simultaneous availability of solar and wind resources are required.
More operation time, i.e., more water production.Two types of generation systems with very different variability in power production, maintenance requirements and operation performance.
Probable reduction in water cost, in comparison with a system based on only one RE source.More complex control & monitoring systems to check the power balance and reach a stable operation.
Table 11. Main data of two selected hybrid PV/wind-driven SWRO systems.
LocationPV PowerWind PowerRO CapacityBatteries StorageReference
CRES facilities CRES (Lavrio, Greece)3.96 kWp900 W130 L/h1800 Ah/100 h[52]
ITC facilities ITC (Pozo Izquierdo, Gran Canaria, Spain)600 Wp890 W154 L/h868 Ah/100 h[4]
Table 12. Capital costs of different components (purchased systems).
ComponentNominal SizeSpecific Cost (€)Reference YearLocationRef.
Flywheel and synchronous machine100 kVA224 €/kVA1997Gran Canaria Island, Spain[53]
Wind farm (only the wind generators)2 × 230 kW828 €/kW1999Gran Canaria Island, Spain[53]
RO plant SW (1 m3/h)30 m3/d1200 €/installed daily m32007Gran Canaria Island, Spain[53]
Complete PV-RO system50 m3/d5230 €/installed daily m32007Ksar Ghilène, (Tunisia)[9]
Off-grid inverter4 kW433 €/kW (nominal power)2008Sidi Ifni, (Morocco)[54]
Batteries & associated charge controllers650 Ah6.6 €/Ah2008Sidi Ifni, (Morocco)[54]
RO plant of brackish water (BW)24 m3/d1045 €/installed daily m3)2008Sidi Ifni, (Morocco)[54]
PV system (modules, batteries, converters, cabling, structure)4 kWp5 €/Wp2008Sidi Ifni, (Morocco)[54]
Complete PV-RO system3 × 24 m3/d + 12 m3/d4250 €/installed daily m32008Four villages in Morocco (Provinces of Essaouira and Tiznit)[9]
Small wind generator 4–20 kW2.3–6.2 €/W (nominal power)2012Public data prices[53]
Solar kit for off-grid supply5 kWp2.16 €/Wp2018Public data prices[55]
Maintenanceless gel batteries 41–200 Ah C1001.6–2 €/Ah2018Public data prices[55]
Off-grid inverter8 kW404 €/kW (nominal power)2018Public data prices[55]
Table 13. Data to calculate the economic balance of an RE desalination system.
Investment CostsOperation CostsIncomes
  • RO plant components.
  • Generation system components.
  • Control & monitoring system.
  • Installation costs.
  • Engineering costs.
  • Amortization costs.
  • Other costs: transport, permissions, customs.
  • Replacement of components: batteries, pumps, cartridges, membranes.
  • Labor costs.
  • Consumables.
  • Energy costs, in case of systems with complementary supply from electrical grid and/or diesel generator.
  • Other costs.
  • Sale of produced water.
  • Sale of surplus electricity.
Table 14. Selection of the main data and water costs of different systems.
Type of PlantRE Power (kW)Water ProductionTotal Water CostPlaceCommissioning Year (Estimation)Ref.
PV-SWRO1005 m3/h6 €/m3Lampedusa (Italy)1990[57]
Wind-PV SWRO0.6 (Wind) + 3.5 (PV)125 L/h7.53 €/m3Maagan (Israel)1999[57]
PV-BWRO1.1250 L/h10.32 €/m3Ceara, Brazil2000[57]
PV-SWRO4.8400 L/h9 €/m3Pozo Izquierdo, Gran Canaria (Spain)2000[57]
Wind-SWRO2.5500 L/h1.78 €/m3R&D test Loughboroug University (UK)2003[57]
Wind-SWRO15800 L/h3–5 €/m3Pozo Izquierdo, Gran Canaria Island (Spain)2004[57]
PV-BWRO10.5February: 3.3–8.3 m3/d August: 6.6–12.8 m3/d3 €/m3Ksar Ghilène (Tunisia) 2006[47]
PV-BWRO (4 units) 2.5–43–6 m3/d5.45 €/m3 (average value)4 villages in Morocco2008[51]
PV-SWRO2.43–5 m3/d2 UK pounds/m3Case study for Eritrean.a.[48]
PV-SWRO 243250 m3/d2.2–3.2 USD/m3Theoretical studyn.a.[58]
Wind-SWROn.a.250 m3/d3–4 US$/m3 (case of 2000 full load hours/year)Theoretical studyn.a.[58]
60Wind-SWRO1510.5 m3/d (anual average)3.8 €/m3Theoretical studyn.a.[59]
PV-Diesel SWRO12 (Diesel) + 18 (PV)10 m3/d1.6–2.4 USD/m3Theoretical studyn.a.[60]
Wind-PV SWROSeveralSeveral1–2 €/m3Forecast study for 2030n.a.[56]
Table 15. List of alternatives to be studied in order to identify the optimal water cost of a PV/wind RO system.
Generation SystemRO PlantEnergy Storage System
  • Unitary generation vs. hybrid system.
  • Compare AC with DC supply to RO plant. DC motors are more expensive, but the inverter is unnecessary.
  • Punctual inclusion of conventional electricity supply by diesel generation.
  • Variable operation by using frequency converters in pumps: performance under the nominal conditions is lower but power demand is reduced making a higher adaptation to available power possible.
  • Modular units: it implies a more complex hydraulic installation with associated additional cost, but the operation time and total water production is extended.
  • Use of high efficiency pumps: higher cost with lower power demand.
  • Analyze different energy storage capacities.
  • Compare different technologies: Flow batteries are more expensive but more efficient and with lower maintenance requirements than the classical Lead-Acid option.
Publisher’s Note: MDPI stays neutral with regard to jurisdictional claims in published maps and institutional affiliations.

