Article

Recovery of Phenolic Compounds and Antioxidants from Coffee Pulp (Coffea canephora) Waste Using Ultrasound and Microwave-Assisted Extraction

1
School of Environmental and Life Sciences, College of Engineering, Science and Environment, University of Newcastle, Ourimbah, NSW 2289, Australia
2
School of Post-Harvest Technology, Faculty of Agriculture and Forest, Tay Nguyen University, Buon Ma Thuot 63100, Dak Lak, Vietnam
3
School of Science, Western Sydney University, Penrith, NSW 2751, Australia
*
Authors to whom correspondence should be addressed.
Processes 2022, 10(5), 1011; https://doi.org/10.3390/pr10051011
Submission received: 15 April 2022 / Revised: 12 May 2022 / Accepted: 17 May 2022 / Published: 19 May 2022
(This article belongs to the Topic Innovative Food Processing Technologies)

Abstract

:
Coffee pulp is a by-product generated from coffee bean production. This waste is a potential source of bioactive compounds, which can be recovered for use as an ingredient for many products. However, this by-product is typically dumped in landfills or made into compost. Ultrasound-assisted extraction (UAE) and microwave-assisted extraction (MAE) were employed to recover bioactive compounds from coffee pulp waste. Results showed that time and instrument power significantly affected the recovery yield in both UAE and MAE. The temperature was also a significant factor in UAE. The optimal MAE conditions were a radiation time of 70 min, a power of 700 W, and a 50% (v/v) ethanol solvent to sample ratio of 100:5 (mL/g), approximately 47 mg of phenolic compounds, 36 mg of flavonoid, 8 mg of chlorogenic acid, and 6 mg of caffeine could be recovered from 1 g of the material. The optimal UAE condition were an ultrasonic time of 35 min, a temperature of 60 °C, and a power of 250 W; however, bioactive compounds and antioxidant capacity constituted around one half of MAE. Therefore, MAE is recommended as the extraction technique for the bioactive compound and antioxidant recovery from the coffee pulp.

1. Introduction

Coffee is one of the most commonly consumed beverages around the world due to its organoleptic properties and stimulant effect [1,2,3]. Coffee was originally found in Africa, with the first coffee plants cultivated in Ethiopia [4]. There are over 100 coffee species known; however, only two main species, Coffea Arabica L. (Arabica) and Coffea canephora (Robusta), are grown commercially and produced in large scales [1].
Coffea Arabica L. commonly known as Arabica, makes up approximately 60% of the world coffee production. It was firstly discovered in southwest Ethiopia, and the crop then spread to Yemen at the beginning of 18th century [5]. Arabica preferably grows in a cool climate and high altitudes in equatorial areas [6]. In contrast, Coffea canephora (commonly known as Robusta) can grow to be strong and verdant in the warm and humid weather of tropical countries [6]. Robusta accounts for approximately 40% of the world’s coffee production. It was initially identified in central Africa, but is now also grown in Asia and America [5].
Coffee pulp, also known as the mesocarp of coffee beans, is the main residue produced during coffee production, and constitutes up to 40% by weight of coffee cherries. However, the coffee pulp by-product has not been utilized effectively [7], and is typically dumped in landfills, which causes a significant environmental pollution and toxic effects for people living nearby the waste effluent [8,9]. This by-product is rich in nutritive compounds, such as protein and carbohydrates, and phytochemicals, such as phenolic compounds, tannins, and caffeine [10].
The biochemical benefits of coffee have been investigated for many years, with the stimulative effects of caffeine on the human brain and nervous system drawing particular attention. Besides caffeine, chlorogenic acids [11], proanthocyanins [12], and other phenolic compounds contained in coffee pulp and coffee beans can support the immune system and help the human body to fight against numerous diseases related to the accumulation of oxygen-reactive species [13].
Extraction is an essential step in recovering high yields of bioactive compounds for further applications [14]. Extraction methods can be categorized as conventional or advanced techniques. Conventional methods, for example solvent and steam extraction, are simple to set up, but they are often high cost due to labor, time, solvent consumption, loss of targeted compounds, and low extraction yields [7]. In contrast, advanced techniques, such as microwave-assisted extraction (MAE) and ultrasound-assisted extraction (UAE), require more sophisticated equipment, but can overcome these barriers [15]. MAE and UAE have been widely applied for the recovery of bioactive compounds from plant materials [16,17]. UAE is carried out based on cavitation bubbles generated by ultrasonic waves, which break down cells to release bioactive compounds [18], while MAE operates using electromagnetic microwave radiation that generates temperature and pressure to stimulate the bioactive compounds to dissolve into the solvent [19,20]. Compared with other advanced technique, such as supercritical and subcritical fluid extraction, which operate under high pressure, UAE and MAE only require a milder condition operation [15,21].
No previous studies have established the optimal MAE and UAE extractions conditions, nor compared these two advanced techniques, in the recovery of bioactive compounds and antioxidant capacity from coffee pulp. Therefore, it was hypothesized that different MAE and UAE conditions would significantly affect recovery yields of bioactive compounds and antioxidant capacity, and that there was a significant difference in effectiveness between the two techniques. Therefore, this study aims to investigate the effects of UAE and MAE conditions to identify the most effective condition for the recovery of bioactive compounds and antioxidant capacity from coffee pulp, as well as to compare the effectiveness of MAE and UAE to determine the best extraction technique for future applications and valorization of coffee pulp.

2. Materials and Methods

2.1. Coffee Pulp

Robusta wet coffee pulp was collected from Thang Loi Company, Krong Pak District, Dak Lak province, Viet Nam. The pulp was collected after wet coffee processing, and was quickly frozen at −20 °C to minimize degradation. Before drying, the frozen pulp was thawed overnight at room temperature. The pulp was then dried at 90 °C for 6 h 30 min under a vacuum pressure of 3.75 mmHg using a vacuum dryer (Memmert VO200, Schwabach, Germany). An electric blender (Philips Blender Mill; Guangdong, China) was used to grind it into a fine powder before it was passed through a 1.4 mm Endecotts sieve (London, UK). Finally, the dried ground samples were stored at −18 °C in tightly sealed bags for further use.

2.2. Chemicals of Experiments

All chemicals used were of at least analytical grade. Folin–Ciocalteu’s reagent, methanol, ethanol, acetone, sodium nitrite, hydrochloric acid, formic acid, sodium thiosulphate, aluminium chloride, and iron (III) chloride were obtained from Merck. 2,2′-azino-bis(3-ethylbenzothiazoline-6-sulphonic acid) (ABTS), 2,2-diphenyl-1-picrylhydrazyl (DPPH), 2,4,6-tris(2-pyridyl)-s-triazine (TPTZ), trolox, and gallic acid were obtained from Castle Hill (Sydney, Australia). Anhydrous sodium carbonate and sodium hydroxide were purchased from Labco Chemicals, Australia. (+)-catechine, chlorogenic acid, and caffeine were purchased from Sigma-Aldrich Pty Ltd (Castle Hill, NSW, Australia).

2.3. Experimental Design

The one-factor-at-a-time method was applied to investigate the effects of ultrasonic conditions (time, temperature, and power) and the impact of the commercial microwave extraction conditions (radiation time and power) on the extraction efficiency of bioactive compounds and antioxidant capacity from the dried coffee pulp. The solvent used for extraction was 50% (v/v) aqueous ethanol solution, which was the most effective solvent for the extraction of bioactive compounds from the dried coffee pulp in our preliminary studies. The most effective sample to solvent ratio of 100:5 (mL/g) determined from these studies was also applied for the two techniques. Following extraction, the extract was immediately cooled on ice, then filtered using a Whatman No. 1 filter paper. The supernatant was then stored at 4 °C for further analysis within 24 h.

2.3.1. Ultrasound-Assisted Extraction (UAE)

To determine the impact of ultrasonic time, the ground dried coffee pulp was extracted in at ultrasonic power of 200 W for a time ranging from 5–65 min using an ultrasonic bath (Soniclean 220 V, 50 Hz, 250 W, Soniclean Pty, Ltd., Dudley Park, SA, Australia).
To investigate the effect of temperature, the most effective time (35 min) was then applied for extraction of dried coffee pulp at an ultrasonic power of 200 W for various temperatures (30, 40, 50, 60 °C).
Finally, to determine the effect of ultrasonic power, the optimal time (35 min) and temperature (60 °C is the maximum operation temperature of the machine) were used for extraction of dried coffee pulp for ultrasonic power ranging from 150–250 W.

2.3.2. Microwave-Assisted Extraction (MAE)

In this study, an ETHOS X extraction system (Metrohm Australia, Gladesville, NSW, Australia) was used, comprising a 5 L closed vessel attached with a reflux unit to control the pressure by condensing the vaporized solvent [22].
To determine the impact of radiation time, the dried coffee pulp was extracted with a radiation power of 500 W for radiation times ranging from 10 to 80 min.
To identify the effect of the radiation power, the optimal radiation time of 70 min was applied for extraction of dried coffee pulp for powers ranging from 300–900 W.

2.4. Determination of Bioactive Compounds

The total phenolic content (TPC), total flavonoid content (TFC), and two major bioactive compounds in coffee—caffeine and chlorogenic acid—were measured following previously reported methods.

2.4.1. Total Phenolic Content

The total phenolic content (TPC) was analyzed according to the method described by Vuong et al. (2013). In brief, 1 mL of diluted coffee pulp extract was added into 5 mL of Folin–Ciocalteu solution 10% (v/v), then was left at an ambient temperature for 8 min. Then, 4 mL of Na2CO3 7.5% (w/v) was added into the sample and shaken thoroughly, before being kept for 1 h in a dark room. The absorbance was read at 765 nm using a UV spectrophotometer (Cary 60 Bio, UV-Vis, Penang, Malaysia). Gallic acid was used for calibration via a standard curve, and the results were presented as mg of gallic acid equivalents per g of dried sample (mg GAE/g DW).

2.4.2. Total Flavonoid Content

The total flavonoid content (TFC) was calculated according to the method described by Vuong et al. (2013). In brief, 2 mL of deionized H2O was added into 0.5 mL of dried coffee pulp extract, followed by 0.15 mL of 5% (w/v) NaNO2. The mixture was then kept at an ambient temperature for 6 min. Then, 0.15 mL of 10% (w/v) AlCl3, 2 mL of 4% (w/v) NaOH and 0.7 mL of H2O were added, shaken thoroughly, and stored at RT for 15 min. Sample absorbance was then measured at 510 nm using a UV-Vis spectrophotometer (Cary 60 Bio, UV-Vis, Penang, Malaysia). Catechin was used for calibrating via a standard curve, and the results were expressed as mg of catechin equivalents per g of dried sample (mg CE/g DW).

2.4.3. Determination of Caffeine and Chlorogenic Acid

Caffeine and chlorogenic acid were analyzed using a high-performance liquid chromatography (HPLC) system (Shimadzu, Rydalmere, NSW, Australia), as described in our previous study [12]. The quantification of caffeine and chlorogenic acid was based on external caffeine and chlorogenic standard curves, and was expressed as mg per g of dried sample (mg/g DW).

2.5. Determination of Antioxidant Capacity

In total, three antioxidant assays were applied to determine the oxidative inhibition capacities of the extracts: 2,2′-azino-bis(3-ethylbenzothiazoline-6-sulfonic acid) (ABTS) assay, 2,2-diphenyl-1-picryl-hydracyl (DPPH) assay, and ferric reducing antioxidant power (FRAP) assay.
Trolox was used to generate external standard curves for the assays, and the results were expressed as mg of trolox equivalents per g of sample dry weight (mg TE/g dried sample).

2.5.1. ABTS Assay

An ABTS assay was applied as described by Vuong et al. (2013) [23].

2.5.2. DPPH Assay

A DDPH assay was measured as described by Thaipong et al. (2006), with some minor changes. Briefly, a working solution of DPPH and methanol was prepared to achieve an absorbance of 1.1 at 515 nm of wavelength. A DPPH assay was performed by adding 0.15 mL of the extracted sample with 2.85 mL of the above working solution, and was then held for 3 h in a dark room. Finally, the mixture was measured at 515 nm using a spectrophotometer (Cary 60 Bio UV-Vis Brand, Penang, Malaysia) [24].

2.5.3. FRAP Assay

The FRAP assay was performed as described by Benzie and Strain (1996) [25].

2.6. Statistical Analysis

All experiments were conducted in triplicate, and data were analyzed via ANOVA in JMP Pro 14.2 software. The Tukey–Kramer HSD was used for multiple comparison of means with a significance of 5% (p value < 0.05). Data are presented as means ± standard deviations.

3. Results and Discussion

3.1. Impact of UAE Extraction Parameters on Recovery Yields of Bioactives and Antioxidant Properties from Coffee Pulp

3.1.1. Effect of Ultrasonic Time

Overall, ultrasonic time significantly influenced the recovery yields of TPC, TFC, caffeine, chlorogenic acid, and antioxidant capacity of the coffee pulp (p < 0.05) (Table 1). The recovery yields of TPC, TFC, caffeine, chlorogenic acid, and antioxidant capacity generally increased with the ultrasonic time. After 15 min of infusion for ABTS, DPPH, and caffeine, 25 min for TPC, and 35 min for TFC, these yield attainments were plateaued, while an increase in CGA was still observed after 45 min. A boost of recovery yields of bioactive components and antioxidant capacities was recognized with longer ultrasonic time, and this was also reported in previous studies [23,26]. This can be explained by the following: when the samples are treated by ultrasound, an acoustic cavitation is created. This phenomenon forms micro-bubbles, which then increase in size while being oscillated, before collapsing vigorously inside samples cells. This cavitation generates shock waves carrying energy and pressure, which can break cell membranes and release biological components [27]. However, prolonged extraction can lead to increasing oxidation of bioactive constituents [28]. This accounts for the slight drop observed in phenolic compounds and antioxidant capacity after 55 min of sonication. Although all parameters increased for both 45 and 55 min, with the exception of FRAP (which decreased slightly), the increases were still within the error range for the 35 min extraction. The longer extraction would lead to a higher cost due to time consumption, while only a marginal increase was observed in bioactive capacity. Therefore, 35 min was identified as the most suitable ultrasonic extraction time for bioactive compound recovery, and was used for further investigation of other parameters.

3.1.2. Effect of Temperature

The results presented in Table 2 show that temperature substantially altered the recovery yields of bioactive compounds and their antioxidant capacities. The recovery yield of caffeine and CGA were not affected by temperature (p > 0.05). The recovery yields of TPC, TFC, and antioxidant activities were notably higher as the temperature increased, with recovery yields highest at 60 °C. Spigno et al. (2007) also found that higher temperature applied during extraction could result in a higher recovery yield of phenolic compounds. This occurs because higher temperature can better disrupt cell membranes, releasing more bioactive compounds into the solvent [29]. Moreover, at higher irradiated temperature, phytochemicals are more easily dissolved and diffused from the solid matrix into the solvent phase, thereby improving the extraction yield [30]. From the obtained results, a temperature of 60 °C (the maximum heating level of the instrument) was found to be most suitable for all bioactive compounds and antioxidant capacity, and this temperature would be used for later experiments.

3.1.3. Effect of Ultrasonic Power

Ultrasonic power was found to be a significant factor on all experimental responses (p < 0.05) (Table 3), with the exception of CGA. The recovery yields of TPC, TFC, caffeine, and antioxidant power increased at a higher level at an ultrasonic power of 250 W, as compared to other lower powers (p < 0.05). It was expected that higher levels of machine power would enhance extraction efficiency, and this caused an increase in the bubble cavitation which better penetrated the cells within the coffee pulp [31]. However, the biological components might be degraded by excessive heat caused by energy of the system [29]. Our results (Table 3) are similar to those previously reported for anthocyanins [32] and the recovery of phenolic compounds from macadamia skin [33].
Overall, the current study found that ultrasonic time, temperature, and power significantly affected the recovery yields of bioactive compounds from coffee pulp and their antioxidant capacity. The optimal UAE extraction conditions were identified as an ultrasonic time of 35 min, temperature of 60 °C, and power of 250 W (the maximum level operation power of UAE).

3.2. Impact of MAE Extraction Parameters on Recovery Yields of Bioactives and Antioxidant Properties from Coffee Pulp

3.2.1. Effect of Radiation Time

The results (Table 4) show that radiation time significantly affected the recovery yields of bioactive compounds and their antioxidant capacity (p < 005). The results showed that there was no significant change in caffeine recovery over time, but the recovery yield of TPC, TFC, CGA, and antioxidant capacity was highest when the radiation time ranged from 60 to 70 min. Our findings were consistent with previous studies on macadamia skin [34] and lemon myrtle [35], which also found that a longer radiation time led to higher recovery of bioactive compounds; however, too long a radiation time provided less recovery due to degradation, since bioactive compounds are sensitive to heat [11,36,37], which was also noted in these results after 80 min. Based on the current findings, radiation time of 70 min was found as the most suitable time, and was applied for further testing the impact of radiation power.

3.2.2. Effect of Radiation Power

The results (Table 5) show that the radiation power of the commercial ETHOS X significantly affected recovery yields of TPC from the coffee pulp and their antioxidant capacity, but did not significantly influence the recovery yields of TFC, caffeine, and CGA. Recovery yields of TPC and the antioxidant capacity increased slightly when radiation power increased to 700 W, then decreased when higher radiation power was applied. Our findings are consistent with previous studies where gallic acid was obtained the highest level at 630 W; a plateau was then observed when the power was increased [35]. However, it should be noted that excessive radiation power could lead to a low recovery yield of bioactive compounds due to the high heat that is generated, resulting in the degradation of thermosensitive molecules [38]. The present study, therefore, recommends that the optimal MAE conditions are a radiation time of 70 min and power of 700 W.

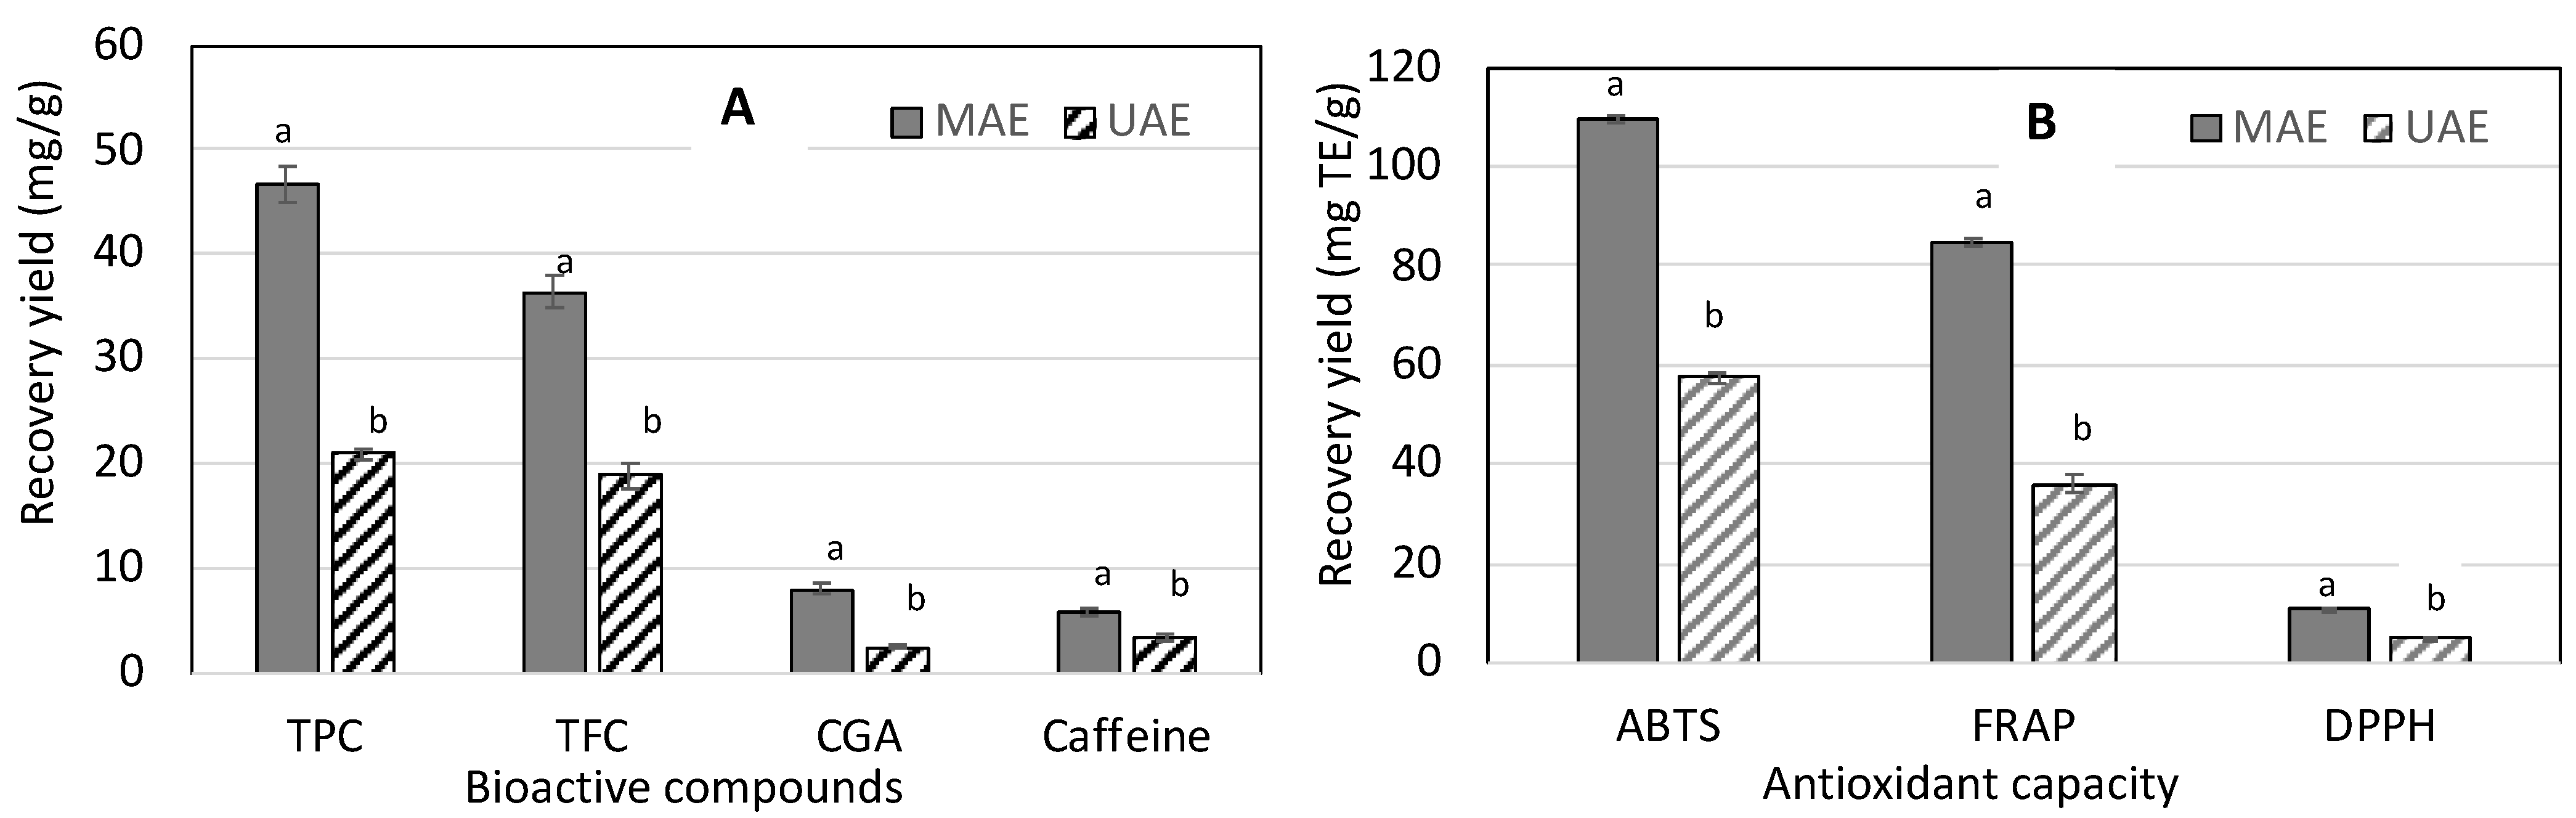
3.3. Comparison of UAE and MAE on the Recovery of Bioactive Compounds and Antioxidant Capacity from Coffee Pulp

The results presented in Figure 1 show that MAE was more effective for recovering bioactive compounds from coffee pulp with increased antioxidant capacity. Over 55% of TPC can be recovered using MAE, as compared to UAE. Similarly, MAE can recover 48% of TFC, 70% of CGA, and 42% of caffeine higher than those recovered by UAE (Figure 1A). The results in Figure 1B also reveal more antioxidant capacity for the MAE extract than UAE. MAE extract had antioxidant capacity of over 47% of ABTS, 57% of FRAP, and 52% of DPPH. These are higher than those obtained by UAE. Our findings are supported by a previous study, which found that MAE was more effective in the recovery of blueberry leaf bioactive compounds than UAE [39]. As there are limitations to the current approach to finding the optimal conditions for each extraction techniques due to the likely interaction between variables, it is recommended that further optimization should be carried out on MAE.

4. Conclusions

The extraction conditions of two advanced techniques, UAE and MAE, significantly impacted the recovery of bioactive compounds and antioxidant capacity from coffee pulp. For both UAE and MAE, in order to achieve high recovery yields of bioactive compounds and antioxidant capacity from coffee pulp waste, variables such as extraction time, temperature, and power were investigated and optimized. The findings indicate that the optimal UAE conditions were an ultrasonic time of 35 min, temperature of 60 °C, and power of 250 W, while a radiation time of 70 min and power of 700 W should be used for MAE. The results showed that MAE was more effective in recovering bioactive compounds and antioxidant capacity from coffee pulp than UAE, with extraction yields of TPC, TFC, CGA, and caffeine and antioxidant capacity by MAE found to be almost double compared to UAE. MAE was, therefore, recommended for further optimization and application for recovery of bioactive compounds and antioxidant capacity from the coffee pulp.

Author Contributions

Conceptualization, T.M.K.T., T.O.A., T.K., M.H.N. and Q.V.V.; Data curation, T.M.K.T., T.O.A., T.K., M.H.N. and Q.V.V.; Formal analysis, T.M.K.T.; Investigation, T.M.K.T.; Methodology, T.O.A., T.K., M.H.N. and Q.V.V.; Software, T.M.K.T. and Q.V.V.; Supervision, T.O.A., T.K., M.H.N. and Q.V.V.; Validation, T.M.K.T., T.O.A., T.K., M.H.N. and Q.V.V.; Writing—original draft, T.M.K.T.; Writing—review & editing, T.O.A., T.K., M.H.N. and Q.V.V. All authors have read and agreed to the published version of the manuscript.

Funding

This research was funded by the Viet Nam International Education Development—Ministry of Education and Training (Project 911) and the University of Newcastle for awarding a VIED-TUIT, grant number 2920/QĐ-BGDĐT.

Institutional Review Board Statement

Not applicable.

Informed Consent Statement

Not applicable.

Data Availability Statement

Not applicable.

Acknowledgments

The authors acknowledge the funding support from the Viet Nam International Education Development—Ministry of Education and Training (Project 911) and the University of Newcastle for awarding a VIED-TUIT to Thy Minh Kieu Tran.

Conflicts of Interest

The authors declare no conflict of interest.

References

  1. Chopra, V.; Peter, K. Handbook of Industrial Crops; CRC Press: Boca Raton, FL, USA, 2005. [Google Scholar]
  2. Ramalakshmi, K.; Kubra, I.; Rao, L. Physicochemical Characteristics of Green Coffee: Comparison of Graded and Defective Beans. J. Food Sci. 2007, 72, S333–S337. [Google Scholar] [CrossRef] [PubMed]
  3. Murthy, P.S.; Naidu, M.M. Recovery of Phenolic Antioxidants and Functional Compounds from Coffee Industry By-Products. Food Bioprocess Technol. 2012, 5, 897–903. [Google Scholar] [CrossRef]
  4. Padmapriya, R.; Tharian, J.A.; Thirunalasundari, T. Coffee waste management-An overview. Int. J. Curr. Sci. 2013, 9, 83–91. [Google Scholar]
  5. Wintgens, J.N. The Coffee Plant. Coffee: Growing, Processing, Sustainable Production: A Guidebook for Growers, Processors, Traders, and Researchers; Wiley-Vch: Weinheim, Germany, 2009; pp. 1–24. [Google Scholar]
  6. Lashermes, P.; Andrade, A.C.; Etienne, H. Genomics of Coffee One of the World’s Largest Traded Commodities, in Genomics of Tropical Crop Plants; Moore, P.H., Ming, R., Eds.; Springer: New York, NY, USA, 2008; pp. 203–226. [Google Scholar]
  7. Tran, T.M.K.; Akanbi, T.; Kirkman, T.; Nguyen, M.H.; Van Vuong, Q. Optimal Aqueous Extraction Conditions as A Green Technique for Recovery of Phenolic Antioxidants from Robusta Dried Coffee Pulp. Eur. J. Eng. Res. Sci. 2020, 5, 1069–1074. [Google Scholar] [CrossRef]
  8. Tran, T.M.K.; Kirkman, T.; Nguyen, M.; Van Vuong, Q. Effects of drying on physical properties, phenolic compounds and antioxidant capacity of Robusta wet coffee pulp (Coffea canephora). Heliyon 2020, 6, e04498. [Google Scholar] [CrossRef]
  9. Murthy, P.S.; Naidu, M.M. Sustainable management of coffee industry by-products and value addition—A review. Resour. Conserv. Recycl. 2012, 66, 45–58. [Google Scholar] [CrossRef]
  10. Rojas, J.U.; Verreth, J.; Amato, S.; Huisman, E. Biological treatments affect the chemical composition of coffee pulp. Bioresour. Technol. 2003, 89, 267–274. [Google Scholar] [CrossRef]
  11. Murthy, P.S.; Manjunatha, M.R.; Sulochannama, G.; Naidu, M.M. Extraction, characterization and bioactivity of coffee anthocyanins. Eur. J. Biol. Sci. 2012, 4, 13–19. [Google Scholar]
  12. Ramirez-Coronel, M.A.; Marnet, N.; Kolli, V.K.; Roussos, S.; Guyot, S.; Augur, C. Characterization and Estimation of Proanthocyanidins and Other Phenolics in Coffee Pulp (Coffea arabica) by Thiolysis−High-Performance Liquid Chromatography. J. Agric. Food Chem. 2004, 52, 1344–1349. [Google Scholar] [CrossRef]
  13. Belay, A.; Gholap, A. Characterization and determination of chlorogenic acids (CGA) in coffee beans by UV-Vis spectroscopy. Afr. J. Pure Appl. Chem. 2009, 3, 34–240. [Google Scholar]
  14. Tran, T.M.K.; Akanbi, T.; Kirkman, T.; Nguyen, M.H.; Van Vuong, Q. Maximising Recovery of Bioactive Compounds from Coffee Pulp Waste Using Microwave-assisted Extraction. Eur. J. Eng. Technol. Res. 2022, 7, 1–6. [Google Scholar] [CrossRef]
  15. Ameer, K.; Shahbaz, H.M.; Kwon, J.-H. Green Extraction Methods for Polyphenols from Plant Matrices and Their Byproducts: A Review. Compr. Rev. Food Sci. Food Saf. 2017, 16, 295–315. [Google Scholar] [CrossRef] [PubMed] [Green Version]
  16. Vilkhu, K.; Mawson, R.; Simons, L.; Bates, D. Applications and opportunities for ultrasound assisted extraction in the food industry—A review. Innov. Food Sci. Emerg. Technol. 2008, 9, 161–169. [Google Scholar] [CrossRef]
  17. Eskilsson, C.S.; Björklund, E. Analytical-scale microwave-assisted extraction. J. Chromatogr. A 2000, 902, 227–250. [Google Scholar] [CrossRef]
  18. Liao, J.; Zheng, N.; Qu, B. An Improved Ultrasonic-Assisted Extraction Method by Optimizing the Ultrasonic Frequency for Enhancing the Extraction Efficiency of Lycopene from Tomatoes. Food Anal. Methods 2016, 9, 2288–2298. [Google Scholar] [CrossRef]
  19. Spigno, G.; De Faveri, D.M. Microwave-assisted extraction of tea phenols: A phenomenological study. J. Food Eng. 2009, 93, 210–217. [Google Scholar] [CrossRef]
  20. Kaufmann, B.; Christen, P. Recent extraction techniques for natural products: Microwave-assisted extraction and pressurised solvent extraction. Phytochem. Anal. Int. J. Plant Chem. Biochem. Tech. 2002, 13, 105–113. [Google Scholar] [CrossRef]
  21. Chemat, F.; Rombaut, N.; Sicaire, A.-G.; Meullemiestre, A.; Fabiano-Tixier, A.-S.; Abert-Vian, M. Ultrasound assisted extraction of food and natural products. Mechanisms, techniques, combinations, protocols and applications. A review. Ultrason. Sonochem. 2017, 34, 540–560. [Google Scholar] [CrossRef]
  22. Chan, C.-H.; Yusoff, R.; Ngoh, G.-C.; Kung, F.W.-L. Microwave-assisted extractions of active ingredients from plants. J. Chromatogr. A 2011, 1218, 6213–6225. [Google Scholar] [CrossRef]
  23. Vuong, Q.; Hirun, S.; Roach, P.; Bowyer, M.C.; Phillips, P.; Scarlett, C.J. Effect of extraction conditions on total phenolic compounds and antioxidant activities of Carica papaya leaf aqueous extracts. J. Herb. Med. 2013, 3, 104–111. [Google Scholar] [CrossRef]
  24. Thaipong, K.; Boonprakob, U.; Crosby, K.; Cisneros-Zevallos, L.; Hawkins Byrne, D. Comparison of ABTS, DPPH, FRAP, and ORAC assays for estimating antioxidant activity from guava fruit extracts. J. Food Compos. Anal. 2006, 19, 669–675. [Google Scholar] [CrossRef]
  25. Benzie, I.F.F.; Strain, J.J. The ferric reducing ability of plasma (FRAP) as a measure of “antioxidant power”: The FRAP assay. Anal. Biochem. 1996, 239, 70–76. [Google Scholar] [CrossRef] [PubMed] [Green Version]
  26. Vu, H.T.; Scarlett, C.J.; Vuong, Q.V. Optimization of ultrasound-assisted extraction conditions for recovery of phenolic compounds and antioxidant capacity from banana (Musa cavendish) peel. J. Food Process. Preserv. 2016, 41, e13148. [Google Scholar] [CrossRef]
  27. Picó, Y. Ultrasound-assisted extraction for food and environmental samples. TrAC Trends Anal. Chem. 2013, 43, 84–99. [Google Scholar] [CrossRef]
  28. Rostagno, M.; Palma, M.; Barroso, C.G. Ultrasound-assisted extraction of soy isoflavones. J. Chromatogr. A 2003, 1012, 119–128. [Google Scholar] [CrossRef]
  29. Medina-Torres, N.; Ayora-Talavera, T.; Espinosa-Andrews, H.; Sánchez-Contreras, A.; Pacheco, N. Ultrasound Assisted Extraction for the Recovery of Phenolic Compounds from Vegetable Sources. Agronomy 2017, 7, 47. [Google Scholar] [CrossRef]
  30. Wang, J.; Sun, B.; Cao, Y.; Tian, Y.; Li, X. Optimisation of ultrasound-assisted extraction of phenolic compounds from wheat bran. Food Chem. 2008, 106, 804–810. [Google Scholar] [CrossRef]
  31. Esclapez, M.D.; Garcia-Perez, J.V.; Mulet, A.; Carcel, J.A. Ultrasound-Assisted Extraction of Natural Products. Food Eng. Rev. 2011, 3, 108–120. [Google Scholar] [CrossRef]
  32. Chen, L.; Yang, M.; Mou, H.; Kong, Q. Ultrasound-assisted extraction and characterization of anthocyanins from purple corn bran. J. Food Process. Preserv. 2017, 42, e13377. [Google Scholar] [CrossRef] [Green Version]
  33. Dailey, A.; Vuong, Q.V. Optimisation of Ultrasonic Conditions as an Advanced Extraction Technique for Recovery of Phenolic Compounds and Antioxidant Activity from Macadamia (Macadamia tetraphylla) Skin Waste. Technologies 2015, 3, 302–320. [Google Scholar] [CrossRef] [Green Version]
  34. Dailey, A.; Vuong, Q.V. Optimum Conditions for Microwave Assisted Extraction for Recovery of Phenolic Compounds and Antioxidant Capacity from Macadamia (Macadamia tetraphylla) Skin Waste Using Water. Processes 2015, 4, 2. [Google Scholar] [CrossRef] [Green Version]
  35. Saifullah, M.; McCullum, R.; Vuong, Q. Maximising extraction yields of gallic acid and hesperetin from lemon myrtle (Backhousia citriodora) leaf using microwave assisted extraction. Results Chem. 2020, 2, 100080. [Google Scholar] [CrossRef]
  36. Rincón, E.; Balu, A.M.; Luque, R.; Serrano, L. Mechanochemical extraction of antioxidant phenolic compounds from Mediterranean and medicinal Laurus nobilis: A comparative study with other traditional and green novel techniques. Ind. Crop. Prod. 2019, 141, 111805. [Google Scholar] [CrossRef]
  37. Ma, Y.-Q.; Chen, J.-C.; Liu, D.-H.; Ye, X.-Q. Simultaneous extraction of phenolic compounds of citrus peel extracts: Effect of ultrasound. Ultrason. Sonochemistry 2009, 16, 57–62. [Google Scholar] [CrossRef]
  38. Fiorini, D.; Scortichini, S.; Bonacucina, G.; Greco, N.G.; Mazzara, E.; Petrelli, R.; Torresi, J.; Maggi, F.; Cespi, M. Cannabidiol-enriched hemp essential oil obtained by an optimized microwave-assisted extraction using a central composite design. Ind. Crop. Prod. 2020, 154, 112688. [Google Scholar] [CrossRef]
  39. Routray, W.; Orsat, V. MAE of phenolic compounds from blueberry leaves and comparison with other extraction methods. Ind. Crop. Prod. 2014, 58, 36–45. [Google Scholar] [CrossRef]
Figure 1. Comparison of MAE and UAE for recovery yields of bioactive compounds (A) and antioxidant capacity (B). Data are means ± standard deviations (n = 3). Columns for each group not sharing similar letters are significantly different at p < 0.05.
Processes 10 01011 g001
Table 1. Effect of ultrasonic time on recovery of bioactive compounds and antioxidant from coffee pulp.
Time
(min)
TPC
(mg GAE/g DW)
TFC
(mg CE/g DW)
CGA
(mg/g DW)
Caffeine
(mg/g DW)
ABTS
(mg TE/g DW)
DPPH
(mg TE/g DW)
FRAP
(mg TE/g DW)
56.26 ± 0.35 c4.53 ± 0.25 c1.31 ± 0.10 b1.87 ± 0.09 a13.35 ± 0.76 a1.33 ± 0.08 c9.50 ±0.90 a
158.70 ± 0.34 b6.47 ± 0.16 b1.70 ± 0.15 ab2.25 ± 0.035 b14.89 ± 0.41 b1.74 ± 0.06 b9.69 ± 0.99 a
259.14 ± 0.82 ab6.54 ± 0.93 b1.72 ± 0.49 ab2.31 ± 0.10 b15.19 ± 0.49 b1.78 ± 0.21 ab9.73 ± 0.36 a
359.72 ± 0.15 ab6.91 ± 0.20 ab1.67 ± 0.11 ab2.47 ± 0.21 b15.21 ± 0.28 b1.87 ± 0.07 ab10.28 ± 0.89 a
459.74 ± 0.19 ab7.25 ± 0.36 ab1.77 ± 0.33 a2.53 ± 0.18 b15.64 ± 0.02 b1.84 ± 0.04 ab10.33 ± 0.52 a
559.88 ± 0.15 a8.09 ± 0.76 a1.78 ± 0.12 a2.54 ± 0.11 b15.69 ± 0.09 b2.04 ± 0.12 a10.17 ± 0.25 a
659.44 ± 0.38 ab7.59 ± 0.40 ab1.73 ± 0.06 ab2.42 ± 0.08 b15.48 ± 0.40 b1.9 ± 0.07 ab9.75 ± 0.21 a
TPC: total phenolic content, TFC: total flavonoid content. ABTS radical scavenging capacity; DPPH radical scavenging capacity; FRAP: ferric reducing antioxidant power. Data are expressed as means ± standard deviations (n = 3). Means with different superscript letters in the same column differ significantly at p < 0.05.
Table 2. Effect of temperature on recovery of bioactive compounds and antioxidant from coffee pulp.
Temp (°C)TPC
(mg GAE/g DW)
TFC
(mg CE/g DW)
CGA
(mg/g DW)
Caffeine
(mg/g DW)
ABTS
(mg TE/g DW)
DPPH
(mg TE/g DW)
FRAP
(mg TE/g DW)
308.71 ± 0.93 a7.75 ± 0.25 a2.15 ± 0.32 a2.94 ± 0.18 a28.04 ± 0.85 a2.78 ± 0.02 a15.18 ± 0.95 a
4010.48 ± 0.94 a9.35 ± 0.51 a2.24 ± 0.52 a2.99 ± 0.07 a31.09 ± 1.88 a3.24 ± 0.03 a18.72 ± 0.33 b
5014.58 ± 1.32 b11.29 ± 1.03 b2.54 ± 0.36 a3.20 ± 0.25 a40.57 ± 3.19 b4.33 ± 0.34 b20.76 ± 1.31 bc
6015.14 ± 0.23 b13.15 ± 0.51 c2.65 ± 0.06 a2.89 ± 0.19 a45.78 ± 1.36 b4.68 ± 0.26 b22.32 ± 0.63 c
TPC: total phenolic content, TFC: total flavonoid content. ABTS radical scavenging capacity; DPPH radical scavenging capacity; FRAP: ferric reducing antioxidant power. Data are expressed as means ± standard deviations (n = 3). Means with different superscript letters in the same column differ significantly at p < 0.05.
Table 3. Effect of ultrasonic power on recovery of bioactive compounds and antioxidant from coffee pulp.
Power of Machine (W)TPC
(mg GAE/g DW)
TFC
(mg CE/g DW)
CGA
(mg/g DW)
Caffeine
(mg/g DW)
ABTS
(mg TE/g DW)
DPPH
(mg TE/g DW)
FRAP
(mg TE/g DW)
15014.81 ± 0.19 a11.60 ± 0.41 a2.64 ± 0.41 a2.72 ± 0.23 a41.92 ± 0.68 a4.10 ± 0.07 a24.12 ± 0.61 a
20015.68 ± 0.85 a12.32 ± 0.35 a2.39 ± 0.29 a2.73 ± 0.17 a45.84 ± 0.64 b4.88 ± 0.10 b25.97 ± 0.47 a
25020.86 ± 0.58 b18.77 ± 1.07 b2.31 ± 0.13 a3.32 ± 0.26 b57.65 ± 1.16 c5.20 ± 0.14 c35.85 ± 1.80 b
TPC: total phenolic content, TFC: total flavonoid content. ABTS radical scavenging capacity; DPPH radical scavenging capacity; FRAP: ferric reducing antioxidant power. Data are expressed as means ± standard deviations (n = 3). Means with different superscript letters in the same column differ significantly at p < 0.05.
Table 4. Effect of radiation time on recovery of bioactive compounds and antioxidant from coffee pulp.
Time
(min)
TPC
(mg GAE/g DW)
TFC
(mg CE/g DW)
CGA
(mg/g DW)
Caffeine
(mg/g DW)
ABTS
(mg TE/g DW)
DPPH
(mg TE/g DW)
FRAP
(mg TE/g DW)
1025.48 ± 0.99 d19.11 ± 0.83 d5.66 ± 0.08 d4.52 ± 0.07 a59.53 ± 2.49 g6.16 ± 0.50 b36.96 ± 1.85 d
2027.53 ± 1.26 cd20.84 ± 1.69 cd5.96 ± 0.18 cd3.18 ± 2.75 a63.18 ± 2.97 f6.40 ± 0.54 b39.58 ± 1.05 cd
3029.03 ± 0.68 c22.07 ± 0.43 c5.49 ± 0.26 d4.71 ± 0.49 a65.17 ± 2.38 e6.85 ± 0.28 b43.49 ± 0.18 bc
4030.17 ± 0.46 c23.17 ± 0.61 c6.59 ± 0.40 bc4.84 ± 0.42 a68.47 ± 1.7 d7.01 ± 0.36 b46.65 ± 0.20 b
5038.73 ± 0.59 b32.81 ± 0.75 ab7.33 ± 0.23 ab5.70 ± 0.33 a78.11 ± 0.47 c9.44 ± 0.29 a63.44 ± 0.85 a
6039.13 ± 0.16 b34.30 ± 0.39 a7.57 ± 0.32 a5.77 ± 0.33 a79.07 ± 0.52 b9.83 ± 0.23 a65.12 ± 0.33 a
7043.38 ± 0.85 a33.86 ± 0.83 ab7.33 ± 0.27 ab5.45 ± 0.22 a82.34 ± 1.1 a10.56 ± 0.21 a65.55 ± 0.69 a
8040.90 ± 1.67 ab31.52 ± 1.42 b6.92 ± 0.57 ab5.38 ± 0.13 a80.43 ± 0.36 ab9.70 ± 0.73 a60.91 ± 1.15 a
TPC: total phenolic content, TFC: total flavonoid content. ABTS radical scavenging capacity; DPPH radical scavenging capacity; FRAP: ferric reducing antioxidant power. Data are expressed as means ± standard deviations (n = 3). Means with different superscript letters in the same column differ significantly at p < 0.05.
Table 5. Effect of radiation power on recovery of bioactive compounds and antioxidant from coffee pulp.
Power of Machine
(W)
TPC
(mg GAE/g DW)
TFC
(mg CE/g DW
CGA
(mg/g DW)
Caffeine
(mg/g DW)
ABTS
(mg TE/g DW)
FRAP
(mg TE/g DW)
DPPH
(mg TE/g DW)
30044.15 ± 0.06 ab34.50 ± 1.25 a7.62 ± 0.59 a5.76 ± 0.19 a105.48 ± 1.54 b83.61 ± 0.83 a10.37 ± 0.16 ab
40045.49 ± 1.35 ab35.82 ± 1.96 a7.58 ± 0.88 a5.36 ± 0.59 a116.08 ± 2.32 a84.65 ± 1.73 a10.54 ± 0.29 ab
50045.02 ± 0.82 ab35.49 ± 0.97 a7.33 ± 0.27 a5.45 ± 0.22 a107.56 ± 1.50 b84.13 ± 2.46 a10.65 ± 0.29 ab
60045.61 ± 1.67 ab36.79 ± 1.42 a8.12 ± 0.49 a5.88 ± 0.12 a109.27 ± 2.68 ab84.63 ± 1.05 a11.02 ± 0.46 a
70046.72 ± 1.86 a36.44 ± 1.54 a7.87 ± 0.54 a5.74 ± 0.29 a109.55 ± 0.64 ab84.73 ± 0.88 a11.02 ± 0.21 a
80043.03 ± 1.14 b36.00 ± 1.02 a8.09 ± 0.35 a5.39 ± 0.69 a86.73 ± 4.22 c72.37 ± 0.33 b9.81 ± 0.09 b
90042.79 ± 1.27 b34.42 ± 1.85 a7.29 ± 1.40 a5.29 ± 1.44 a84.81 ± 2.57 c71.26 ± 3.10 b10.00 ± 0.52 b
TPC: total phenolic content, TFC: total flavonoid content. ABTS radical scavenging capacity; DPPH radical scavenging capacity; FRAP: ferric reducing antioxidant power. Data are expressed as means ± standard deviations (n = 3). Means with different superscript letters in the same column differ significantly at p < 0.05.
Publisher’s Note: MDPI stays neutral with regard to jurisdictional claims in published maps and institutional affiliations.

