Article

Managing Supply Chain Complexity and Sustainability: The Case of the Food Industry

by
Valentas Gružauskas
and
Aurelija Burinskienė
*
The Faculty of Business Management, Vilnius Gediminas Technical University, LT-01119 Vilnius, Lithuania
*
Author to whom correspondence should be addressed.
Processes 2022, 10(5), 852; https://doi.org/10.3390/pr10050852
Submission received: 22 February 2022 / Revised: 13 April 2022 / Accepted: 20 April 2022 / Published: 26 April 2022
(This article belongs to the Section Manufacturing Processes and Systems)

Abstract

:
Consumer demand for organic products, rapidly growing urbanizations levels requires the food supply chain to reduce lead-time and maintain higher product quality. For the food supply chain to cope with the raising issues an e-commerce type of supply chain must be implemented. This approach creates challenges for supply chain, because the food industry must shift towards high variety and low quantity freight forwarding with multiple delivery points. The methodology of the paper consists of scientific literature analysis and macro indicator clustering. The author of the paper proposes a supply chain management framework, which is grounded through complexity theory. The framework mainly consists of 3 characteristics, which organizations should operationalize to maintain system resilience and which in the long-run would evolve to sustainable development–capabilities, collaboration, complexity management. The proposed framework defines how operational and tactical levels should be automated through cyber-physical systems, while the automation should be controlled through strategic level variables. The macro level analysis of existing EU markets of the food industry has been conducted to identify the food industry’s contingencies, in which an agent-based model will be used to validate the proposed framework. Main 3 clusters were identified, which number was chosen based on the elbow method and validated with the silhouette score of 0.749. The food industry can be categorized in to developing, underdeveloped, and developed food industries. Moreover, singularities of different contingencies have been identified which considers population size, population density, market size of the food industry and disruption intensity. The application of the framework depends on the identified contingencies. From strategic level the SCMF is similar in all contingencies, however, depending on the type of market, more emphasize on vehicle routing or demand forecasting should be made.

1. Introduction

The growing world population and increasing urbanization levels are causing disruptions in the current competitiveness landscape. One of the key industries challenged by these changes is the food industry. From one side, the demand for food products will increase dramatically, because the world’s population is expected to grow to almost 10 billion by 2050 [1]. From another side, the current food supply chain is ineffective generating a lot of food waste. “Food losses and waste cost the global economy around USD 990 billion annually” [2]. To cope with these challenges a change of the current supply chain is essential. “Vertically coordinated, more organized food systems offer standardized food for urban areas and formal employment opportunities. But they need to be accompanied by responsible investments and concern for smallholder livelihoods, the environmental footprint of lengthening food supply chains, and impacts on biodiversity” [1]. From supply chain infrastructure perspective these changes should consist of more local distribution facilities and local farmer initiatives [3]. The reduction of the length of the supply chain would decrease the food wastage, however key issues related to system resilience and collaboration must be considered before redesigning the supply chain.
Supply chain management is drastically changing, in the past the supply chain tented to deliver high quantity products through a long supply chain. However, today due to the trend for e-commerce the supply chain length has reduced dramatically [4]. Moreover, there is a tendency to distribute low quantity products with high variety. The changing shift of supply chain would not be challenge in a stable environment, however demand fluctuation, growing world population, traffic jams and other issues are causing disruptions [5]. These disruptions cause instability in supply chain processes, which decreases the sustainability of companies by disrupting efficient product distribution. Therefore, the concept of supply chain resilience in recent years gained more attention. However, supply chain resilience must be further researched as most of the published work explores the conceptualization of only a limited number of resilience elements, lacking the development of integrated holistic approaches [6]. Traditional supply chain management approaches are not useful to cope with these issues, because they tend to decrease complexity and are oriented to a precise process [7]. This scientific approach is called reductionism, which focuses on reducing the system into elements and analysis them separately. The traditional research methods also focus from a top-down perspective, which cannot fully explain the relationship between supply chain elements. Ribeiro and Povoa indicated that supply chain resilience has to be addressed as a set of elements that interact with each other and result in the scenario of disruption or a disturbance to a scenario of normal operation [6]. Therefore, there is a need to adapt complexity theory to supply chain management to improve resilience of the supply chain. However, there are only limited supply chain strategies at the different supply chain decision levels [6]. One of the key strategies applied in this case can be called collaboration, which ensures appropriate information sharing levels between the supply chain members. To manage, the complexity of the supply chain high transparency must be maintained, which can be enabled with collaboration. However, only information sharing is not enough, technological approaches must be implemented which helps to manage all the complexity and increased flow of information, thus the authors proposes a management framework.
The purpose of this study is to propose a supply chain management framework (SCMF), which describes how tactical and operational levels should be computerized while controlling them through strategic level variables. The computerization of the operational and tactical levels should be done through cyber-physical systems, which has been analysed in previous publications [8]. The proposed SCMF provides sustainable development practices, which focuses on reducing food waste by controlling the complexity of the supply chain and reducing disruption influence. To provide theoretical contribution and practical implementation possibilities a complex adaptive system (CAS) perspective will be adapted for supply chain management. Palmberg indicated that a CAS cannot be controlled, as is assumed in the approach of the traditional management of hierarchical organizations, however a CAS can be managed [9]. The adaptation of CAS theory for SCMF explained how the framework helps the supply chain to become adaptive to the changing environment, and how it helps maintain higher resilience levels. Traditional SCM theories tries to isolate the SCM processes, while CAS explains how these processes can be more integrated and dynamically adaptive to the changing environment. The proposed SCMF should be implemented depending on contingencies of the market, therefore a macro level analysis of the food industry has been conducted. For the analysis macro indexes of the EU has been chosen such as agriculture indexes, food processing indexes and population statistics. The indexes were interpolated and estimated to align the periods, after words they were clustered to three groups. The groups define different level of development in the countries based on the food industry. The macro level analysis provides insights of SCMF implementation based on the market behaviour, since the SCMF implementation depends on the contingencies.
The remainder of this paper is structured as follows: in Section 2.1 we propose a supply chain management framework designed for dealing with the issues of the food industry. In Section 2.2 we explain the fundamentals of the proposed SCMF by adapting complexity theory to supply chain management theory. In Section 3, we identify the contingencies of the food industry and conduct a macro level analysis in order to identify the contingencies in which an agent-based model will be developed. The purpose of these contingencies is to address contingency-resource based view, which amplifies the necessity to change organizations strategies based on contingencies [10]. And finally, we provide conclusions and discussion points.

2. Literature Analysis

2.1. Supply Chain Strategies for Sustainable Development

Changing consumer trends such as growing demand for e-grocery, and demand for organic food products, drives the supply chain to become more complex and sensitive to disruptions, because of the necessity to decrease lead-time and maintain high product quality. To cope with these issues key capabilities and their integration with cyber-physical systems must be identified.
Before the business environment was more stable and the companies tended to deliver high quantity products to only a few retailers. However, today there is a tendency to deliver high variety of products to multiple consumers directly to their doorsteps. The world population is growing rapidly with a large part of them living in urban regions, therefore the density of the population is causing even more ineffectiveness in distribution processes. In recent years, multiple researchers started to focus on resilience, which is necessary for organizations to achieve and maintain competitiveness. Supply chain resilience can be defined as “the adaptive capability of a supply chain to reduce the probability of facing sudden disturbances, resist the spread of disturbances by maintaining control over structures and functions, and recover and respond by immediate and effective reactive plans to transcend the disturbance and restore the supply chain to a robust state of operations” [11]. Which can be achieved through supply chain strategies. Supply chain strategy has 3 levels strategic, tactical and operational. Strategic level defines how the supply chain is designed, the supplier relationship and other aspects, which decisions a causing long term influence. Tactical level is medium length tasks such as order management, product assortment, prices decisions and so on. The operational level is daily operations, which mainly focuses on warehousing and delivery processes. There are main three categories of supply chain strategies: proactive, reactive and anticipation/awareness [6]. Proactive strategies are those which focuses on minimizing the negative effect after disruptions had occurred, while reactive strategies focuses on preparing for a disruption ahead of time. Anticipation and awareness is separated as a third strategy due to supply chain abilities to adapt and evolve based on previous experience. Other researchers categorize approaches for resilience as responsiveness and recovery. Responsiveness defines as the ability to have speed and quickly respond to disruptions, while recovery focuses on how to recover after a disruption without losing control of operations [12].
More precise strategies have been defined from the scientific literature analysis. For instance, some researchers amplify that supply chain resilience can be achieved through supply chain design, by developing certain supply chain networks to increase robustness and decrease interaction between supply chain members. “The complexities and uncertainties can be overcome by optimal supply chain configuration in terms integrating the activities of number of tiers of suppliers and customers and the number of partnering firms at each tier” [13]. Other researchers encourage to use innovative technologies such as Internet of Things (IoT). The Usage of IoT can provide visibility to supply chain processes, which is directly related to respond and adapt to the disruptions. “The Internet of Things (IoT) has a major role to play in continuous monitoring of supply chain functions and increase visibility in order to reduce the negative impact of uncertainties” [13]. The delivery information is interactive and sharable between delivery service providers and customers in smart delivery. Delivery would be more controllable, secure, and visualized with IoT. However, smart delivery relying solely on IoT cannot make it faster and optimize delivery resources [14]. IoT-based solutions might solve specific problems such as vehicle routing problems, truck loading problems, and storage assignment problems [14]. However, to gather data is not enough it is essential to analyse it and provide insights for better decision making. Therefore, supply chain analytics functions best when there is real-time data collected through the supply chain operations. However, there still need to be developed key indicators to measure supply chain resilience levels in the supply chain [13]. Other strategy, which requires a trade-off between reactive and proactive strategies are flexibility and redundancy. Supply chain flexibility is defined as the ability of a system or a supply chain to respond to unexpected and unpredictable changes due to uncertain environments to meet a variety of customer needs or requirements, while still maintaining customer satisfaction without adding significant cost [15]. While, supply chain redundancy entails maintaining capacity in the firm to respond to disruption [16]. In other words, flexibility is the ability to have high visibility of supply chain processes and speed to adapt to them. While redundancy is the ability to anticipate upcoming disruptions and be prepared for them. However, to effective use these strategies its necessary to maintain supply chain collaboration for information sharing and information asymmetries [17]. “Collaboration ensures exchange of information between supply chain partners and reduces uncertainties and complexities. Collaboration through appropriate partnership and information sharing in the early stage of the supply chain operations would reduce the uncertainties and complexities” [13]. Research identify that these strategies improve supply chain resilience, however Croxton et al. (2013) empirical evidence revealed that low collaboration, lack of excess capacity and minimal flexibility are the major causes of ineffective supply chain resilience [18]. Arvitrida et al. (2016) indicates that firms’ strategy and behaviour in supply chain collaborations are identified as the main reasons for supply chain failure [19]. These issues are related from two perspectives. From one side the collaborative members lacks information about the benefits of information sharing. Incentive alignment is difficult when companies are forced into contracts without knowing the potential risks and benefits of participating in collaboration [20]. Because of lack of vision, the collaboration members tend to commit to the collaboration less and unequal input of members decreases the efficiency of collaboration. “Although collaboration emphasizes joint efforts and collective benefits, companies do not always share these equally, potentially leading to conflicts. Moreover, companies do not necessarily depend on each other to the same extent, leading to asymmetrical relationships. Because of low benefits and/or high risks, companies may not participate or exit the network” [20]. Therefore, proper commitment levels and knowledge of potential benefits and required investments is leading to higher effectiveness of collaboration and information alignment. From the other side, there is a problem with technology usage in collaboration. “Technically driven approaches tend to neglect that the organizational dimension plays an important role for the application of cyber-physical systems” [21]. Adam et al. (2014) indicated that the effectiveness of collaboration as a supply chain resource has been questioned due to concerns associated with Collaborative Technologies [22]. Even such common technologies as radio frequency identification (RFID) is underestimated. „To date, companies have mostly been using RFID systems to streamline and improve their internal operations, rather than to improve inter-dependent processes involving transaction partners in supply chain networks” [17].
The combination of the strategies is important to manage the complexity and maintain supply chain resilience. “There is a need for a better understanding which conditions are beneficial to combine or generate trade-offs between redundancy and flexibility, and when flexibility should be combined with visibility in the supply chains” [16]. For instance, moving beyond flexibility and redundancy it is important to maintain connectedness and risk sharing among supply chain members as traits that enhance resilience [23]. However, researcher amplify the necessity to make trade-offs while choosing an appropriate strategy. We propose that companies should first analyse their competitive strategies in terms of market competition and develop their different supply chains accordingly without losing sight of the assumed risks. Companies might require a supply chain based on cost reduction versus responsiveness [24].
Figure 1 represented the characteristics of the proposed framework. The main characteristics consist of capabilities, information sharing and collaboration. These characteristics should be operationalized, because the combination of them would eventually emerge to sustainability. Therefore, the integration of strategic, tactical and operational levels is necessary which would help choose the appropriate supply chain strategies for resilience. Moreover, the implementation of innovative technologies such as cyber-physical systems, big data and IoT, would decrease the trade-off between these strategies. “Internet technologies allow supply chains to use virtualizations dynamically in operational management processes. This will improve support for food companies in dealing with perishable products, unpredictable supply variations and stringent food safety and sustainability requirements. Virtualization enables supply chain actors to monitor, control, plan and optimize business processes remotely and in real-time through the Internet, based on virtual objects instead of observation on-site” [25]. The influence of cyber-physical systems, big data and artificial intelligence to supply chain management has been analysed by the authors in previous publications [8,10,26,27]. However, it is important to note that cyber-physical nature of modern food is a key for the engineering of more nutritious and sustainable paths for novel food systems [28]. Lastly, it is necessary to provide clear benefits and necessary commitment to implement such strategies and to promote collaboration, therefore an ABM approach should be used to provide theoretical and practical contribution. Therefore, supply chain organizations should focus on using redundancy and flexibility strategies, which should be integrated with high information sharing between the supply chain members. Lastly, the implementation of cyber-physical systems would the system to utilize the information by itself, which in the long run would cause to evolve and emergence of resilience would appear. These adaptation abilities would allow the supply chain members to maintain sustainability by reducing negative disruption effect. To implement such are framework, organizations should focus on strategic level while tactical and operational levels should be completely automated.
Figure 2 shows the possibility to integrate tactical, operation with strategic levels. Firstly, it is needed to analyse external information, which might influence strategic level decisions. Then it is important to determine the computability of possible supply chain members. Lastly, a formal collaboration such as a logistic cluster should be formed. The strategic level decisions should focus on supply chain design, product assortment and other long-term decisions. While the operational and tactical level should be computerized by adapting cyber-physical systems for daily operation management. However, implementation of the proposed approach requires precise analysis for every situation. It means that it’s not enough to use system thinking, but it must be adapted to the contingent. Therefore, an ABM should be used for more practical implementation of the proposed strategy. It is important to note, that clusters can be understood from economic and mathematical perspective differently. From mathematical perspective clusters mean identification of similarities in the data, while in economic terms it means an official collaboration, such as logistic cluster.
In summary, supply chain capabilities such as redundancy and flexibility integrated with collaboration can increase supply chain resilience, which directly influences sustainability. However, cyber-physical systems must be applied in order to control the complexity of such a logistic cluster. In the long-run if the organizations manages to maintain the proper interaction level of supply chain capabilities, collaboration and cyber-physical systems emergence of sustainability trough resilience is possible.

2.2. Complexity Theory Adaptation for Supply Chain Management

It must be validated that a complexity theory approach must be adapted for the supply chain to cope with the rising complexity, dynamic environment and consumer trends, which requires the food supply chain to decrease lead-time by maintaining high product quality.
Research of economy and business in the beginning tried to find the most efficient equilibrium, which would allow companies to achieve optimal output with minimal input. However, the approaches at that time analysed phenomena by reducing complexity and focusing on precise problems and elements. In a dynamic environment, there is no such thing as equilibrium, because the environment is constantly changing and is non-linier. “Complexity economics sees the economy as in motion, perpetually “computing” itself-perpetually constructing itself anew. Where equilibrium economics emphasizes order, determinacy, deduction, and stasis, complexity economics emphasizes contingency, indeterminacy, sense-making, and openness to change” [29]. The adaptation of complexity science to better understanding the business management is necessary, because organizations constantly is changing and adapting their strategies to the current market demand, there is no longer a stable environment. The explanation of these complex systems are possible only through computer simulations. Davis and Bingham indicated that computer simulations are useful when the phenomena is non-linier, it is difficult to collect the data and its especially useful for new theory development when there is only limited research done [30]. Computation social science is still an emerging field, and the science philosophies are being adapted to it. “This motivates a fascinating research problem in computational social science: the algorithmic collection and representation of composite perspective. Properly representing multiple perspectives, with their differences and similarities, would be both a substantive and logical advance in the logic of the social sciences” [31]. Agent-based modelling is dominant tool exploring the emergent behavior of supply chain network with numerous interactive agents [32]. Moreover, our research contribution is not only theoretical, but also practical aspects. The limitation of our approach is lack of human level influence, the research is more focused on organizations than individuals. However, the results can still be validated and applied for practical use. Several approaches exist to develop theory. Traditional research methods of developing theory are inductive or deductive. Deductive reasoning works from the more general to the more specific and Inductive reasoning works the other way, moving from specific observations to broader generalizations and theories [33]. However, complexity science and more specifically agent-based modelling focuses on a third way of developing theories, which was difficult to implement before. However, now with high performance computing this approach can provide insights into theory development. The third way is called generative science, which describes micro rules of agents and analyses macro output [34]. During the analysis part, huge amount of data is being generated, which can be used to develop theories. The validity of the approach is maintained also, because it uses primary rules for developing social simulations. Therefore, this approach can generate data of complex social systems. Without adaptation of complexity theory understatement of social-technical systems is difficult, therefore, it is needed to adapt system thinking towards business strategy development. “A company in a competitive environment that wishes to be a benchmark in the business world needs a management model that enables the development of systemic thinking on the part of its executives” [35].
Figure 3 describes system thinking towards social systems. Basically, there are two levels of information, the macro level and micro level. The macro level consists of the environment in which the business operates, this information is from external influencers over which the business does not have much influence. The micro level is more related to the business environment and daily operations. Like mentioned before, traditional approaches usually focus on precise aspect and states that other aspects are not changing i.e., Ceteris paribus. However, the Figure 3 describes how everything must be taken into consideration and viewed not as individual elements, but as a system. The complexity of the systems mainly depends on several aspects. The quantity of elements, the diversity of elements and relationships between them. In supply chain management, the elements consist of suppliers, distributors, producers, consumers etc. The quantity of elements depend on the market, while the relationships between them in our paper is defined as daily operations. While the macro and strategic level information will be overview more from theoretical perspective. Without the adaptation of complexity theory, it is impossible to develop supply chain management strategies for a dynamic environment. To better understands how complexity theory fits to supply chain management, key characteristics of complex adaptive systems are identified and adapted to supply chains.
From complexity theory, perspective supply chain can be defined as a complex adaptive system (CAS). There are main 7 characteristics, which describes CAS (see Table 1). Wycisk et al. (2007) indicated that supply chain can be called CAS. The research identified that supply chains are vulnerable to all the nonlinear and extreme dynamics found in CAS within the business world. These possible outcomes have to be considered in supply network management [36]. Cordes and Hulsmann indicated that from CAS perspective supply chains obtains self-healing processes, which is related with robustness for supply chain resilience. They furtherly imply that additional research is needed related to empirical and simulation-based methods [37]. Therefore, to conduct a simulation firstly CAS characteristics in supply chain context must be understood [38,39]. CAS should have a distributed control system, which can be found in supply chain also. Without formal collaboration a supply chain will not have a centralized control unit, however if a formal collaboration is established it will not be able to influence the macro environment. However, like indicated by Palmberg, CAS cannot be controlled, but can be managed. The second characteristic of CAS is related to complex relationships between the agents, like in the supply chains there can be multiple suppliers, production processes, deliveries, policies and other processes which causes requires to make multiple decisions. It is important to emphasize that these complex relationship between the supply chain members produces non-linier results and is similar to chaos, therefore the processes cannot be predicted in detail. However, the most important part of CAS is that the agents in the systems obtains adaptability and can self-organize. It means that simple micro level decisions can product macro level outcome. These simple interactions between supply chain members causes interesting phenome to emerge such as robustness towards resilience. However, it is not enough to simply understand CAS interpretation in supply chain management context. It is important to develop a management mechanism to maintain order and not allow chaos to spread. Without order, chaos could merge, and the supply chain would lose its ability to function. To manage complexity Aelker et al. (2013) identified that its possible reduce complexity, avoid complexity or manage complexity [40,41]. “The key to ensuring a sustainable and resilient supply of the essential ecosystem services on which humanity depends on is by enhancing the resilience of socio-ecological systems, instead of optimizing isolated components of the system” [42]. Therefore, the developed SCMF will focus on managing complexity. In this case, the CAS theory appears in the SCMF by introducing adaptivity to the supply chain members, which causes emergences of resilience in the long run. This is received by increasing information sharing trough collaboration, and adaptive innovative technologies to management the increased complexity of supply chain processes.
In summary, it can be concluded that adaptation of the complexity theory for supply chain management provides a more systematic management approach, because it considers the interconnection between the elements and does not analyse the supply chain elements separately. Secondly, the main characteristics distinguished of the complex-adaptive system theory provide guidelines for organizations which characteristics should be operationalized in order to allow emergence of sustainability in the long-run.

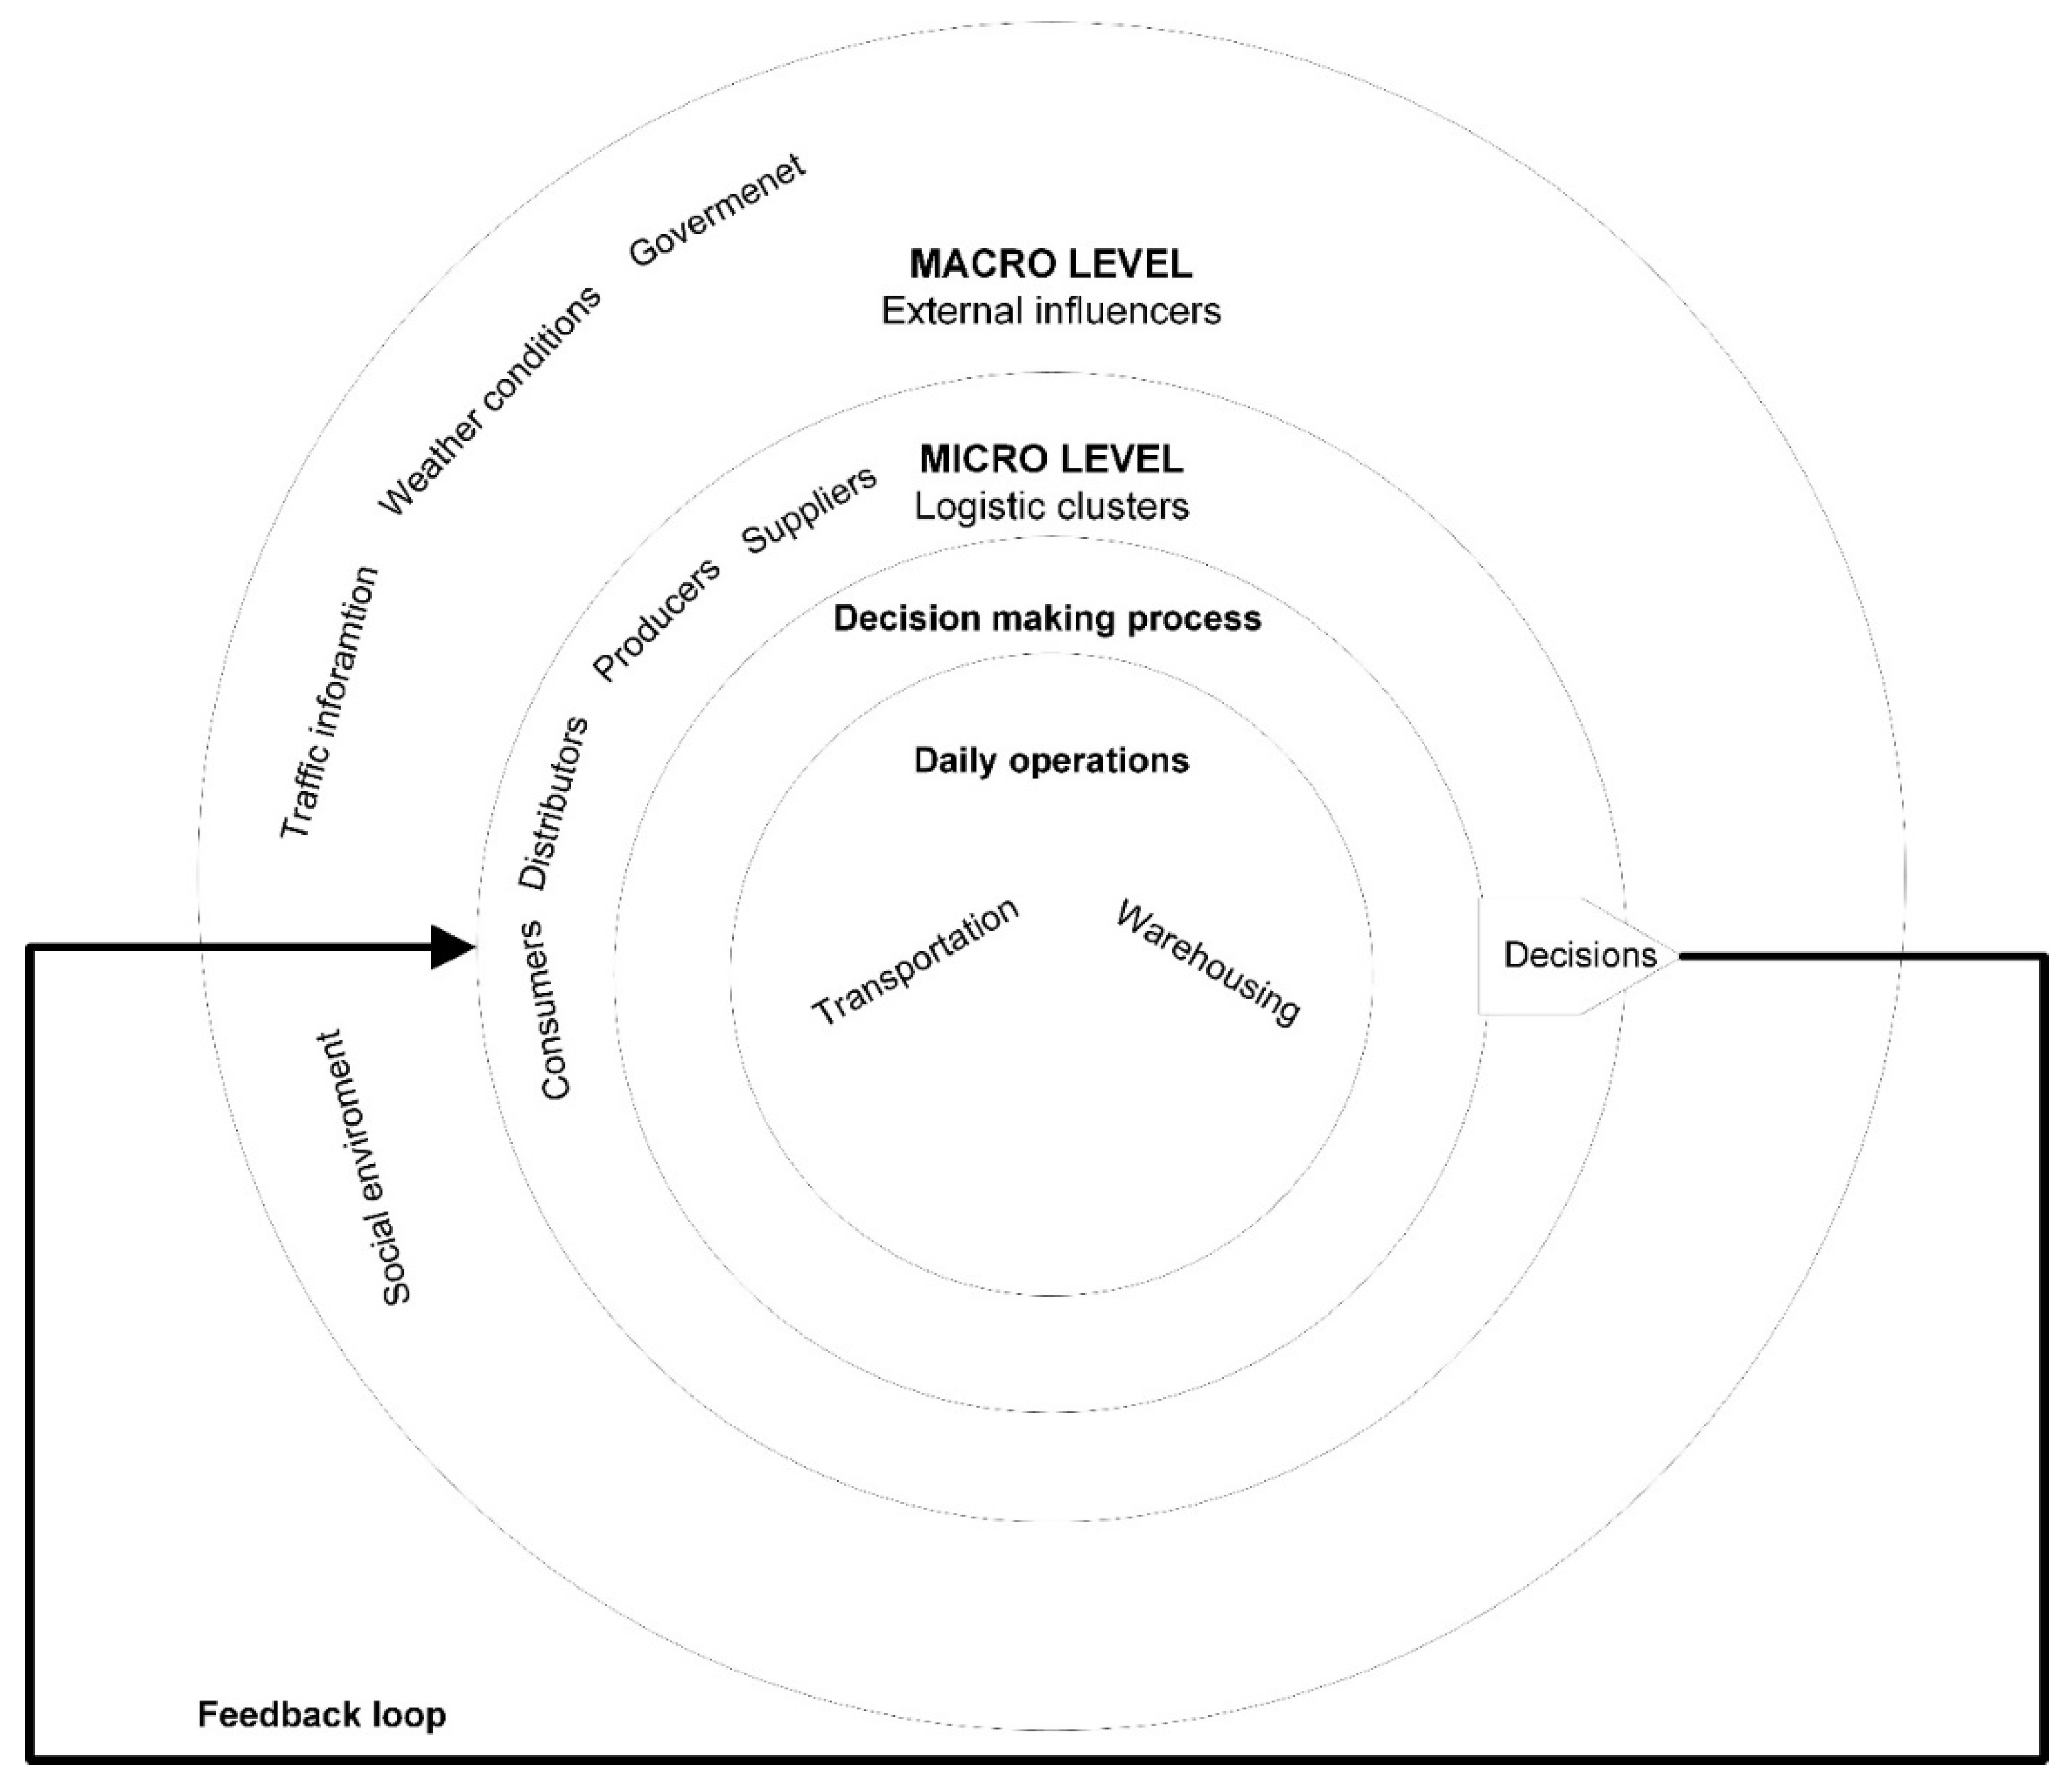
3. Contingencies Determination of the Food Industry

3.1. Contingencies of the Food Industry
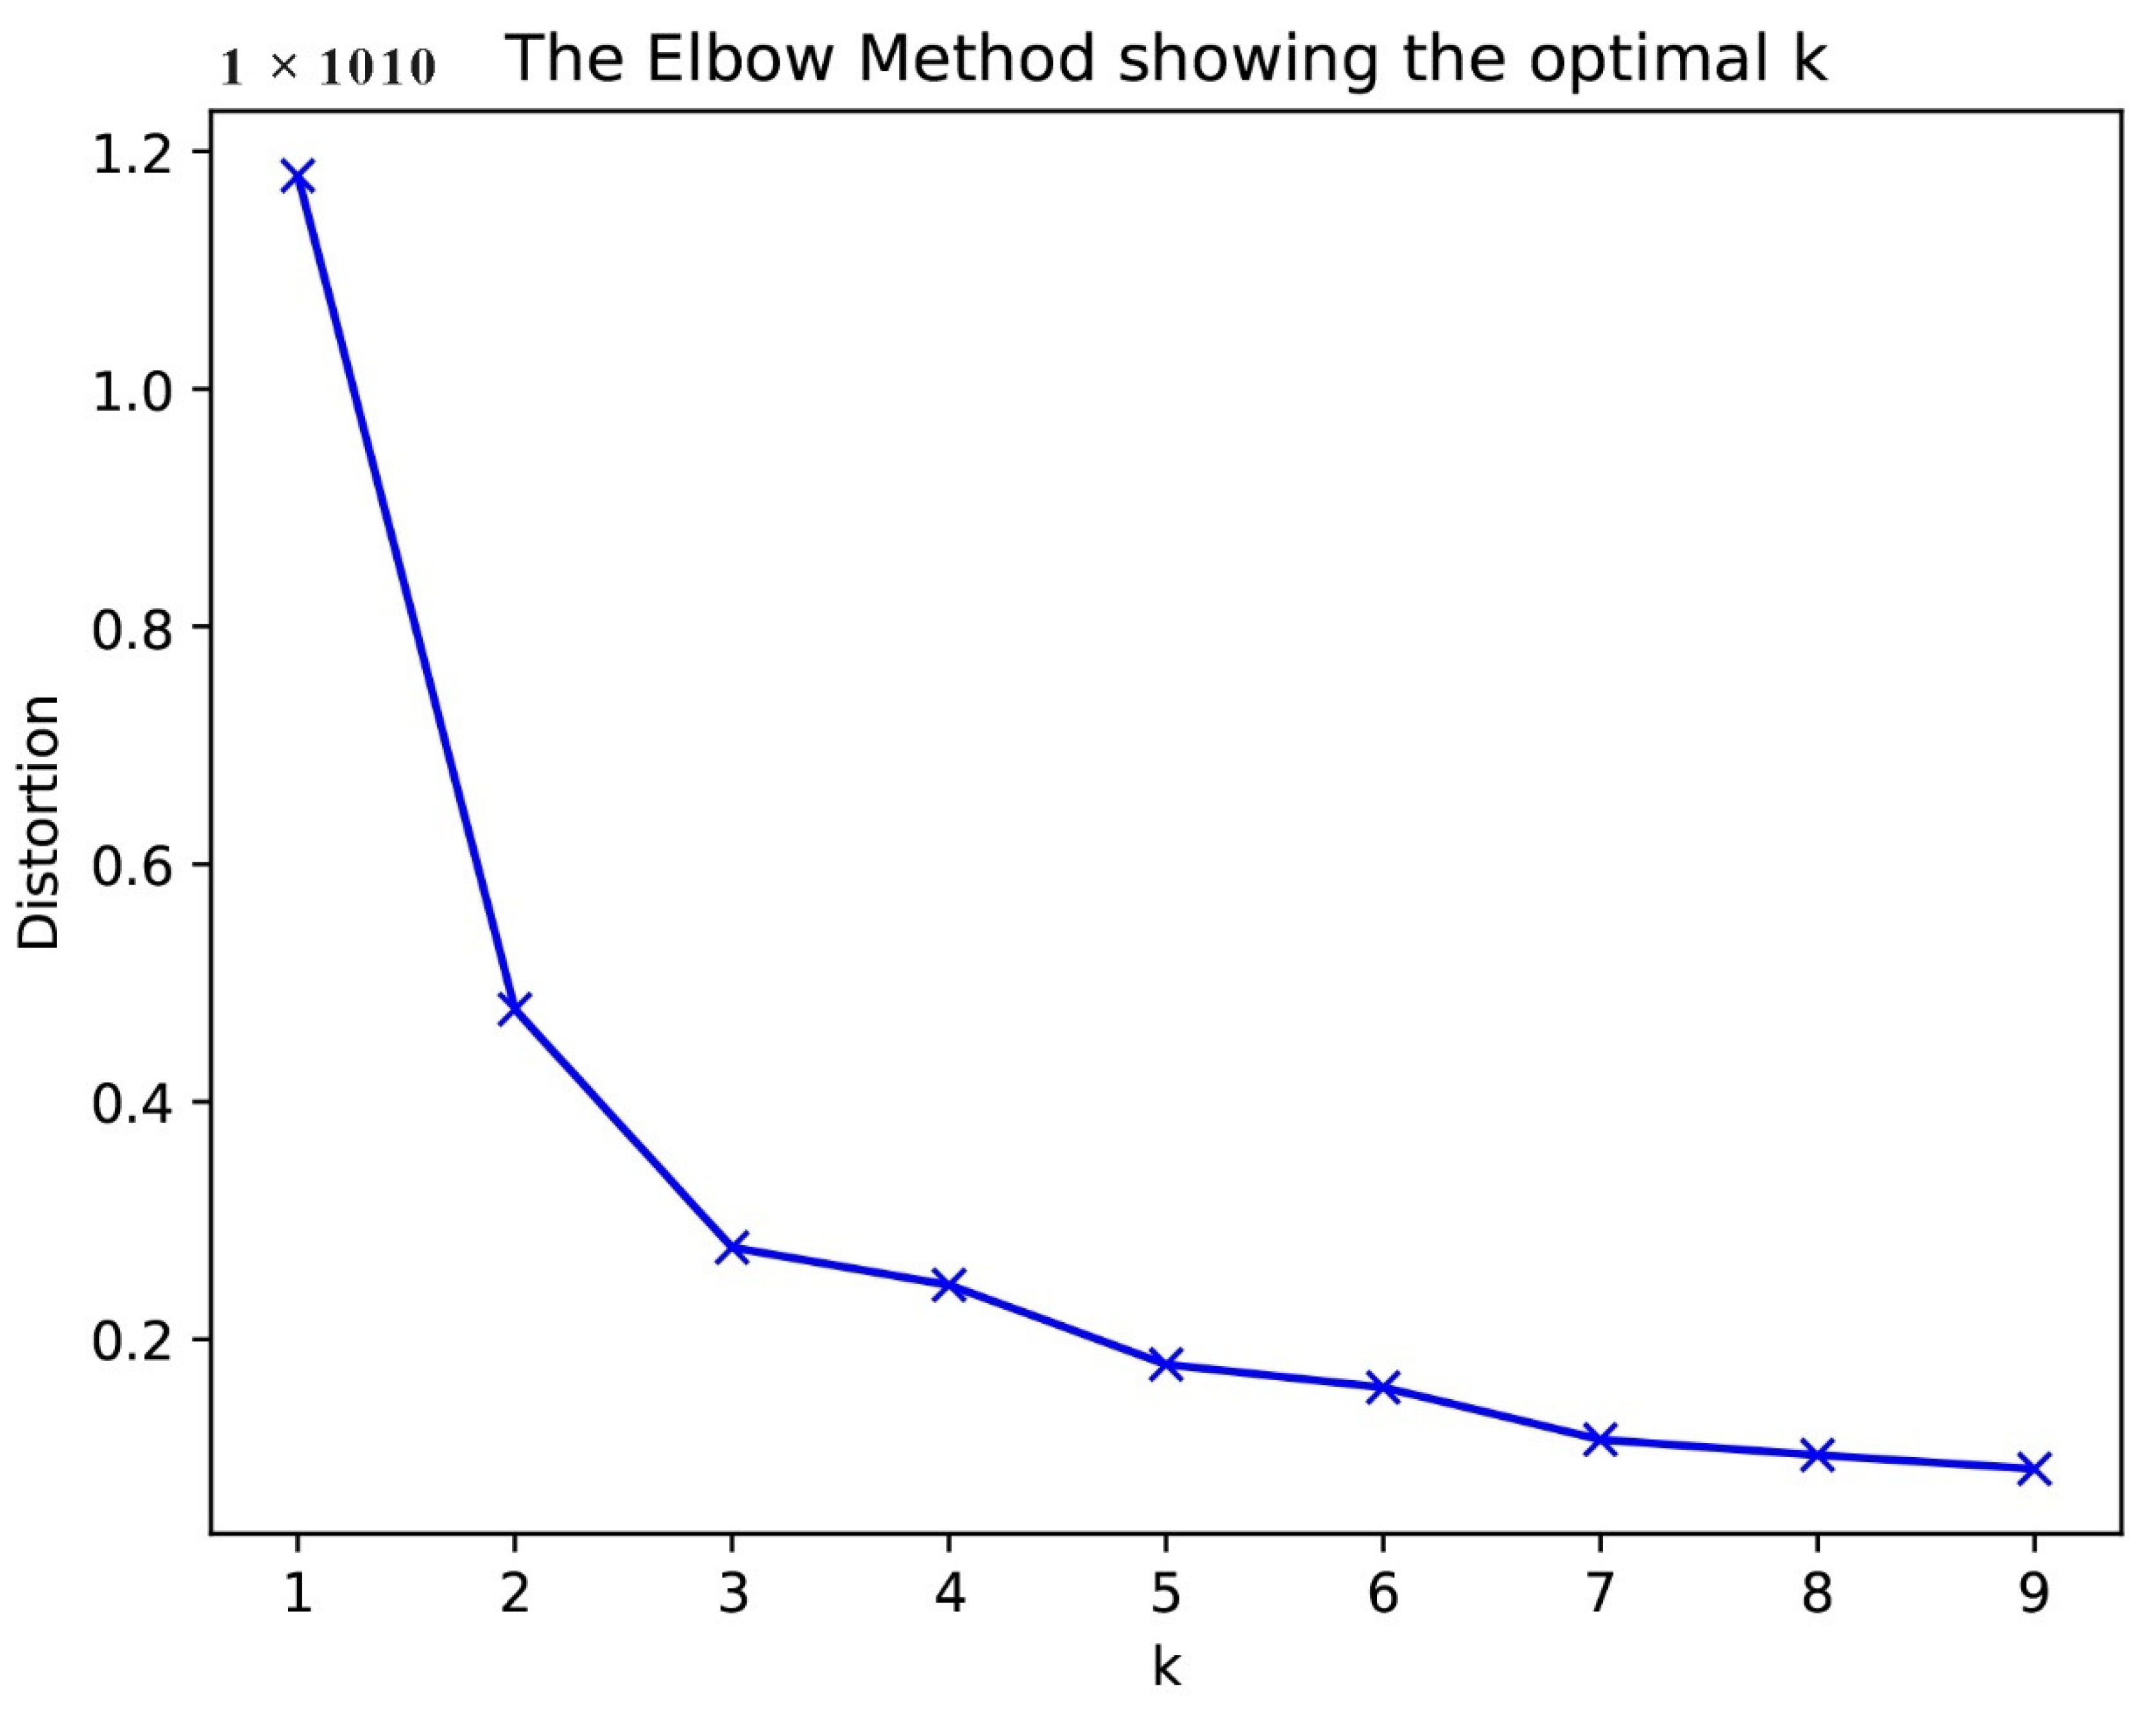
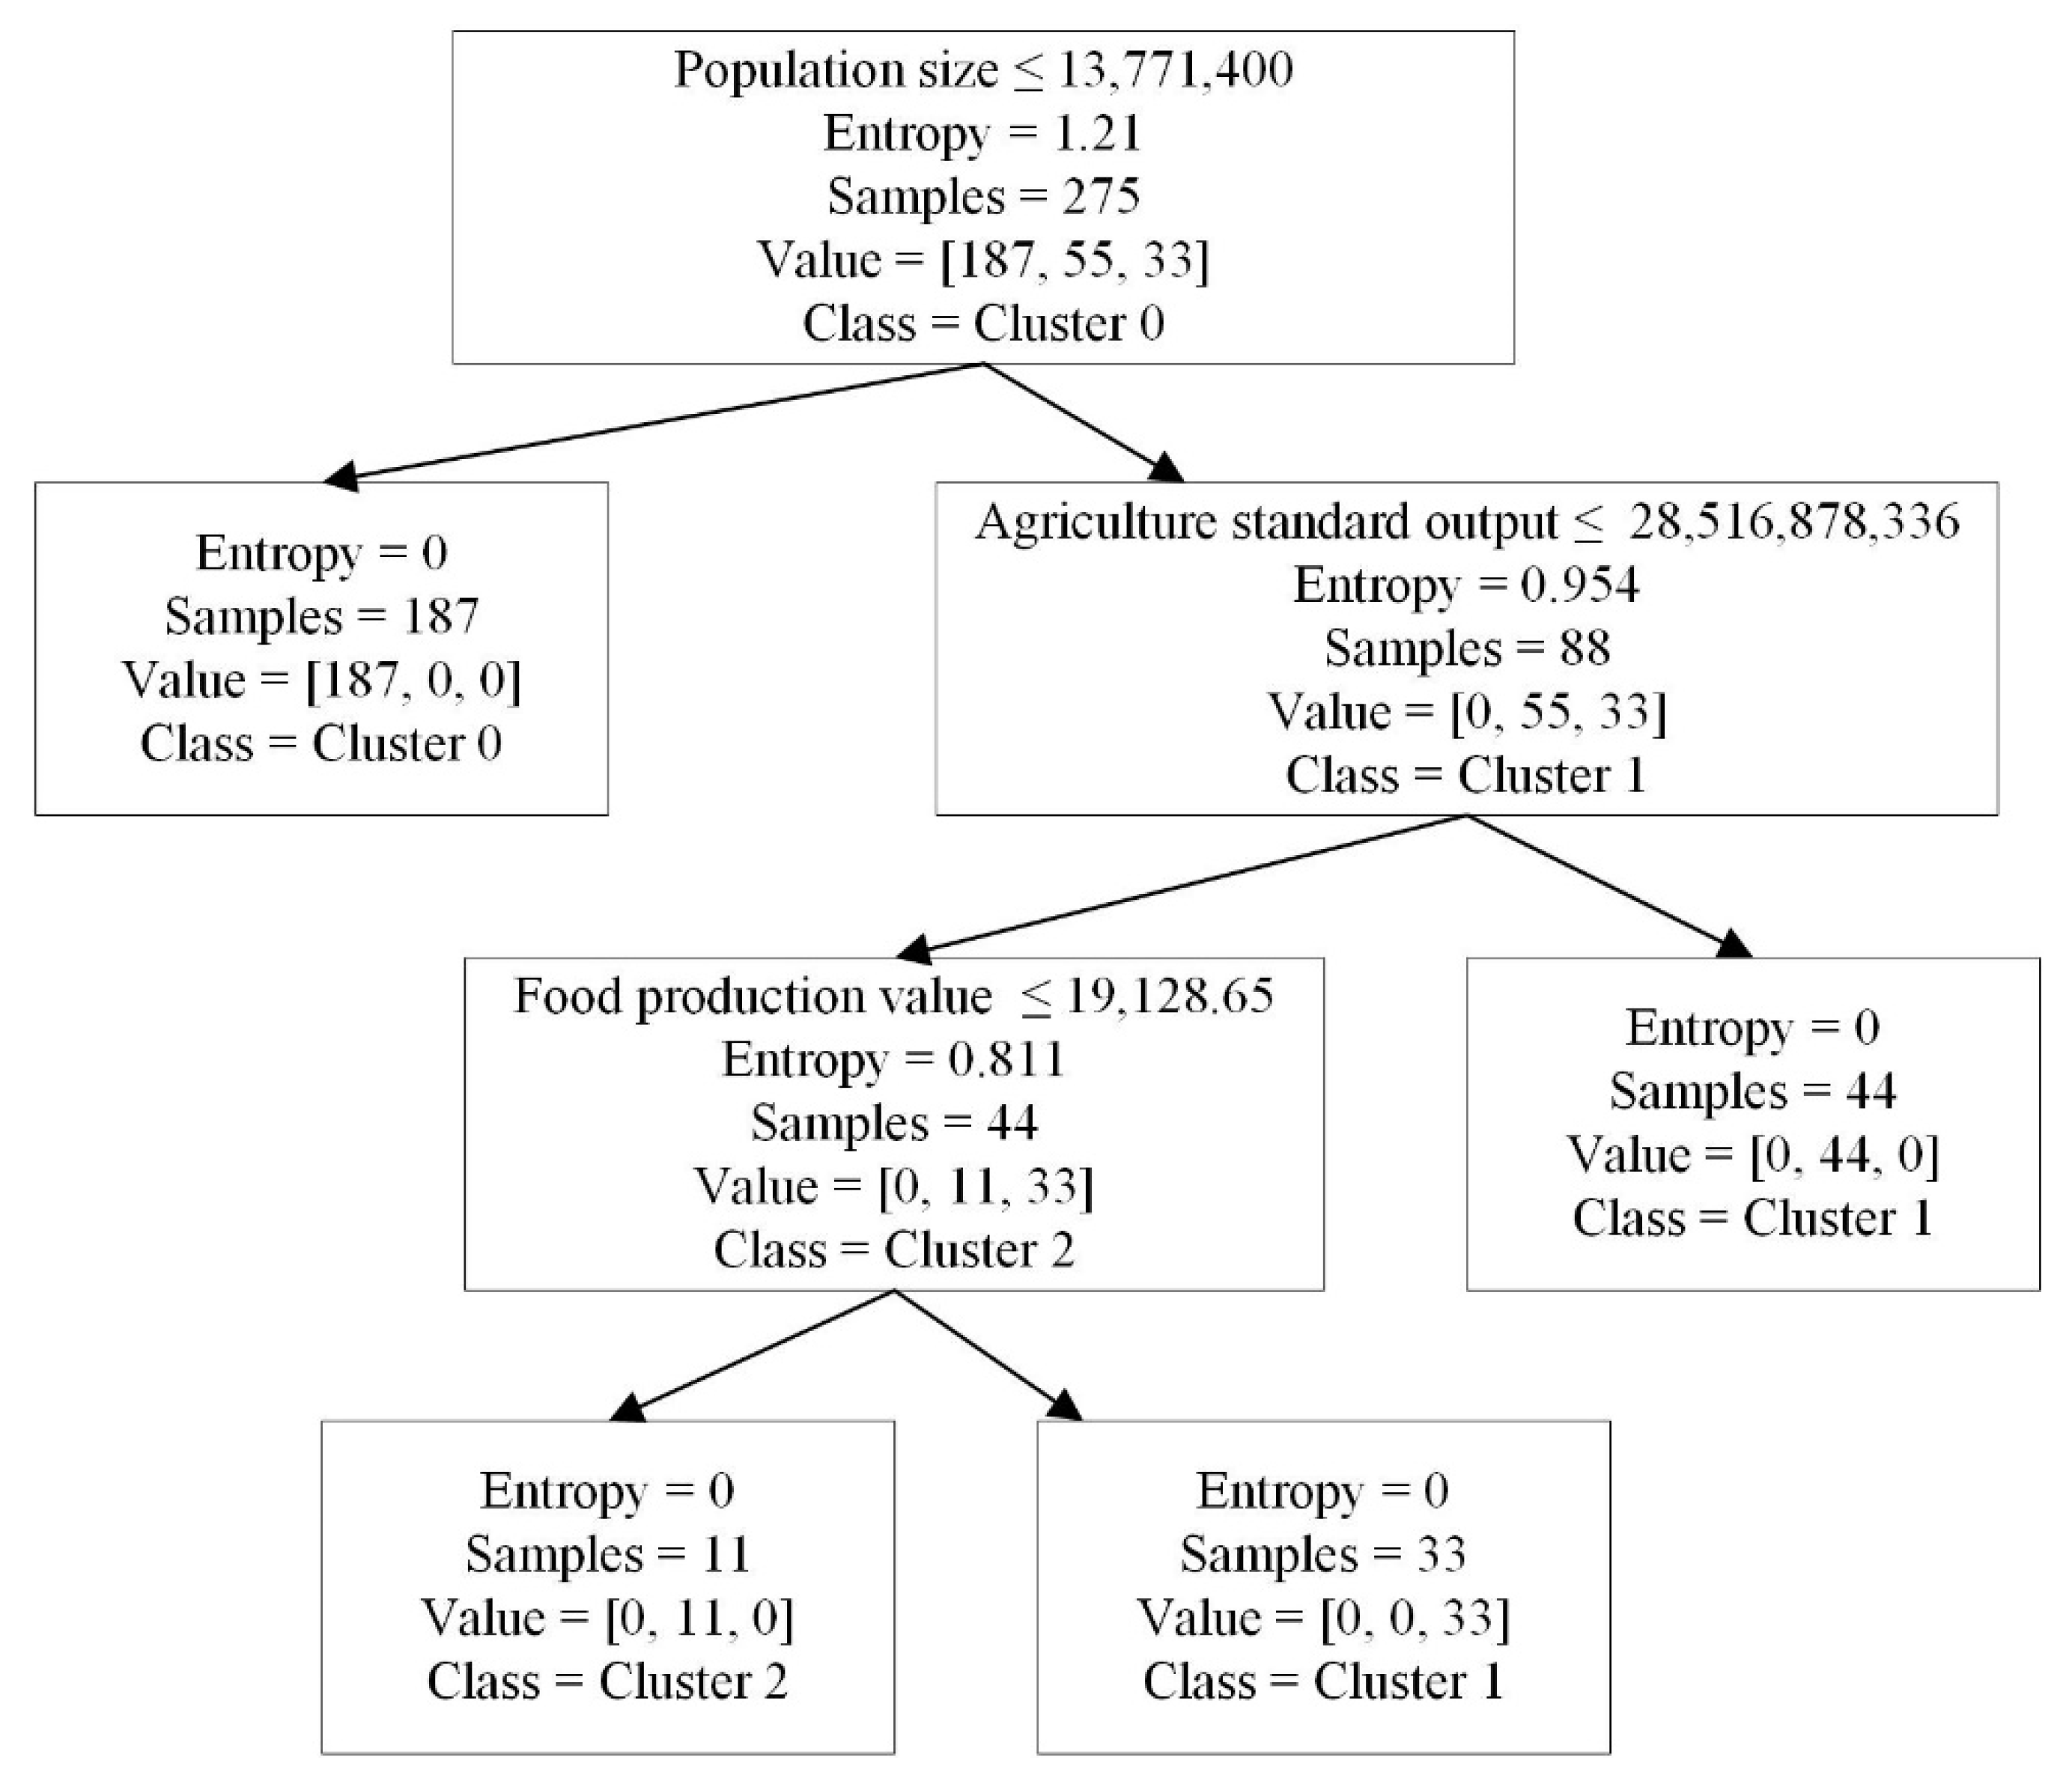
The food industry to shift towards organic products must decrease lead-time and maintain high product quality. To accomplish such a shift of operations the food industry must adapt e-commerce type of distribution approach i.e., increase local production and decrease the length of the supply chain. To analyse the efficiency of such an approach a computer simulation must be developed, which would consider different contingencies of the food industry.
From one side, the changing consumer habits demand for more healthy food products is drastically effecting the market. “Globally, fresh food volume sales are predicted to rise by 17% over 2017–2022, at a CAGR of 3%” [43]. From the other side, the growing world population and increasing urbanization level is causing the current supply chain approaches to be less and less effective. The world population is estimated to reach 10 billion by 2050, while nearly all of this population increase will occur in developing countries. Moreover, urbanization will continue at an accelerated pace, and about 70 percent of the world’s population will be urban (compared to 49 percent today) [44]. The main difficulties in sense of e-commerce type of adaptation towards the food industry are related to lack of infrastructure and high distribution costs [45]. The supply chain infrastructure should shift towards more local producers with distribution centres servicing them. However, the delivery of low quantity products to multiple delivery points are increasing the last-mile delivery costs dramatically. This issue is especially relevant in areas where urbanization levels are high. High density cities cause the supply chain to be vulnerable to disruptions, which decreases the quality of food products. The shift towards more local producers must also come because a lot of food products are also wasted in the processing part of the supply chain. “FAO statistics suggest that nearly one-third of the food produced in the world for human consumption is lost or wasted annually. In developing countries, 40% of losses occur at the post-harvest and processing stages, while in developed countries more than 40% of losses occur at retailer and consumer levels” [43]. Addressing food waste issues is important also in the EU. “The collection and analysis of data from across Europe for this study generated an estimate of food waste in the EU-28 of 88 million t. This estimate is for 2012 and includes both edible food and inedible parts associated with food. This equates to 173 kg of food waste per person in the EU-28. The total amounts of food produced in EU for 2011 were around 865 kg/person, this would mean that in total we are wasting 20 % of the total food produced [46]. In the EU part of the food waste is wasted in the households, while other part in the processing phase. “The sectors contributing the most to food waste are households (47 ± 4 million t) and processing (17 ± 13 million t)” [46]. The statistics related to food waste amplifies the importance to change the food supply chain management approaches. The demand for organic products from the consumer perspective will even more diminish the effectiveness of the current supply chain management approaches. The changes require decreasing the lead-time of food discretion in order to maintain high quality and minimize food waste. “The current linear system of production and consumption is unsustainable. In the food sector, despite the fact that valuable natural resources are intensively used to produce and distribute food products, little is done to upcycle residues generated along the supply chain. Circular economy strategies are crucial for restructuring the take-make-dispose model through the active participation of all actors of supply chains.” [47]. To fulfil this approach researchers amplify two main approaches. One approach is to decrease the length of the current supply chain. This can be accomplished by implementing e-commerce type of supply chain in the food industry. “Offering products via the internet is affecting the traditional “bricks and mortar” retail structure. However, as selling online products is not successful for all types of articles, not all retail branches are affected similarly by internet sales. Groceries are still a niche in online trading but are expected to grow fast” [48]. For the food industry to adapt the e-commerce type, it should shift towards direct selling and more involvement of local producers. “The direct selling of food from producers to consumers is not a new development. The possibility of buying food via regional markets, via catalogues or direct at the farm existed before. But the internet enhances the direct access to the consumer” [48].
Figure 4 shows the adaptation of e-commerce type distribution strategies for the food industry. Firstly small-scale farmers should be clustered based on computability i.e., similar products and production processes. Then the products should be gathered by autonomous vehicles from multiple delivery points. Afterwards all the raw materials should be delivered to a consolidation warehouse. Near the consolidation warehouse, there should be processing plants. Afterwards the products should be distribution directly to end consumer or pick-up points. It is important to amplify that the distribution processes should be done with autonomous vehicles. The implementation of such a distribution strategy would decrease the length of the supply chain and would allow small-scale farmers to share their resources in order to maintain competitiveness. However, online grocery shopping is currently a growing industry, however has a lot of ineffectiveness and currently is not suitable to fulfil the food demand for a country level market. To reduce food waste and maintain short supply chains a hyper local market approach is recommended to be implemented. “Hyperlocal companies operates in one or more than one states with more specific regional focus, the main objective of the business to cater wider market within certain geographical boundaries so as to become strong player. Demand for instant delivery due to changing lifestyle, easy access to internet, Increase in geo-location aware devices and easy payment option have paved the way for hyperlocal businesses” [45]. “Local production is becoming an increasingly important food attribute for consumers due to inter alia recent food scandals and the growing complexity of food production. Especially in the organic food market, local production is seen as an important additional value” [49]. Hyper local describes how food should be gowned in local markets by small and medium farmers. However, this would mean that the companies would lose economy of scale, which in the long run would be impossible to compete with international companies. In this place, the recommended SCMF could be implemented to increase information flow between the supply chain members. However, successful implementation of SCMF requires analysis based on contingencies.
European Union has been selected as reference to determine the singularities of the market. EU has been chosen because the organic food market is gaining more attention in the EU and has publicly available data. Europe has the second largest market for organic food and drink, after North America [50]. In 2014 European consumers spent about 23.9 billion euros for organic food [51]. The, European organic market grew by double digits and organic area reached 13.5 million hectares in 2016 [52]. Therefore, in this publication a macro level analysis of the EU will be conducted to identify different contingencies which must be covered in future computer simulation research. The selected statistical analysis data was extracted from Eurostat, which focused on agriculture, food processing and population statistics [53,54,55] and the key indexes selected are based on the identified contingencies of the food industry such as market size, competitiveness environment, population size and density.

3.2. Methodology

The proposed SCMF will be validated based on agent-based modelling principles. In order to successfully conduct the computer simulation the environment of the food industry bust be analysed and classified. In today’s dynamic environment, it is essential to consider different contingencies where the developed SCMF will be used. Therefore, a macro index analysis of the food industry will be conducted. For the analysis, the European Union has been chosen with 25 countries. Several countries have been removed from the analysis due to many missing values of the indexes. The indexes consist of main three types. The first category of indexes consist of population, density and distribution statistics. The second category focuses on the agriculture industry and considers such indexes as utilized agriculture area, farm number, farm number with livestock, farm livestock units, standard output, labour force and import/export. The third category focuses on the food processing sector and takes into consideration employment number, enterprise number, gross operating surplus, production value, turnover, value added and import/export. Missing values were interpolated and all indexes were estimated by using Facebook prophet algorithm [56]. Then a k-mean clustering algorithm was applied to identify different contingencies of the selected countries.
K-means clustering-a centroid approach allows to distribute various inputs among k clusters in a balanced way based on different parameters, such as distance or density. The focus of such an analysis is to identify different contingencies of the food industry in which different strategies must be applied based on the SCMF. Incorrect application of strategies in contingencies might lead to operational inefficiency.
The study below will focus on advanced descriptive (e.g., clustering) and prescriptive analytics and decisions which are proven by evidence. After assignment of cluster labels to the data, a decision tree classifier was used to determine main features of the groups. Lastly, descriptive statistics of the identified clusters has been provided. The number of clusters has been chosen by following the elbow method and for validation, a silhouette score has been used.

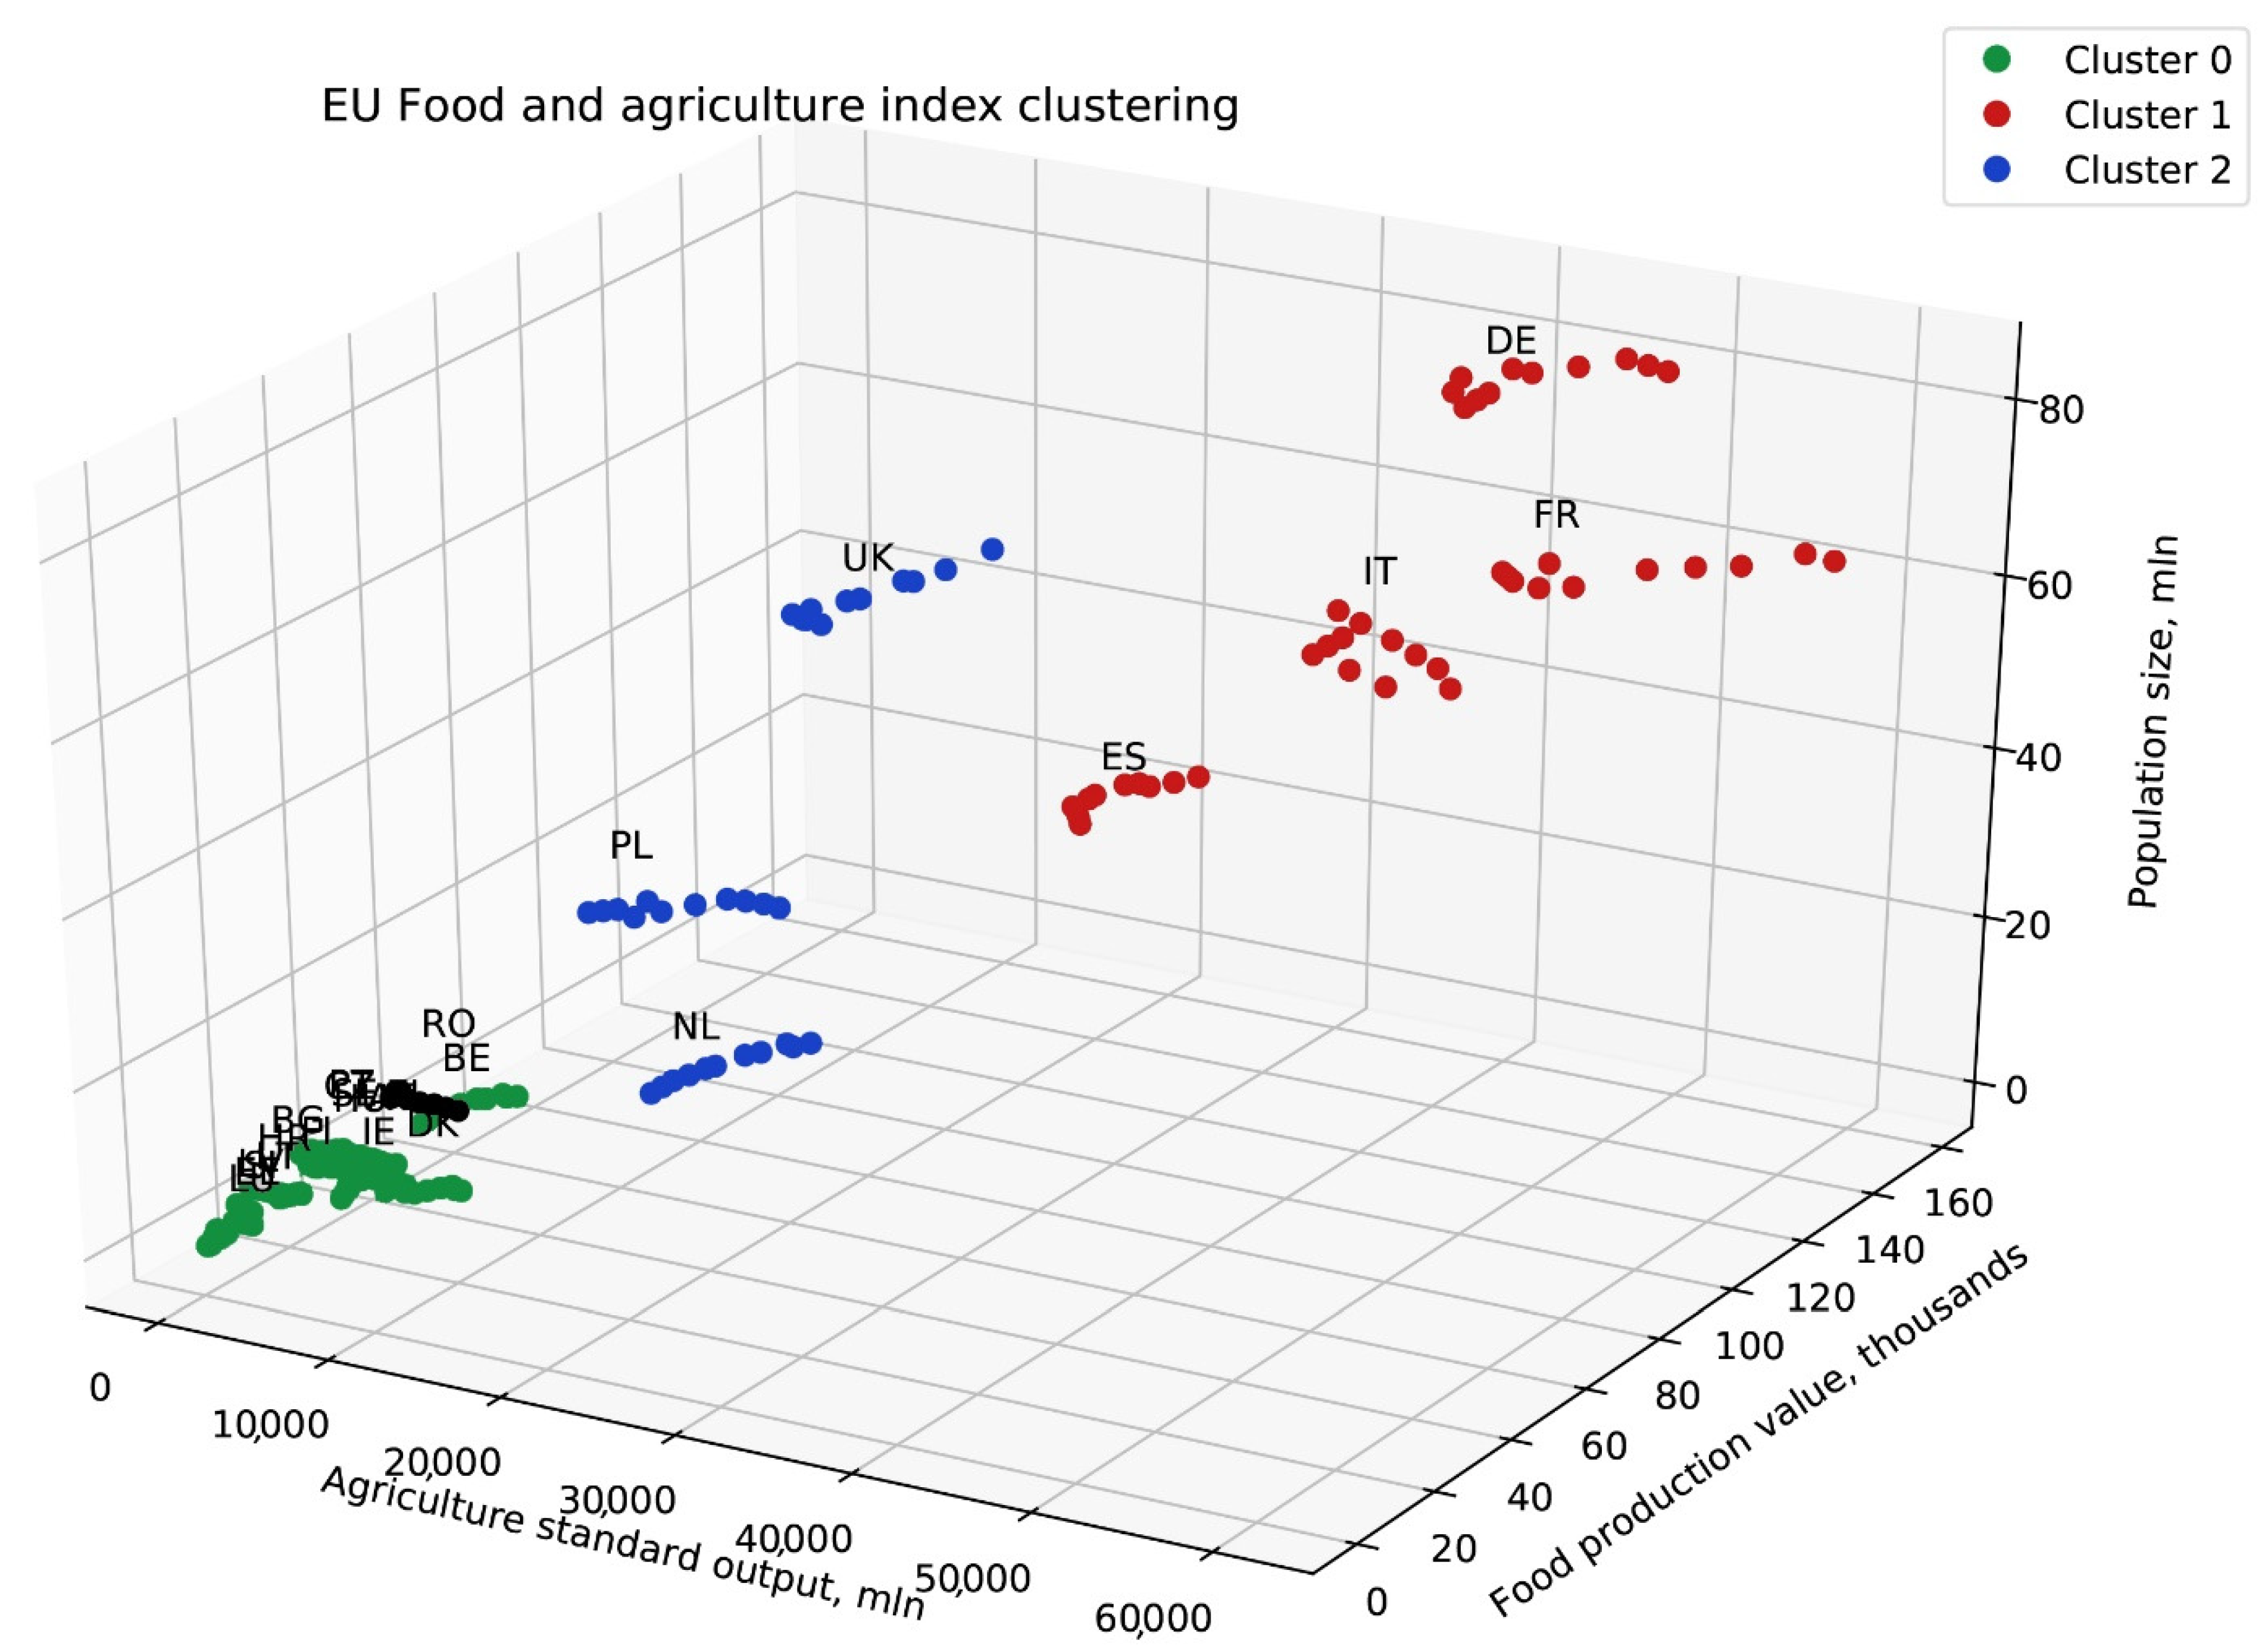
3.3. Macro Index Analysis of the Food Industry

Machine learning application in econometrics is still an evolving field, with only limited amount of research, however it is estimated that machine learning in econometrics will be more applied in future research [57]. In spite of rapid usage of machine learning, the collaboration between computer science and economists is still evolving-“it remains to conclude that machine learning can and has certainly advanced econometric techniques but a lot of work remains to speed up their introduction into econometrics [58]”. However, the application of machine learning is estimate to enrich economic research by providing a useful way to obtain a one-dimensional statistic that summarizes a large amount of information about the entities being studies [59]. “The appeal of machine learning is that it manages to uncover generalizable patterns. In fact, the success of machine learning at intelligence tasks is largely due to its ability to discover complex structure that was not specified in advance. It manages to fit complex and very flexible functional forms to the data without simply overfitting; it finds functions that work well out-of-sample” [60]. Such machine learning approaches has been implemented in economics, but only limited amount of research has been found. For example, one empirical results illustrate the superiority of machine learning methods in detecting irregular patterns or ‘noises’ due to data heterogeneity for short-run prediction, and demonstrated the ability of more standard econometric methods in identifying regular trends which matter more in long-run prediction [61]. Other research applied clustering algorithms for macro indexes, however only a few applications has been found. Hana Řezanková conducted a cluster analysis of macro level of the EU consumers [62]. Another research paper used clustering approach to identify key macro indicators contributing to Nigeria economy growth [63]. Another research focused on the EU, but only from the perspective of gross domestic product [64]. However, neither of these papers focused separately on industry analysis or more specifically the food industry. Theodore, the application of clustering algorithm for food industry macro indexes has not been accomplished previously. Application of unsupervised machine learning algorithms for macro indicator analysis can help identify contingencies of the food industry without initial assumptions, when comparing to other types of algorithms.
Firstly, missing value analysis of the macro indexes has been conducted. Several countries due to majority of missing values has been removed from the analysis, continuing with 25 countries of the EU. Later, the data has been interpolated between known values. Afterwards, an advanced time series algorithm Prophet has been applied to estimate the macro indexes. After the data cleaning and preparation a k-mean clustering algorithm has been applied, the optimal number of clusters has been determined by following the elbow method (see Figure 5) and validated with the silhouette score of 0.749.
The results of the decision tree are represented in Figure 6. The first group are countries which population size is less than 13 million. If the population size is larger than 13 million, agriculture output plays an important role, if its higher than 28 million the 1 cluster is assigned. If the agriculture output is lower than 28 million then food production value is used, if its lower than 19 million then the 2 cluster is assigned, otherwise the 1 cluster. The cluster groups by countries is represented in Figure 7.
In the first cluster Germany, France, Italy and Spain are assigned, which has high population, agriculture output and food production value. The second cluster consist of United Kingdom, Poland and Netherlands. The 2 cluster has lower population and lower agriculture output. Lastly, the majority of countries are assigned to the 0 cluster, which consist of Austria, Belgium, Bulgaria, Czech Republic, Denmark, Estonia, Greece, Finland, Croatia, Hungary, Ireland, Lithuania, Luxembourg, Latvia, Portugal, Sweden, Slovenia. Descriptive statistics of the clusters are provided in Table 2, Table 3 and Table 4.
The first descriptive statistics has been provided for population size and population density. Population density is measured by persons living in square kilometre. Cluster 0 has a population density of 100, cluster 1 of 140 and cluster 2 of 290. In cluster 2 more than 53% of population is living in cities, in cluster 1 its 44%, and in cluster–its 36%. The average population in cluster 0 is very small, while cluster 1 has the highest population with the mean of 54 million. In sense of population and population density, it can be concluded that cluster 2 has the lower population size then cluster 1 and higher than cluster 0 with the highest population living in cities. Cluster 1 has the highest population size with more population living in rural areas. Lastly, cluster 0 has the lowest population size with majority of population living in rural and suburbs area.
The second descriptive statistics focuses on the agriculture sector. When comparing import and export, then cluster 0 is again the smallest while export is similar in cluster 1 and 2. However, the import is larger by 2.5 million in cluster 1, when compared to cluster 2. The largest number of farmers are in cluster 1 with 1.4 million, while cluster 2 has 700 thousand, cluster 0 has the lowest number of 183 thousands. Similar situation is with livestock. In addition, cluster 1 has the most employees in agriculture sector.
The last descriptive statistics is about food processing manufacturing sector. Export and import statistics are similar in cluster 1 and 2, while the lowest amount are in cluster 0. The majority of employment is in cluster 1, with the high enterprise number of 35 thousand. Again, cluster 1 in production value is the highest when compared to cluster 0 and 1.
After the analysis of macro indexes, it can be concluded that cluster 0 consist of small markets with low population size and majority of population living in suburbs. Cluster 2 is the intermediate cluster with lower population size and food industry. It’s essential to amplify that approximately 44% lives in cities. Lastly, cluster 1 has high population, high food production values and averagely 55% of population is living in cities. The tendencies show that in sense of population density their low density and high, which influences distribution strategies. In addition, the number of enterprises operating in agriculture and manufacturing industries differs drastically in the clusters. Therefore, when implementing the proposed SCMF these different contingencies should be taken into consideration.
The implementation of the proposed SCMF depends on the existing infrastructure of the country, therefore the solution in some countries should be implemented into existing clusters, while in other the clusters should be formed. The development of the necessary infrastructure is essential to implement the proposed SCMF. The framework represents how information sharing can provide more efficient utilization trough cyber-physical systems. These systems show how information should be gathered trough the supply chain and how the system itself should utilize the information. The implementation of such approach in the food industry is possible trough autonomous vehicles. The majority of research currently focuses on autonomous vehicles implementation for public transport, however current technological advancement will allow to use these technologies for product distribution also [65]. Recent studies started focusing more on autonomous solutions for other type of transport systems. For instance, Sanchez et al. (2021) analyzed an autonomous bicycle sharing system, and they stated that the system could combine the most relevant benefits of vehicle sharing, electrification, autonomy, and micro-mobility, increasing the efficiency and convenience [66]. Integration with reinforcement learning algorithm will allow the system to learn and evolve in order to minimize food waste levels [67]. Therefore, proper infrastructure preparation and information sharing is essential. From the other side, information sharing abilities can be used to provide more optimal inventory level for demand and supply, which directly related to food waste reduction. The implementation of the proposed SCMF would provide self-learning system abilities to the food industry [3]. In the future, a computer simulation will be conducted to validate the proposed framework.
The statistics of the growing world population and increasing consumer expenditures for organic food industry amplifies the changing business environment of the food industry. Current business practices amplify the need to shift towards e-commerce and hyper-local distribution strategies. The conducted macro index analysis identified main 3 types of contingencies of the food industry, which will be used to conduct an agent-based model in future research.

4. Discussion

Previous supply chain management strategies usually focused on separate elements of the system and tried to stabilize them, however, such approaches in a dynamic and turbulent environment does not work anymore. To increase supply chain resilience some research promotes collaboration, others focus more on technological approaches. However, such strategies tend to fail without integrating them together. The proposed supply chain management framework (SCFM) fills in the missing gap of the discussed issue.
The SCFM for sustainability has been proposed, which addresses rising complexity of the food industry. By increasing system resilience, the ineffectiveness of the process decreases, and the supply chain can be operated more sustainable i.e., alignment of demand and supply is improved, consumer receive food products with more days left until expiration. The framework mainly consists of three characteristics, which organizations should operationalize in order to maintain system resilience and which in the long-run would evolve to sustainable development. One characteristic of the SCMF focuses on capabilities of supply chain such as flexibility and redundancy. The second characteristics focuses on collaboration in order to increase information sharing between organizations. The third characteristics focuses on how to control the increased complexity in the supply chain. The flexibility and redundancy capabilities combined with collaboration (i.e., information sharing) and controlled by cyber-physical systems can allow supply chain members to automate operational and tactical level by controlling their performance through strategic level. This approach allows the system to continue gather data, apply artificial intelligence approaches which in the long run causes the supply chain to evolve and adapt to the disruptions. This adaptation causes resilience to emergence and in the long run sustainable development. These approaches were elaborated in a previous publication [68].
In future research an agent-based model will be conducted which will identify redundancy and flexibility effectiveness for sustainable supply chain management. Redundancy approach will identify how information sharing influences forecasting accuracy, which can help better alignment demand and supply i.e., reduce food waste. Flexibility simulation will show how autonomous vehicles in the logistic cluster can increase on time delivery rate, which will allow delivering food products of higher quality to end-consumers. In the end, these approaches will be combined, and an artificial supply chain will be modelled. The final simulation will uncover how tactical and operational level should be automated and will provide theoretical explanation to which strategic level variables should organizations focus on. Finally, the developed SCMF implementation possibilities in existing logistic clusters and new logistic cluster development will be analyzed.

5. Conclusions

To implement and provide theoretical background of the proposed SCMF the complexity theory has been adapted to supply chain management theory. It was uncovered that traditional supply chain management approaches are not suitable for the upcoming challenges of high complexity, dynamic environment and consumer desire for the food industry. More precisely, the analysis of the complex-adaptive system theory allowed identifying the main characteristics, which should be operationalized, and managed, because of the operationalization of these characteristics emergence of sustainability can accrue. To validate the proposed SCMF an agent-based simulation will be conducted. To develop the ABM different contingencies must be considered.
The EU food industry’s macro index analysis has been conducted, which classified the food industry’s contingencies. The clustering analysis determined 3 clusters, which were validated with a silhouette score of 0.749. The descriptive statistics about the clusters were provided based on population density, population size, agriculture output indicators, and employment. Based on the descriptive statistics it was determined the food industry can be categorized in to developing, underdeveloped and developed food industries, these classifications are not nursery directly related to the level of the country. Moreover, singularities of different contingencies have been identified which considers population size, population density, market size of the food industry and disruption intensity. The main limitation is that for the clustering a k-mean algorithm was used, however, for time series data alternative clustering algorithms with different distance functions could be tested.
The study suggested a supply chain management framework, which shows how information sharing trough collaboration can be achieved. However, the increased information also increases the complexity of the supply chain, which can be managed by introducing innovative technologies. The adaptation of complex adaptive system theory helps to explain how the framework helps to provide adaptive abilities to the supply chain members, which interaction than emerges to system level output i.e., increased resilience. The proposed framework must be differently adapted depending on the contingencies of the food industry, which were identified by applying a clustering algorithm on the macro indicators. The implementation of the framework focuses from strategic, tactical and operational levels. From strategic level the SCMF is similar in all contingencies, however, depending on the type of market, more emphasize on vehicle routing or demand forecasting should be made.
The main limitation of the research is the identified contingencies by applying a k-mean clustering algorithm. In this case, a centroid based k-mean algorithm was applied by using the Euclidian distance, alternative clustering algorithms or metrics could be used to identify even more contingencies.

Author Contributions

Conceptualization, V.G.; methodology, V.G.; validation, A.B.; formal analysis, A.B.; investigation, V.G. and A.B. All authors have read and agreed to the published version of the manuscript.

Funding

This research received no external funding.

Institutional Review Board Statement

Not applicable.

Informed Consent Statement

Not applicable.

Data Availability Statement

Not applicable.

Conflicts of Interest

The authors declare no conflict of interest.

References

  1. Food and Agriculture Organization. The Future of Food and Agriculture: Trends and Challenges. Available online: https://www.fao.org/3/i6583e/i6583e.pdf (accessed on 20 January 2022).
  2. Council of the European Union. Food Losses and Food Waste. Available online: https://www.fao.org/food-loss-and-food-waste/flw-data (accessed on 20 January 2022).
  3. DHL Logistics Trend Radar. Available online: https://www.dhl.com/lt-en/home/insights-and-innovation/insights/logistics-trend-radar.html (accessed on 20 January 2022).
  4. Kayikci, Y. E-Commerce in Logistics and Supply Chain Management. In Encyclopedia of Information Science and Technology; IGI Global: Hershey, PA, USA, 2017; pp. 1015–1026. [Google Scholar]
  5. Alcantara, P.; Riglietti, G.; Aguada, L.; BCI. Supply Chain Resilience Report. Available online: https://www.thebci.org/static/e02a3e5f-82e5-4ff1-b8bc61de9657e9c8/BCI-0007h-Supply-Chain-Resilience-ReportLow-Singles.pdf (accessed on 20 January 2022).
  6. Pires Ribeiro, J.; Barbosa-Povoa, A. Supply Chain Resilience: Definitions and quantitative modelling approaches—A literature review. Comput. Ind. Eng. 2017, 115, 109–122. [Google Scholar] [CrossRef]
  7. Christopher, M.; Holweg, M. Supply Chain 2.0′: Managing supply chains in the era of turbulence. Int. J. Phys. Distrib. Logist. Manag. 2011, 41, 63–82. [Google Scholar] [CrossRef]
  8. Navickas, V.; Kuznetsova, S.A.; Gruzauskas, V. Cyber–physical systems expression in industry 4.0 context. Financ. Credit Act. Probl. Theory Pract. 2017, 2, 188–197. [Google Scholar] [CrossRef] [Green Version]
  9. Palmberg, K. Complex adaptive systems as metaphors for organizational management. Learn. Organ. 2009, 16, 483–498. [Google Scholar] [CrossRef] [Green Version]
  10. Gružauskas, V.; Vojtovic, S.; Navickas, V. Cyber-physical systems impact to supply chain competitiveness. In Proceeding of the CITPM Conference on Contemporary Issues in Theory and Practice of Management, Czestochowa, Poland, 19–20 April 2018; p. 117. [Google Scholar]
  11. Kamalahmadi, M.; Parast, M.M. A review of the literature on the principles of enterprise and supply chain resilience: Major findings and directions for future research. Int. J. Prod. Econ. 2016, 171, 116–133. [Google Scholar] [CrossRef]
  12. Chowdhury, M.M.H.; Quaddus, M. Supply chain resilience: Conceptualization and scale development using dynamic capability theory. Int. J. Prod. Econ. 2017, 188, 185–204. [Google Scholar] [CrossRef]
  13. Gunasekaran, A.; Subramanian, N.; Rahman, S. Supply chain resilience: Role of complexities and strategies. Int. J. Prod. Res. 2015, 53, 6809–6819. [Google Scholar] [CrossRef] [Green Version]
  14. Ding, Y.; Jin, M.; Li, S.; Feng, D. Smart logistics based on the internet of things technology: An overview. Int. J. Logist. Res. Appl. 2021, 24, 323–345. [Google Scholar] [CrossRef]
  15. Angkiriwang, R.; Pujawan, I.N.; Santosa, B. Managing uncertainty through supply chain flexibility: Reactive vs. proactive approaches. Prod. Manuf. Res. 2014, 2, 50–70. [Google Scholar] [CrossRef] [Green Version]
  16. Vlajic, J. Effective Usage of Redundancy And Flexibility in Resilient Supply Chains. In Proceedings of the International Symposium on Logistics: Data Driven Supply Chains, Ljubljana, Slovenia, 9–12 July 2017; pp. 450–458. [Google Scholar]
  17. Hwang, Y.-M.; Rho, J.-J. Strategic value of RFID for inter-firm supply chain networks. Inf. Dev. 2016, 32, 509–526. [Google Scholar] [CrossRef]
  18. Pettit, T.J.; Croxton, K.L.; Fiksel, J. Ensuring Supply Chain Resilience: Development and Implementation of an Assessment Tool Ensuring. J. Bus. Logist. 2016, 34, 46–76. [Google Scholar] [CrossRef]
  19. Arvitrida, N.I.; Robinson, S.; Tako, A.A.; Robertson, D.A. An agent-based model of supply chain collaboration: Investigating manufacturer loyalty. In Proceedings of the Operational Research Society Simulation Workshop 2016, Ettington, UK, 11–13 April 2016; pp. 35–44. [Google Scholar]
  20. Herczeg, G.; Akkerman, R.; Hauschild, M.Z. Supply chain collaboration in industrial symbiosis networks. J. Clean. Prod. 2018, 171, 1058–1067. [Google Scholar] [CrossRef]
  21. Boyes, H.; Hallaq, B.; Cunningham, J.; Watson, T. The industrial internet of things (IIoT): An analysis framework. Comput. Ind. 2018, 101, 1–12. [Google Scholar] [CrossRef]
  22. Adams, F.G.; Richey, R.G.; Autry, C.W.; Morgan, T.R.; Gabler, C.B. Supply chain collaboration, integration, and relational technology: How complex operant resources increase performance outcomes. J. Bus. Logist. 2014, 35, 299–317. [Google Scholar] [CrossRef]
  23. Azadegan, A.; Jayaram, J. Resiliency in Supply Chain Systems: A Triadic Framework Using Family Resilience Model. In Supply Chain Risk Management; Springer: Singapore, 2018; pp. 269–288. ISBN 9781482205978. [Google Scholar]
  24. Sáenz, M.J.; Revilla, E.; Acero, B. Aligning supply chain design for boosting resilience. Bus. Horiz. 2018, 61, 443–452. [Google Scholar] [CrossRef]
  25. Verdouw, C.N.; Wolfert, J.; Beulens, A.J.M.; Rialland, A. Virtualization of food supply chains with the internet of things. J. Food Eng. 2016, 176, 128–136. [Google Scholar] [CrossRef] [Green Version]
  26. Navickas, V.; Gružauskas, V. Big data concept in the food supply chain: Small markets case. Sci. Ann. Econ. Bus. 2016, 63, 15–28. [Google Scholar] [CrossRef] [Green Version]
  27. Gružauskas, V.; Baskutis, S.; Navickas, V. Minimizing the trade-off between sustainability and cost effective performance by using autonomous vehicles. J. Clean. Prod. 2018, 184, 709–717. [Google Scholar] [CrossRef]
  28. Smetana, S.; Aganovic, K.; Heinz, V. Food Supply Chains as Cyber-Physical Systems: A Path for More Sustainable Personalized Nutrition. Food Eng. Rev. 2021, 13, 92–103. [Google Scholar] [CrossRef]
  29. Arthur, W.B. Complexity Economics: A Different Framework for Economic Thought. Complex. Econ. 2013, 43, 1–22. [Google Scholar]
  30. Davis, J.P.; Eisenhardt, K.M.; Bingham, C.B. Developing Theory Through Simulation Methods. Acad. Manag. Rev. 2007, 32, 480–499. [Google Scholar] [CrossRef] [Green Version]
  31. Benthall, S. Philosophy of Computational Social Science. Cosm. Hist. J. Nat. Soc. Philos. 2016, 12, 13–30. [Google Scholar]
  32. Caspersen, E.; Navrud, S. The sharing economy and consumer preferences for environmentally sustainable last mile deliveries. Transp. Res. Part D Transp. Environ. 2021, 95, 102863. [Google Scholar] [CrossRef]
  33. Trochim, W.M.K. Deduction & Induction. Research Methods Knowledge Base. 2022. Available online: https://conjointly.com/kb/deduction-and-induction/ (accessed on 20 January 2022).
  34. Axelrod, R. Advancing the art of simulation in the social sciences-SSP. J. Jpn. Int. Econ. 2005, 12, 16–22. [Google Scholar]
  35. Wollmann, D.; Steiner, M.T.A. The strategic decision-making as a complex adaptive system: A conceptual scientific model. Complexity 2017, 1, 7954289. [Google Scholar] [CrossRef] [Green Version]
  36. Wycisk, C.; McKelvey, B.; Hülsmann, M. Smart parts’ supply networks as complex adaptive systems: Analysis and implications. Int. J. Phys. Distrib. Logist. Manag. 2008, 38, 108–125. [Google Scholar] [CrossRef] [Green Version]
  37. Cordes, P.; Hülsmann, M. Self-healing Supply Networks: A Complex. In Supply Chain Safe Management; Springer: Berlin/Heidelberg, Germany, 2013; pp. 217–230. ISBN 9783642446740. [Google Scholar]
  38. Marchi, J.J.; Erdmann, R.H.; Rodriguez, C.M.T.; Marchi, J.J.; Erdmann, R.H.; Rodriguez, C.M.T. Understanding Supply Networks from Complex Adaptive Systems. BAR-Braz. Adm. Rev. 2014, 11, 441–454. [Google Scholar] [CrossRef] [Green Version]
  39. Chriss, N.; Ginzburg, V. Representation Theory and Complex Geometry; Birkhäuser: Boston, MA, USA, 1997. [Google Scholar]
  40. Chaouni, C.; Benabdellah, A.; Bouhaddou, I.; Benghabrit, A. Supply chain challenges with complex adaptive system perspective. In Proceedings of the World Conference on Information Systems and Technologies, Azores, Portugal, 2 April 2018; pp. 1081–1093. [Google Scholar]
  41. Aelker, J.; Bauernhansl, T.; Ehm, H. Managing complexity in supply chains: A discussion of current approaches on the example of the semiconductor industry. Procedia CIRP 2013, 7, 79–84. [Google Scholar] [CrossRef]
  42. Barrientos, A.H.; Idalia Flores, M. Modeling Sustainable Supply Chain Management as a Complex Adaptive System: The Emergence of Cooperation. In Sustainable Supply Chain Management; IntechOpen: London, UK, 2016; pp. 195–218. ISBN 9781848215269. [Google Scholar]
  43. Euromonitor. International, Fresh Food Global Industry Overview. Available online: https://www.euromonitor.com/fresh-food-global-industry-overview/report (accessed on 20 January 2022).
  44. Food and Agriculture Organization. How to Feed the World in 2050. Available online: https://www.fao.org/fileadmin/templates/wsfs/docs/expert_paper/How_to_Feed_the_World_in_2050.pdf (accessed on 20 January 2022).
  45. Siyodia, R.; Yelamanchili, R. Challenges and Constraint in Supply Chain Management for Hyperlocal Delivery Business in India. In Proceedings of the SIMSR Global Supply Chain Management Conference, Mumbai, India, 16 December 2016; pp. 1–10. [Google Scholar]
  46. EU Fusions. Estimates of European Food Waste Levels. Available online: https://www.eu-fusions.org/phocadownload/Publications/Estimates%20of%20European%20food%20waste%20levels.pdf (accessed on 20 January 2022).
  47. Borrello, M.; Caracciolo, F.; Lombardi, A.; Pascucci, S.; Cembalo, L. Consumers’ perspective on circular economy strategy for reducing food waste. Sustainability 2017, 9, 141. [Google Scholar] [CrossRef] [Green Version]
  48. Saskia, S.; Mareï, N.; Blanquart, C. Innovations in e-grocery and Logistics Solutions for Cities. Transp. Res. Procedia 2015, 12, 825–835. [Google Scholar] [CrossRef]
  49. Wägeli, S.; Hamm, U. Consumers’ perception and expectations of local organic food supply chains. Org. Agric. 2016, 6, 215–224. [Google Scholar] [CrossRef]
  50. Willer, H.; Lernoud, J. The World of Organic Agriculture 2016: Statistics and Emerging Trends. Available online: https://orgprints.org/id/eprint/34570 (accessed on 20 January 2022).
  51. Dovleac, L. An overview on the supply chain for European organic food market. Bull. Transilv. Univ. Brasov. Ser. V Econ. Sci. 2016, 9, 325–330. [Google Scholar]
  52. FIBL. European Organic Market Survey. 2018. Available online: http://www.fibl.org/en/service-en/news-archive/news/article/european-organic-market-grew-by-double-digits-and-organic-area-reached-135-million-hectares-in-2016.html (accessed on 20 January 2022).
  53. Eurostat. Industry by Employment Size Class. Available online: http://appsso.eurostat.ec.europa.eu/nui/show.do?dataset=sbs_sc_ind_r2&lang=en (accessed on 20 January 2022).
  54. Eurostat. Population Density by NUTS 3 Region. Available online: http://appsso.eurostat.ec.europa.eu/nui/show.do?dataset=demo_r_d3dens&lang=en (accessed on 20 January 2022).
  55. Eurostat. Distribution of Population by Degree of Urbanisation. Available online: http://appsso.eurostat.ec.europa.eu/nui/show.do?dataset=ilc_lvho01&lang=en (accessed on 20 January 2022).
  56. Taylor, S.J.; Letham, B. Forecasting at Scale. Am. Stat. 2018, 72, 37–45. [Google Scholar] [CrossRef]
  57. Varian, H.R. Big Data: New Tricks for Econometrics. Am. Econ. Assoc. 2014, 28, 3–27. [Google Scholar] [CrossRef] [Green Version]
  58. Thesling, P. Machine Learning and Econometrics. Master’s Thesis, Maastricht University, Maastricht, The Netherlands, August 2015. [Google Scholar] [CrossRef]
  59. Einav, L.; Levin, J.D. The Data Revolution and Economic Analysis. NBER Work. Pap. 2013, 53, 1689–1699. [Google Scholar]
  60. Mullainathan, S.; Spiess, J. Machine Learning: An Applied Econometric Approach. J. Econ. Perspect. 2017, 31, 87–106. [Google Scholar] [CrossRef] [Green Version]
  61. Liu, Y.; Xie, T. Machine learning versus econometrics: Prediction of box office. Appl. Econ. Lett. 2019, 26, 124–130. [Google Scholar] [CrossRef]
  62. Řezanková, H. Cluster Analysis of Economic Data. Stat. Stat. Econ. J. 2014, 94, 73–86. [Google Scholar]
  63. Kembe, M.M. Statistics and Mathematical Sciences Cluster Analysis of Macroeconomic Indices. Res. Rev. J. Stat. Math. Sci. 2017, 3, 5–15. [Google Scholar]
  64. Augustyński, I.; Laskoś-Grabowski, P.P. Clustering Macroeconomic Time Series. Econom. Adv. Appl. Data Anal. 2018, 22, 74–88. [Google Scholar]
  65. Punma, C. Autonomous Vehicle Fleet Coordination With Deep Reinforcement Learning. In Proceedings of the ICLR International Conference on Learning Representations, Vancouver, BC, Canada, 30 April–3 May 2018; pp. 1–8. [Google Scholar]
  66. Sánchez, N.C.; Martinez, I.; Pastor, L.A.; Larson, K. Simulation study on the fleet performance of shared autonomous bicycles. arXiv 2021, arXiv:2106.09694. [Google Scholar]
  67. Nazari, M.; Oroojlooy, A.; Snyder, L.V.; Takáč, M. Deep Reinforcement Learning for Solving the Vehicle Routing Problem. Adv. Neural Inf. Process. Syst. 2018, 2, 1–13. [Google Scholar]
  68. Gružauskas, V.; Čalnerytė, D.; Fyleris, T.; Kriščiūnas, A. Application of multivariate time series cluster analysis to regional socioeconomic indicators of municipalities. Real Estate Manag. Valuat. 2021, 29, 39–51. [Google Scholar] [CrossRef]
Figure 1. Operationalization of key characteristics for the implementation of the framework, created by authors.
Processes 10 00852 g001
Figure 2. Conceptual model of integration of strategic, tactical and operational levels, created by authors.
Processes 10 00852 g002
Figure 3. System Thinking Adaptation to Supply Chain Management, created by authors.
Processes 10 00852 g003
Figure 4. E-commerce adaptation in the food industry for local production, created by authors.
Processes 10 00852 g004
Figure 5. The output of the elbow method, created by authors.
Processes 10 00852 g005
Figure 6. Decision tree of cluster assignment, created by authors.
Processes 10 00852 g006
Figure 7. EU food and agriculture index clustering, created by authors.
Processes 10 00852 g007
Table 1. Characteristics of Complex Adaptive System in Supply Chain Context, created by authors.
CharacteristicExpression
Distributed controlSupply chain members does not have a centralized control unit
Inter-dependent agentsSupply chain members has multiple inter-dependent interactions between themselves
Non-linearityInteractions between the supply chain members produces non-linier results i.e., chaotic
Not predictable in detailConstant disruptions causes the supply chain members to work in an unstable environment
AdaptabilitySupply chain member learns from experience and improves their operations constantly
Self-organizationSupply chain members without central control forms patterns and order
EmergenceInteractions between supply chain members causes macro level outcome
Table 2. Cluster group description by population, created by authors.
Cluster IDCountMeanSTDMinMaxIndicator
018799.5879.5517.20371.80Density
155142.5559.7586.10230.90
233291.40154.88121.90502.90
018735.949.2013.0054.30Distribution Cities
15543.956.1931.9051.90
23353.2513.7532.5076.80
018741.4513.214.0066.60Distribution Rural areas
15528.6416.0614.7070.63
23321.1117.601.9046.70
018722.6212.670.0053.20Distribution Towns and suburbs
15527.3813.9010.1647.30
23325.648.9212.9040.20
01876,276,4143,601,236461,23011,237,274Population size
15554,312,66020,634,49919,870,64782,500,849
23339,059,15919,076,97616,305,52664,875,165
Table 3. Cluster group description by agriculture sector, created by authors.
Cluster IDCountMeanSTDMinMaxIndicator
01872,021,2632,080,939153,53010,280,029Export
15511,121,8196,231,751485,02823,107,284
23311,447,32811,561,1611,706,61533,829,101
01872,503,8852,964,292215,47915,734,474Import
15515,080,06010,179,639545,37638,717,332
23312,637,4956,544,5762,233,85823,227,872
0187182,943207,7092000860,150Farm number
1551,405,3461,292,741275,6304,256,150
233678,492827,36264,2532,476,470
01871,914,7181,531,584157,8306,220,360Farms livestock unit
15514,023,4666,022,2874,662,73022,703,120
2339,996,5262,904,9146,388,10014,330,310
0187117,579119,6921537501,910Farms with livestock number
155801,3641,110,203125,1793,453,010
233418,928507,42743,7731,547,480
0187170,080153,7873417624,660Labor force directly employed unit
1551,020,426490,965507,5502,595,590
233822,706881,552110,3702,273,590
01873741256222210,346Standard output, mln euro
15537,17614,631987561,035
23319,568198116,08423,671
01872,626,0241,431,813129,1305,177,510Utilized agricultural area hectares
15518,854,9556,050,55711,594,11727,837,290
23311,142,1156,718,0961,831,05017,623,857
Table 4. Cluster group description by Food processing and manufacturing sector, created by authors.
Cluster IDCountMeanSTDMinMaxIndicator
01875,048,9176,850,754341,31133,286,320Export
15525,904,58117,414,472349,29365,516,750
23324,781,00117,307,8676,637,10661,249,222
01874,881,4424,657,000603,13124,266,014Import
15527,189,74116,067,0511,655,31659,401,626
23324,543,63512,790,4814,383,99543,473,595
018757,28231,0304152117,844Employment
155448,982212,547161,945817,024
233299,733130,359115,683428,771
01873873384512816,071Enterprise number
15535,26120,055750865,004
23384234213410516,050
01878801012356194Gross operating surplus
1556426303512510,558
23363623722317214,680
01879315841336238,615Production value
15592,41148,8766299157,322
23355,17020,29329,19798,253
018710,276916747041,070Turnover
155100,64654,7385329172,858
23361,11621,49628,674106,104
0187208217951508013Value added
15518,19510,18287933,015
23313,2757797522128,979
Publisher’s Note: MDPI stays neutral with regard to jurisdictional claims in published maps and institutional affiliations.

