Article

Research on Pore Pressure Detection While Drilling Based on Mechanical Specific Energy

School of Petroleum Engineering, Southwest Petroleum University, Chengdu 610500, China
*
Author to whom correspondence should be addressed.
Processes 2022, 10(8), 1481; https://doi.org/10.3390/pr10081481
Submission received: 15 June 2022 / Revised: 19 July 2022 / Accepted: 26 July 2022 / Published: 28 July 2022
(This article belongs to the Special Issue Oil and Gas Well Engineering Measurement and Control)

Abstract

:
The detection of the formation of pore pressure while drilling is of great importance to ensure safe drilling operations. At present, the dc-exponent concept is mainly used to detect pore pressure while drilling. The dc-exponent concept is based on the theory of shale compaction, which is limited when used in carbonate rocks. A mechanical specific energy (MSE)-based method is proposed to detect pore pressure in deep, complex intervals. The method is based on the theory that the energy consumed by the bit to break and remove a unit volume of rock can reflect the effective stress and pore pressure of the rock in situ. In this paper, a torque and weight on bit (WOB) transfer model is proposed for estimating the downhole torque and WOB using drill string mechanics. Meanwhile, the rotary speed and torque of the positive displacement motors under compound drilling are considered, and the model of total MSE under compound drilling is modified. The MSE-based method was used to estimate the pore pressure in a region in western Sichuan, and there is a good agreement between the detected and measured pore pressure. The results demonstrate that the accurate computed MSE-based method is useful in detecting pore pressure in deep complex intervals.

1. Introduction

Pore pressure is the pressure of the formation fluid within the pores of the soil or rock. In drilling engineering, accurate knowledge of pore pressure changes can provide a basis for the optimization of drilling fluid density and well structure design to avoid drilling incidents (e.g., well kicks/blowout and borehole collapse). There are three aspects of pore pressure analysis: pre-drill prediction, detection while drilling, and post-drill analysis [1]. The pre-drill prediction of pore pressure is usually based on seismic data combined with logging data from the offset wells. Detection while drilling mainly relies on logging while drilling (LWD), measurement while drilling (MWD) and drilling parameters. Post-drill analysis summarizes pore pressure in a developed region using logging data from drilled wells, which is an after-the-fact technique that can be used for pre-drill prediction in future wells.
Hottmann and Johnson [2] were probably the first to use logging data (sonic and resistivity) to make predictions of overpressure in shales. They found a linear relationship between the common logarithm of sonic transit time or resistivity and depth in hydrostatic pressure intervals, which they called the normal compaction trend (NCT). When entering anomalous pressure intervals, the sonic transit time or resistivity trend will be deflected. Pennebaker [3] was the first to apply seismic interval velocity data to the prediction of pore pressure. Under normal conditions, interval velocity increases with depth, and when an overpressure interval appears, it is often accompanied by a decrease in interval velocity. Based on data provided by Hottmann and Johnson, Gardner et al. [4] proposed an empirical equation that can be expressed as a direct form of pore pressure (Equation (1))
P p = σ v ( A B ln Δ t ) 3 ( O B G P ng ) Z 2
where P p is the formation pore pressure (psi); σ v is the normal overburden pressure (psi); Δ t is the sonic transit time ( μ s / ft ); O B G is the overburden pressure gradient (psi/ft); P ng is the normal fluid pressure gradient (psi/ft); Z is the depth (ft-TVD).
Eaton [5] proposed three sets of prediction equations for pore pressure based on resistivity, sonic transit time and the dc-exponent, respectively (Equations (2)–(4)). Estimation of pore pressures using Eaton’s model requires an accurate NCT and reliable input data, so that accurate pore pressure can be obtained.
P pg = O B G ( O B G P ng ) × ( R o R n ) 1 . 2
P pg = O B G ( O B G P ng ) × ( Δ t n Δ t o ) 3
P pg = O B G ( O B G P ng ) × ( d co d cn ) 1.2
where P pg is the formation pore pressure gradient (psi/ft); R o is the observed shale resistivity at a given depth (ohm-m); R n is the normal compaction shale resistivity at a given depth (ohm-m); Δ t o is the observed shale transit time at a given depth ( μ s / ft ); Δ t n is the normal compaction shale transit time at a given depth ( μ s / ft ); d co is the computed dc-exponent from the measured data at a given depth; and d cn is the dc-exponent from the normal compaction trend at a given depth.
Fillippone [6] proposed an empirical equation for predicting pore pressures through a comprehensive study of seismic, logging and drilling data in the Gulf of Mexico region (Equation (5)). The new empirical equation does not rely on the NCT and can be used as an effective pre-drill pore pressure prediction method [7].
P pg = v max v v max v min O B G
where v is the seismic interval velocity (ft/s); v min is the seismic interval velocity when rock rigidity is 0 (ft/s); and v max is the seismic interval velocity when formation porosity is 0 (ft/s).
Bowers [8] derived the empirical equations between effective stress and sonic velocity based on the effective stress principle. In this way, the pore pressure can be estimated from the sonic velocity. He considered the relationship between effective stress and sonic velocity from soil mechanics for different overpressure genesis. When the overpressure is caused by uncompaction, the relationship follows the original curve (Equation (6)), while when it is caused by the expansion of the fluid, the relationship follows the unloading curve (Equation (7)). The values of parameters A and B can be calibrated with offset sonic velocity versus effective stress data.
V = 5000 + A σ e B
V = 5000 + A [ σ max ( σ e σ max ) 1 U ] B
σ max = ( V max 5000 A ) 1 B
where V is the sonic velocity (ft/s); V max is the velocity at the onset of unloading (ft/s); σ e is the vertical effective stress (psi); and σ max is the vertical effective stress at the onset of unloading (psi).
Most current pore pressure prediction methods are applicable to shale intervals, where there is a strong relationship between porosity and pore pressure. In contrast, carbonate rocks are harder, and overpressure has a weak effect on porosity. Atashbari and Tingay [9] and Azadpour et al. [10] derived the relationship between the pore pressure and compressibility to estimate pore pressure in carbonate rocks (Equation (9)). By further studying the numerical empirical relationship between compressibility correlations and porosity, a simplified approximation of Equation (10) with only porosity and effective stress was obtained [11]. This new method requires sufficient logging and core data to obtain regional formation porosity and pore volume compressibility.
P p = ( ( 1 ϕ ) C b σ eff ( 1 ϕ ) C b ϕ C p ) γ
P p = ( ( 1 ϕ ) σ eff ( 1 2 ϕ ) ) γ
where ϕ is the formation porosity (fraction); C b is the bulk compressibility (psi−1); C p is the pore compressibility (psi−1); and σ eff is the effective overburden pressure (overburden pressure-hydrostatic pressure) (psi).
Due to complicated geological factors and variable causes of overpressure, the development of deep and ultra-deep wells makes it difficult to accurately predict the pore pressure simply by pre-drill prediction. Therefore, during the drilling process of deep and complicated formations, it is inevitable to carry out the detection of pore pressure while drilling. Real-time detection of pore pressure usually uses LWD and drilling parameters. LWD generally offers more accurate results than methods based on drilling parameters. However, the real-time performance of the LWD is not ideal because the LWD tool is positioned before the drill collar, slightly far from the bit. Moreover, there is a time delay in bottom hole data transmission [12]. Conversely, drilling parameters are real-time field data that are easily obtained in the drilling process. This paper is concerned with drilling parameter-based pore pressure detection.
Jorden and Shirley [13] proposed the concept of the d-exponent for pore pressure detection by normalizing the factors (WOB, rotary speed, bit diameter) affecting the rate of penetration (ROP). Making a normal compaction trend (NCT) in the shales, the d-exponent will increase linearly with depth in normal pressure intervals. When entering the overpressure intervals, the d-exponent will tend to deviate from the NCT in a decreasing trend. The degree of deviation of the d-exponent could reflect the degree of overpressure. During drilling, the increase in drilling fluid density will cover up the change in the d-exponent, and a corrected d-exponent was proposed (Equation (11)) [14]. However, based on shale compaction, it is not applicable for the d-exponent concept to detect pore pressure in carbonate formations.
d c = log ( 0.0547 R O P N ) log ( 0.0684 W O B D b ) × N P P E C D
where R O P is the rate of penetration (m/hr); N is the rotary speed (rpm); W O B is the weight on bit (kN); D b is the bit diameter (mm); N P P is the normal pore pressure (sg); and E C D is the equivalent circulating density (sg).
Belotti and Gerard [15] used the concept of sigmalog (rock strength parameter) to detect the pore pressure (Equation (12)), which was based on the relationship between rock strength, pore pressure and formation lithology. Likewise, the variation of sigmalog with depth can be plotted, and a trend line can be created. There are a number of factors that affect sigmalog, which can be divided into two aspects: geological factors and drilling parameters. The effect of factors other than pore pressure and porosity on the sigmalog can be excluded by correcting the equation and adjusting the trend line intercept. In this way, the pore pressure abnormality can be reflected by the inversion of the sigmalog curve. Based on the drilling strength of the rock, it is usually not obstructed by lithology in the detection of pore pressure. However, the application of the sigmalog method in carbonate rocks is practically not ideal [16].
σ = ( 1 + 1 1 + n 2 × Δ p 2 n × Δ p ) × [ W O B 0.5 × R O P 0.25 D b × N 0.25 + 0.028 × ( 7 h 1000 ) ]
where σ presents the rock strength parameter; n is the hole cleaning coefficient; Δ p is the pressure difference between the drilling fluid and the hydrostatic pressure, kg/L; and h is the drilling depth, m.
Recently, research on pore pressure detection about drilling parameters has begun to use the mechanical specific energy (MSE) model. The original model of MSE was proposed by Teale [17], which reflects the energy required to break and remove a unit volume of rock. It is widely used for real-time detecting of drilling efficiency, optimization of drilling parameters, downhole identification of inefficient working conditions, and lithology identification [18,19,20,21,22,23,24,25,26,27].
Cardona [28] was probably the first to use the MSE concept to detect pore pressure. Subsequently, Majidi et al. [29] proposed a method to detect pore pressure through downhole drilling parameters and in situ rock data using the concept of drilling efficiency and mechanical specific energy (DE-MSE). The pore pressure was expressed as a function of equivalent circulating density (ECD), DE, MSE, angle of internal friction, and uniaxial compressive strength (UCS) of the rock (Equation (13)). Among them, the angle of internal friction and UCS of the rock are computed from the compressional velocity and based on empirical equations (Equations (14) and (15)).
P p = E C D ( D E trend × M S E U C S ) × ( 1 sin θ 1 + sin θ )
D E trend = a ϕ n b
θ = 18.53 V p 0 . 5148
U C S = 145 × 0.43 V p 3 . 2
where P p is the formation pore pressure (psi); D E trend is the normal drilling-efficiency trendline; M S E is the mechanical specific energy (psi); U C S is the uniaxial compressive strength of the rock (psi); θ is the angle of internal friction (degrees); ϕ n is the normal compaction porosity trendline(fraction); and V p is the compressional velocity (km/s).
Not taking into account the energy of hydraulic shock-assisted rock breaking, the MSE model may have some limitations in estimating pore pressure in a soft rock environment. An actual calculation case of a shallow interval shows that the contribution of hydraulic energy to the total energy is up to 20% [30]. Therefore, Oloruntobi et al. [31] and Oloruntobi and Butt [32] applied the hydro-rotary specific energy (HRSE) model (Equation (17)) and the hydro-mechanical specific energy (HMSE) model (Equation (18)) to overcome this limitation. The HMSE model was originally proposed by Mohan et al. [33], which includes axial, torsional, and hydraulic energy. However, in conventional drilling, the assisted breaking effect of hydraulic energy is relatively weak, so the HMSE model is more suitable for high-pressure jet drilling. Moreover, for some deep wells and ultra-deep wells, the deep rocks are harder. The role of hydraulic rock breaking is rather limited compared to torsional rock breaking, and the MSE should be the main focus.
H R S E = 120 π × N × T + 6 × 10 4 η × Δ P b × Q A b × R O P
H M S E = W O B e × R O P + 120 π × N × T + 6 × 10 4 η × Δ P b × Q A b × R O P
where H M S E is the hydro-mechanical specific energy (MPa); W O B e is the effective weight on bit (N); T is the torque (N-m); A b is the bit area (mm2); η is the hydraulic energy reduction factor; Δ P b is the bit pressure drop (MPa); and Q is the flow rate (L/min).
Cui et al. [34] considered the MSE model under compound drilling (Equation (19)), in which the bit is driven by both surface drive and a positive displacement motor (PDM). The rotary speed and torque on the bit are both a combination of surface drive and PDM. In addition, PDM is powered by drilling fluid and transmits power to the bit. The contribution of PDM to total energy may indirectly account for the hydraulic energy term.
M S E = E f × [ W O B A b + 120 π × ( N + Q q ) × ( T + 159.24 q × Δ P ) A b × R O P ]
where E f is the Energy efficiency (fraction); q is the flow rate of the hollow rotor (L/r); and Δ P is the PDM pressure drop (MPa).
Torque and WOB are the main variables of the MSE, and in the absence of reliable downhole measurements, torque is usually calculated using the model proposed by Pessier and Fear [35] for estimating torque from WOB, the bit sliding friction coefficient and the bit diameter (Equation (20)). However, the torque estimated in this way is essentially a function of WOB, which may not take into account the role of torque. Majidi et al. [29] emphasized the importance of downhole drilling parameters, especially the torque, by comparing MSE calculated from the surface and downhole parameters. In the absence of reliable downhole measurements, some studies have attempted to estimate friction losses along the drill string by considering wellbore geometry and drilling equipment parameters [36,37,38]. These new technologies use surface drilling parameters and drill string mechanics to estimate more accurate drilling parameters at the bit in real-time.
T = μ × W O B × D b 3000
where μ is the bit coefficient of sliding friction.
In this paper, a pore pressure detection method based on MSE is proposed. The new method estimates the downhole parameters from surface measurements when reliable downhole measurements are not available. Meanwhile, the model of total MSE under compound drilling was modified by considering the effects of the PDM.

2. Theory

Teale defined MSE as the energy required to break and remove a unit volume of rock by the bit, which is related to the strength of the rock (Equation (21)). It was confirmed by experiments that the minimum MSE is roughly equal to the compressive strength of the material drilled [17]. The effective stress is also related to the compressive strength of the rock [39]. Moreover, the dependence of MSE on pore pressure was experimentally verified in rock samples [40,41]. Therefore, the MSE obtained while drilling can reflect the effective stress of the rock to some extent. The higher the effective stress, the greater the strength of the rock, and the more MSE is required. At the same depth, overpressure intervals with lower effective stress require less MSE than normal pore pressure intervals, and then the pore pressure can be reflected indirectly.
M S E = W O B A b + 120 π × N × T A b × R O P

2.1. Downhole Parmeters

In the model of MSE, WOB and torque are the main variables. For conventional drilling, there is generally a lack of the downhole WOB and torque measurements, so they are considered to be computed from surface measurements (hook load, wellhead torque). In some high-angle wells, especially directional and horizontal wells, the friction between the tubular and wellbore wall is high, and there might be beds of cuttings. Therefore, the influence of friction during the transmission of WOB and torque should be considered.
The following assumptions can be made for obtaining a simplified soft rod model for estimating the friction: (1) the force and deformation of the drill string are within the elastic range; (2) the borehole curvature of the calculation unit is a constant; (3) the drill string touches the upper or lower side of the well wall with the same curvature; (4) the shear forces on the cross-section of the drill string are neglected, and the effect of the drill string stiffness is disregarded, but the drill string can withstand axial pressure; (5) the influence of the dynamic effect of the drill string is neglected. The downhole WOB and torque are calculated by Equation (22) and Equation (23), respectively [42]. Here, in the Figure 1, the models for both WOB and torque are transcendental equations that need to be solved using numerical calculations. A trial value is first taken at the bit, and the WOB and torque are calculated from the bit to the wellhead by unit. Then, the trial results are compared with the actual torque and hook load at the wellhead, respectively. Based on the error, the trial value at the bit is adjusted for iteration.
Where F i is the axial force at the lower end of the unit (N); F i 1 is the axial force at the upper end of the unit (N); q m is the floating weight of the unit in the drilling fluid (N/m); L i is the length of the i-th unit (m); β i is the overall angle change rate of the i-th unit (rad); T i is the torque at the lower end of the unit (N-m); and T i 1 is the torque at the upper end of the unit (N-m).
F i 1 = F i + q m L i cos α ¯ i μ i | N i | cos β i 2 cos Δ α i 2
T i 1 = T i + μ t r i | N i |
β i = cos 1 ( cos α i 1 cos α i + sin α i 1 sin α i cos Δ ϕ )
N i = ( F i Δ ϕ sin α ¯ i ) 2 + ( F i Δ α i + q m L i sin α ¯ i ) 2
where α ¯ i is the average of the well slope angles at the ends of the i-th unit (rad); μ i is the friction coefficient of the i-th unit; N i is the radial support force on the i-th unit (N); Δ α i is the incremental well slope angle of the i-th unit (rad); μ t is the circumferential friction coefficient; r i is the radius of curvature of the i-th unit (m); α i is the well slope angle at the lower end of the unit (rad); α i 1 is the well slope angle at the upper end of the unit (rad); Δ ϕ is the azimuth increment (rad); and Δ α i is the incremental well slope angle of the i-th unit (rad).

2.2. Drilling Parameters under Compound Drilling

There are two sources of power for the bit: one is the surface drive, usually the rotary table (RT) or the top drive system (TDS), and the other is the positive displacement motor (PDM). Under compound drilling, the bit is driven by both the surface drive and the PDM (RT/TDS + PDM). Therefore, the torque of the bit consists of the torque of the RT and the PDM, and the rotary speed of the bit is calculated in the same way [34]. The PDM is a volumetric power drilling tool driven by high-pressure drilling fluid. It is characterized by an output shaft torque proportional to the pressure drop of the drilling fluid in it and a rotary speed proportional to the flow rate of the drilling fluid. The total rotary speed and total torque of the bit are calculated by Equation (26) and Equation (27), respectively.
N t = N + Q q
T t = 159.24 q Δ P + T 0 i = 1 n μ t r i | N i |
where N t is the total rotary speed under compound drilling (rpm); T t is the total torque under compound drilling (N-m); and T 0 is the wellhead torque (N-m).
The pressure drop of the PDM can be calculated by Equations (28)–(32) [43].
Δ P = ( Q Q 0 ) 1.8 P 0 + k ( a w + b w 2 ) f
a = T 1 T max ( W 1 W max ) 2 W 1 W 1 2 W max
b = T 1 a W 1 W 1 2
f = ln P 1 P 0 P max P 0 ln T 1 T max
k = P 1 P 0 T 1 f
where Q 0 is the maximum permissible flow rate of PDM (L/min); P 0 is the pressure drop at idle at a maximum flow rate of PDM (MPa); w is the weight on bit (kN); T 1 is the output torque of PDM (kN-m); T max is the maximum torque of PDM (kN-m); W 1 is the working weight on bit (kN); W max is the maximum permissible weight on bit for PDM (kN); P 1 is the recommended working pressure drop of the PDM (MPa); P max is the maximum allowable pressure drop of the PDM (MPa).

2.3. Normal Trendline

During drilling, excessive pressure overbalance conditions will increase the resistance of rocks and cuttings to the bit, which may result in a reduction in ROP and increase the MSE [32]. Therefore, the MSE was corrected with the regional normal pore pressure ratio on equivalent circulation density (Equation (33)).
M S E = ( W O B A b + 120 π × N t × T t A b × R O P ) × N P P E C D
We plot the MSE with depth on a semi-log. The interval with clean shale and reliable drilling parameters data is selected as the target interval for establishing the normal trendline. For the abnormal points on the curve of the target interval, the values of MSE are smoothed out by moving the average filtering of the five-point bell-shaped function (Equation (34)) [44]. The coefficients β , γ and ε take the values 0.11, 0.24 and 0.3, respectively.
M S E i = β ( M S E i 2 + M S E i + 2 ) + γ ( M S E i 1 + M S E i + 1 ) + ε M S E i

2.4. Estimation of Pore Pressure

For the assessment of the formation of pore pressure, Eaton’s model based on MSE is used (Equation (35)). The Eaton exponent (m) is a regional factor, and it can be obtained from any known overpressure intervals in the offset or current wells [32]. The Eaton exponent is estimated by substituting the overburden pressure, pore pressure, regional normal pore pressure, MSE, and the MSE from the corresponding normal trendline into Equation (36) for the target calibration interval, where the overburden pressure is obtained by integrating the formation bulk density logs.
G pp = G ob ( G ob - G np ) × ( M S E M S E n ) m
m = log ( G ob G pp G ob G np ) log ( M S E M S E n )
where G pp is the formation pore pressure gradient (sg); G ob is the overburden formation pressure gradient (sg); G np is the normal pore pressure gradient (sg); M S E n is the MSE from the normal trendline at a given depth (MPa); and m is the Eaton exponent.

2.5. Methodology

(1)
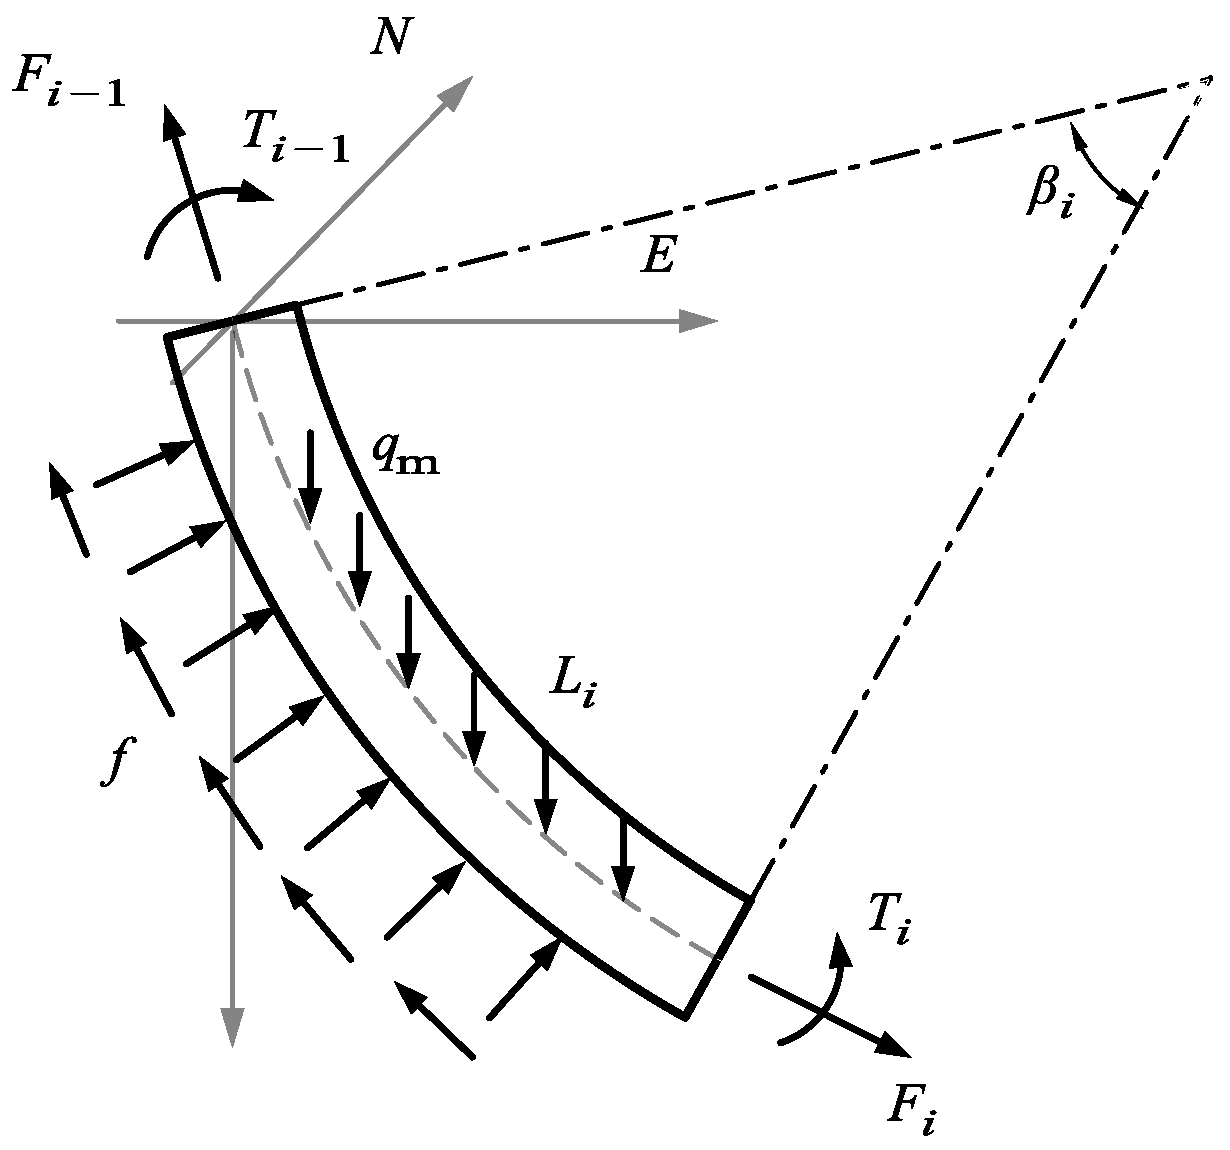
The downhole parameters were numerically solved using Equations (22)–(25) based on the well geometry, bottom hole assembly (BHA), and surface measurements. When using PDM, we estimated its contribution to bit torque and rotary speed using Equations (26)–(32) based on the permissible and recommended parameters of the PDM.
(2)
We calculated the MSE at a given depth using Equation (33) and plotted the MSE against depth on a semi-log.
(3)
We selected a clean shale interval with reliable drilling parameters to establish the normal trend line, which can be appropriately filtered for abnormal points.
(4)
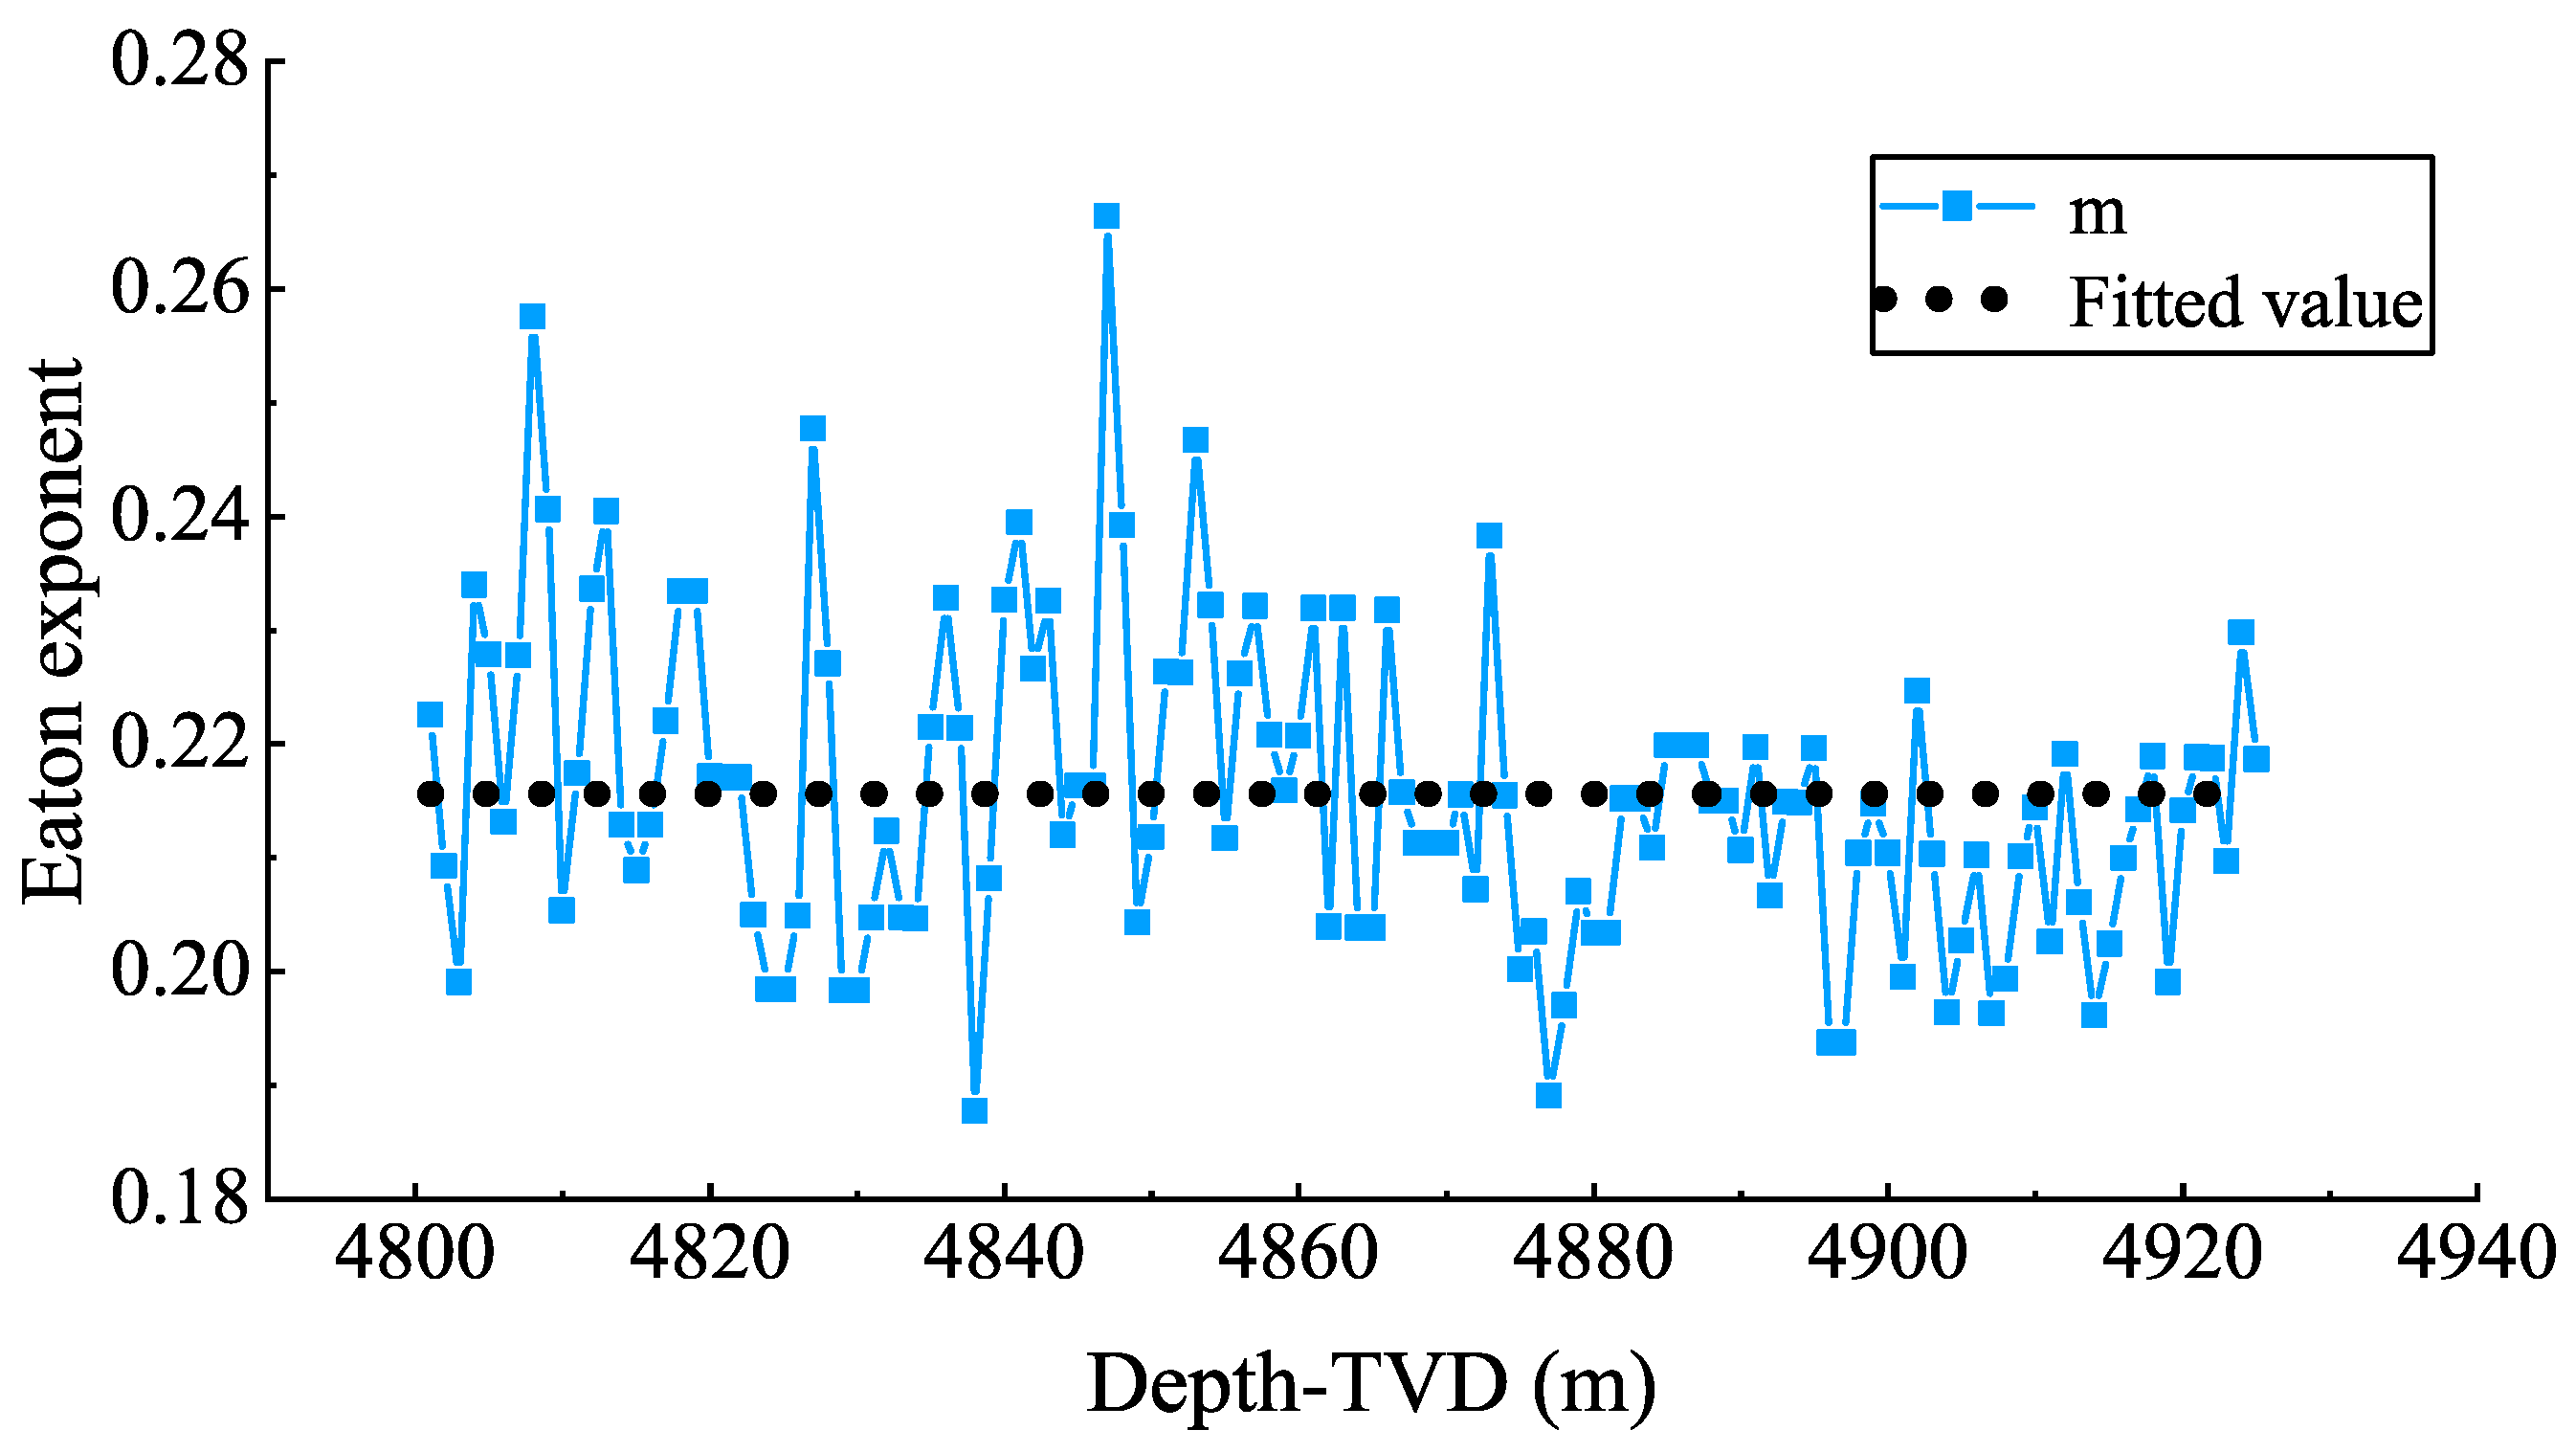
The Eaton exponent can be corrected by Equation (36) in overpressure intervals with clear pore pressure from the offset or current well. Then, the pore pressure at a given depth can be estimated using Eaton’s model.

3. Results

To demonstrate the applicability of the new technique in deep and complicated lithological formations, we took well L and well M in a region in western Sichuan as case studies. In this paper, all depths were referenced to the true vertical depth (TVD) below the rotary table. The marine strata start from the Leikoupo Formation at about 3850 m in this region, and the strata above the Leikoupo Formation are dominated by clastic rocks such as mud, shale, and sandstone, while limestone and dolomite gradually become the main lithology in the following strata. According to the actual pore pressure measurements in the overpressure intervals of the offset wells, the pore pressure gradient is about 1.70 sg in this region near 4925 m. Therefore, the interval in well L near this depth was selected as the calibration interval for the Eaton exponent. As shown in Figure 2, the average Eaton exponent was fitted to 0.226.
The well M is a sidetracking well, 6510 m deep, and was sidetracked from 5195 m with a maximum inclination of 20.12 degrees. In this well, PDM was used extensively for compound drilling, so both the influence of wellbore friction and the contribution of PDM to the total MSE should be considered. The most realistic downhole parameters can be obtained using MWD tools, but they are costly. Here, the downhole torque was computed from surface measurements (hook load and wellhead torque), and the results are plotted in the Figure 3b. The overall compliant trend of downhole torque is lower than the wellhead torque due to the friction of the drill string with the wellbore wall. Moreover, as the depth increases, the friction gradually increases. In the absence of reliable torque measurements, some studies have estimated torque from WOB, bit coefficient of sliding friction and bit size. The same operation was made here. The sliding friction coefficient of the bit is related to the type of bit, lithology, rock strength, mud weight and bit wear. To minimize the error in calculating MSE, it is reasonable to take 0.25 for roller-cone bits and 0.5 for poly-crystalline-diamond-compact (PDC) bits [45].
Since the friction coefficient between the drill string and the well wall was not sufficiently known in well M, the WOB was calculated using the data from the field. The WOB recorded in the field used the total weight of the drill string minus the hook load measured while drilling, which may have some error with the real WOB; we simply take a trend of variation. In fact, the contribution of WOB to MSE is rather limited compared to torque, especially in deep intervals where PDC bits are mainly used, and rocks are largely broken by the shearing of the bit.
The section from 1950 m to 6125 m was under compound drilling conditions. Based on the type of PDM and flow rate used in each section, the torque and rotary speed of the PDM were calculated. In contrast to the rotary table, the PDM drive is the main power for the bit during compound drilling. Combining the torque and rotary speed of the rotary table, the total torque and total rotary speed were calculated separately, as plotted in Figure 3.
Taking the sidetrack section in the well M as an example, the MSE was computed by using the wellhead torque, the downhole torque, and the torque estimated from WOB, respectively. Figure 4 illustrates the comparison of the pore pressure detection results for these three cases.
The differences in the comparison of the MSE plotted in Figure 4b are striking, especially since the MSE computed from the torque estimated by the WOB is significantly lower than in the other two cases, indicating the high sensitivity of the MSE to torque. Typically, the mud weight (MW) has a safety adder of 0.07 to 0.15 sg compared to pore pressure. In Figure 4c, the MW was reduced by 0.15 sg to serve as a rough reference for the comparison of pore pressure detection values. It can be observed that the overall low pore pressure reflected in the case of using wellhead torque, the detected values range from 1.27 to 2.35 sg with an average of 1.85 sg. The MSE computation based on the wellhead torque does not take into account the effect of downhole friction, resulting in a high reflected effective stress and low pore pressure. In contrast to the former, when calculating MSE based on downhole torque, downhole friction is taken into account, and pore pressure detection is fairly close to the reference line of pore pressure estimated from MW, ranging from 1.34 to 2.38 sg with an average of 1.92 sg. Interestingly, in the case of torque estimated from WOB, since the MSE values are overall significantly lower than the previous two cases, the final indirectly reflected pore pressure detection trend is instead closer to the reference line, especially in the interval from 5395 m to 5944 m. Similarly, acceptable downhole torque appears to be achieved with a more reasonable bit sliding friction coefficient.

4. Discussion

Here, a comparison between the dc-exponent method and the MSE-based method is performed for the entire section from 1960 m to the bottom of the well. Gas drilling was performed in the 361 m to 1950 m section of the well M, and the overall low dc-exponent values were tried to correct. Of these, a normally compacted, clean mudstone section from 430 m to 960 m was used for the establishment of NCT for the dc-exponent. Simultaneously, large changes in bit diameter and drilling fluid density in subsequent sections usually cause significant changes in the dc-exponent, which are easily misinterpreted as significant changes in pore pressure. Therefore, an attempt was made to correct the bit diameter and drilling fluid density for the NCT-established section to re-establish the NCT for the new section.
In well M, actual pore pressure measurements from two offset wells were used as a rough reference because the measured pore pressure data were not sufficient. In the section above 3850 m, the main lithologies are mudstone, sandstone and shale. As can be observed in Figure 5, both the dc-exponent and MSE-based methods provide reasonable estimates of pore pressure, and the MSE-based method has less scattering in its estimates. However, in the section above 2891 m, the MSE-based method appears to over-detect the pore pressure, and the dc-exponent provides more practical estimates. In the section below 3850 m, where the predominant lithologies are limestone, dolomite and gypsum, the pore pressure estimated by the MSE-based method matches better with the measured values in the current and offset wells. Meanwhile, it can be found that the dc-exponent approximately presents a tendency to a stable value at each hole section in the marine carbonate formation. The carbonate skeleton is stiffer, and its porosity does not necessarily tend to decrease with increasing burial depth, which may lead to the dc-exponent not being sensitive enough to changes in pore pressure.
Notably, the entire section from 1960 m to the bottom of the well was drilled extensively with PDM in conjunction with PDC bits. Both sections from 3174 m to 3850 m and 6141 m to 6189 m were replaced with roller-cone bits. Additionally, for both dc-exponent and MSE, the pore pressure estimates near the freshly replaced bits show varying degrees of scattering. The type of bits and the degree of wear on the bits both have a significant impact on the drilling efficiency and MSE. Therefore, when the bit is changed frequently and the bit wear is high, the MSE may not accurately reflect the effective stress, and the MSE-based method should be used with caution. Especially when drilling through pressure transition zones, the above factors can mask overpressure conditions.

5. Conclusions

(1)
A mechanical-specific energy-based drilling parameter method is proposed and validated to provide reasonable pore pressure estimates in deep complex lithologic intervals. The computation of MSE uses downhole parameters as far as possible. When reliable downhole measurements are lacking, a method based on drill string mechanics is proposed to estimate friction losses along the drill string by considering wellbore geometry and surface drilling parameters. In this way, more accurate drilling parameters at the bit can be obtained in real-time.
(2)
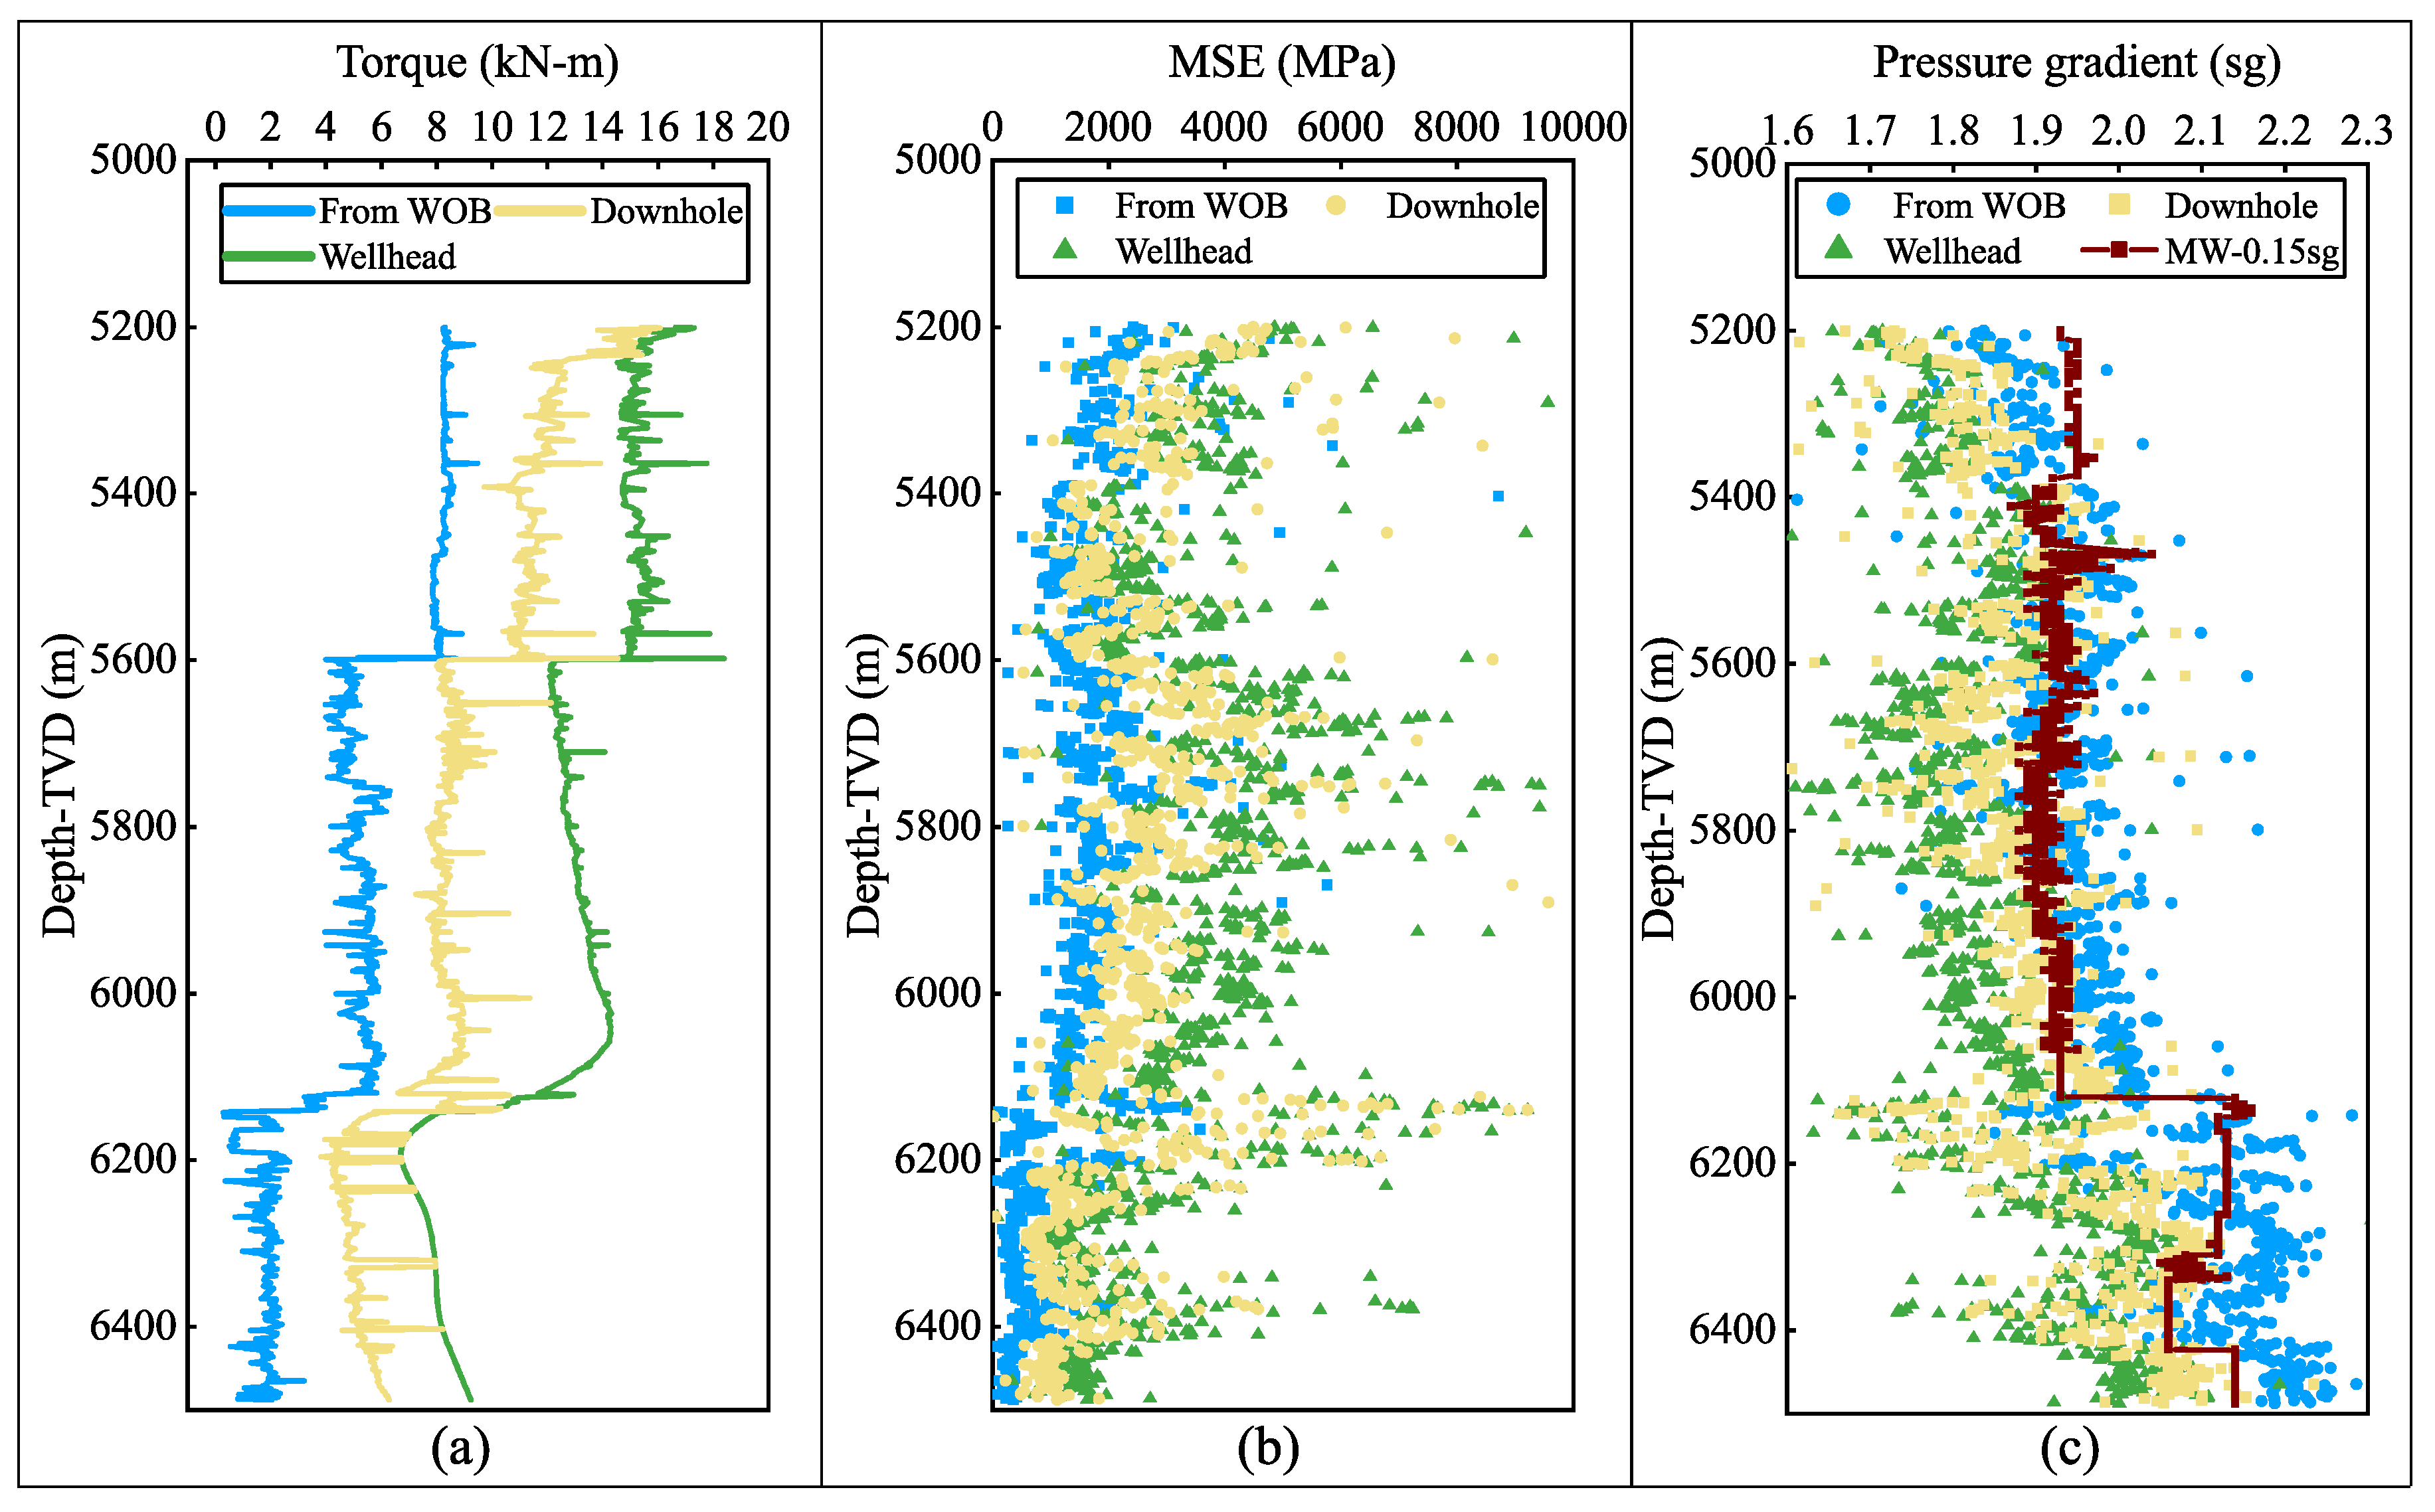
Torsional energy is the primary source of contribution to MSE, and MSE-based pore pressure detection is highly sensitive to downhole torque. More attention and effort should be paid to the measurement and estimation of downhole torque. It should also be noted that when using PDM, the contribution of the PDM to the total MSE needs to be fully considered.
(3)
The new method relies on trend lines and requires correction of the Eaton exponent, which has the influence of subjectivity. Moreover, all factors that are not related to pore pressure but can lead to significant changes in MSE may cause the overpressure conditions to be masked. At this point, the MSE-based method needs to refer to log data and actual drilling conditions from offset wells.

Author Contributions

Methodology, H.Y., H.C. and J.G.; investigation, H.Y., H.C. and J.G.; resources, H.Y.; writing—original draft preparation, H.C.; writing—review and editing, H.Y. and H.C. All authors have read and agreed to the published version of the manuscript.

Funding

This research was funded by the National Key Research and Development Program of China (grant number 2019YFA0708302).

Institutional Review Board Statement

Not applicable.

Informed Consent Statement

Not applicable.

Data Availability Statement

Not applicable.

Conflicts of Interest

The authors declare no conflict of interest.

References

  1. Zhang, J. Pore pressure prediction from well logs: Methods, modifications, and new approaches. Earth-Sci. Rev. 2011, 108, 50–63. [Google Scholar] [CrossRef]
  2. Hottmann, C.E.; Johnson, R.K. Estimation of formation pressures from log–derived shale properties. J. Pet. Technol. 1965, 17, 717–722. [Google Scholar] [CrossRef]
  3. Pennebaker, E.S. Seismic data indicate depth, magnitude of abnormal pressure. World Oil 1968, 166, 73–78. [Google Scholar]
  4. Gardner, G.H.; Gardner, L.W.; Gregory, A.R. Formation velocity and density—The diagnostic basics for stratigraphic traps. Geophysics 1974, 39, 770–780. [Google Scholar] [CrossRef] [Green Version]
  5. Eaton, B.A. The equation for geopressure prediction from well logs. In Proceedings of the Fall Meeting of the Society of Petroleum Engineers of AIME, Dallas, TX, USA, 1 January 1975. [Google Scholar]
  6. Fillippone, W.R. On the prediction of abnormally pressured sedimentary rocks from seismic data. In Proceedings of the Offshore Technology Conference, Houston, TX, USA, 30 April 1979. [Google Scholar]
  7. Wang, L.; Yang, R.; Sun, Z.; Wang, L.; Guo, J.; Chen, M. Overpressure: Origin, Prediction, and Its Impact in the Xihu Sag, Eastern China Sea. Energies 2022, 15, 2519. [Google Scholar] [CrossRef]
  8. Bowers, G.L. Pore pressure estimation from velocity data: Accounting for overpressure mechanisms besides undercompaction. SPE Drill. Complet. 1995, 10, 89–95. [Google Scholar] [CrossRef]
  9. Atashbari, V.; Tingay, M.R. Pore pressure prediction in carbonate reservoirs. In Proceedings of the SPE Oil and Gas India Conference and Exhibition, Mumbai, India, 4–6 April 2012. [Google Scholar]
  10. Azadpour, M.; Manaman, N.; Kadkhodaie-Ilkhchi, A.; Sedghipour, M. Pore pressure prediction and modeling using well-logging data in one of the gas fields in south of Iran. J. Pet. Sci. Eng. 2015, 128, 15–23. [Google Scholar] [CrossRef]
  11. Atashbari, V. Origin of Overpressure and Pore Pressure Prediction in Carbonate Reservoirs of the Abadan Plain Basin. Ph.D. Thesis, The University of Adelaide, Adelaide, Australia, November 2016. [Google Scholar]
  12. Chen, X.; Cao, W.; Gan, C.; Wu, M. A hybrid partial least squares regression-based real time pore pressure estimation method for complex geological drilling process. J. Pet. Sci. Eng. 2022, 210, 109771. [Google Scholar] [CrossRef]
  13. Jorden, J.R.; Shirley, O.J. Application of drilling performance data to overpressure detection. J. Pet. Technol. 1966, 18, 1387–1394. [Google Scholar] [CrossRef]
  14. Rehm, B.; McClendon, R. Measurement of formation pressure from drilling data. In Proceedings of the Fall Meeting of the Society of Petroleum Engineers of AIME, New Orleans, LA, USA, 3 October 1971. [Google Scholar]
  15. Belotti, P.; Gerard, R.E. Istantaneous log indicates porosity and pore pressure. World Oil 1976, 183, 90–94. [Google Scholar]
  16. Wang, Z. Detection of abnormal pressure while drilling in carbonate formations of northeastern Sichuan Basin. Acta Pet. Sin. 2012, 33, 1068–1075. [Google Scholar]
  17. Teale, R. The concept of specific energy in rock drilling. International Journal of Rock Mechanics and Mining Sciences and Geomechanics Abstracts. Pergamon 1965, 2, 57–73. [Google Scholar] [CrossRef]
  18. Pinto, C.N.; Lima, A.L.P. Mechanical specific energy for drilling optimization in deepwater Brazilian salt environments. In Proceedings of the IADC/SPE Asia Pacific Drilling Technology Conference, Singapore, 24 August 2016. [Google Scholar]
  19. Wei, M.; Li, G.; Shi, H.; Shi, S.; Li, Z.; Zhang, Y. Theories and applications of pulsed-jet drilling with mechanical specific energy. SPE J. 2016, 21, 303–310. [Google Scholar]
  20. Zhou, Y.; Zhang, W.; Gamwo, I.; Lin, J.S. Mechanical specific energy versus depth of cut in rock cutting and drilling. Int. J. Rock Mech. Min. Sci. 2017, 100, 287–297. [Google Scholar] [CrossRef]
  21. Hassan, A.; Elkatatny, S.; Al-Majed, A. Coupling rate of penetration and mechanical specific energy to Improve the efficiency of drilling gas wells. J. Nat. Gas Sci. Eng. 2020, 83, 103558. [Google Scholar] [CrossRef]
  22. Mazen, A.Z.; Rahmanian, N.; Mujtaba, I.M.; Hassanpour, A. Effective mechanical specific energy: A new approach for evaluating PDC bit performance and cutters wear. J. Pet. Sci. Eng. 2021, 196, 108030. [Google Scholar] [CrossRef]
  23. Nystad, M.; Aadnøy, B.S.; Pavlov, A. Real-time minimization of mechanical specific energy with multivariable extremum seeking. Energies 2021, 14, 1298. [Google Scholar] [CrossRef]
  24. Yu, B.; Zhang, K.; Niu, G. Rock strength determination based on rock drillability index and drilling specific energy: Numerical simulation using discrete element method. IEEE Access 2021, 9, 43923–43937. [Google Scholar] [CrossRef]
  25. Oloruntobi, O.; Butt, S. Application of specific energy for lithology identification. J. Pet. Sci. Eng. 2020, 184, 106402. [Google Scholar] [CrossRef]
  26. Khalilidermani, M.; Knez, D. A Survey of Application of Mechanical Specific Energy in Petroleum and Space Drilling. Energies 2022, 15, 3162. [Google Scholar] [CrossRef]
  27. Yassien, M.A.; Sayed, M.A.; Boghdady, G.Y.; Ali, M.A.M.; Mohamed, A.S. Experimental research into the effect of some operation factors and rock properties on the rate of penetration. Min. Miner. Depos. 2020, 14, 38–43. [Google Scholar] [CrossRef]
  28. Cardona, J. Fundamental Investigation of Pore Pressure Prediction during Drilling from the Mechanical Behavior of Rocks. Ph.D. Thesis, Texas A&M University, College Station, TX, USA, 2011. [Google Scholar]
  29. Majidi, R.; Albertin, M.; Last, N. Pore-pressure estimation by use of mechanical specific energy and drilling efficiency. SPE Drill. Complet. 2017, 32, 97–104. [Google Scholar] [CrossRef]
  30. Mohan, K.; Adil, F.; Samuel, R. Comprehensive hydromechanical specific energy calculation for drilling efficiency. J. Energy Resour. Technol. 2015, 137, 1–8. [Google Scholar] [CrossRef]
  31. Oloruntobi, O.; Adedigba, S.; Khan, F.; Chunduru, R.; Butt, S. Overpressure prediction using the hydro-rotary specific energy concept. J. Nat. Gas Sci. Eng. 2018, 55, 243–253. [Google Scholar] [CrossRef]
  32. Oloruntobi, O.; Butt, S. Energy-based formation pressure prediction. J. Pet. Sci. Eng. 2019, 173, 955–964. [Google Scholar] [CrossRef]
  33. Mohan, K.; Adil, F. Tracking Drilling Efficiency Using Hydro-Mechanical Specific Energy. In Proceedings of the SPE/IADC Drilling Conference and Exhibition, Amsterdam, The Netherlands, 17–19 March 2009. [Google Scholar]
  34. Cui, M.; Li, J.; Ji, G.; Chen, Y. Optimize method of drilling parameter of compound drilling based on mechanical specific energy theory. Pet. Drill. Tech. 2014, 42, 66–70. [Google Scholar]
  35. Pessier, R.C.; Fear, M.J. Quantifying common drilling problems with mechanical specific energy and a bit-specific coefficient of sliding friction. In Proceedings of the SPE Annual Technical Conference and Exhibition, Washington, DC, USA, 4–7 October 1992. [Google Scholar]
  36. Jacques, A.; Ouenes, A.; Dirksen, R.; Paryani, M.; Rehman, S.; Bari, M. Completion Optimization While Drilling–Geomechanical Steering Towards Fracable Rock Using Corrected Mechanical Specific Energy. In Proceedings of the SPE/AAPG/SEG Unconventional Resources Technology Conference, Austin, TX, USA, 24–26 July 2017. [Google Scholar]
  37. Ouenes, A.; Dirksen, R.; Paryani, M.; Rehman, S.; Bari, M. Completion Optimization While Drilling–Geomechanical Steering towards Fracable Rock for Optimal Selection of Stage Spacing and Cluster Density in Unconventional Wells. In Proceedings of the SPE Kingdom of Saudi Arabia Annual Technical Symposium and Exhibition, Dammam, Saudi Arabia, 24–27 April 2017. [Google Scholar]
  38. Kalinec, J.; Paryani, M.; Ouenes, A. Estimation of 3D Distribution of Pore Pressure from Surface Drilling Data–Application to Optimal Drilling and Frac Hit Prevention in the Eagle Ford. In Proceedings of the SPE/AAPG/SEG Unconventional Resources Technology Conference, Denver, CO, USA, 22–24 July 2019. [Google Scholar]
  39. Chen, T.; Guan, Z. Drilling Engineering Theory and Technology, 1st ed.; Petroleum University Publishing House: Dongying, China, 2000; pp. 35–36. [Google Scholar]
  40. Akbari, B.; Miska, S.; Mengjiao, Y.; Ozbayoglu, E. Effect of rock pore pressure on mechanical specific energy of rock cutting using single PDC cutter. In Proceedings of the 47th US Rock Mechanics/Geomechanics Symposium, San Francisco, CA, USA, 23–26 June 2013. [Google Scholar]
  41. Akbari, B.; Miska, S.; Yu, M.; Ozbayoglu, M. Experimental investigations of the effect of the pore pressure on the MSE and drilling strength of a PDC bit. In Proceedings of the SPE Western North American and Rocky Mountain Joint Meeting, Denver, CO, USA, 16–18 April 2014. [Google Scholar]
  42. Li, Q.; Chen, Z. Frictional resistance computation of setting casing in highly deviated well. Nat. Gas Ind. 1993, 13, 50–54. [Google Scholar]
  43. Zhang, X.; Liu, X.; Xia, H.; Tao, Q.; Peng, M. Drawdown analysis and calculation of helicoid hydraulic motor. Fault-Block Oil Gas Field 2006, 13, 60–61. [Google Scholar]
  44. Hu, Z.; Yuan, B.; Zhang, X.; Han, B.; Li, Y.; Lai, F.; Li, Y. Application of evaluation technique of bit efficiency while drilling. Mud Logging Eng. 2019, 30, 1–7. [Google Scholar]
  45. Guan, Z.; Hu, H.; Wang, B.; Sun, M.; Liu, Y.; Xu, Y. Experimental study on rock-breaking efficiency of PDC bit based on mechanical specific energy and sliding frictional coefficient. J. China Univ. Pet. (Ed. Nat. Sci.) 2019, 43, 92–100. [Google Scholar]
Figure 1. Force analysis for drill string unit [42].
Processes 10 01481 g001
Figure 2. Estimation of the Eaton exponent from well L.
Processes 10 01481 g002
Figure 3. Drilling parameters under compound drilling for well M. (a) shows the weight on bit data; (b) plots the theoretical total torque on the bit, considering downhole friction and PDM; (c) presents the theoretical rotary speed of the bit under compound drilling.
Processes 10 01481 g003
Figure 4. Comparison of detection results using torque from the wellhead, downhole and WOB for well M. (a) shows the torque from the wellhead, downhole and WOB; (b) plots the MSE computed from the different torque source; (c) presents the pore pressure detection values for the three cases.
Processes 10 01481 g004
Figure 5. Comparison of the MSE-based method and dc-exponent method for the pore pressure detection in well M. (a) The NCT of dc-exponent method; (b) the NCT of MSE-based method; (c) comparison of pore pressure detection between the dc-exponent method and MSE-based method.
Processes 10 01481 g005
Publisher’s Note: MDPI stays neutral with regard to jurisdictional claims in published maps and institutional affiliations.

