Abstract
Multiscale fractal analysis of the pore system for coal is necessary to obtain more inner information. The techniques of Scanning Electron Microscopy (SEM) and Mercury Intrusion Porosimetry (MIP) are combined to characterize the pore structure of natural coal. A total of eight coal samples, of a different rank and coalification degree, are prepared for experiments. Methods of SEM image processing, piecewise curve-fitting and correction of intrusion data are adopted to obtain more useful results. According to the pore size range of the MIP probe, pores in coal are classified as seepage pore (pore size ≥ 1000 nm), transition pore (pore size ≥ 50 nm and <1000 nm) and mesopore (pore size < 50 nm). Variations of multi-scale fractal dimensions are studied from the perspective of coalification degree or coal rank. Fractal dimension from SEM data (D1) and fractal dimensions of seepage pore, transition pore and mesopore (D2, D′2 and D″2) from MIP data are calculated by fitting curves, and consequently correlations of those with volatile matter (Vdaf), pore volume and pore size are analyzed and discussed. The U-shape relationships between fractal dimensions (D1, D2 and D′2) and Vdaf are observed. Macropores are presented as the isolated clusters embedding in the network of smaller pores, and the difference of the order of magnitude of the pores’ size affects the connectivity between pores. Both the pore size and volume have a direct influence on multiscale fractal dimensions. Overall, multiscale fractal analysis is beneficial to explore the structure of natural coal.
1. Introduction
Coal and coal bed methane utilization are of great significance in developing new clean energies. The knowledge of coal media is the basis of the development of new technologies. Coal is a low-permeability porous media with a complicated pore system contributing internal surfaces. The internal surface roughness of coal determines, to an extent, the quantity of stored natural gas and the ease with which the gas can flow [1,2]. The natural porosity of coal is complex and shows its multiscale structure [3,4,5]. The characterizations of pore size distribution (PSD) and fractal analysis are typical means to evaluate the irregular characteristics for coal reservoirs.
The PSD of coals varies significantly with the coal’s rank and shows the unique physicochemical characteristics [6,7,8]. Various techniques for pore system characterization, such as scanning electron microscopy (SEM), mercury intrusion porosimetry (MIP), CO2/N2 gas adsorption, transmission electron microscopy (TEM), Small Angle Neutron Scattering techniques (SANS) and nuclear magnetic resonance (NMR), are adopted to elucidate the pore volume, the specific surface area (SSA) and the morphology of coal [6,7,8,9,10]. Due to the large size distribution scope of the apertures, one single characterization method cannot obtain enough information. According to the pore sizes in the materials, a pore is classified by the International Union of Pure and Applied Chemistry as: macropores (≥50 nm in pore size); mesopores or transitional pores (2–50 nm in pore size); and micropores or adsorption pores (pore size < 2 nm) [11]. Generally, the macropores provide the transport paths for fluid access flow, while the micro- and mesopores govern their adsorption/desorption and storage [12,13]. A different demarcation point for dividing the seepage and adsorption pores was adopted to study the fluid flow path by Zhao et al., Su et al., Li et al. and Yao et al. [13,14,15].
Fractal theory is known as a powerful analytical tool, which characterizes the roughness of the pore surface morphology and the complexity of pore structure. Fractal statistics based on SEM were used to characterize the pore space of sandstone by Katz and Thompson [16]. The evolution of PSD and the fractal dimension of coal, such as the high pressure, hydrochloric acid, stress conditions, supercritical CO2 treatment and surfactant treatment, were used to characterize the heterogeneous characteristics of unconventional reservoir pores [17,18,19]. The influence of tectonic evolution on the pore structure and fractal characteristics of coal was analyzed by Wang et al. [20]. Work by Sun et al. [21] stated that the deeper-deposited coal exhibited larger fractal dimension values, which indicated rougher and more condensed pore networks. The multifractal characterization of coal and rock at different pore-size ranges was investigated by Zhu et al., Xie et al. and Yang et al. [22,23,24]. Liu et al. studied the surface fractal and structure fractal dimensions of coal particles with varied sizes [25]. Fu et al. analyzed the correlation between the fractal dimension of low-rank coal and the permeability of coal reservoirs [26]. Ougyang et al. used multiple fractal dimensions to analyze the effects of coalification on the characteristics of pore fractures [27,28]. By means of SEM and fractal theory, Pan et al. provided a method of pore classification to exhibit the irregular shapes of micro-pores or micro fractures [29].
The previous studies have shown that micropores play a dominant role in gas adsorption as well as the fractal dimensions. Most of the studies use the tool of fractal analysis to describe the complexity of the pore surface, but there are few studies discussing the causes of fractal evolution. The pores in different pore-size ranges present the varied characteristics of PSD. A multiscale fractal analysis is necessary to obtain more inner information of the original coal. In this paper, variations of multiscale fractal dimensions are studied from the perspective of coalification degree or coal rank. Special attention is paid to the macroporosity for different ranks of coal due to its large pore-size range. Compared with the CO2/N2 adsorption method, MIP for PSD characterizations can reach a larger scope of pore sizes. Besides, the scaling relations of the surface fractal dimensions from data of MIP are regarded as a promising method [30,31]. Providing the surface morphology of pore structure in two dimensions, SEM imaging is combined with MIP to characterize the inner information of original coal in this work, such as pore morphology, PSD, SSA and pore volume. Multiscale fractal characterizations of the heterogeneous structure of coal in different ranks are conducted to obtain the similarity of the internal geometry. The impact of coalification on the results of the multiscale fractal analysis is discussed.
2. Materials and Methods
A total of eight coal samples of a different rank were collected directly from the coal faces of coal fields in the northern and west China mining area, such as the Fengfeng, Qingshui, Xishan, Laiwu, Eerduosi and Xinyao coal field. These coal fields have the potential for CBM (Coal Bed Methane) exploitation. The samples were sealed in canisters and transported to the laboratory for testing immediately. Following the China National Standard GB/T 212-2008, the results of the proximate analysis of the eight samples are shown in Table 1. The coal rank, moisture (Mad), ash (Aad), volatile (Vdaf) and fixed carbon (FCad) content of the eight samples were obtained.

Table 1.
Results of proximate analysis for 8 samples.
According to the China National Standard GB/T 20307-2006, rules for nanometer-scale length measurement by SEM, the surface morphological characteristics of the samples were detected by HITACHI S-4800 SEM equipment. The coal lumps were cracked into 1–2 cm3 small cubic blocks, and a smoother surface was chosen as the observation plane.
The coal samples were dried in the oven and then comminuted into small particles in a coal mill. The coal particles with the size range of 0.18 mm to 0.25 mm were sieved in preparation for MIP testing and labeled as Ⅰ, Ⅱ, Ⅲ, Ⅳ, Ⅴ, Ⅵ, Ⅶ and Ⅷ. The experiments were performed using an AutoPore Ⅳ 9505 instrument, following the China National Standards GB/T 21650.1—2008 and the Chinese Oil and Gas Industry standard SY/T5346-2005. A 5 cc powder penetrometer was used in the experiments and the equilibration time was set as 30 s. The volume injection curves were obtained with a pressure range of 0 to 200 MPa. According to the Washburn equation [32], the minimum of the measured pore diameters is 0.004 μm.
where σHg is the mercury surface tension, 0.485 N/m; and the contact angle θ is set to 140° in laboratory conditions; pc is the intrusion pressure of mercury (MPa); while r is the pore radius on basis of the cylindrical pore model.
pc = −(2σHg∙cosθ)/r,
3. Theory
The fractal theories are widely employed to illustrate the irregularity and complexity of natural phenomenon. The heterogeneity of the pore structure can be characterized by fractal dimensions. Small values of fractal dimensions show the smooth distribution of the pore neck distribution and a significant homogeneity.
3.1. Fractal Dimension Calculated from SEM Images (D1)
3.1.1. Image Processing
The original gray-scale SEM images need to be processed for the quantitative analysis of the pore size distribution and fractal characteristics. Liu et al. [33,34] proposed the method of quantification of microporosity of the clay and soil material by image processing. The macro-porosity distribution of coal has the similar geometry. According to Liu et al.’s method, the procedure of pore recognition is as follows: (Figure 1a) preparation of the original SEM image; (Figure 1b) original image is transformed into a binary image; (Figure 1c) recognition of every pore margin; (Figure 1d) calculations of the perimeter and area for pores. Obviously, the arbitrary threshold affects the transformation of the binary image, and consequently influences the calculations of the pore parameters. The global threshold method is an effective methodology to determine the gray-level threshold [34,35,36].
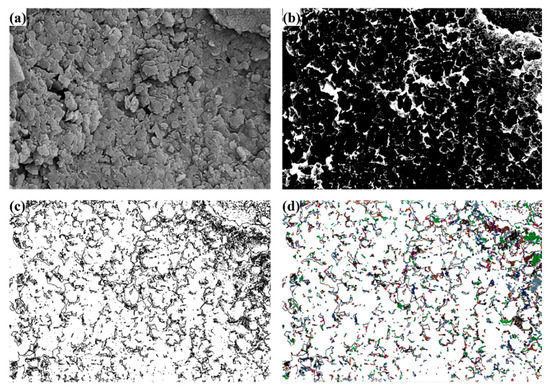
Figure 1.
The procedure of pore recognition for fractal dimension D1: (a) Original SEM image; (b) Binary image; (c) Recognition of pore margins; (d) Calculations of perimeter and area.
3.1.2. Data Processing
On the basis of the findings of Voss et al. [37], the fractal characteristics calculated by SEM images for geomaterials was conducted by Moore and Donaldson [38]. The morphology of coal microstructure has fractal characteristics, as follows:
where C is the perimeter of pore in 2-D image; and A is the area of pore in 2-D image. c1 is a constant. Small clusters have simple almost-circular shapes, while the clusters at large scale show irregular connections. The logC − logA data will present a simple liner relation, and the slope of the fitting line is D1/2.
logC = D1/2∙logA + c1,
3.2. Fractal Dimension Calculated from MIP (D2)
Volume injection curves can provide scaling information. At low pressure, the mercury fills all of the accessible pores, which are larger than a pore-neck value. The pore spaces’ volume for coal in three dimensions have a fractal geometric basis and the scaling relation in terms of the intrusion pressure is expressed as follows [39,40]:
where V is the volume of injection mercury. At the threshold pressure pt, the mercury percolates for the first time, and for pc > pt the invading fluid fills multiple connected pores and dead ends. Based on Equation (3), a formula calculated D2 is established as follows:
V∝ (pc − pt) ^ (3 − D2),
log(V) = (3 − D2)∙log(pc − pt) + c2,
According to Equation (4), in the plot of log(V) vs. log(pc − pt), the slope of the straight line should be equal to (3 − D2). c2 is a constant. If a scatter diagram is drawn from the results of intrusion curve, the slope can be inferred, and the line can be divided into two or three sections, according to the curve of the linear trend and capillary pressure.
4. Results and Analysis
4.1. SEM Results
The morphology on the solid surface can be recognized with the SEM. The fracture forms and internal structure are analyzed with the images enlarged 20,000 times, as shown in Figure 2. The pore structure of the coals with a different rank shows the heterogeneity of the coal surface. Samples Ⅰ, Ⅱ, Ⅴ and Ⅷ are highly porous with numerous slits, wedge-shaped or channel-like pores on the coal surface (Figure 2a,b,f,g). The channel-like pores with obvious zigzags serve as links connecting with the different size pores (Figure 2g). The lamellar structures are observed in samples Ⅳ, Ⅵ and Ⅷ, and that means a better connectivity between the pores (Figure 2d,f,h). The cylindrical pores and bottle necks are found in samples Ⅲ and Ⅵ, respectively (Figure 2c,f). There are typical slit and wedge-shaped pores in sample Ⅴ (Figure 2e). In addition, few open pores can be found in samples Ⅶ and Ⅷ. The SEM observation results show the irregularities of the pore morphology of coals.
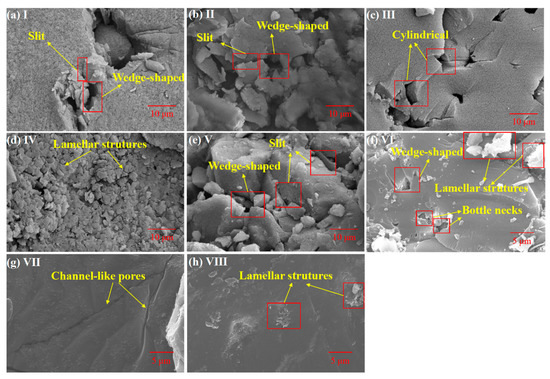
Figure 2.
SEM images of different coal samples: (a) Sample I; (b) Sample II; (c) Sample III; (d) Sample IV; (e) Sample V; (f) Sample VI; (g) Sample VII; (h) Sample VIII.
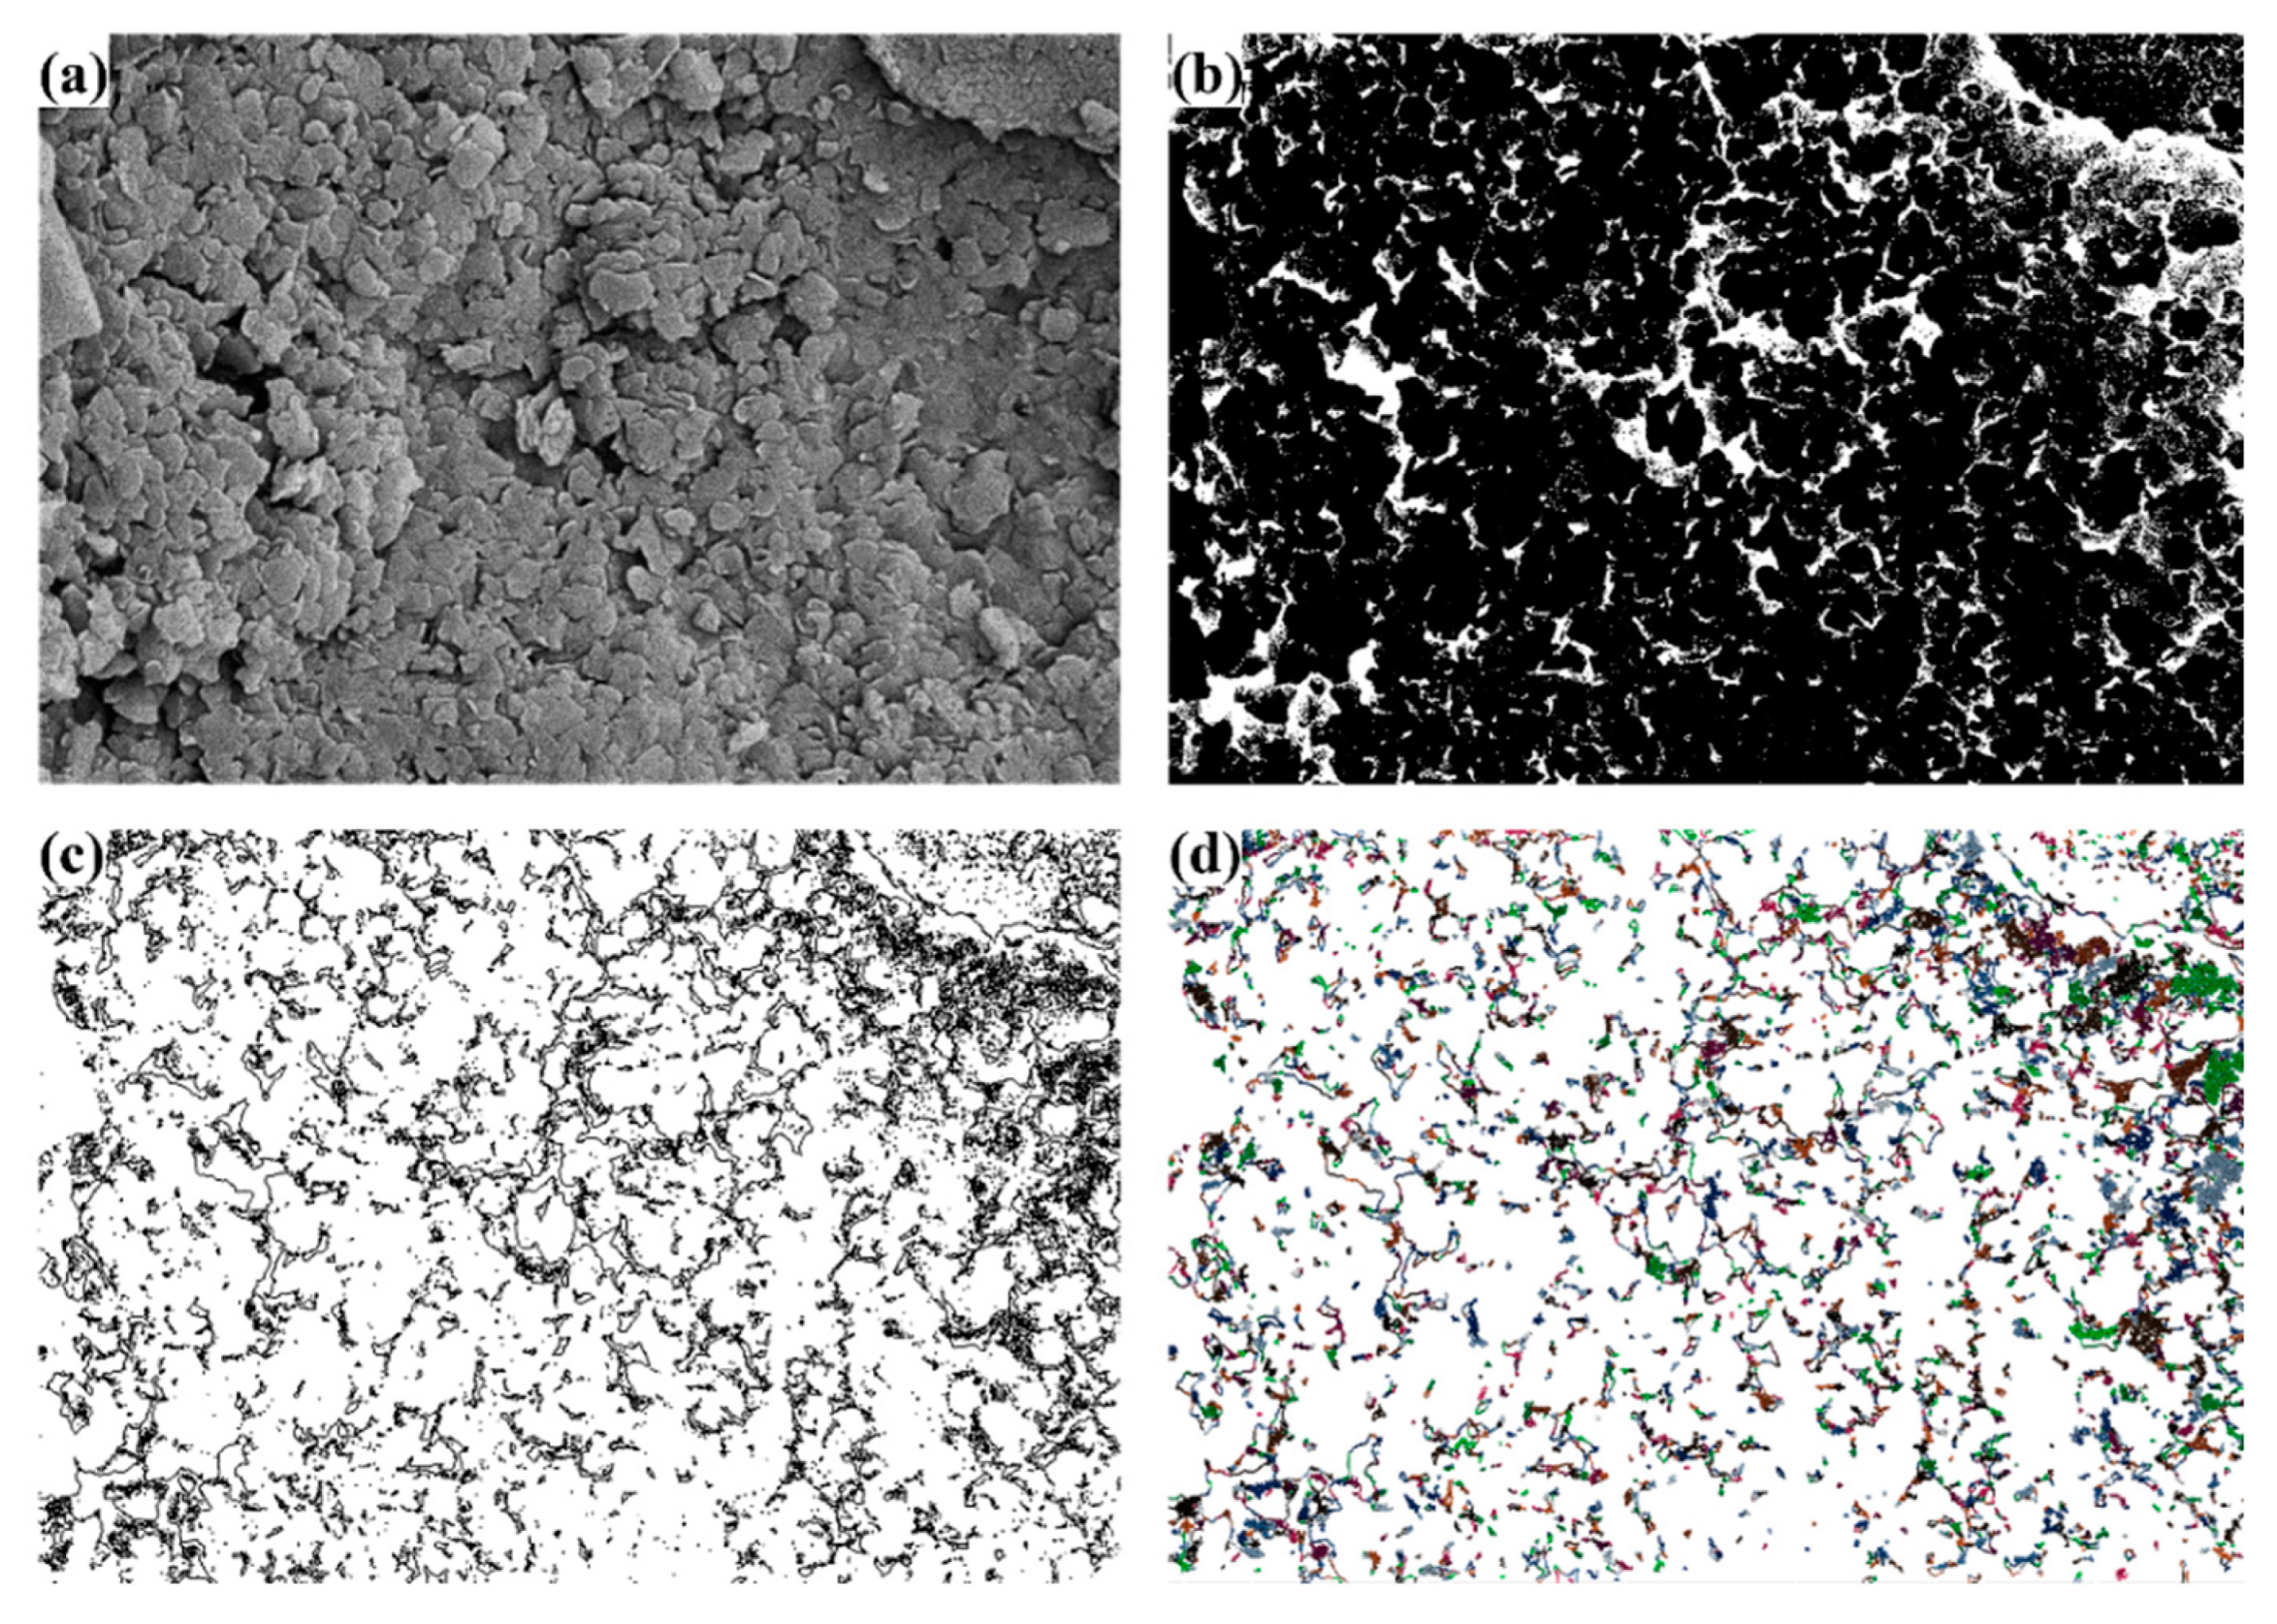
The plots of log(C) vs. log(A) are shown in Figure 3. All of the plots present a good fit with R2 > 0.93. It is verified that the coal surface has the feature of fractal. According to the theory of fractal geometry, the fractal dimension D1 on the coal surface is in the range of 1 < D1 < 3. As seen in Table 2, D1 ranges from 1.344 for sample Ⅴ to 1.582 for sample Ⅷ.
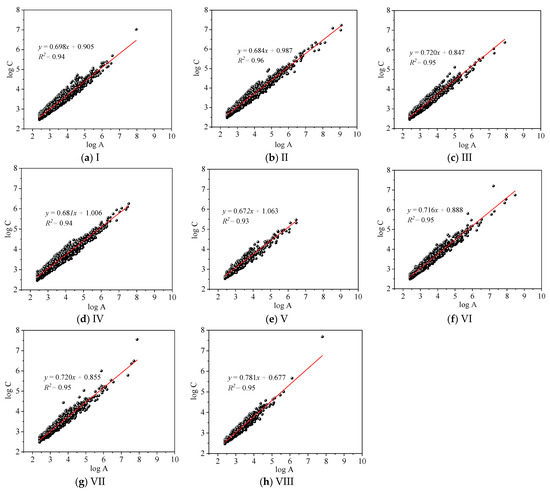
Figure 3.
Calculated from log(C) vs. log(A) of SEM analysis: (a) Sample I; (b) Sample II; (c) Sample III; (d) Sample IV; (e) Sample V; (f) Sample VI; (g) Sample VII; (h) Sample VIII.
Table 2.
Parameters of pore structure for 8 coal samples by MIP test.
4.2. Mercury Intrusion Curves and Fractal Analysis
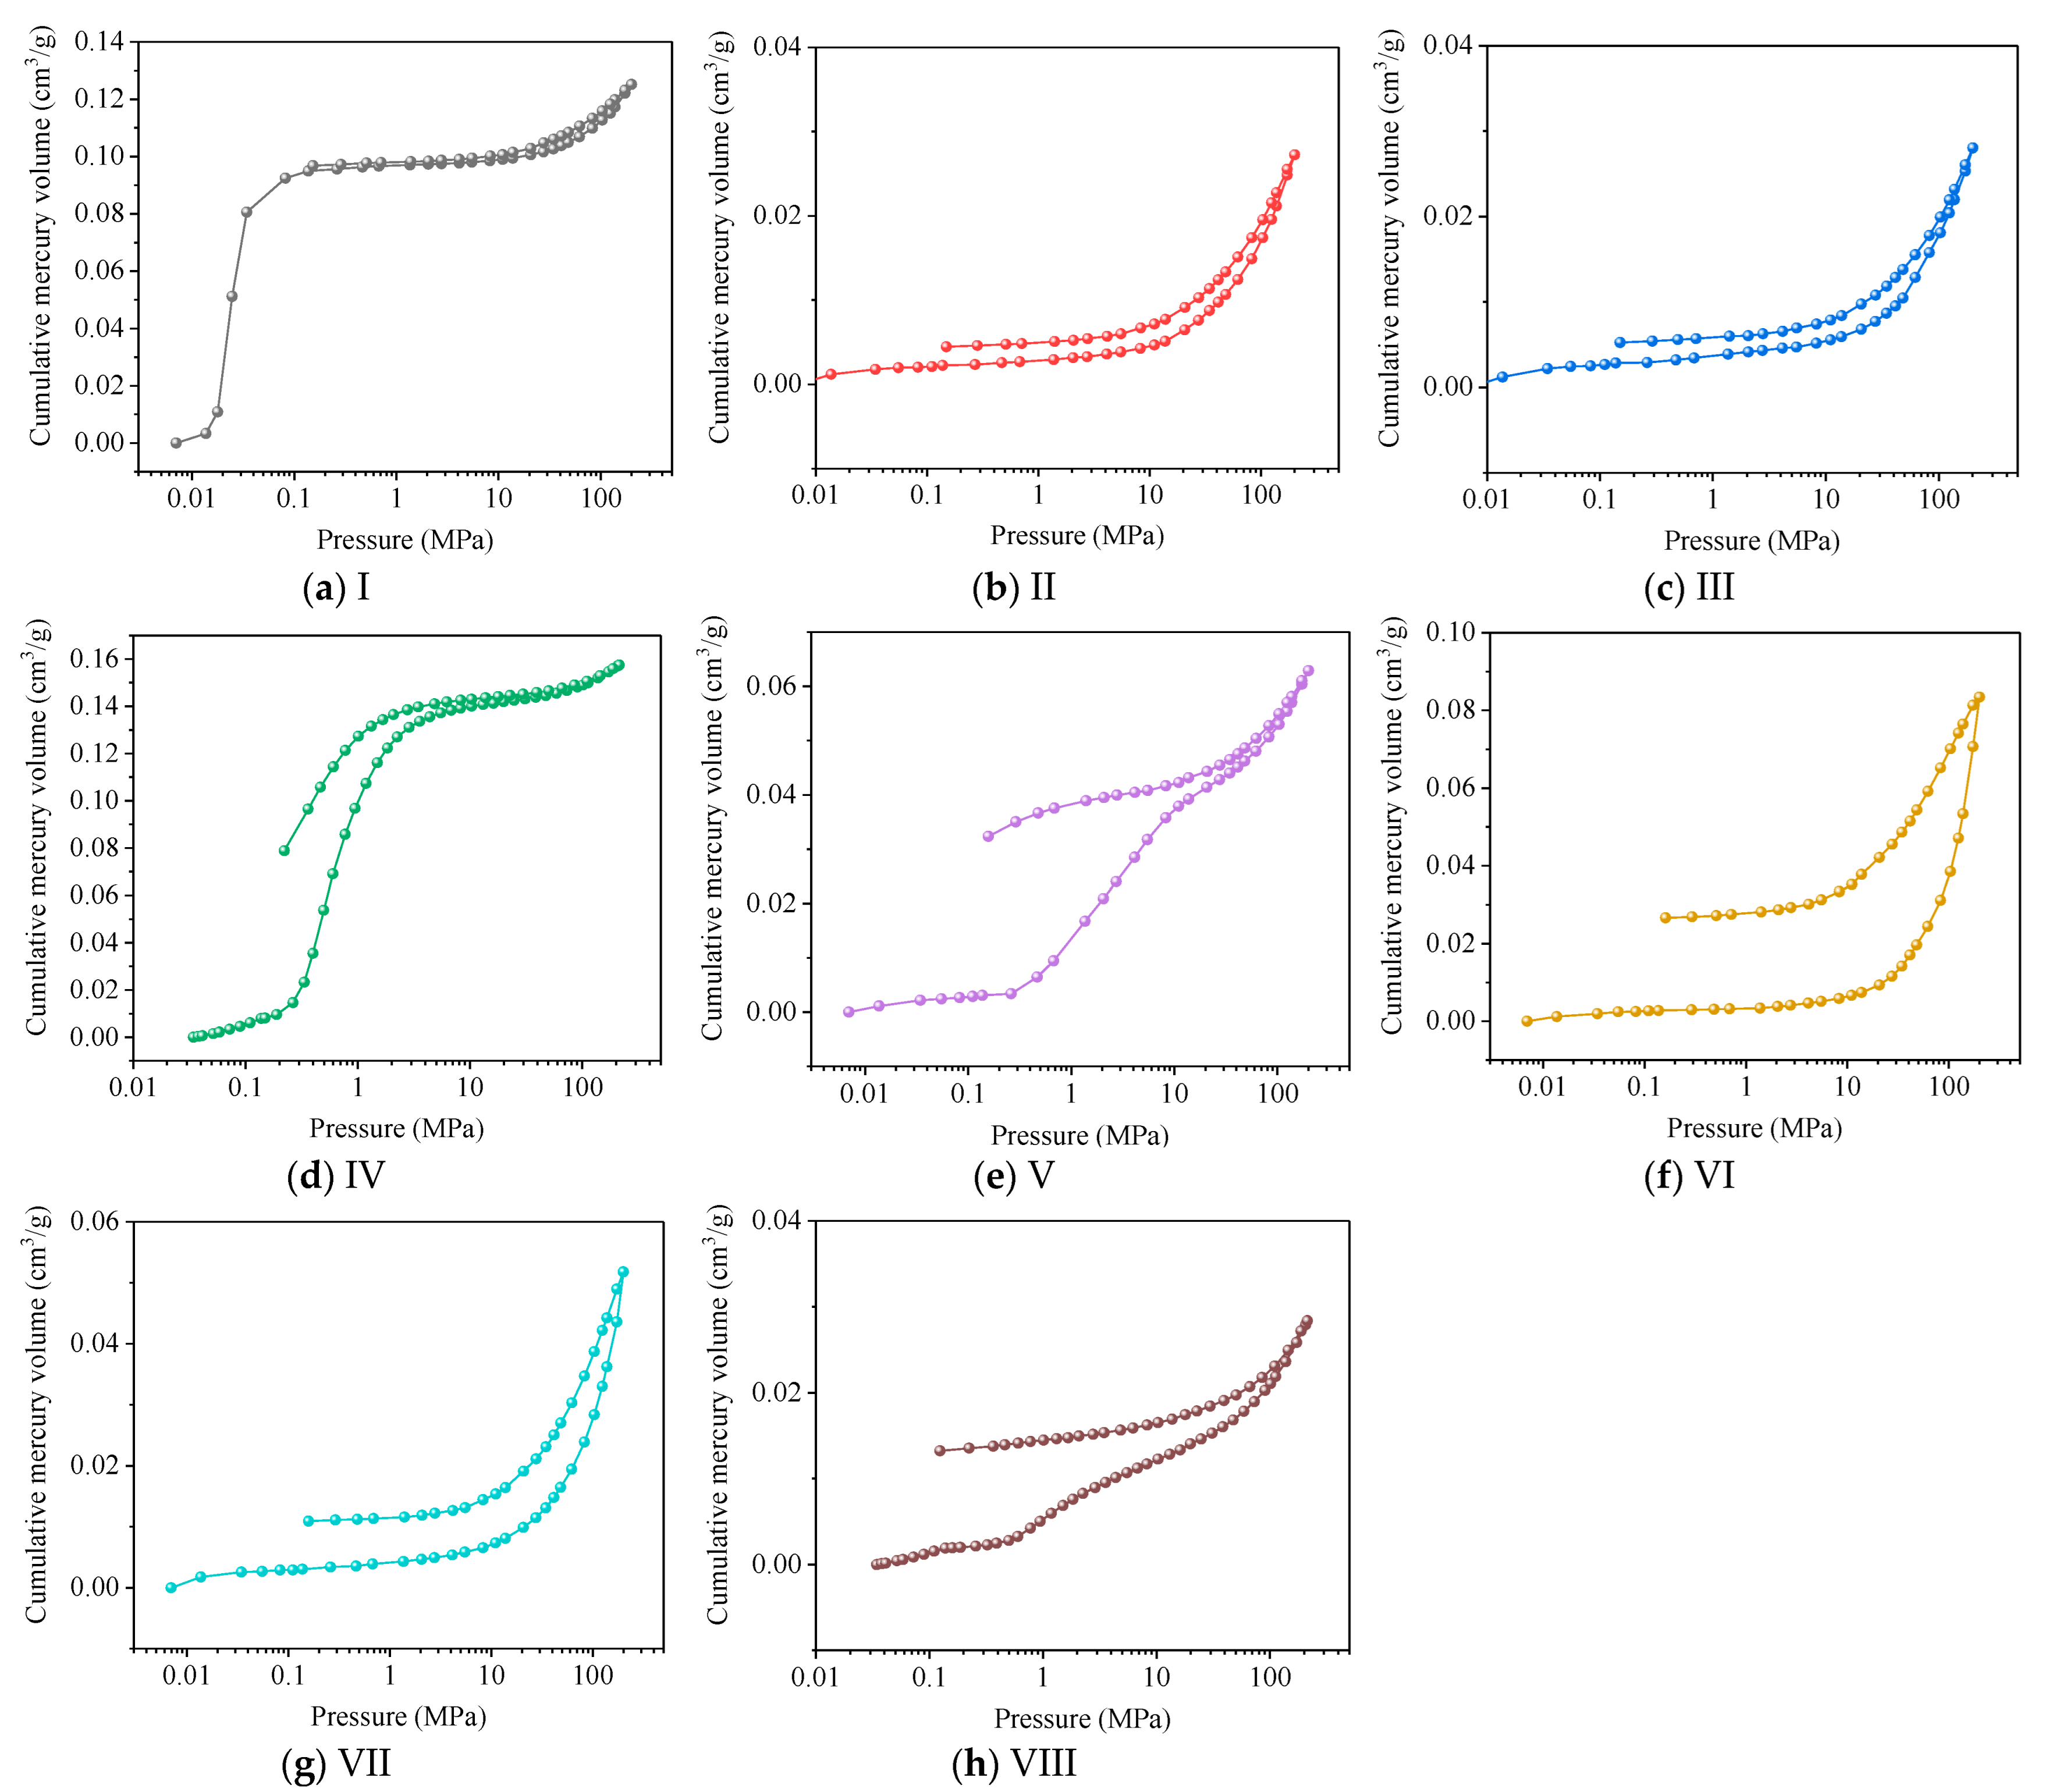
The MIP analysis provides inner information of the coal, including the pore parameters, but not limited to the pore porosity, pore volume and pore size distribution. By monitoring the injected volume as a function of capillary pressure, one can gain information as to the scaling of the pore volume with a decreasing diameter or an increasing intrusion pressure. Figure 4 shows the mercury intrusion/extrusion curves of the eight coal samples. The sudden increases in the injected volume are observed experimentally, and the signals for the pore neck of the percolation. About two percolation thresholds are shown in the intrusion curves. The fractal analysis from the data of the capillary curve is linearized in a piecewise manner.
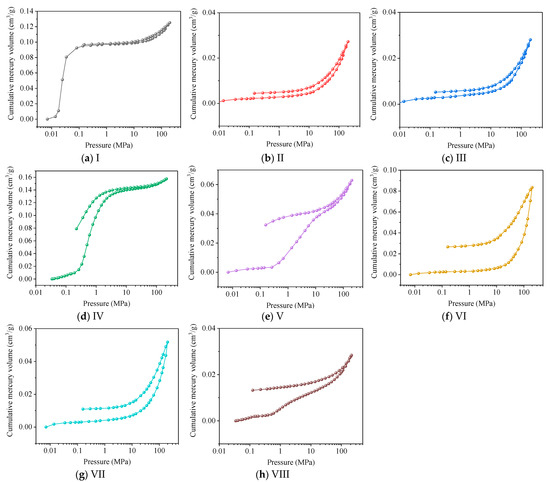
Figure 4.
The mercury intrusion/extrusion curves of 8 coal samples: (a) Sample I; (b) Sample II; (c) Sample III; (d) Sample IV; (e) Sample V; (f) Sample VI; (g) Sample VII; (h) Sample VIII.
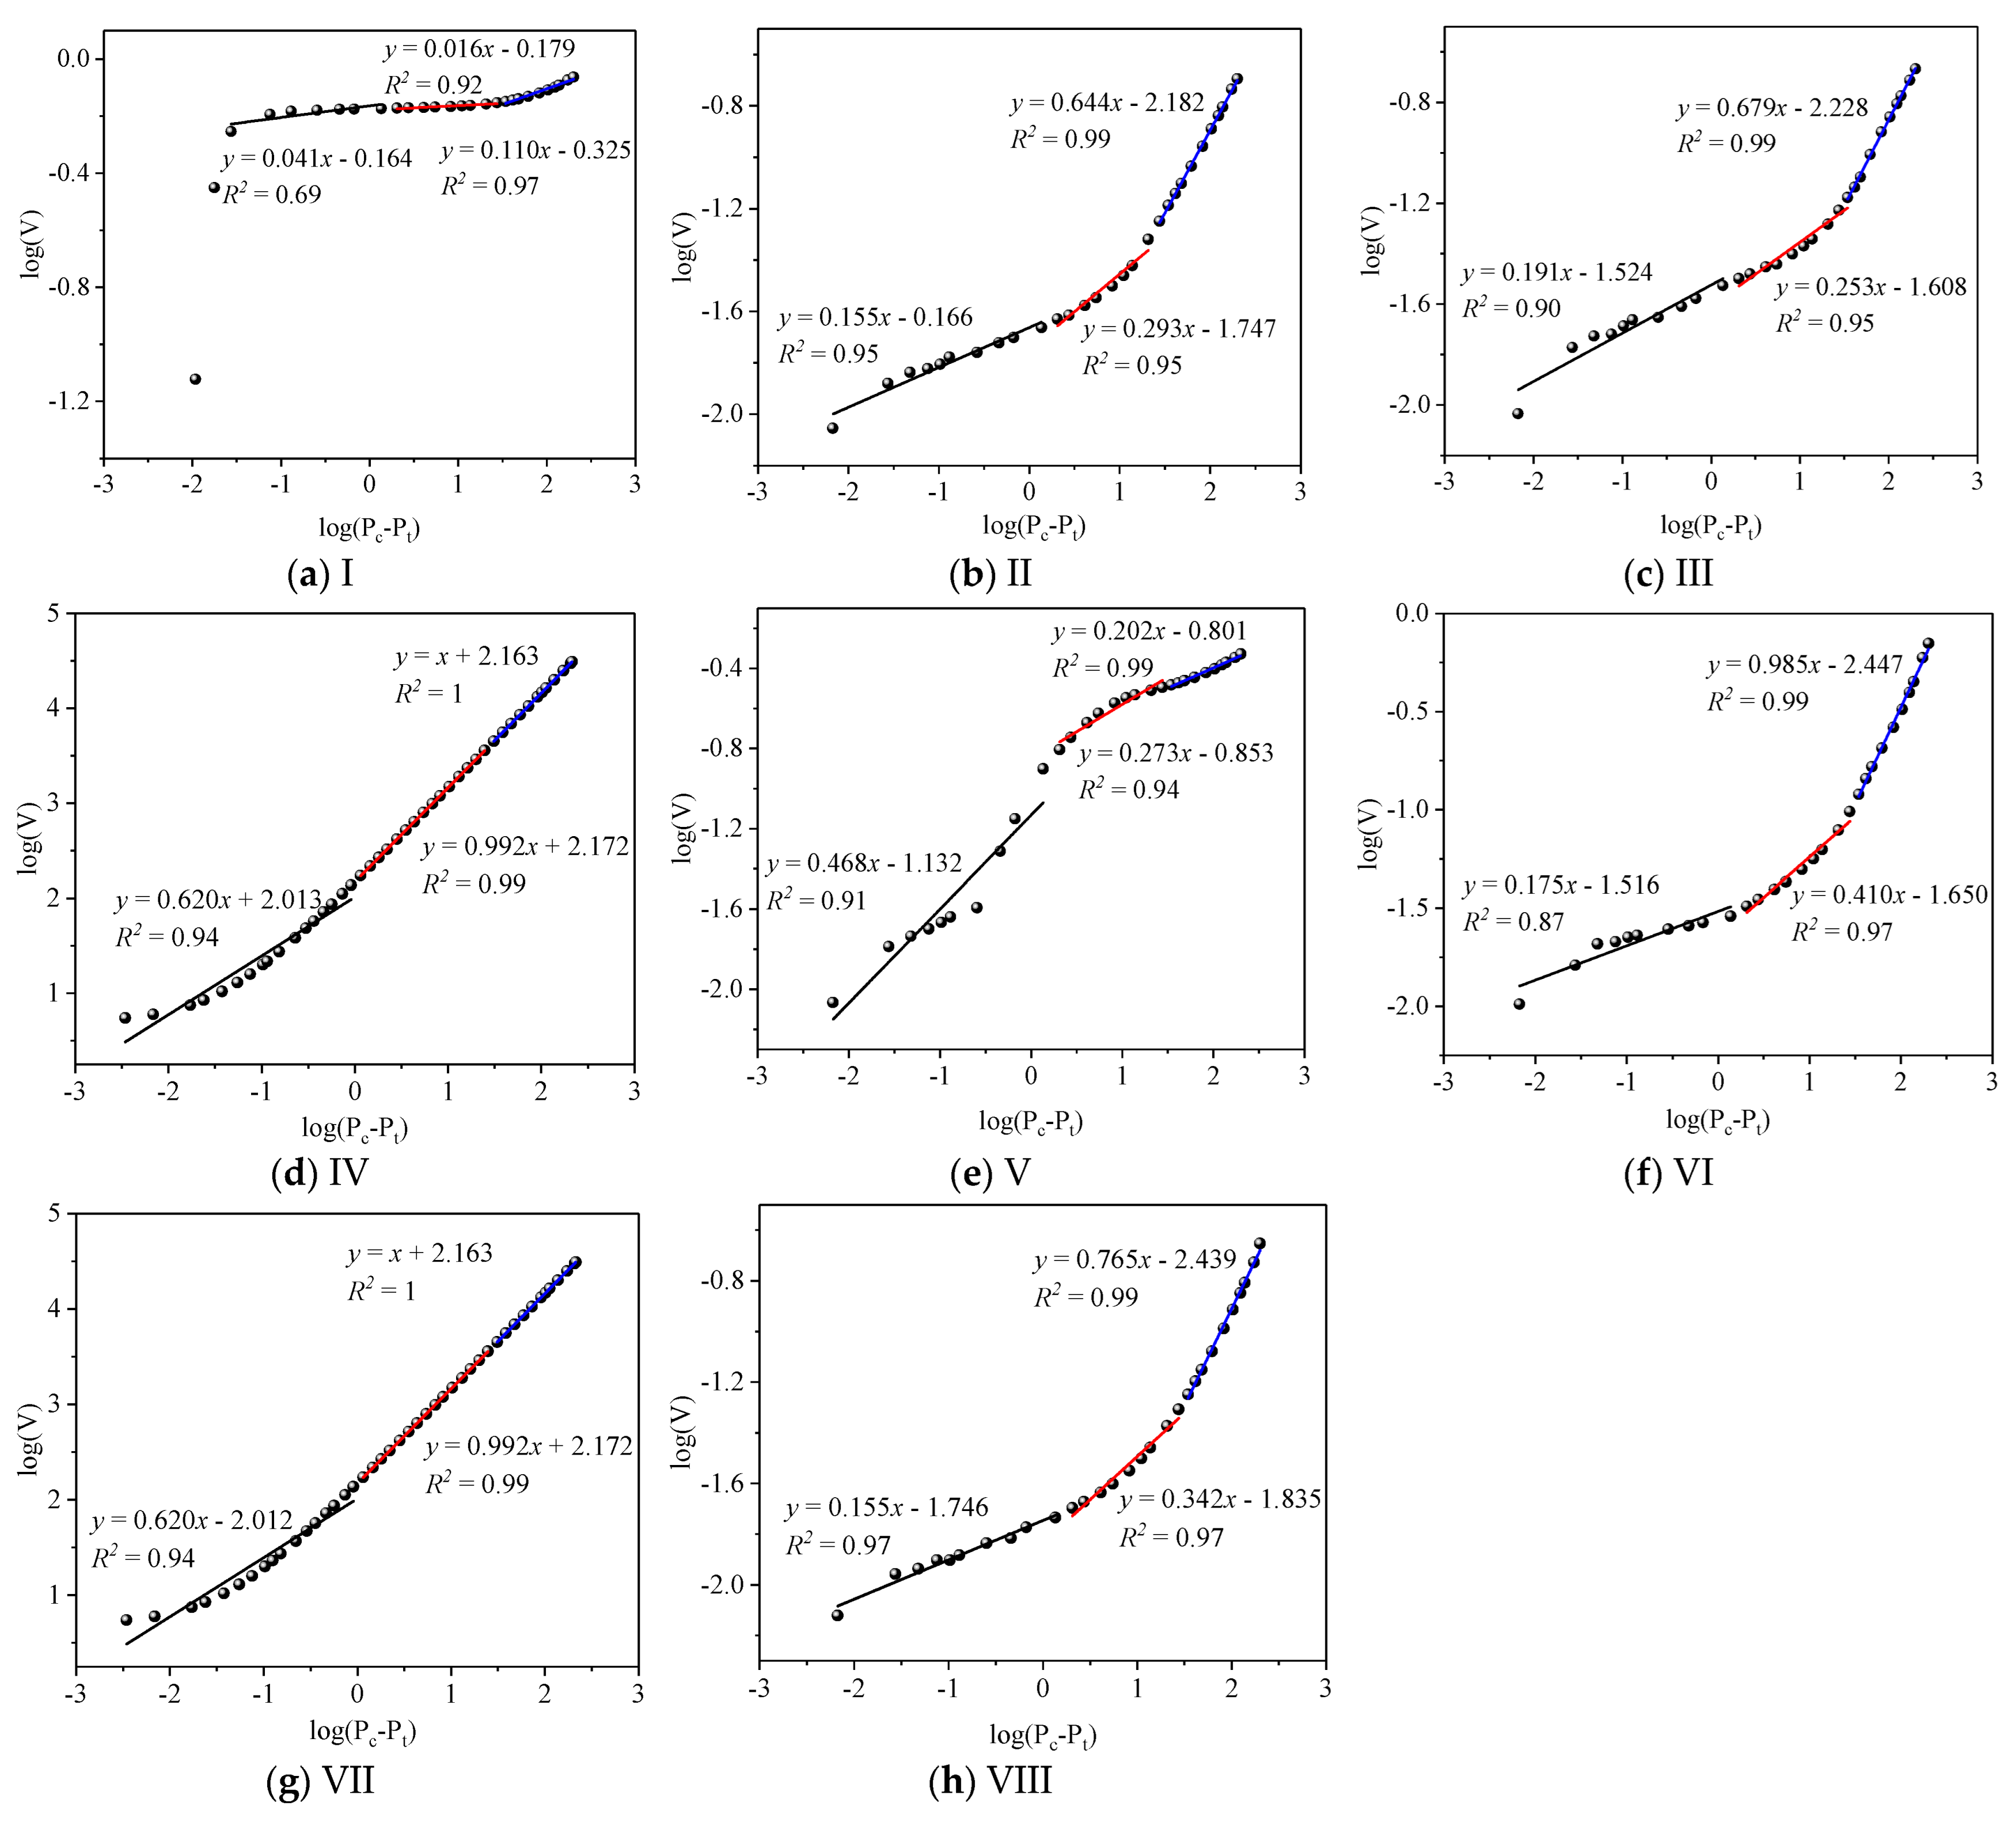
The fractal dimension shows the connectivity of pores in three-dimensional microscope. According to the definition of seepage pores by Hodot [41], the pore-size range of macropores is divided as two categories: pore size > 1000 nm and 50 nm < pore size < 1000 nm. The latter category is the pores related to gas seepage and gas adsorption, called transition pores. Three fractal dimensions, D2 (seepage pores, pore size ≥ 1000 nm), D′2 (transition pores, 50 nm < pore size < 1000 nm) and D″2 (mesopores, 2 nm < pore size ≤ 50 nm), are analyzed by fitting data of log(V) vs. log(pc − pt), as shown in Figure 5. Table 2 shows the results of D2, D′2 and D″2 for the eight samples. D2 ranges from 2.380 for sample Ⅳ to 2.914 for sample Ⅰ, D′2 from 2.008 sample Ⅳ to 2.984 for sample Ⅰ, and D″2 from 2.000 sample Ⅳ to 2.890 for sample Ⅰ. The pore structure of sample Ⅰ is the most complicated, while the pore structure of sample Ⅳ is the least complicated.
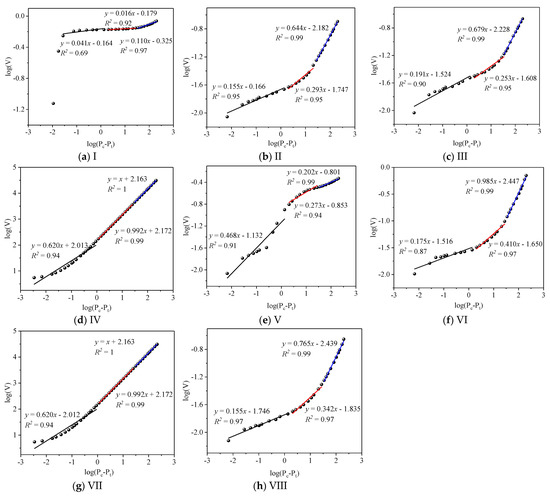
Figure 5.
Fractal dimensions (D2, D′2 and D″2) calculated from log(V) vs. log(pc − pt) of MIP analysis: (a) Sample I; (b) Sample II; (c) Sample III; (d) Sample IV; (e) Sample V; (f) Sample VI; (g) Sample VII; (h) Sample VIII.
4.3. PSD
Liquid mercury with external pressures is injected into an evacuated pore system, and consequently the increasing pressure makes the pore necks accessible to the mercury. Intrusion data of MIP are used to calculate the pore size distribution, and the original data in condition of high capillary pressure (larger than 10 MPa) need to be calibrated due to the compressibility of coal matrix [31,42]. When the mercury compressibility is negligible, the compressibility kc is defined as follows [42,43]:
where β is assumed to be a constant and derived by the mercury intrusion curve in high pressure regime. Vc is the coal matrix volume per unite mass. ∆Vpt is the pore volume in the calibration pore range derived from low pressure N2 adsorption and ∆P is the difference in mercury pressure.
kc = (β − ∆Vpt/∆P)/Vc,
The variation of the incremental pore volume Vp can be expressed as the following equation:
where ∆V is the observed increase in the mercury volume at a certain mercury pressure and ∆Vc is the incremental compressed matrix volume. The relation between ∆Vc and ∆P is expressed as Equation (7) [31]:
∆Vp = ∆V − ∆Vc,
∆Vc = kcVc∆P,
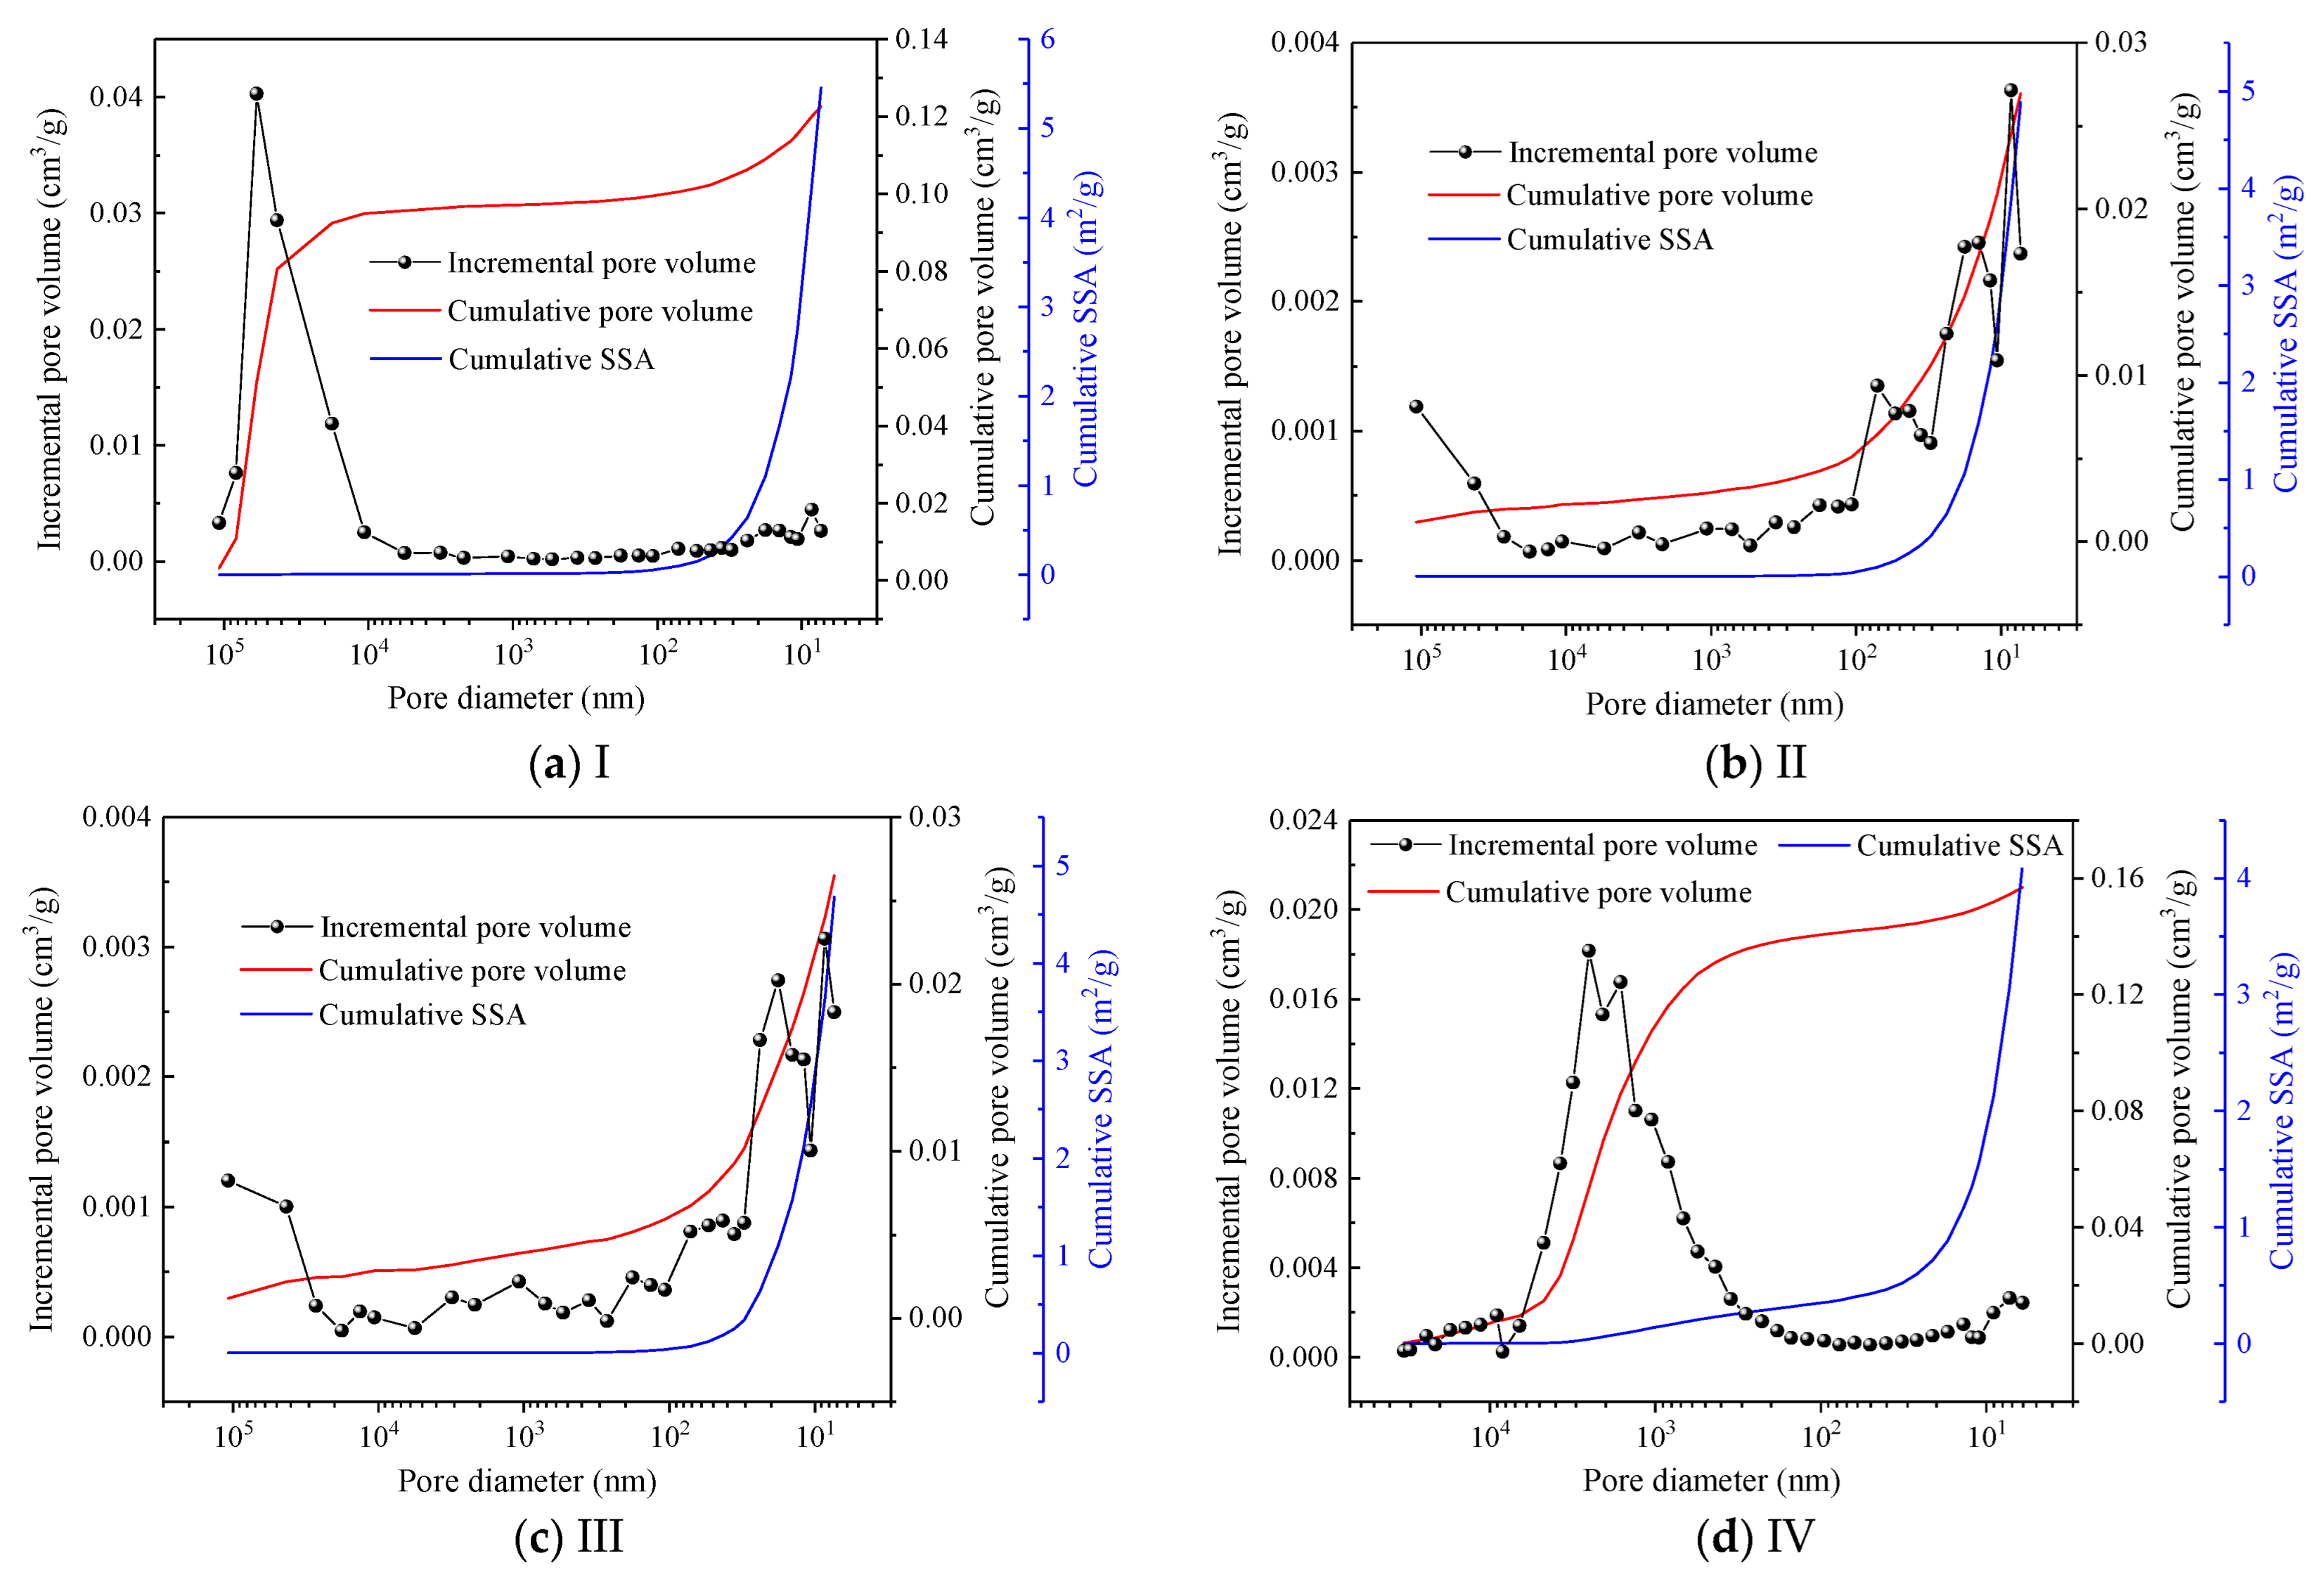
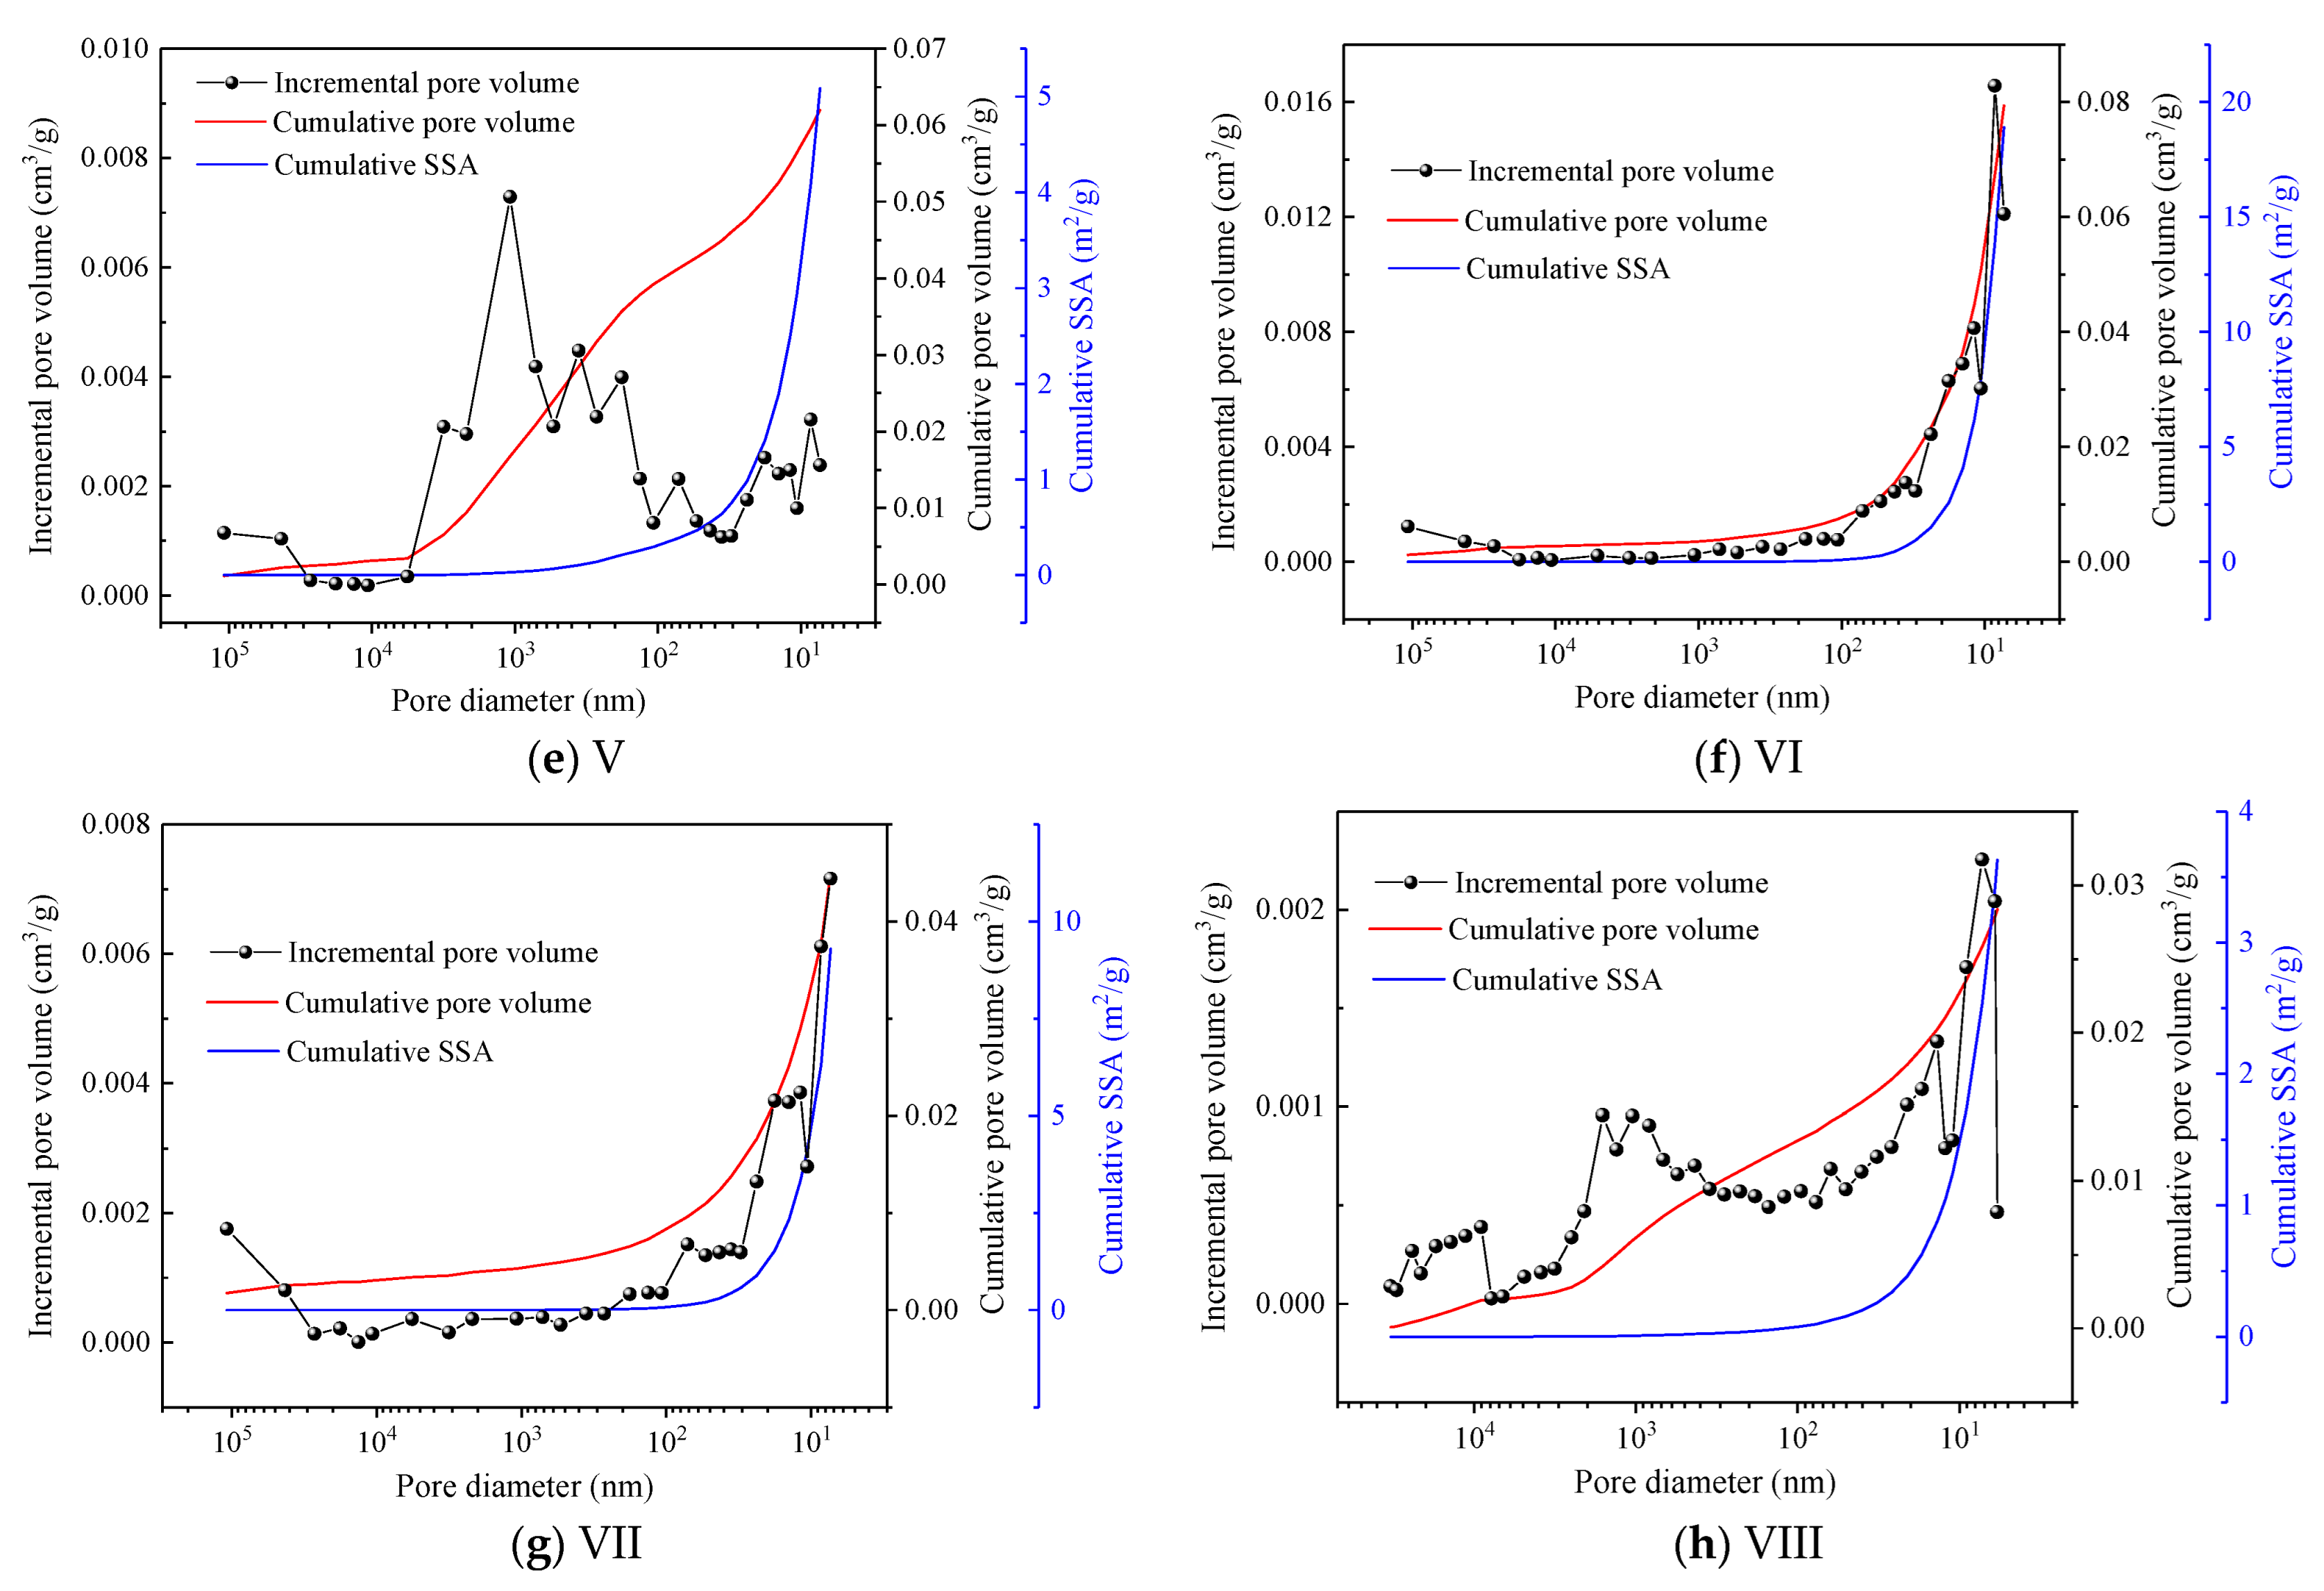
Based on the Equations (1) and (5)–(7), the PSD for the coal samples can be calculated as shown in Figure 6. The macropores of the experimental samples are mainly distributed in the size larger than 1000 nm with unimodal or multimodal. The dominant mesopore size is less than 18 nm with one or two major peaks. Compared with the mesopores, the seepage pores’ contributions to SSA are so small that they are negligible. The transition pores link the seepage pores and mesopores, and the contributions to pore volume and SSA increase with the decrease in pore diameter. Pores of a size less than 100 nm produce significant contributions to the SSA. The complexity of the nanoscale pores’ structure are the material features of coal. Table 2 exhibits the pore volume and SSA of the eight samples by MIP test, and the maximum are 0.157 cm3/g for sample Ⅳ and 18.9 m2 for sample Ⅵ, respectively. The PSD results of coal in different rank present the evolution of the pore volume and SSA. The U-shape relations between the mesopores or micropores SSA and volatile matter (Vdaf) are accepted by scholars [5,44,45,46]. The development of the multiscale pores with coal rank results in extreme irregularities in the pore structure.
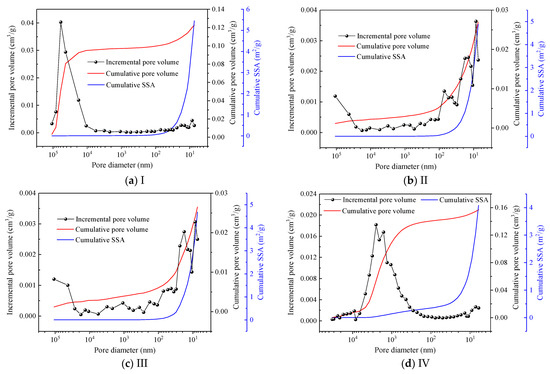
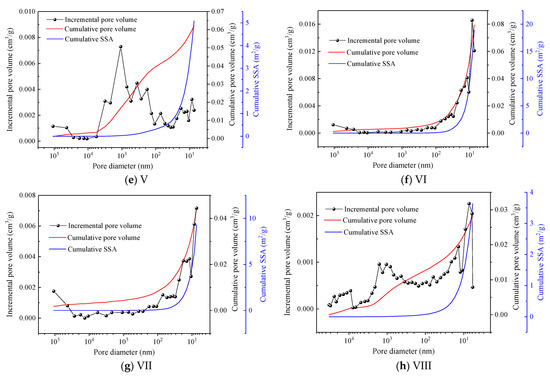
Figure 6.
Pore size distribution characteristics of 8 coal samples: (a) Sample I; (b) Sample II; (c) Sample III; (d) Sample IV; (e) Sample V; (f) Sample VI; (g) Sample VII; (h) Sample VIII.
5. Discussion
From the results of the SEM images, the macropores are presented as the isolated clusters embedded in the network of mesopores and micropores. Since the difference in the order of magnitude between the pores sizes, the macropores can only be connected with a limited number of meso- or micropores. Growth in the number of meso- and transition pores can improve the inter-connection between the multiscale pores. The polycondensation of coal molecules during the coalification process decreases the number of mesopores, in which Vdaf has a remarkable influence on the mesopore structure [5]. Vdaf is an important index to depict the coalification degree or coal rank.
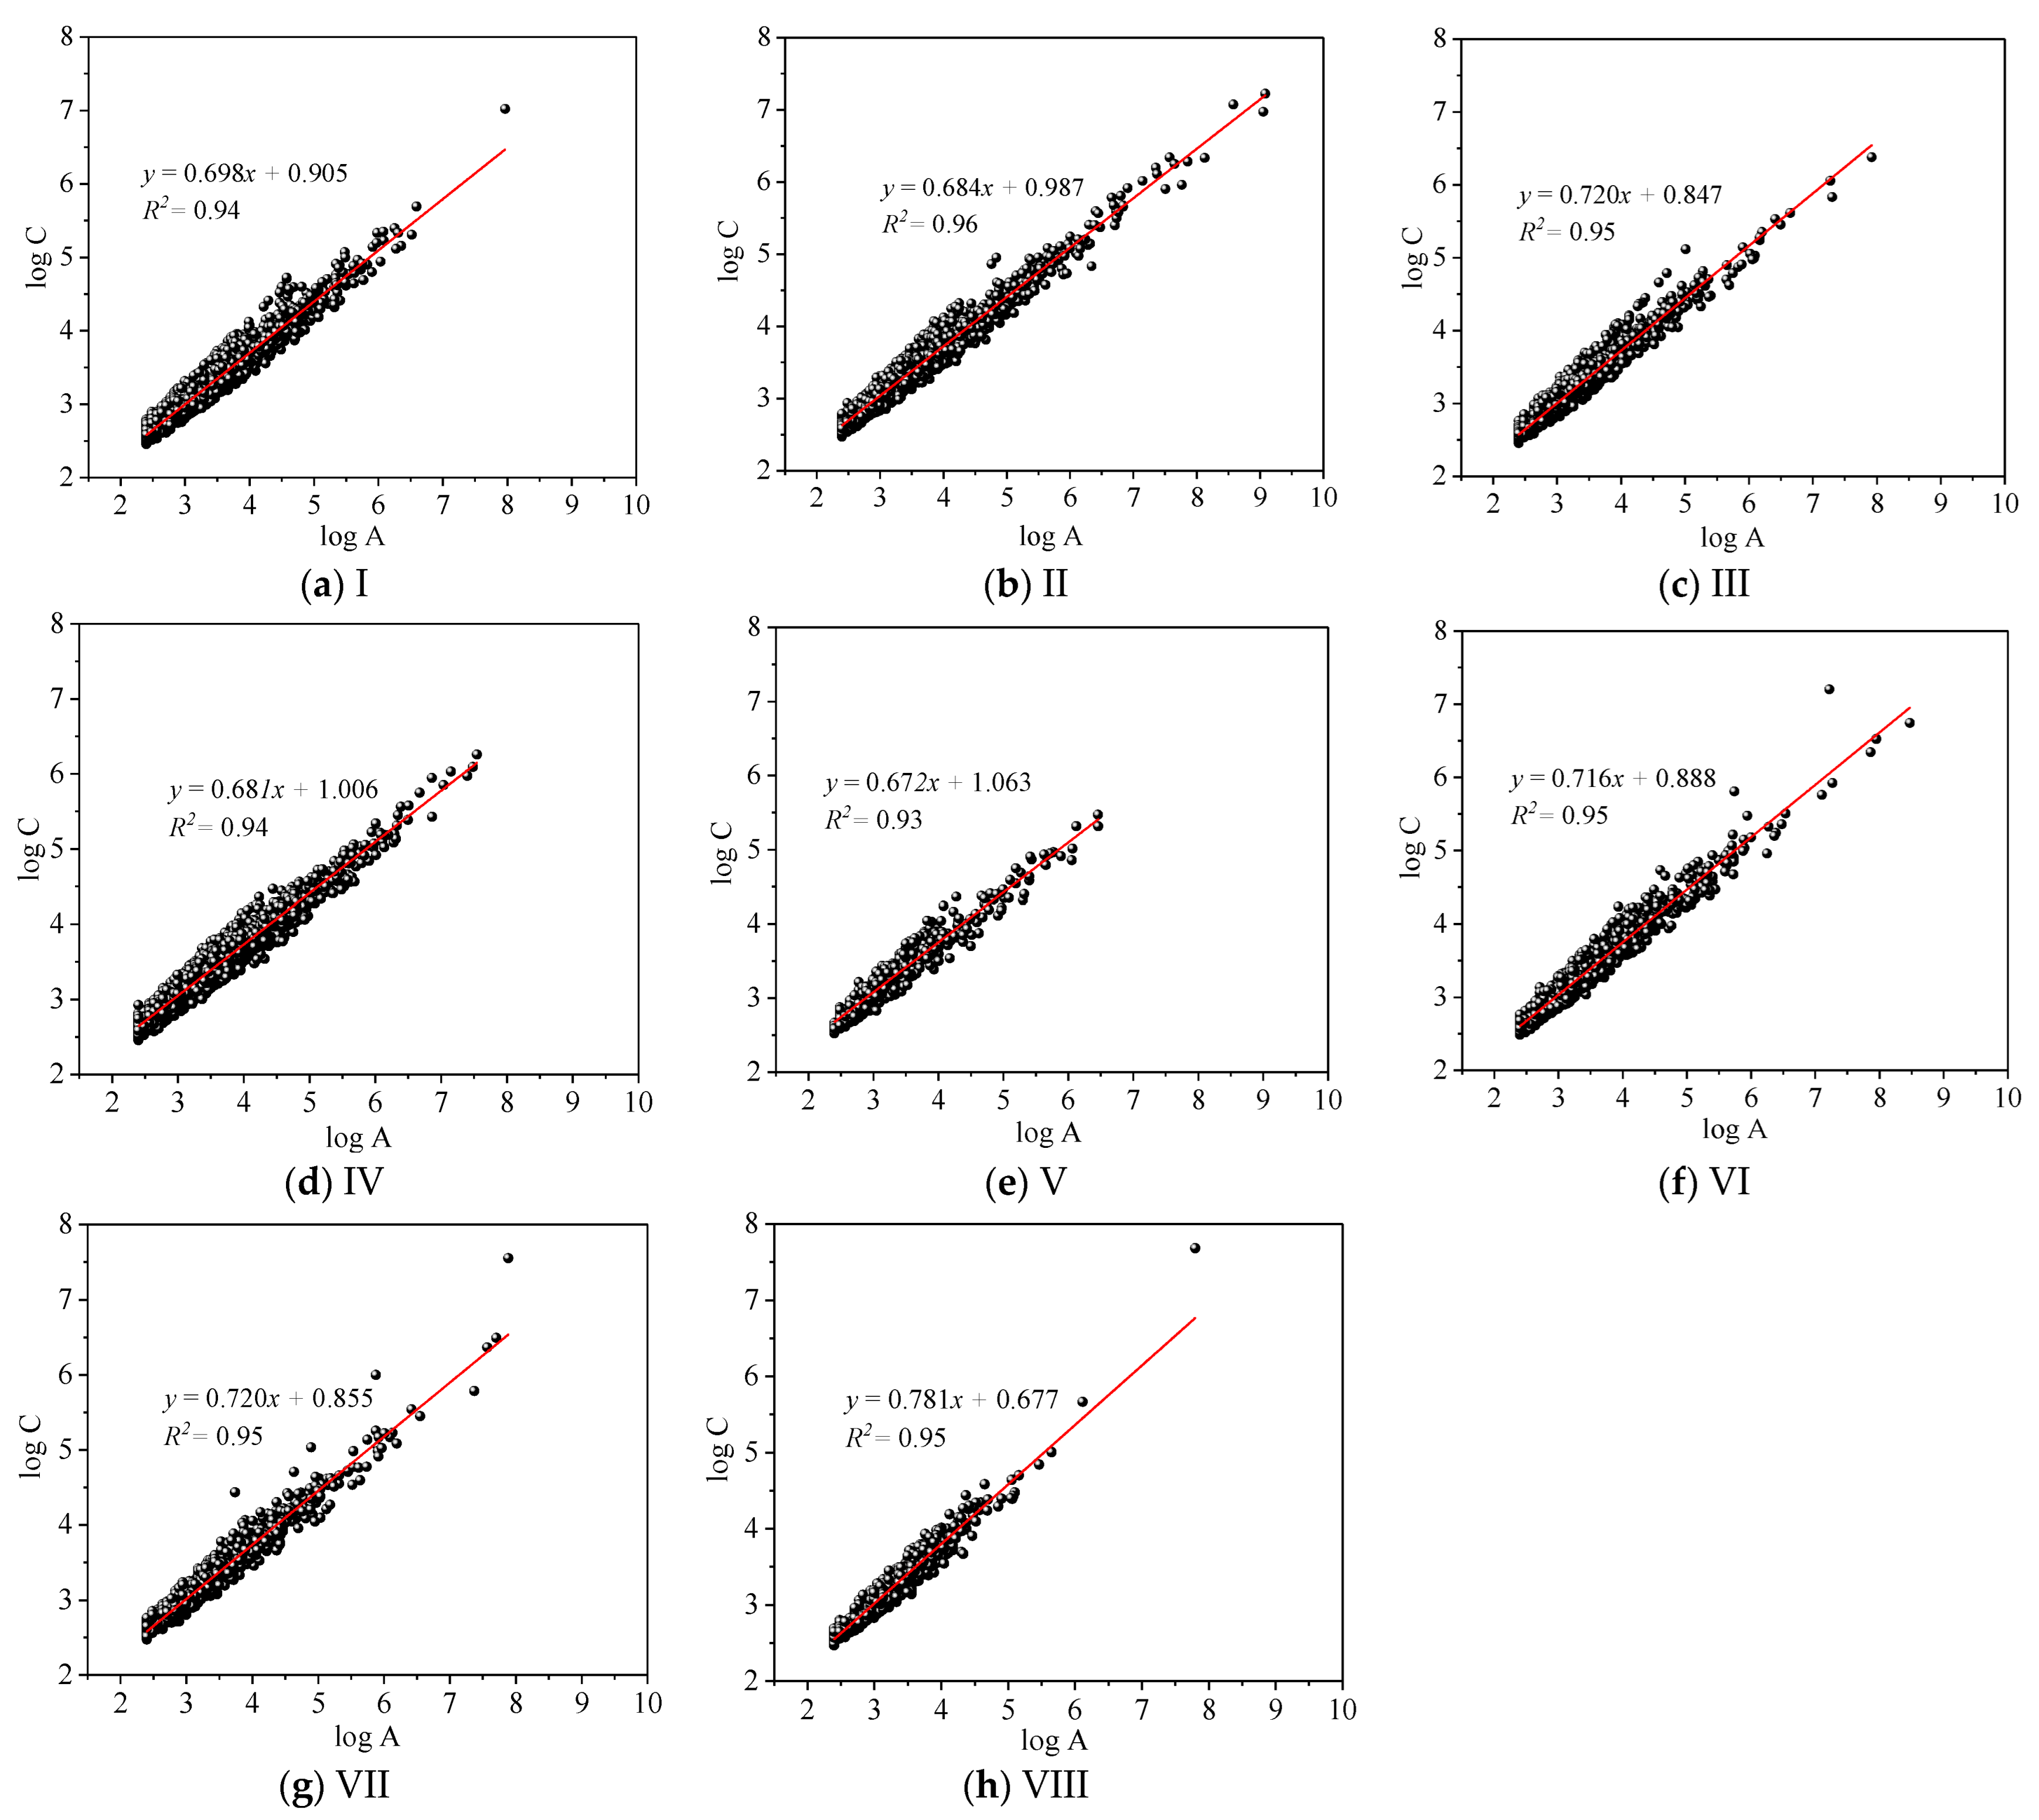
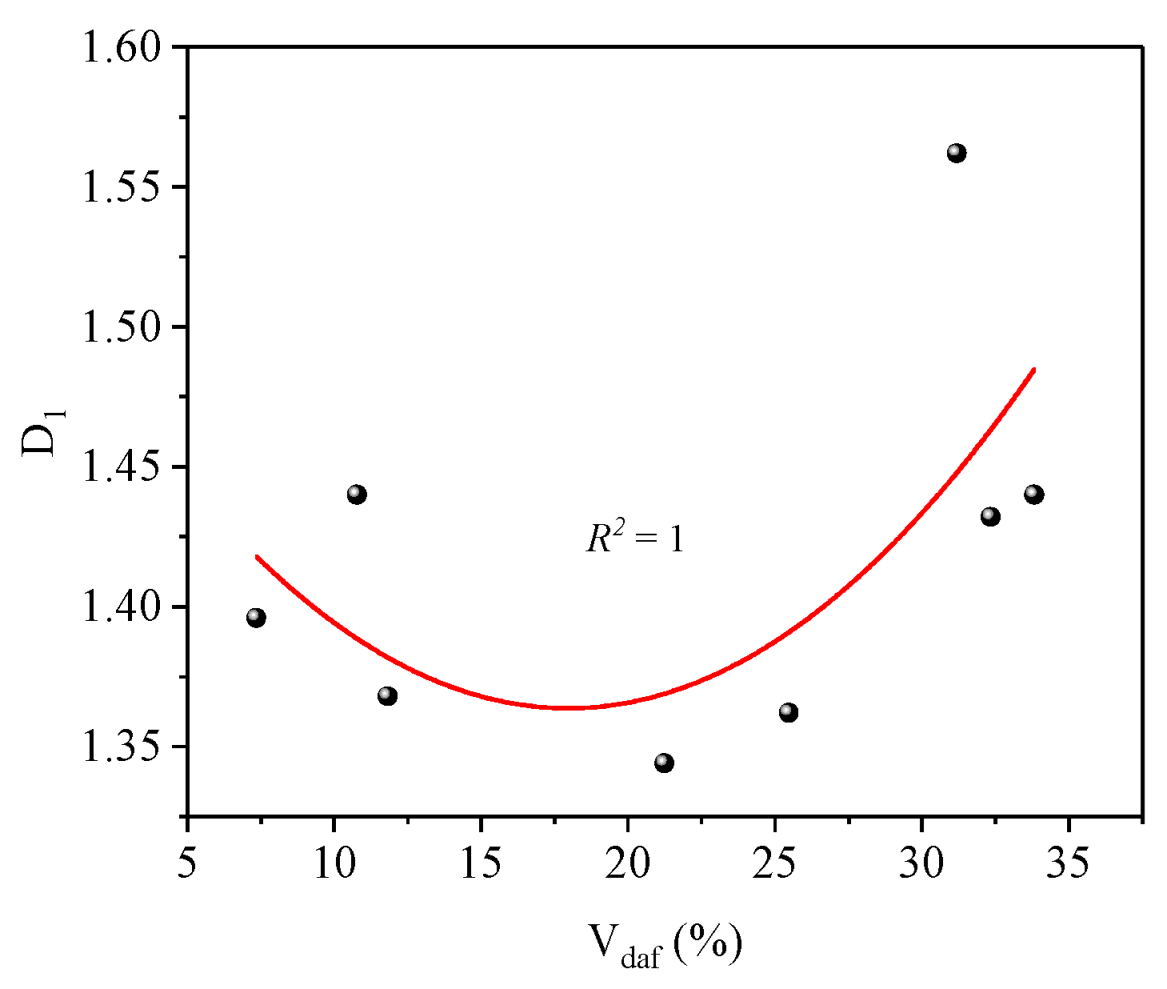
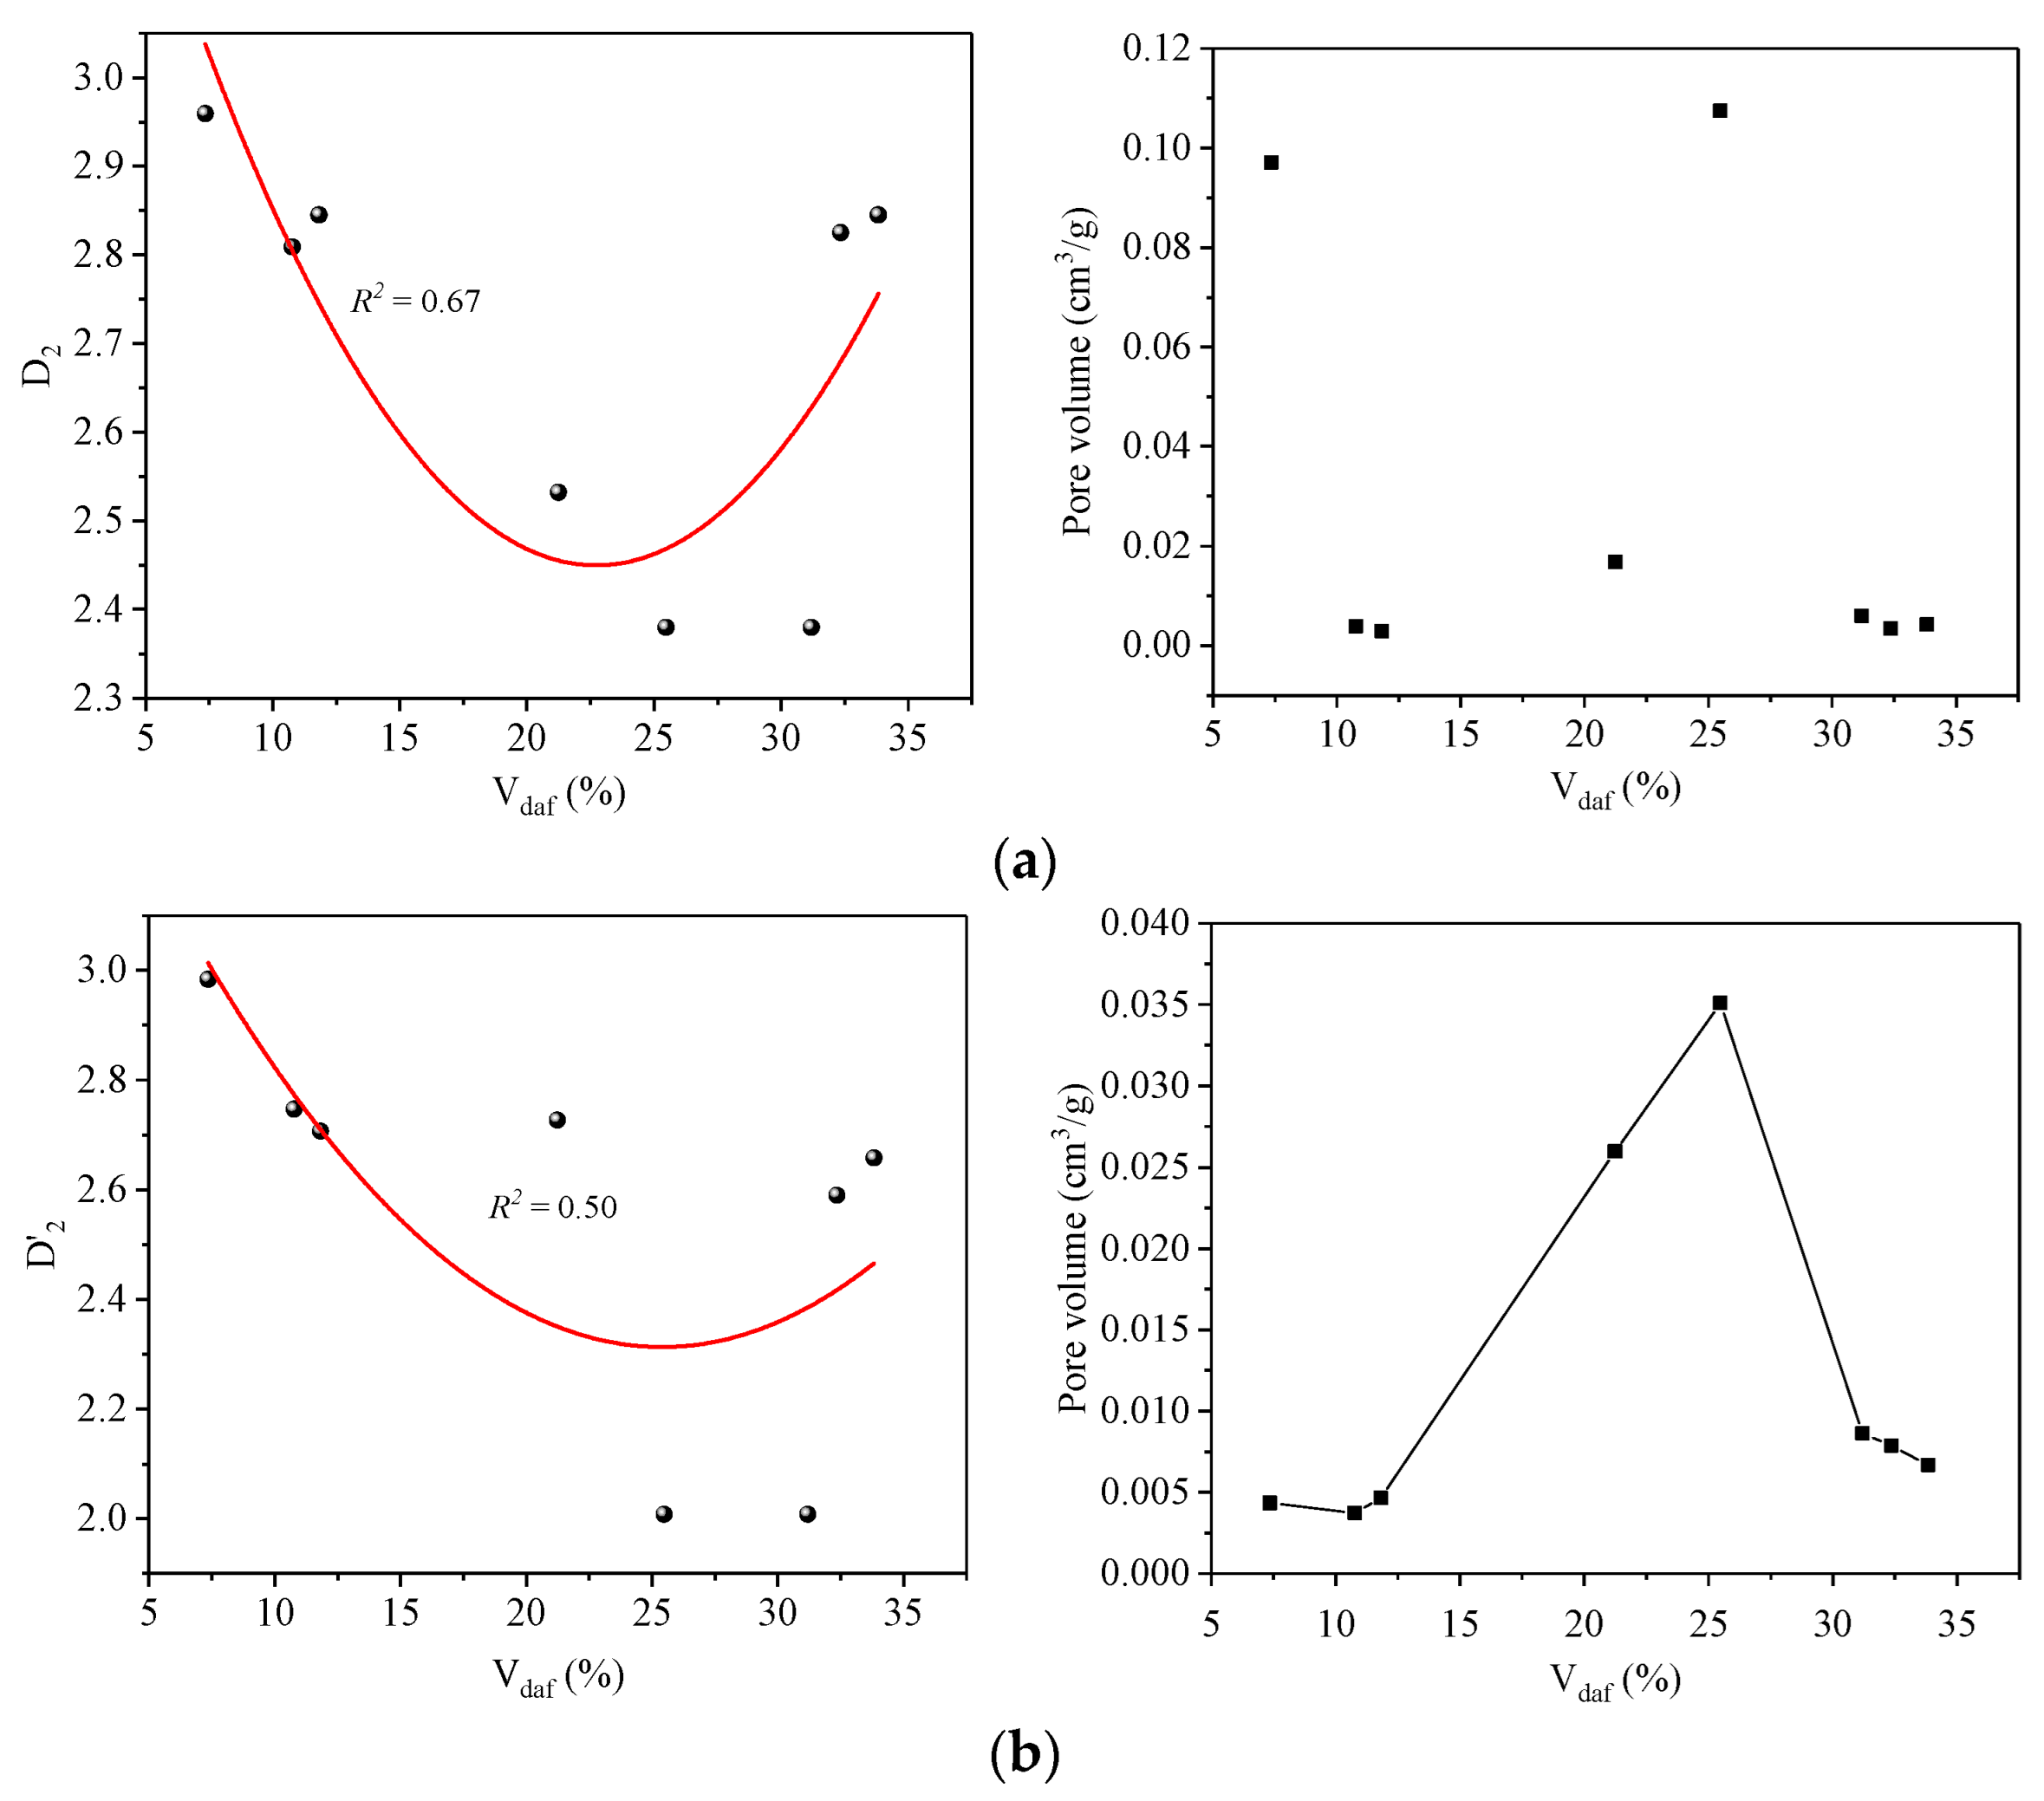
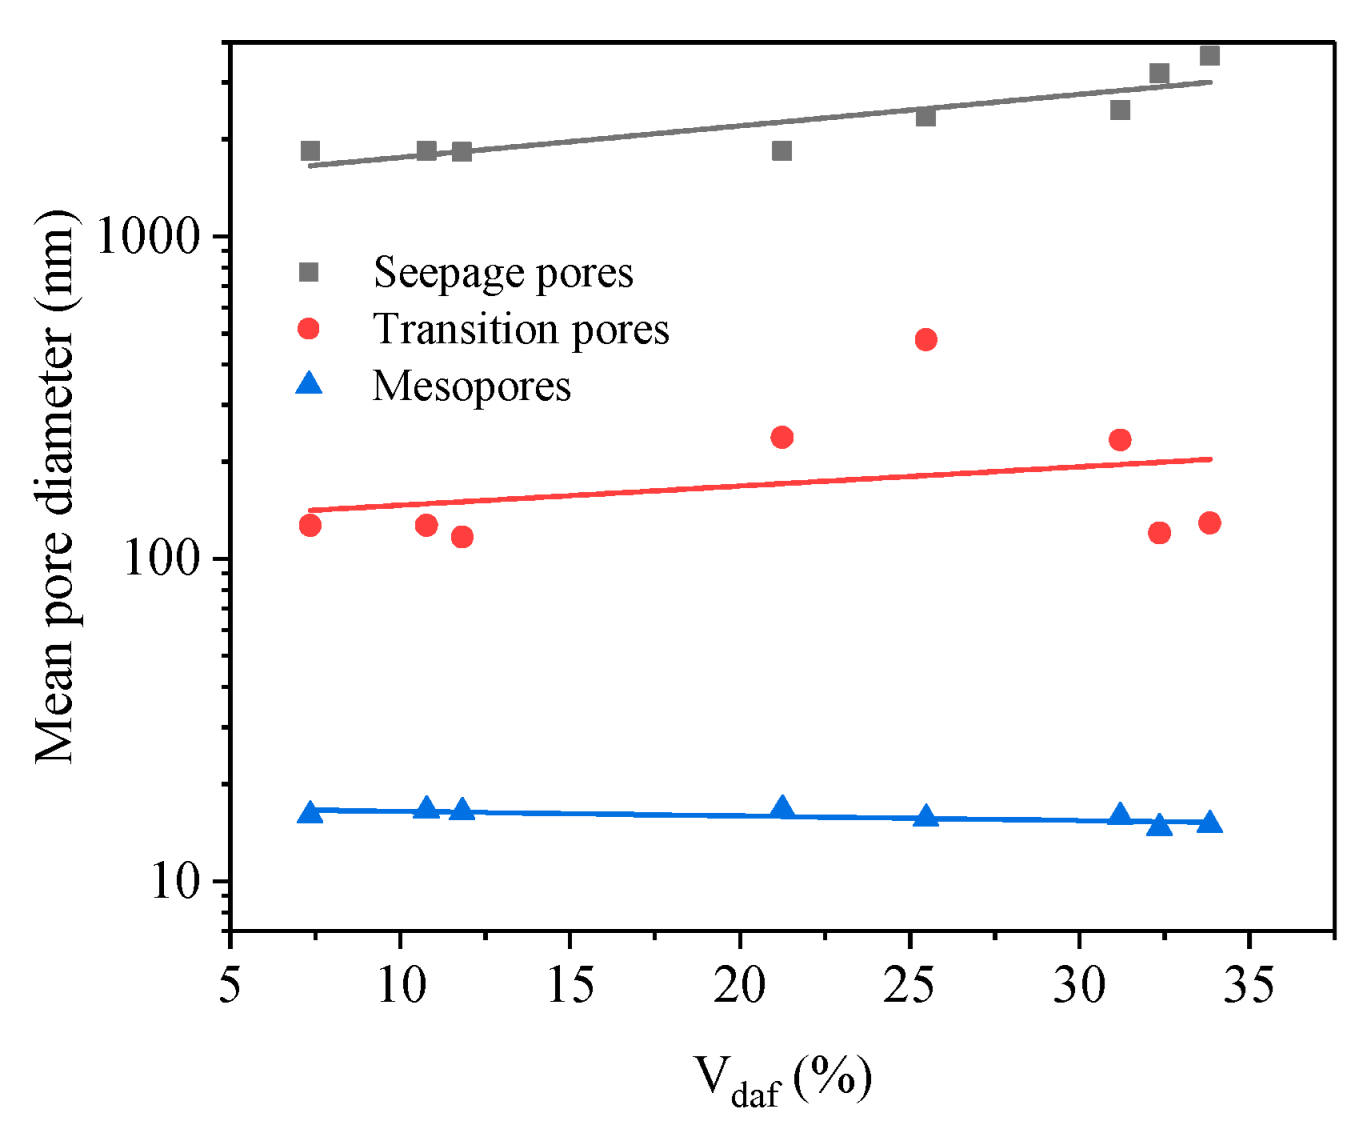
Figure 7 shows the correlational analysis between the fractal dimension (D1) and Vdaf for the eight samples. The analysis shows that D1 has the U-shaped curve relationship with Vdaf, with a minimum value of 1.344 at around 21% Vdaf. When Vdaf > 21%, the D1 values increase with the increase in Vdaf. When Vdaf < 21%, D1 values decrease with the increase in Vdaf. Similarly, variations of D2 and D′2 values have the U-shaped trend, and both D2 and D′2 reach the minimum for 25% Vdaf (Figure 8a,b). The pore volume of the seepage pores has little correlation with Vdaf, while the transition pores show a trend from growth to decline, with a peak value of 0.0351 cm3/g at around 25% Vdaf. D″2 values show an increasing trend with increase in coalification degree and coal rank (Figure 8c), reaching a maximum value of 2.984. Mesopore volume is affected by Vdaf and presents a decreasing trend from low to middle coalification degree and an increasing trend from middle to high. The correlations between Vdaf and pore size are illustrated in Figure 9. The coalification process decreases the mean pore size of the seepage and transition pores within coal and that shows a negative correlation with coalification degree. Due to a lack of the measurements of mesopores less than 7 nm in pore size, the mean size of the mesopores for different coal presents less variations and is around 15.8 nm. According to the PSD of different coal, the most probable size of a mesopore is less than 10 nm. Therefore, smaller mesopores have a significant effect on D″2.
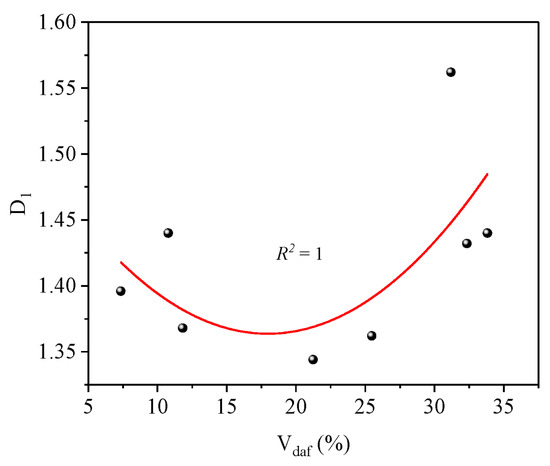
Figure 7.
Relationship between Vdaf and fractal dimensions (D1).
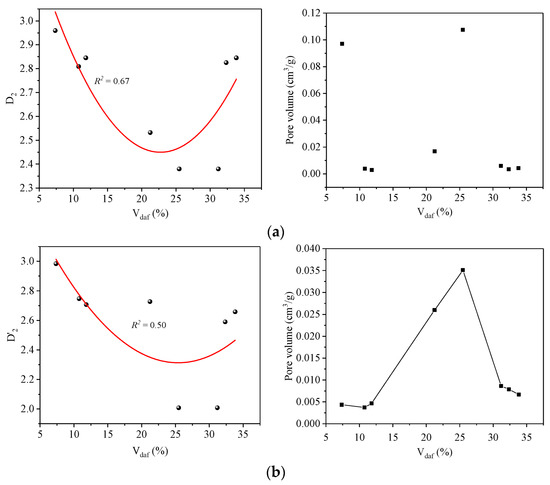
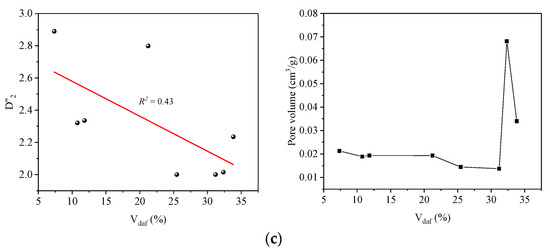
Figure 8.
Relationship of Vdaf with fractal dimensions (D2, D′2 and D″2) and pore volume: (a) seepage pores; (b) transition pores; (c) mesopores.

Figure 9.
Relationship between Vdaf and pore size.
Both pore volume and pore size affect the complexity of pore structure. The pore volume has a significant effect on D′2, while the influences of pore size on D2 and D″2 are obvious. Increased pore volume of the seepage and transition pores can improve the connectivity between the pores and lead to a simpler and flatter pore morphology from low rank to middle rank. However, more newly developed smaller pores in the process of coalification increase the roughness and irregularity of the pore system due to difference in the pore size magnitude. Therefore, the complexity of the pore structure increases obviously, from the middle rank to the high rank.
6. Conclusions
Multiscale fractal analysis of eight coal samples was applied to investigate the irregularities of pore structure, using SEM images and MIP data. The effect of coalification on PSD and fractal dimensions was analyzed. The main conclusions can be drawn as follows:
- (1)
- A combined fractal analysis of SEM and MIP is a feasible way to obtain abundant information about natural coal, providing a 2-D view of pore morphology and inner structure data, respectively. Macropores are presented as the isolated clusters embedded in the network of smaller pores, and the difference of the order of magnitude of pores’ sizes affects the connectivity between the pores;
- (2)
- Multiple fractal analysis using MIP data are effectively conducted by classifying pore-size range as seepage pores, transition pores and mesopores. The fractal dimensions (D1, D2, D′2 and D″2) have close correlations with the coalification degree, which can be depicted by Vdaf;
- (3)
- In the process of coalification, an increase in pore volume can improve the connectivity and lead a simpler and flatter pore morphology, and the developed smaller pores increase the roughness and irregularity of the pore system. Pore size has a significant effect on the fractal dimensions of seepage and mesopores (D2 and D″2), while the effect of pore volume on the fractal dimensions of the transition pores (D′2) is important. Multiscale fractal analysis is beneficial to explore the structure of natural coal.
Funding
This work is financially supported by the General Program of National Natural Science of China (Grant No. 52174187) and the State Key Program of National Natural Science of China (Grant No. 52130409).
Institutional Review Board Statement
Not applicable.
Informed Consent Statement
Not applicable.
Data Availability Statement
Not applicable.
Conflicts of Interest
The authors declare no conflict of interest.
References
- Wood, D.A. Deriving coal fractal dimensions from low-pressure nitrogen adsorption isotherms applying an integrated method. Appl. Geochem. 2021, 131, 105042. [Google Scholar] [CrossRef]
- Liu, X.F.; Nie, B.S. Fractal characteristics of coal samples utilizing image analysis and gas adsorption. Fuel 2016, 182, 314–322. [Google Scholar] [CrossRef]
- Tang, J.W.; Feng, L.; Li, Y.J.; Liu, J.; Liu, X.C. Fractal and pore structure analysis of Shengli lignite during drying process. Powder Technol. 2016, 303, 251–259. [Google Scholar] [CrossRef]
- An, F.-H.; Cheng, Y.-P.; Wu, D.-M.; Wang, L. The effect of small micropores on methane adsorption of coals from Northern China. Adsorption 2013, 19, 83–90. [Google Scholar] [CrossRef]
- Jin, K.; Cheng, Y.P.; Liu, Q.Q.; Zhao, W.; Wang, L.; Wang, F.; Wu, D.M. Experimental investigation of pore structure damage in pulverized coal: Implications for methane adsorption and diffusion characteristics. Energ Fuel 2016, 30, 10383–10395. [Google Scholar] [CrossRef]
- Yang, H.; Liu, Z.; Zhao, D.; Lv, J.; Yang, W. Insights into the fluid wetting law and fractal characteristics of coal particles during water injection based on nuclear magnetic resonance. Chaos Solitons Fractals 2022, 159, 112109. [Google Scholar] [CrossRef]
- Chalmers, G.R.; Bustin, R.M.; Power, I.M. Characterization of gas shale pore systems by porosimetry, pycnometry, surface area, and field emission scanning electron microscopy/transmission electron microscopy image analyses: Examples from the Barnett, Woodford, Haynesville, Marcellus, and Doig units. Aapg Bull. 2012, 96, 1099–1119. [Google Scholar]
- Nie, B.S.; Liu, X.F.; Yang, L.L.; Meng, J.Q.; Li, X.C. Pore structure characterization of different rank coals using gas adsorption and scanning electron microscopy. Fuel 2015, 158, 908–917. [Google Scholar] [CrossRef]
- Clarkson, C.R.; Solano, N.; Bustin, R.M.; Bustin, A.M.M.; Chalmers, G.R.; He, L.; Melnichenko, Y.B.; Radliński, A.P.; Blach, T.P. Pore structure characterization of North American shale gas reservoirs using USANS/SANS, gas adsorption, and mercury intrusion. Fuel 2013, 103, 606–616. [Google Scholar] [CrossRef]
- Liu, Z.; Liu, D.; Cai, Y.; Yao, Y.; Pan, Z.; Zhou, Y. Application of nuclear magnetic resonance (NMR) in coalbed methane and shale reservoirs: A review. Int J Coal Geol 2020, 218. [Google Scholar] [CrossRef]
- Everett, D.H. Manual of Symbols and Terminology for Physicochemical Quantities and Units, Appendix II: Definitions, Terminology and Symbols in Colloid and Surface Chemistry. Pure Appl. Chem. 1972, 31, 577–638. [Google Scholar] [CrossRef]
- Zhao, Y.; Wang, C.; Ning, L.; Zhao, H.; Bi, J. Pore and fracture development in coal under stress conditions based on nuclear magnetic resonance and fractal theory. Fuel 2022, 309, 122112. [Google Scholar] [CrossRef]
- Su, E.; Liang, Y.; Zou, Q. Structures and fractal characteristics of pores in long-flame coal after cyclical supercritical CO2 treatment. Fuel 2021, 286, 119305. [Google Scholar] [CrossRef]
- Li, S.; Tang, D.; Xu, H.; Yang, Z.; Guo, L. Porosity and Permeability Models for Coals Using Low-Field Nuclear Magnetic Resonance. Energy Fuels 2012, 26, 5005–5014. [Google Scholar] [CrossRef]
- Yao, Y.; Liu, D.; Tang, D.; Tang, S.; Huang, W.; Liu, Z.; Che, Y. Fractal characterization of seepage-pores of coals from China: An investigation on permeability of coals. Comput. Geosci. 2009, 35, 1159–1166. [Google Scholar] [CrossRef]
- Katz, A.J.; Thompson, A.H. Fractal Sandstone Pores: Implications for Conductivity and Pore Formation. Phys. Rev. Lett. 1985, 54, 1325–1328. [Google Scholar] [CrossRef]
- Nie, B.; Wang, K.; Gao, Q.; Cao, M. Pore Distribution and Variation Rules of the Coal Sample with CO2 Adsorption at Different Pressures Based on Small-Angle X-ray Scattering. Energy Fuels 2021, 35, 2243–2252. [Google Scholar] [CrossRef]
- Yi, M.; Cheng, Y.; Wang, C.; Wang, Z.; Hu, B.; He, X. Effects of composition changes of coal treated with hydrochloric acid on pore structure and fractal characteristics. Fuel 2021, 294, 120506. [Google Scholar] [CrossRef]
- Hongchao, X.; Guanhua, N.; Shang, L.; Qian, S.; Kai, D.; Jingna, X.; Gang, W.; Yixin, L. The influence of surfactant on pore fractal characteristics of composite acidized coal. Fuel 2019, 253, 741–753. [Google Scholar] [CrossRef]
- Wang, X.; Cheng, Y.; Zhang, D.; Liu, Z.; Wang, Z.; Jiang, Z. Influence of tectonic evolution on pore structure and fractal characteristics of coal by low pressure gas adsorption. J. Nat. Gas Sci. Eng. 2021, 87, 103788. [Google Scholar] [CrossRef]
- Sun, W.; Feng, Y.; Jiang, C.; Chu, W. Fractal characterization and methane adsorption features of coal particles taken from shallow and deep coalmine layers. Fuel 2015, 155, 7–13. [Google Scholar] [CrossRef]
- Zhu, F.; Hu, W.; Cao, J.; Sun, F.; Liu, Y.; Sun, Z. Micro/nanoscale pore structure and fractal characteristics of tight gas sandstone: A case study from the Yuanba area, northeast Sichuan Basin, China. Mar. Pet. Geol. 2018, 98, 116–132. [Google Scholar] [CrossRef]
- Xie, H.; Wang, J.-A.; Kwaśniewski, M.A. Multifractal characterization of rock fracture surfaces. Int. J. Rock Mech. Min. Sci. 1999, 36, 19–27. [Google Scholar] [CrossRef]
- Wang, F.; Cheng, Y.P.; Lu, S.Q.; Jin, K.; Zhao, W. Influence of Coalification on the Pore Characteristics of Middle High Rank Coal. Energy Fuels 2014, 28, 5729–5736. [Google Scholar] [CrossRef]
- Liu, Z.; Zhu, D.; Yang, H.; Wang, W.; Yang, W. Experimental research on different metamorphic grades of coal bodies with macro–mesoscopic structure fractal characteristics. Geomech. Energy Environ. 2022, 30, 100337. [Google Scholar] [CrossRef]
- Fu, H.; Tang, D.; Xu, T.; Xu, H.; Tao, S.; Li, S.; Yin, Z.; Chen, B.; Zhang, C.; Wang, L. Characteristics of pore structure and fractal dimension of low-rank coal: A case study of Lower Jurassic Xishanyao coal in the southern Junggar Basin, NW China. Fuel 2017, 193, 254–264. [Google Scholar] [CrossRef]
- Ouyang, Z.; Liu, D.; Cai, Y.; Yao, Y. Fractal Analysis on Heterogeneity of Pore-Fractures in Middle-High Rank Coals with NMR. Energy Fuels 2016, 30, 5449–5458. [Google Scholar] [CrossRef]
- Ouyang, Z.; Liu, D.; Cai, Y.; Yao, Y. Investigating the Fractal Characteristics of Pore-Fractures in Bituminous Coals and Anthracites through Fluid Flow Behavior. Energy Fuels 2016, 30, 10348–10357. [Google Scholar] [CrossRef]
- Pan, J.; Wang, K.; Hou, Q.; Niu, Q.; Wang, H.; Ji, Z. Micro-pores and fractures of coals analysed by field emission scanning electron microscopy and fractal theory. Fuel 2016, 164, 277–285. [Google Scholar] [CrossRef]
- Zhang, B.; Li, S. Determination of the Surface Fractal Dimension for Porous Media by Mercury Porosimetry. Ind. Eng. Chem. Res. 1995, 34, 1383–1386. [Google Scholar] [CrossRef]
- Yang, Q.; Xue, J.; Li, W.; Du, X.; Ma, Q.; Zhan, K.; Chen, Z. Comprehensive evaluation and interpretation of mercury intrusion porosimetry data of coals based on fractal theory, Tait equation and matrix compressibility. Fuel 2021, 298, 120823. [Google Scholar] [CrossRef]
- Washburn Edward, W. Note on a Method of Determining the Distribution of Pore Sizes in a Porous Material. Proc. Natl. Acad. Sci. USA 1921, 7, 115–116. [Google Scholar] [CrossRef]
- Liu, C.; Shi, B.; Zhou, J.; Tang, C.-S. Quantification and characterization of microporosity by image processing, geometric measurement and statistical methods: Application on SEM images of clay materials. Appl. Clay Sci. 2011, 54, 97–106. [Google Scholar] [CrossRef]
- Liu, C.; Tang, C.-S.; Shi, B.; Suo, W.-B. Automatic quantification of crack patterns by image processing. Comput. Geosci. 2013, 57, 77–80. [Google Scholar] [CrossRef]
- Prakongkep, N.; Suddhiprakarn, A.; Kheoruenromne, I.; Gilkes, R.J. SEM image analysis for characterization of sand grains in Thai paddy soils. Geoderma 2010, 156, 20–31. [Google Scholar] [CrossRef]
- Jiao, K.; Yao, S.; Liu, C.; Gao, Y.; Wu, H.; Li, M.; Tang, Z. The characterization and quantitative analysis of nanopores in unconventional gas reservoirs utilizing FESEM–FIB and image processing: An example from the lower Silurian Longmaxi Shale, upper Yangtze region, China. Int. J. Coal Geol. 2014, 128, 1–11. [Google Scholar] [CrossRef]
- Voss, R.F.; Laibowitz, R.B.; Alessandrini, E.I. Fractal Geometry of Percolation in Thin Gold Films. In Scaling Phenomena in Disordered Systems; Pynn, R., Skjeltorp, A., Eds.; Springer: Boston, MA, USA, 1991; pp. 279–288. [Google Scholar]
- Moore, C.A.; Donaldson, C.F. Quantifying soil microstructure using fractals. Geotechnique 1995, 45, 105–116. [Google Scholar] [CrossRef]
- Angulo, R.F.; Alvarado, V.; Gonzalez, H. Fractal Dimensions from Mercury Intrusion Capillary Tests. In Proceedings of the SPE Latin America Petroleum Engineering Conference, Caracas, Venezuela, 8–11 March 1992; p. SPE-23695-MS. [Google Scholar]
- Friesen, W.I.; Mikula, R.J. Fractal dimensions of coal particles. J. Colloid Interface Sci. 1987, 120, 263–271. [Google Scholar] [CrossRef]
- Hodot, B.B. Coal and Gas Outburst; China Industry Press: Beijing, China, 1966; pp. 18–33. [Google Scholar]
- Zhang, J.; Wei, C.; Zhao, J.; Ju, W.; Chen, Y.; Tamehe, L.S. Comparative evaluation of the compressibility of middle and high rank coals by different experimental methods. Fuel 2019, 245, 39–51. [Google Scholar] [CrossRef]
- Li, W.; Liu, H.; Song, X. Multifractal analysis of Hg pore size distributions of tectonically deformed coals. Int. J. Coal Geol. 2015, 144, 138–152. [Google Scholar] [CrossRef]
- Shi, X.; Pan, J.; Hou, Q.; Jin, Y.; Wang, Z.; Niu, Q.; Li, M. Micrometer-scale fractures in coal related to coal rank based on micro-CT scanning and fractal theory. Fuel 2018, 212, 162–172. [Google Scholar] [CrossRef]
- Pan, J.; Zhao, Y.; Hou, Q.; Jin, Y. Nanoscale Pores in Coal Related to Coal Rank and Deformation Structures. Transp. Porous Media 2015, 107, 543–554. [Google Scholar] [CrossRef]
- Gürdal, G.; Yalçın, M.N. Pore volume and surface area of the Carboniferous coals from the Zonguldak basin (NW Turkey) and their variations with rank and maceral composition. Int. J. Coal Geol. 2001, 48, 133–144. [Google Scholar] [CrossRef]


Publisher’s Note: MDPI stays neutral with regard to jurisdictional claims in published maps and institutional affiliations. |
© 2022 by the author. Licensee MDPI, Basel, Switzerland. This article is an open access article distributed under the terms and conditions of the Creative Commons Attribution (CC BY) license (https://creativecommons.org/licenses/by/4.0/).