Article

Modeling and Analysis of New Power Devices Based on Linear Phase-Shifting Transformer

School of Electrical Engineering, Naval University of Engineering, Jiefang Road 717, Wuhan 430000, China
*
Author to whom correspondence should be addressed.
Processes 2022, 10(8), 1596; https://doi.org/10.3390/pr10081596
Submission received: 13 July 2022 / Revised: 8 August 2022 / Accepted: 9 August 2022 / Published: 12 August 2022
(This article belongs to the Special Issue Modeling, Analysis and Control Processes of New Energy Power Systems)

Abstract

:
With the rapid development of new power systems, various new power devices have also been developed. It is very important to establish analytical models of new power devices to ensure or even improve the reliability and stability of the power system. A linear phase-shifting transformer (LPST) is a new type of power device that mainly relies on air gaps to transfer energy, so establishing an accurate air-gap magnetic field model is very important for improving the efficiency of this system. In this paper, an analytical model of an unequal-pitch linear phase-shifting transformer (UP-LPST) was established by combining the distributed magnetic circuit method (DMCM) and Schwartz–Christopher transformation (SCT). Taking the magnetic field strength as a variable, an accurate magnetic field analysis model for a UP-LPST considering saturation, cogging, and edge was established. Taking a 1 kw UP-LPST as a prototype, the accuracy of the model was verified by the finite element method and experiments. This modeling method could also be used to establish magnetic field models of other similar structures in new energy power systems, especially those with cogging structures.

1. Introduction

The operation of a new energy power system must have a high level of reliability. However, ensuring the stable operation of any line component of a power system is complex. Its stability and reliability are determined by different characteristic parameters of the system. The main influencing factors include different impedances of parallel lines in the system, the power factor, changes in the input power, and changes in the load [1,2,3]. A variety of electrical devices have been developed, with the phase-shifting transformer being one of the most important technologies. This device can control the current distribution between the branches of a parallel power system through the adjustment of the phase angle. At the same time, it can solve the overload problem caused by the unbalanced impedance of parallel transmission lines and improve the stability and efficiency of the power system, so it has received extensive attention from scholars at home and abroad [4,5,6].
As a new type of phase-shifting transformer, the linear phase-shifting transformer (LPST) has many advantages. Compared with the traditional phase-shifting transformer, its core structure is simple, the air gap adjustment is easy, the phase-shifting angle is wide, and the volume is small [7,8,9]. At the same time, it can effectively eliminate low-order harmonics, improve the quality of output waveforms, and reduce power grid harmonic pollution [10]. The LPST is a power device that mainly relies on air gaps to transfer energy, and there are several rectangular slots on the primary and secondary sides of the LPST to hold winding coils. This slotted structure produces a degree of cogging, which results in a significant increase in the tooth harmonic amplitude and distorts the air-gap magnetic field. More seriously, it reduces the quality of the output waveform and increases the energy loss [11], thereby reducing the stability and efficiency of the power system. Furthermore, because of the linear structure of an LPST, its core is not continuous. Therefore, the end effect is also an important factor affecting the output of the system, and it is particularly important to establish an accurate LPST magnetic field analysis model.
Due to the particularity of the LPST’s structure, traditional modeling methods are not fully applicable. Therefore, we referred to the modeling method of linear motors to conduct our research. At present, the most common research methods include the direct method and the indirect method. In the direct method [12,13,14], the whole magnetic field is divided into the slot, the air gap, and the other subdomains using the method of partition modeling, and the expressions for each part of the magnetic field are obtained by solving the Laplace equation. The indirect method [15,16,17] involves multiplying the slotless air-gap magnetic field model by the air-gap’s specific permeability to obtain the analytical formula of the cogging air-gap magnetic field. In [18], a combination of a linear and a sinusoidal air-gap ratio permeability function was used to represent the air-gap ratio permeability in a single slot to consider the influence of motor stator slotting. The authors of [19] determined the actual air-gap flux distribution on permanent magnets through the superimposed relative permeability algorithm. In [20], the air-gap permeability function on the surface of a smooth rotor was obtained using the mirror image method, which considered the interaction of slots. The authors of [21] designed a new air-gap relative permeability formula by applying an offset at the outer diameter of the rotor. In [22], the distribution of the air-gap magnetic field at the edge of a linear rotating permanent-magnet synchronous motor was calculated, and the relative permeability function of the air gap was solved using SCT. In [23], an analytical model of a fractional-slot linear phase-shifting transformer was established by the precise subdomain method. The model considered the influence of magnetic permeability, structural parameters, and the interaction between tooth slots on the magnetic field distribution. However, the analytical formula was too complicated and could not consider the influence of saturation.
In this paper, the slotless magnetic field and saturation were determined by the DMCM [24,25,26,27]. Taking a single slot on the primary side as an example, the single slot area was selected as the smallest unit. The irregular magnetic field was mapped into a regular magnetic field pattern by SCT. The air-gap relative permeance in the whole length range of the linear phase-shifting transformer was calculated by the above procedure. Then, the edge end was taken as an independent analytical model, and the distribution function of the air-gap relative permeance at the edge end was obtained. Based on the analytical model, the UP-LPST was taken as an example to analyze the effect of the slot on the air-gap magnetic field. At the same time, a UP-LPST with different slot spacing ratios was modeled and analyzed. The accuracy of the proposed model was verified by a comparison of the results obtained by the FEM and those obtained through experiments.

2. Analytical Model of Slotless Magnetic Field

The structure of a UP-LPST is basically the same as that of a linear motor. A diagram of its main structure is shown in Figure 1. The difference is that the length of the core on the primary and secondary sides of the UP-LPST is the same, and its core is symmetric about the air gap. Four groups of three-phase windings are distributed longitudinally along the core on the primary side, and one group of three-phase windings on the secondary side. In contrast to conventional phase-shifting transformers, the energy conversion of a UP-LPST is mainly realized by an air-gap traveling-wave magnetic field. When the primary winding of the UP-LPST is energized, a linear traveling-wave magnetic field can be generated in the core, and then a three-phase electromotive force is induced in the secondary side.
The UP-LPST studied in this paper comprised a pair of poles, as shown in Figure 1. The primary side was composed of four groups of three-phase bridge inverter circuits with a twelve-phase input (a1-x1, a2-x2, …, c3-z3, c4-z4), and the windings were distributed with full pitch. The secondary side comprised a three-phase output (A1-X1-A2-X2-A3-X3-A4-X4, …), and the windings were distributed in a combination of long-distance winding and short-distance winding. This winding distribution could effectively improve the three-phase asymmetry caused by the discontinuity of the core. The core structures of the primary and secondary sides were completely consistent and symmetric with respect to the air gap.
Firstly, in order to obtain the magnetic field without grooves, the following basic assumptions were made [26]:
1.
The primary and secondary side end flux leakage is ignored.
2.
The flux lines in the virtual teeth are all arranged in the longitudinal direction, and the flux lines in the yokes are all arranged in the normal direction.
3.
The size of the primary- and secondary-side virtual teeth is the same.
4.
The interaction of adjacent slots (virtual slots) is ignored.
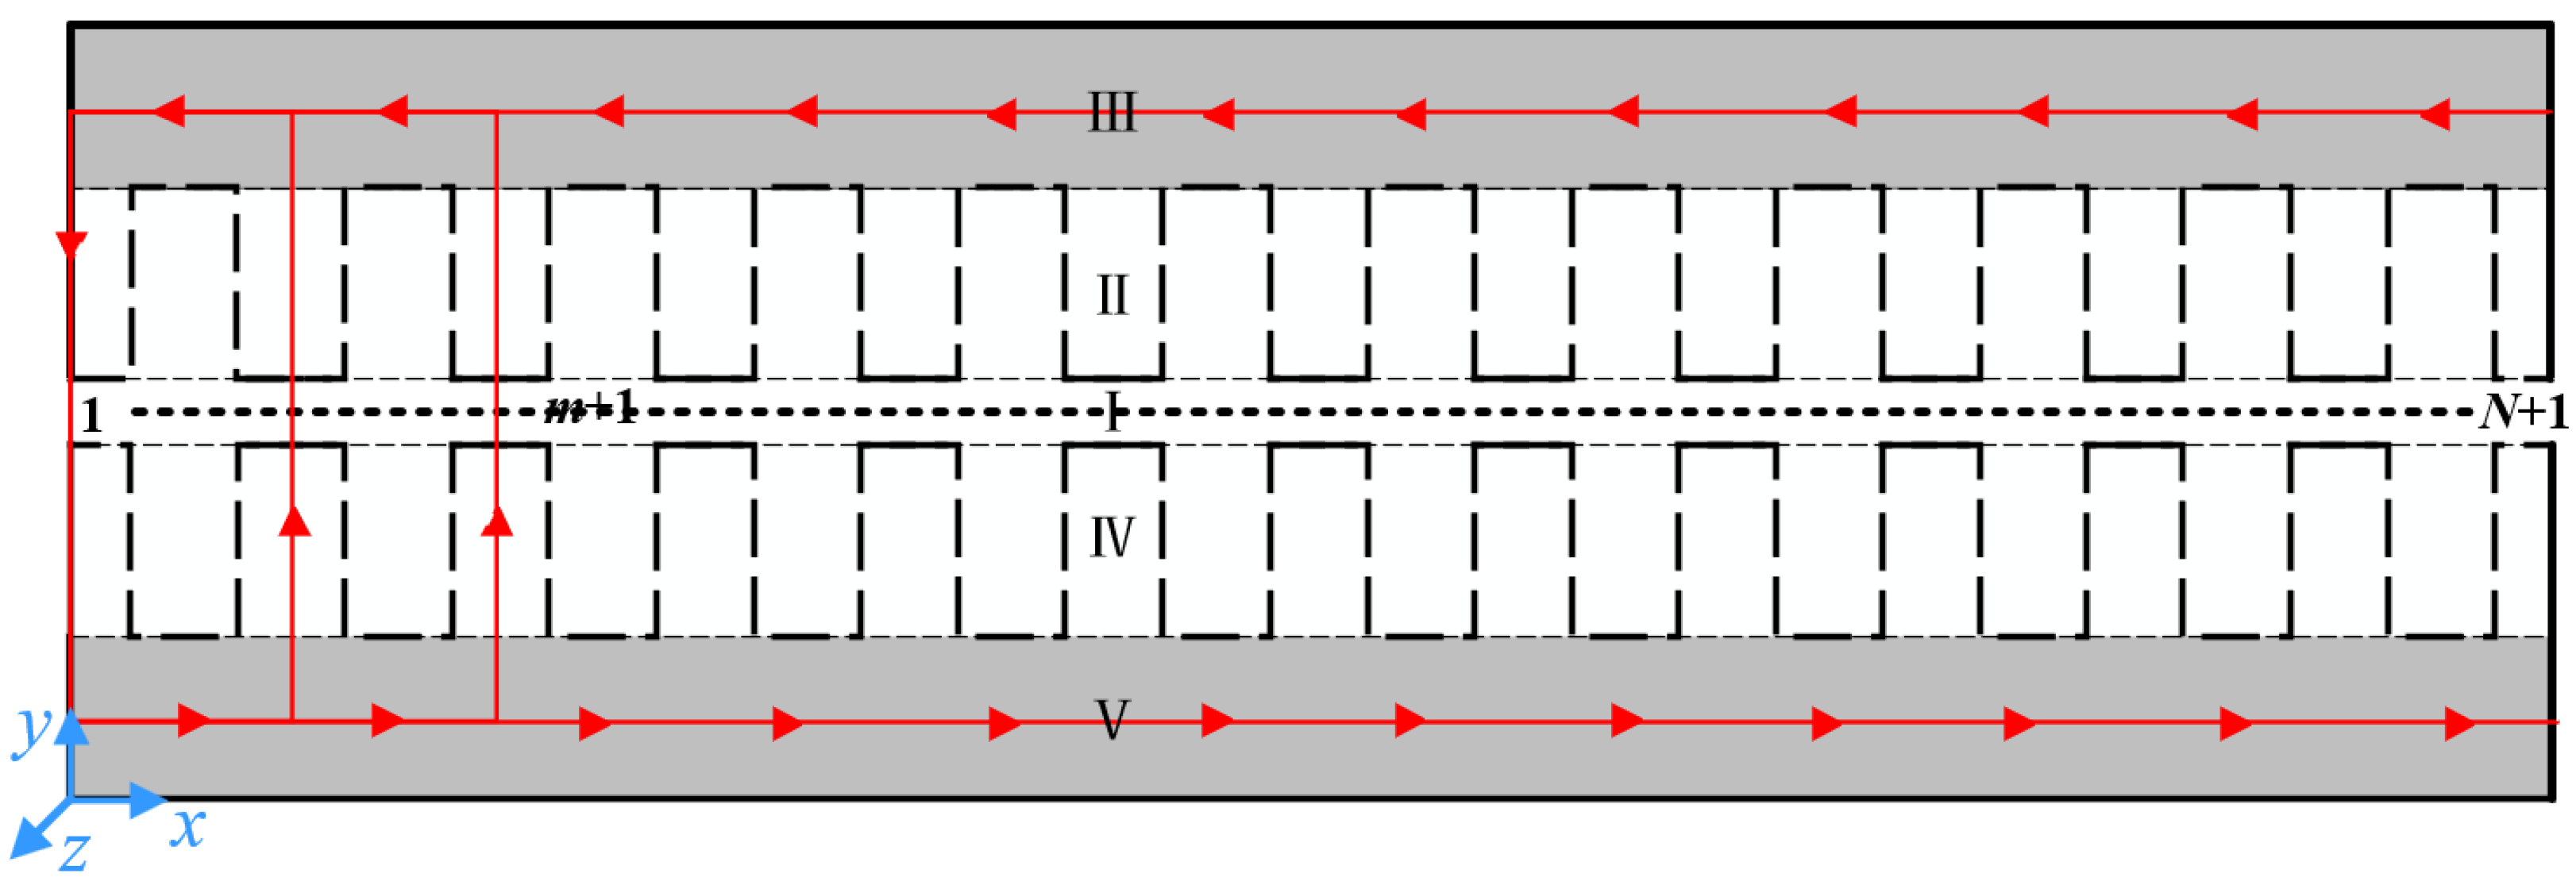
The overall model was divided into five regions along the longitudinal direction for magnetic circuit calculation, as shown in Figure 2, where I is the air-gap region; II and III are the primary-side virtual teeth and the yoke region, respectively; and IV and V are the secondary-side virtual teeth and the yoke region, respectively.
For the loop shown in Figure 2:
F ( m ) = F δ _ n ( m + 1 ) + F j 2 _ l ( m ) + F t 1 _ n ( m + 1 ) + F t 2 _ n ( m + 1 ) F δ _ n ( m ) F j 1 _ l ( m ) F t 1 _ n ( m ) F t 2 _ n ( m )
where Fδ_n (m) and Fδ_n (m + 1) are the air-gap normal magnetic pressure drops at node m and node m + 1, respectively; Fj1_l (m) and Fj2_l (m) are the longitudinal magnetic pressure drops of the yoke at the core node m on the primary and secondary sides, respectively; and Ft1_n (m), Ft1_n (m + 1), Ft2_n (m), and Ft2_n (m + 1) are the normal magnetic pressure drops of the virtual teeth at the core node m and node m + 1 on the primary and secondary sides, respectively. The positive direction of the coordinate axis is the positive direction of the magnetic pressure drop of each section.
Because the primary and secondary sides of the straight-line phase-shifting transformer were symmetric about the center line of the air gap, the model could be simplified to a one-sided model, as shown in Figure 3 [27].
The total magnetic pressure drop of the circuit could be simplified as:
F ( m ) = F δ _ n ( m + 1 ) + F t 1 _ n ( m + 1 ) F δ _ n ( m ) F j 1 _ l ( m ) F t 1 _ n ( m )
Each MMF could be expressed as follows:
F δ _ n ( m ) = H δ _ n ( m ) δ = B δ 0 _ s l o t l e s s _ n ( m ) μ 0 δ F t 1 _ n ( m ) = H t 1 _ n ( m ) h t 1 = B t 1 _ n ( m ) μ t 1 ( m ) h t 1 F j 1 _ l ( m ) = H j 1 _ l ( m ) + H j 1 _ l ( m + 1 ) 2 d x = d x 2 B j 1 _ l ( m + 1 ) μ j 1 ( m + 1 ) + B j 1 _ l ( m ) μ j 1 ( m )
where Hδ_n is the magnetic field intensity in the normal direction of the air gap; Bt1_n and Ht1_n denote the flux density and magnetic field intensity in the normal direction of the primary-side virtual teeth, respectively; Bj1_l and Hj1_l denote the flux density and magnetic field intensity in the longitudinal direction of the primary yoke, respectively; δ is the length of the air gap; ht1 is the virtual tooth height of the primary core; μ0 is the air permeability; and μj1 denotes the permeability of each node of the primary yoke.
When the tooth is not saturated, the main flux within a pitch can be considered to pass entirely through the tooth. At this point, the tooth magnetic flux densities at node m are as follows:
B t 0 _ n ( m ) = B δ 0 _ s l o t l e s s _ n ( m ) H t 1 K F e L b t
where H and L are the height and length of the core of the UP-LPST, respectively; bt is the tooth width of the UP-LPST; t1 is the tooth pitch; and KFe is the superposition coefficient of the core.
However, when the teeth are saturated, most of the main flux passes through the teeth, and the rest enters the yoke through the slot. At this time, the actual magnetic flux in the tooth becomes smaller, so it was necessary to revise (5) as follows:
B t _ n ( m ) = B t _ n ( m ) μ 0 H t _ n ( m ) k δ
where B′t_n (m) is the normal apparent magnetic flux density of the tooth at node m, representing the magnetic flux density when all the flux enters the tooth; Bt_n (m) is the actual normal magnetic flux density of the tooth at node m; Ht_n (m) is the actual normal magnetic field intensity of the tooth at node m; and kδ is the slot coefficient, kδ = (H·bs)/(KFe·L·bt).
According to the continuity of magnetic flux, the longitudinal magnetic flux density of the yoke at node m is equal to the total normal magnetic flux density of the air gap from node 1 to node m. The magnetic flux density of the yoke was calculated as follows:
B j 1 _ l ( x ) = ϕ j ( x ) K F e h j 1 D = L K F e h j 1 D x 0 B ( x ) d x
where D is the thickness of the UP-LPST.
Therefore, the magnetic flux density of the yoke of the primary core could be represented as follows:
B j 1 _ l ( m ) = 0 m = 1 L d x k = 1 m 1 B δ 0 _ s l o t l e s s _ n ( k ) + B δ 0 _ s l o t l e s s _ n ( k + 1 ) 2 K F e h j 1 D m = [ 2 , N ]
Meanwhile, it could be shown that the total air-gap flux in the whole length range of the UP-LPST is 0:
ϕ g ( N ) = L d x k = 1 N B δ _ n ( k ) + B δ _ n ( k + 1 ) 2 = 0
For the UP-LPST, the harmonic frequency of the fundamental wave current is 24k ± 1, so the lowest is the 23rd harmonic. Due to the high harmonic order, only the fundamental MMF was considered to simplify the calculation. Thus, the MMF of each air-gap node was calculated as:
F ( m ) = τ π J 1 cos ω t τ π x ( m ) + π 2
where
J 1 = 12 2 N 1 k w 1 I 1 p τ x ( m ) = ( m 1 ) d x
In this equation, N1 is the number of turns on the primary side, I1 is the primary measured current, kw1 is the winding coefficient, p is the polar logarithm, τ is the polar distance, and dx is the length of each block after segmentation. The normal magnetic flux density of the air gap at node m was calculated as follows:
B δ 0 _ s l o t l e s s _ n ( m ) = F ( m ) μ 0 δ K s
where Ks is the preset saturation coefficient and μ0 is the vacuum permeability.
Finally, we judged whether the iteration precision value was satisfied:
m = 1 N F ( m ) F ( m ) F ( m ) 2 < ε
When the actual error was greater than the accuracy requirement, the air-gap flux density was corrected as follows [26]:
B δ 0 _ s l o t l e s s _ n ( m ) = B δ 0 _ s l o t l e s s _ n ( m ) 1 + k s F ( m ) F ( m ) F ( m )
where ks is the iterative coefficient.
The iteration flow chart is shown in Figure 4. Firstly, select the DC bus voltage and calculate the effective value of the primary current. Then, calculate the initial air-gap flux density Bδ0_slotless_n (m) according to Equation (11). Calculate the magnetic density Bj1_l (m) and Bt1_n (m) of each node of the primary yoke and teeth according to Equations (6) and (8). Determine the magnetic permeability μj1(m) and μt1(m) of each node of the primary yoke and teeth using the B-H curve. Finally, carry out the iterative calculation until the judgment conditions are satisfied.
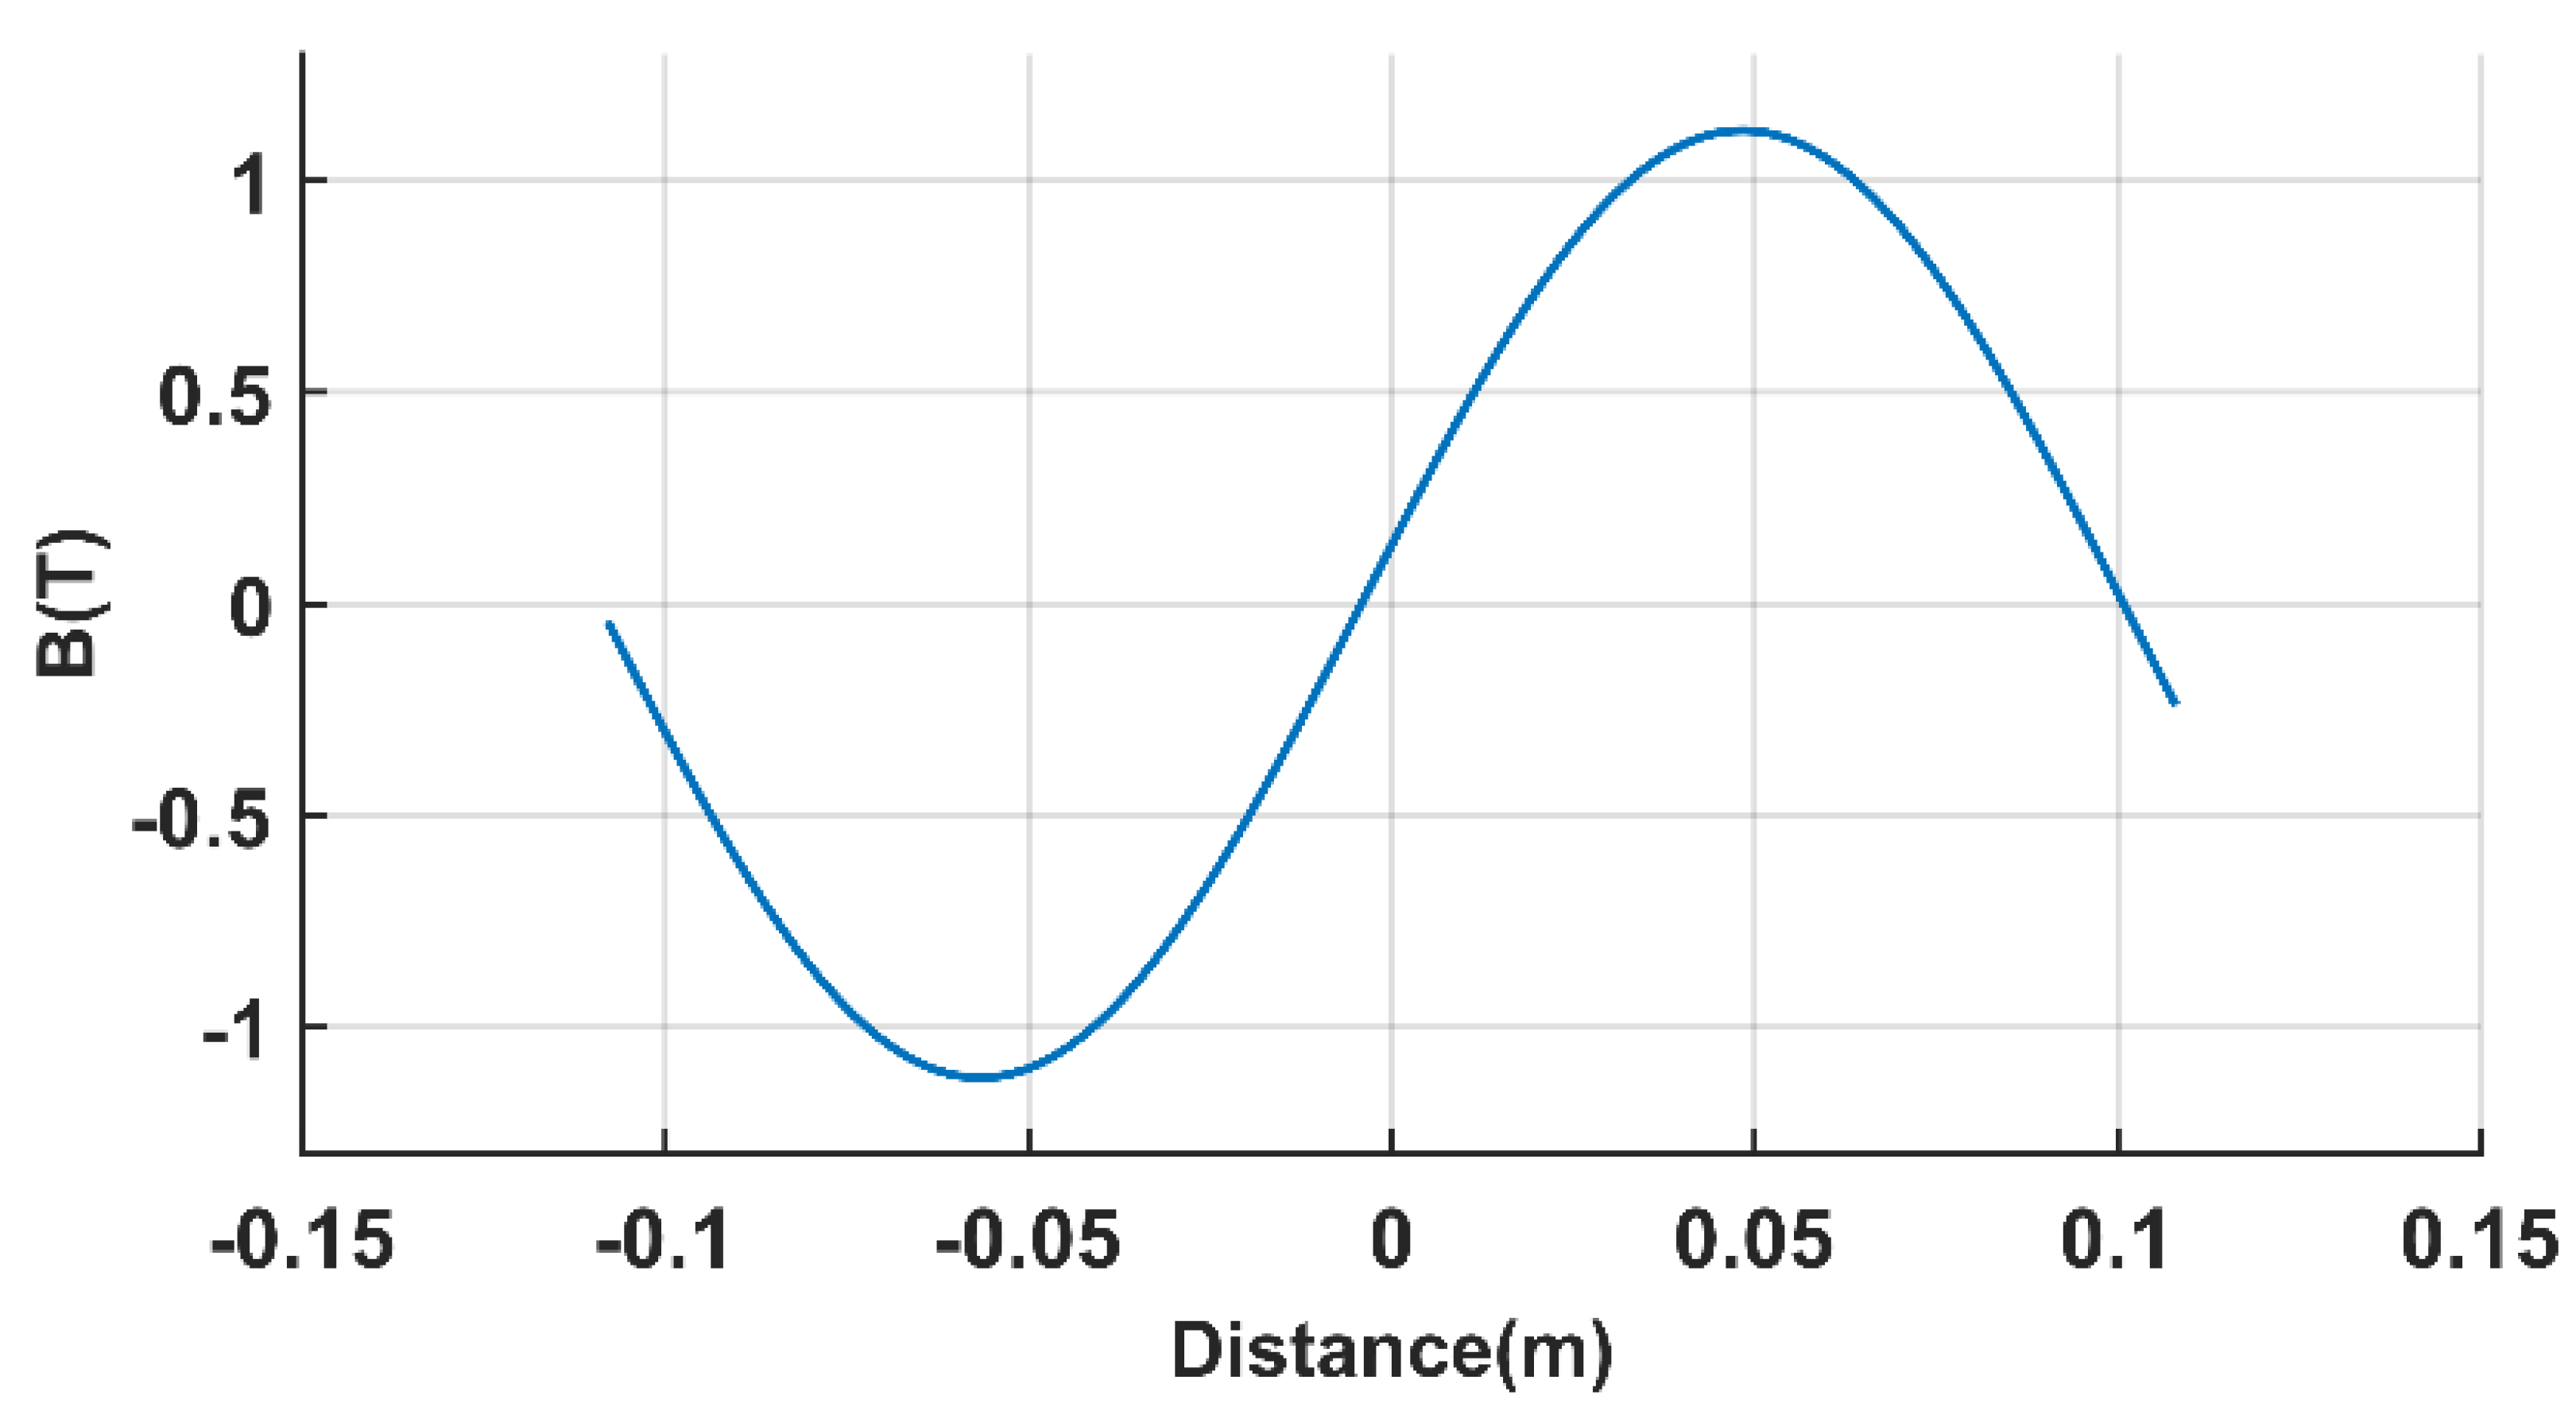
By extending the DMCM to the LPST, the magnetic field distribution of the air gap and iron core yoke could be obtained. This paper only describes the air gap in detail. The final result is shown in Figure 5:

3. Air-Gap Relative Permeance Based on SCT

3.1. Cogging Effect

According to [20], when the ratio of teeth width to air-gap length is greater than 2.44, the influence between adjacent slots can be ignored. However, the ratio of teeth width to air-gap length of the model used in this paper was much higher than 2.44. In order to facilitate the analysis, a single-slot model was adopted in this paper. Firstly, the following assumptions were made [20]:
1.
The primary side is slotted, and the secondary side is a smooth plane.
2.
The magnetic conductivity of the core on the primary and secondary sides is infinite.
3.
Both the primary and secondary sides of the iron core are planes with equal magnetic potential, one of which is 0 and the other φ0.
When the slot depth of the UP-LPST had been determined, the polygon of the z plane could be obtained, as shown in Figure 6a.
The relationship between the z plane and the w plane could be obtained from Table 1. below:
z = S w 2 a 2 w 2 1 ( w 2 b 2 ) d w + K = S 1 w 2 a 2 1 w 2 ( 1 w 2 b 2 ) d w + K
where
S = S a b 2
Introducing the Jacobian elliptic function, let w be the inverse function of the intermediate variable k, as follows:
w = s n k d w = c n k d n k d k = c n k 1 s n 2 k a 2 d k
Then (14) can be expressed as:
z = S 0 k ( 1 s n 2 k a 2 ) ( 1 s n 2 k b 2 ) d k = S 0 k 1 + ( 1 b 2 1 a 2 ) s n 2 k ( 1 s n 2 k b 2 ) d k
The transformation between the z–w plane is:
z = 2 δ π s n α d n α c n α s n 1 w Π ( k , α )
where snα, cnα, and dnα are Jacobian elliptic functions; Π (k, α) is the elliptic integral of the third kind; and δ is the air-gap length. Through the corresponding relation of the z–w plane, the relation between a, α, bs, and δ could be obtained as follows:
b s δ 4 K ( 1 a 2 ) π s n α d n α c n α Z ( α ) = 0 h δ 2 K ( 1 a 2 ) π s n α d n α c n α Z ( α ) α K ( 1 a 2 ) = 0
where K(1/a2) is the elliptic integral of the first kind; K′(1/a2) is the elliptic integral of the first kind of complementary modules; and Z(α) is the Jacobian zeta function. The abovementioned expressions are:
Π ( k , α ) = 0 sin ϕ d t ( 1 k t 2 ) ( 1 k 2 t 2 ) ( 1 t 2 ) K ( 1 a 2 ) = F ( 1 , 1 a ) E ( x , 1 a ) = 0 x 1 t 2 a 2 ( 1 t 2 ) d t Z ( α ) = E ( α ) E ( 1 a ) K ( 1 a ) K ( α ) F ( x , 1 a ) = 0 x d t ( 1 t 2 ) ( 1 t 2 a 2 )
where F(x,1/a), E(x,1/a), and E(1/a2) are the incomplete elliptic integral of the first kind, incomplete elliptic integral of the second kind, and complete elliptic integral of the second kind, respectively.
After logarithmic transformation, the corresponding relation of the t-w plane was written as:
t = φ 0 π I n ( w b ) I n ( w + b ) = φ 0 π I n w b w + b
When the slot depth had been determined, the magnetic field density distribution of the air gap and slot in the UP-LPST was calculated as:
B δ _ s l o t = μ 0 d t d w d w d z = μ 0 φ 0 δ c n α b s n α d n α 1 w 2 1 w 2 a 2
λ Y B _ c o g g i n g _ n = B δ _ s l o t _ n B δ _ s l o t l e s s _ n

3.2. End Effect

Because the core of the UP-LPST is not continuous, the end effect as its inherent property also needed to be analyzed. The specific SCT analysis model is shown in Figure 7.
The relationship between the z plane and the w plane could be obtained from Table 2 below:
Similarly, the relationship of side z–w–t is:
z = δ π ( 2 w + 1 + I n w + 1 1 w + 1 + 1 )
t = φ 0 φ 0 π I n   w
After considering the end effect, the magnetic flux density on the primary core was determined to be:
B e n d = μ 0 H = μ 0 d t d w d w d z = μ 0 φ 0 δ w + 1
The magnetic flux density reached its maximum at point z2 in the z plane:
B max = μ 0 φ 0 δ
With Bmax as the base value, the magnetic field density at any point is as follows:
B e n d B max = 1 w + 1
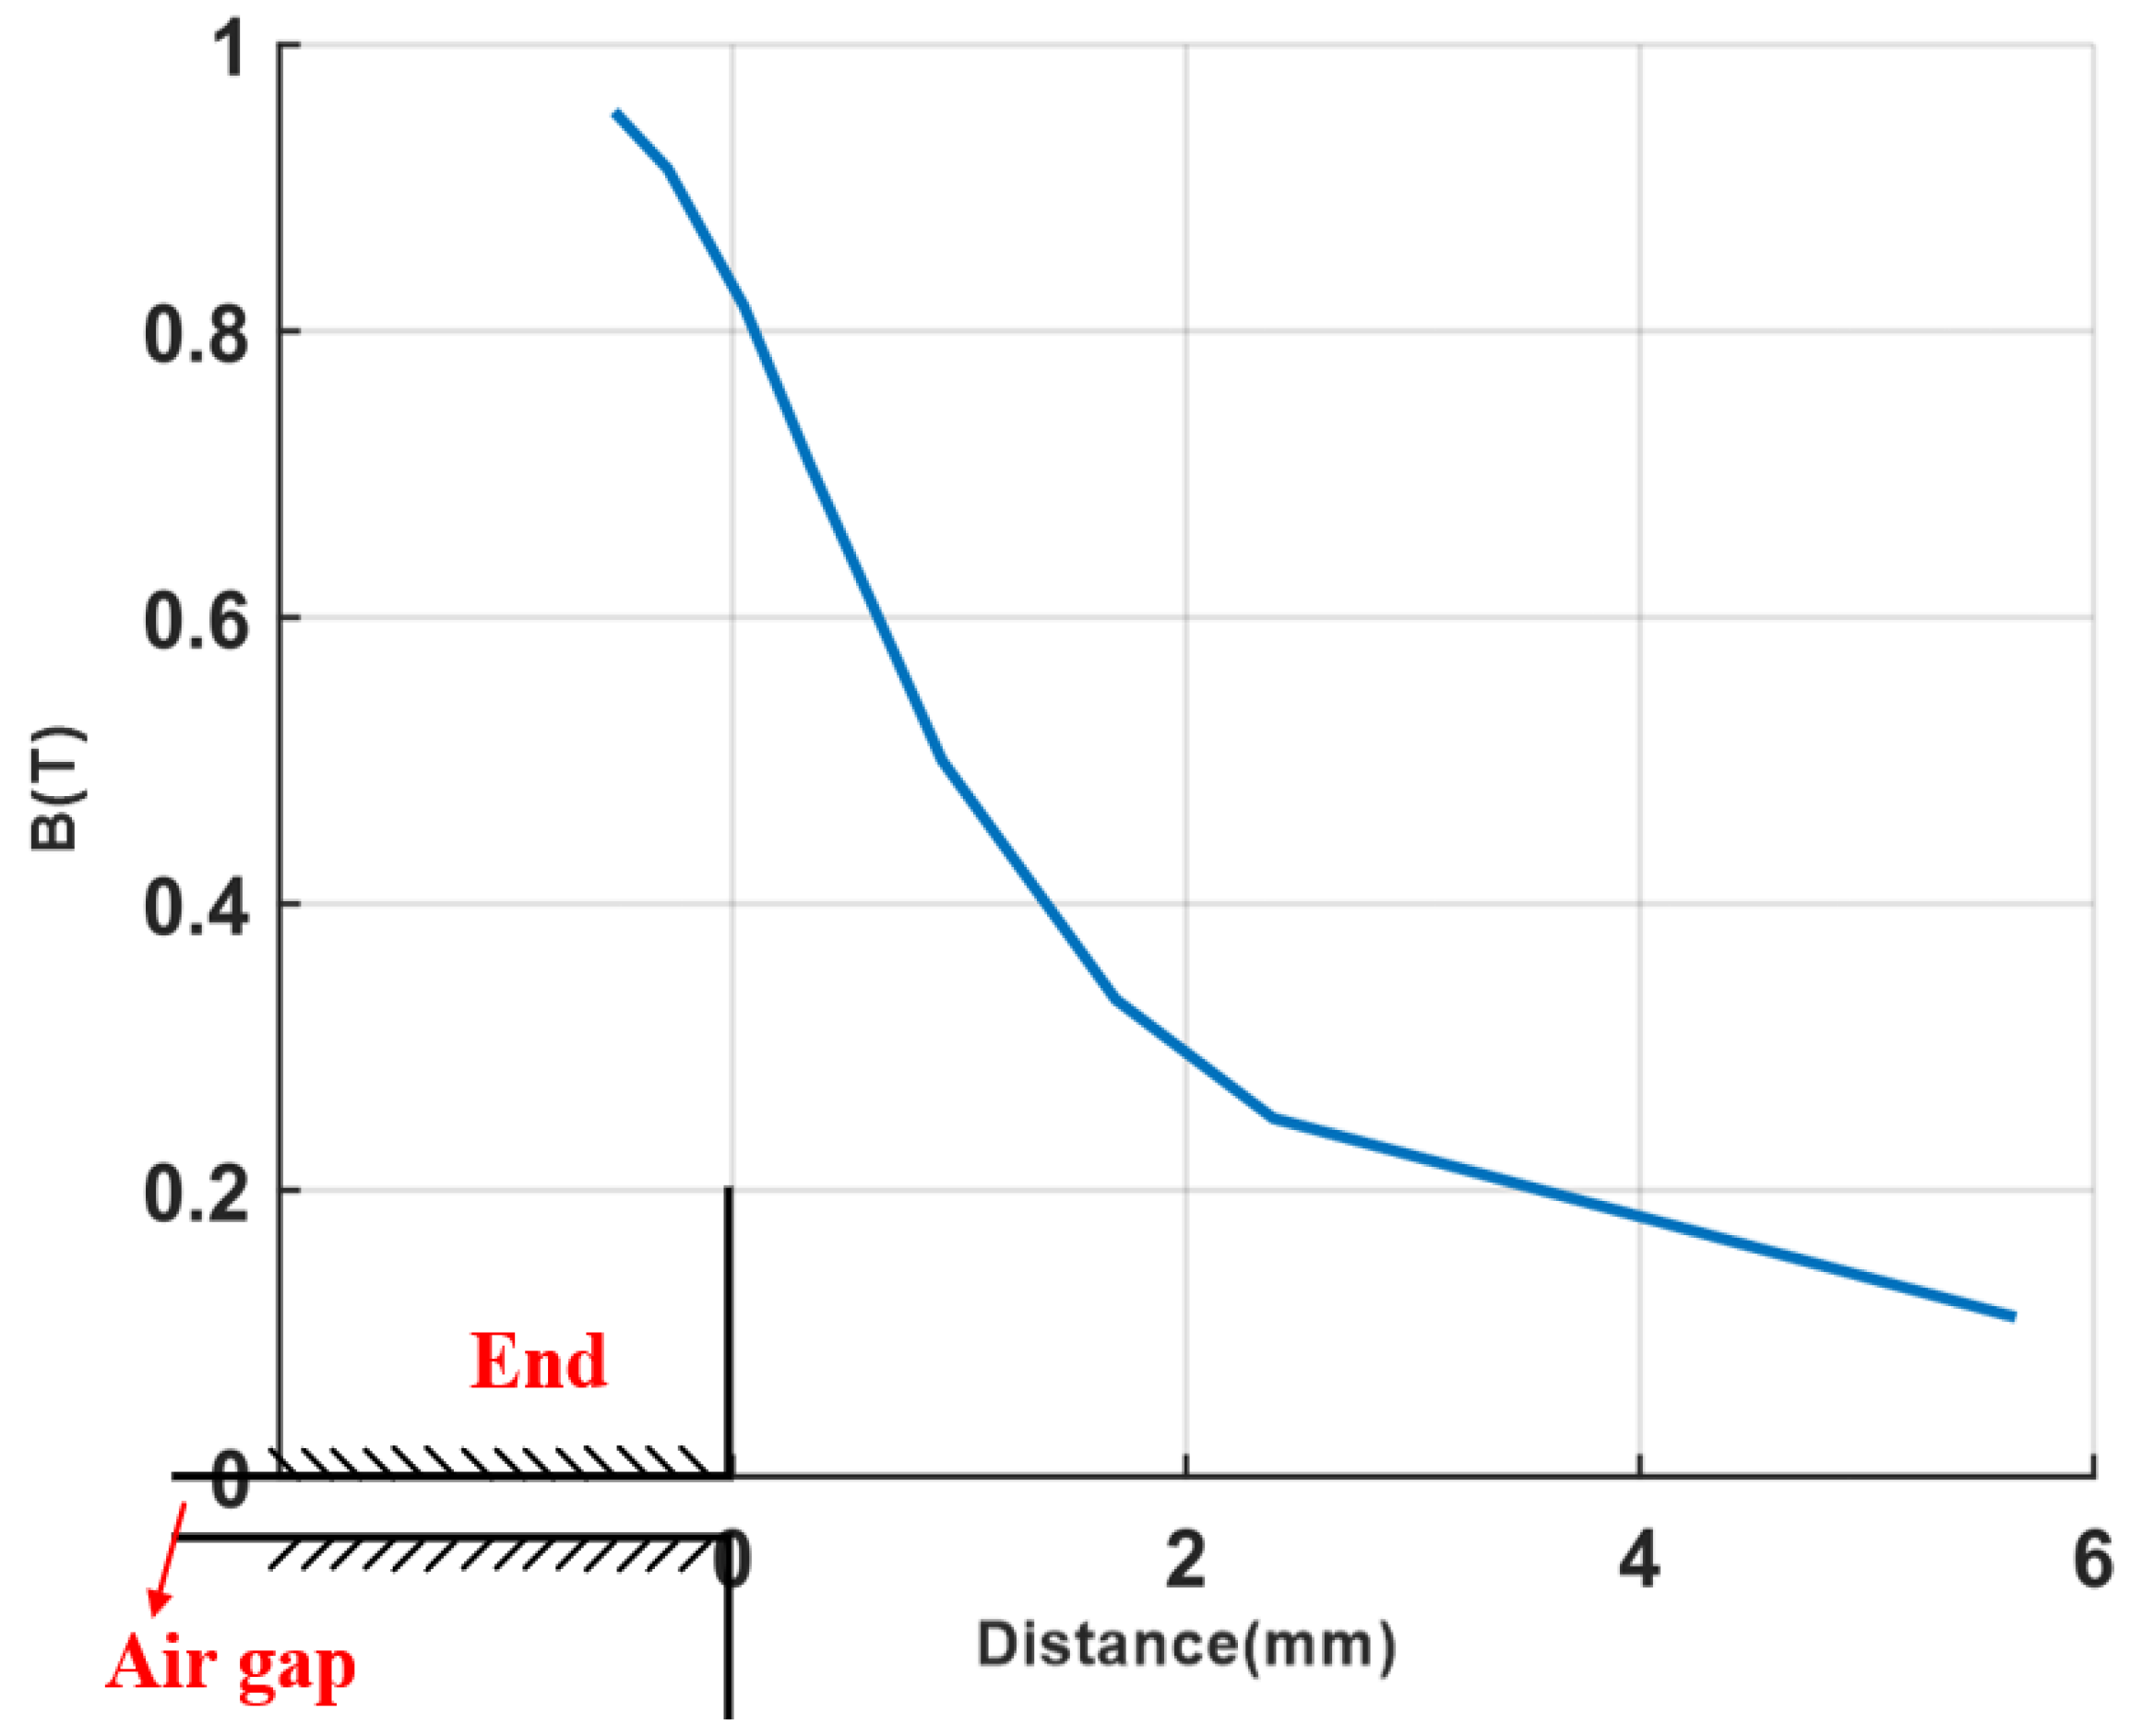
By inserting certain w values, the magnetic field density distribution curve could be drawn as shown in Figure 8.
The relative permeability distribution function of the primary side considering the end effect could be obtained by fitting the curve in Figure 8.
λ Y B _ e n d ( x ) = e 1 2 δ ( x + L 2 ) x < L 2 1 L 2 < x < L 2 e 1 2 δ ( x L 2 ) L 2 < x
The relative permeability of the air gap obtained when the secondary side was slotted separately was similar to that of the primary side, because the core structures of the primary and secondary sides of the UP-LPST are exactly the same. According to the above analysis, the air-gap magnetic field density B(x) of the UP-LPST along the length direction could be calculated as follows:
B ( x ) = B δ _ s l o t l e s s _ n ( x ) λ Y B _ c o g g i n g _ n λ Y B _ e n d λ F B _ c o g g i n g _ n λ F B _ e n d

4. Results

4.1. Analytical Results

In this paper, an unequal-pitch linear phase-shifting transformer was taken as an example. The specific parameters are shown in Table 3.
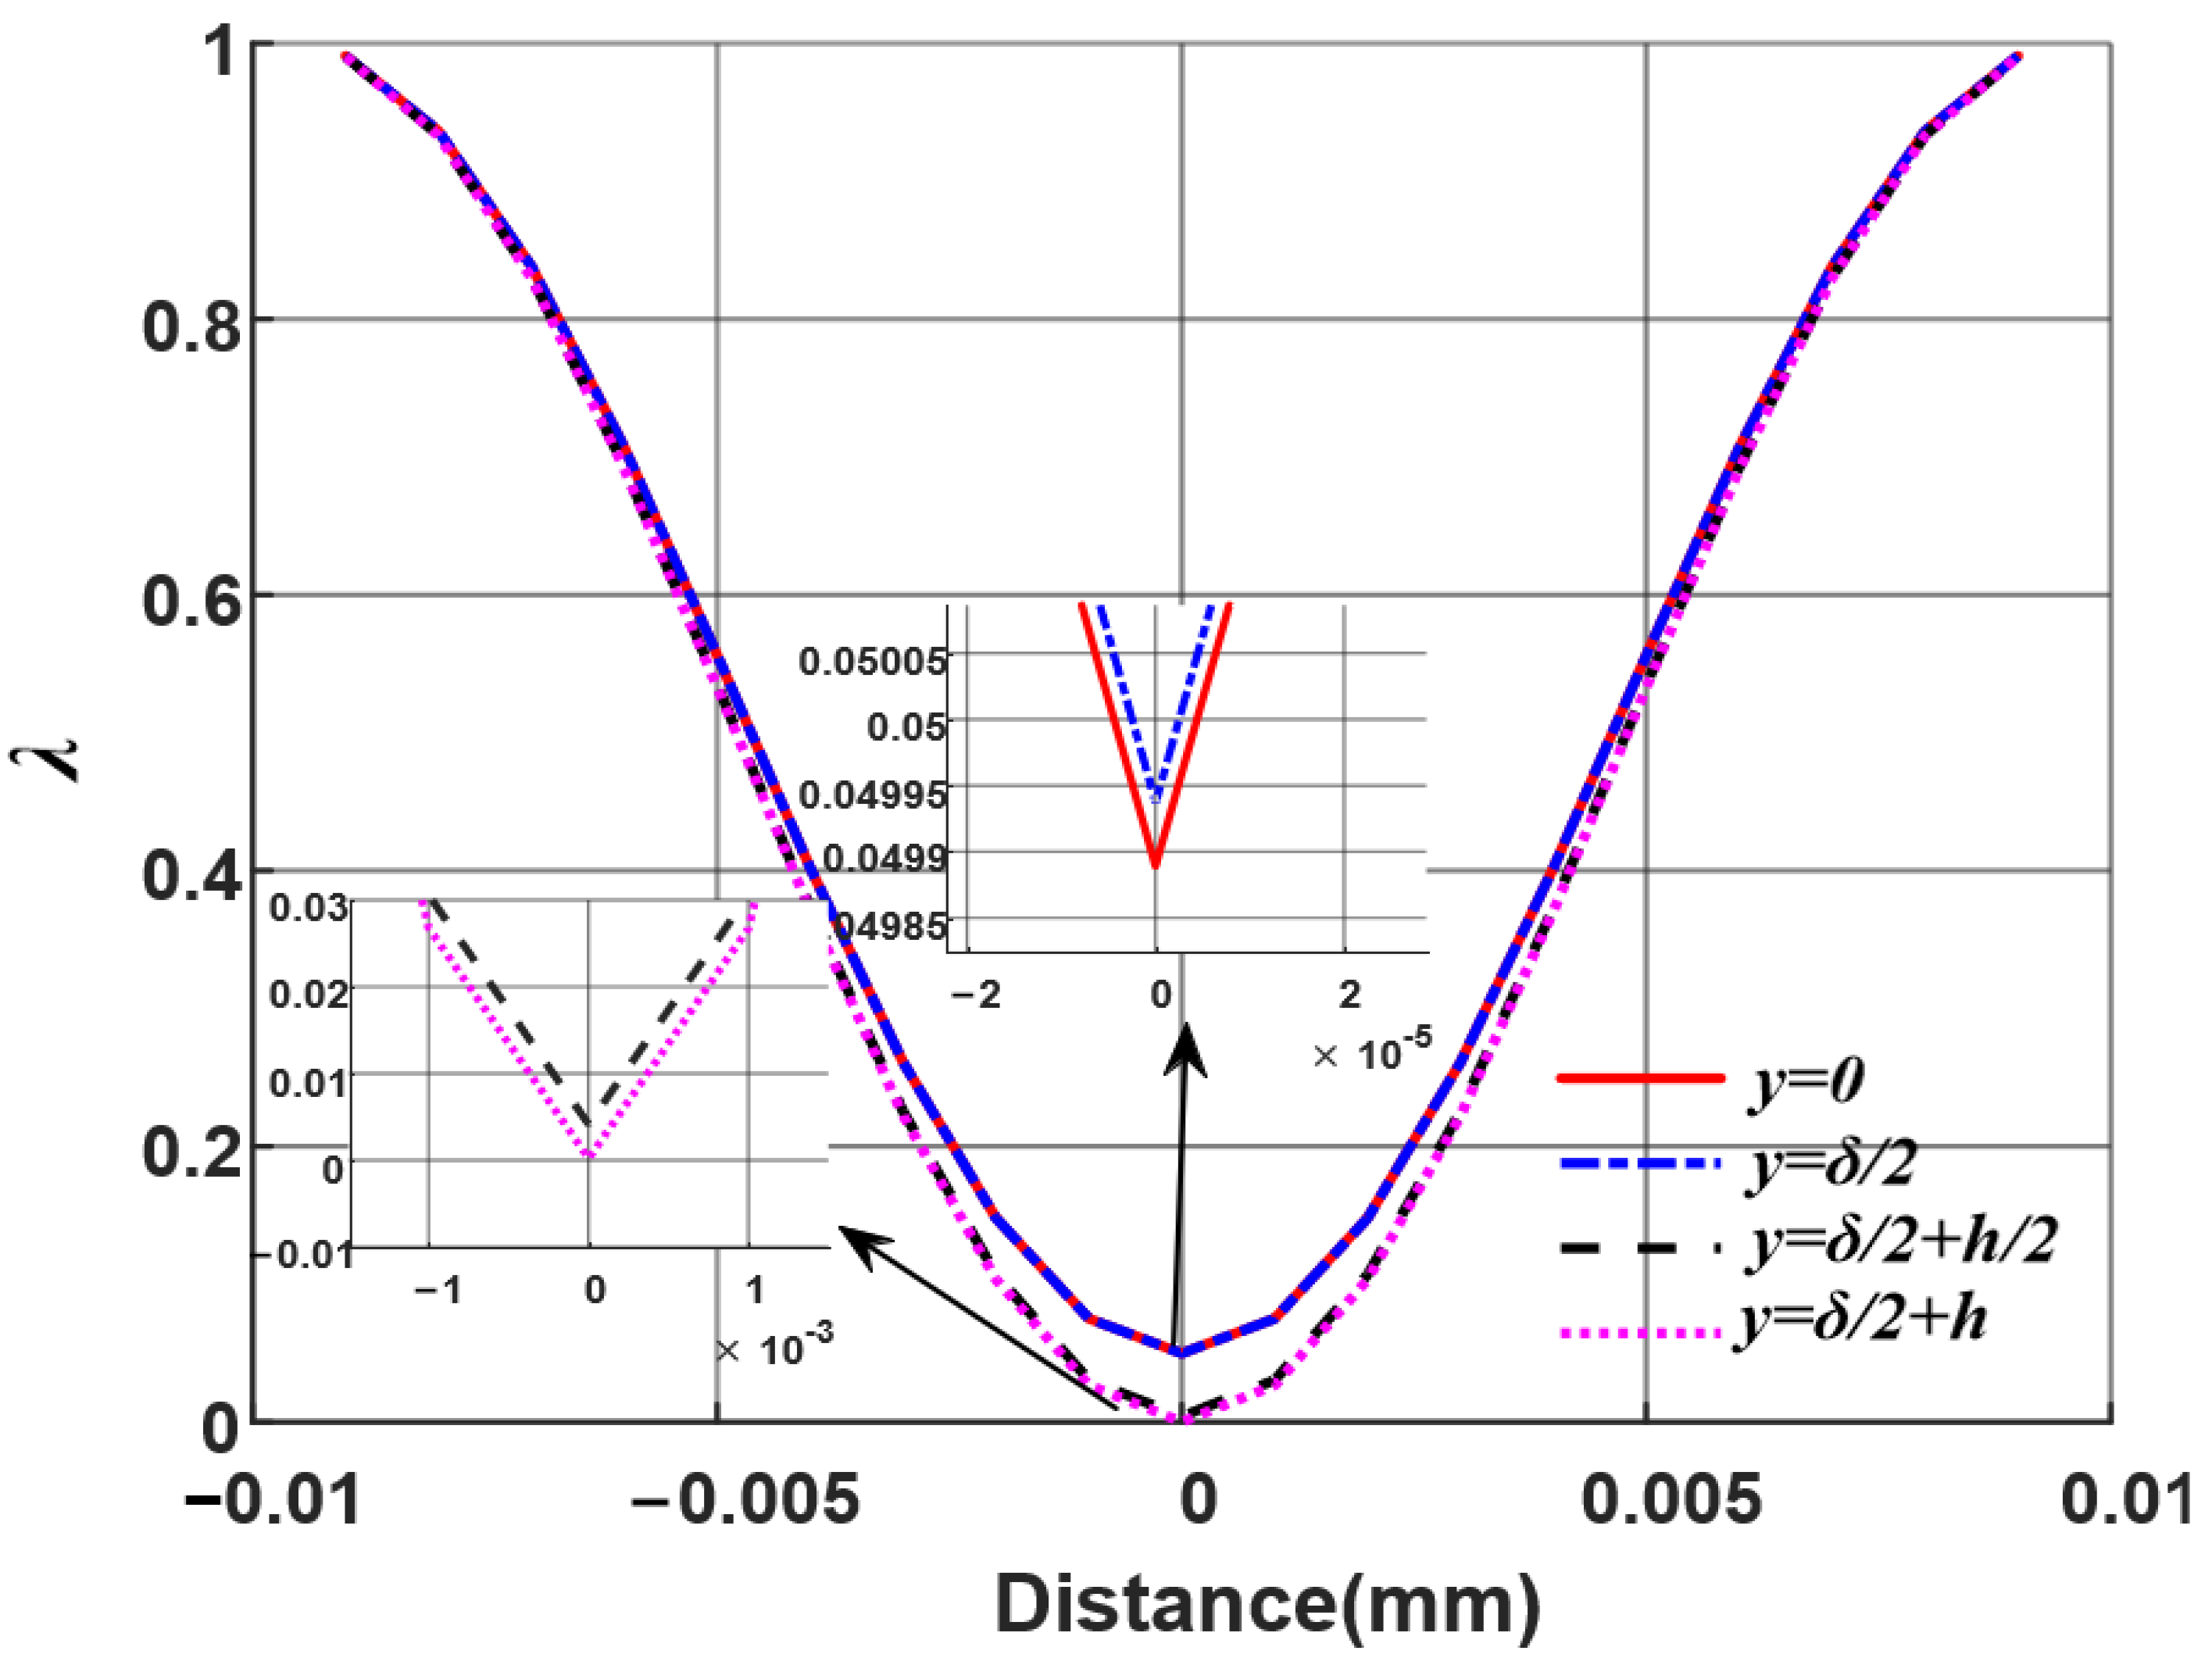
Based on the equations presented in Section 2, the air-gap relative permeance at different normal positions within a range of tooth pitch could be obtained. In order to analyze the variation trend of the air-gap relative permeance λ in a single slot, four different positions were selected: the center line of the air gap (y = 0 mm), the outer surface of the primary side (y = δ/2 mm), the center of the primary-side slot (y = δ/2 + h/3 mm), and the bottom of the primary-side slot (y = δ/2 + hmm). Figure 9 shows that the air-gap permeability distribution was different for different air-gap radii. The closer to the opening surface of the slot, the greater the influence of the opening slot on the air-gap magnetic field, that is, the deeper the pit.
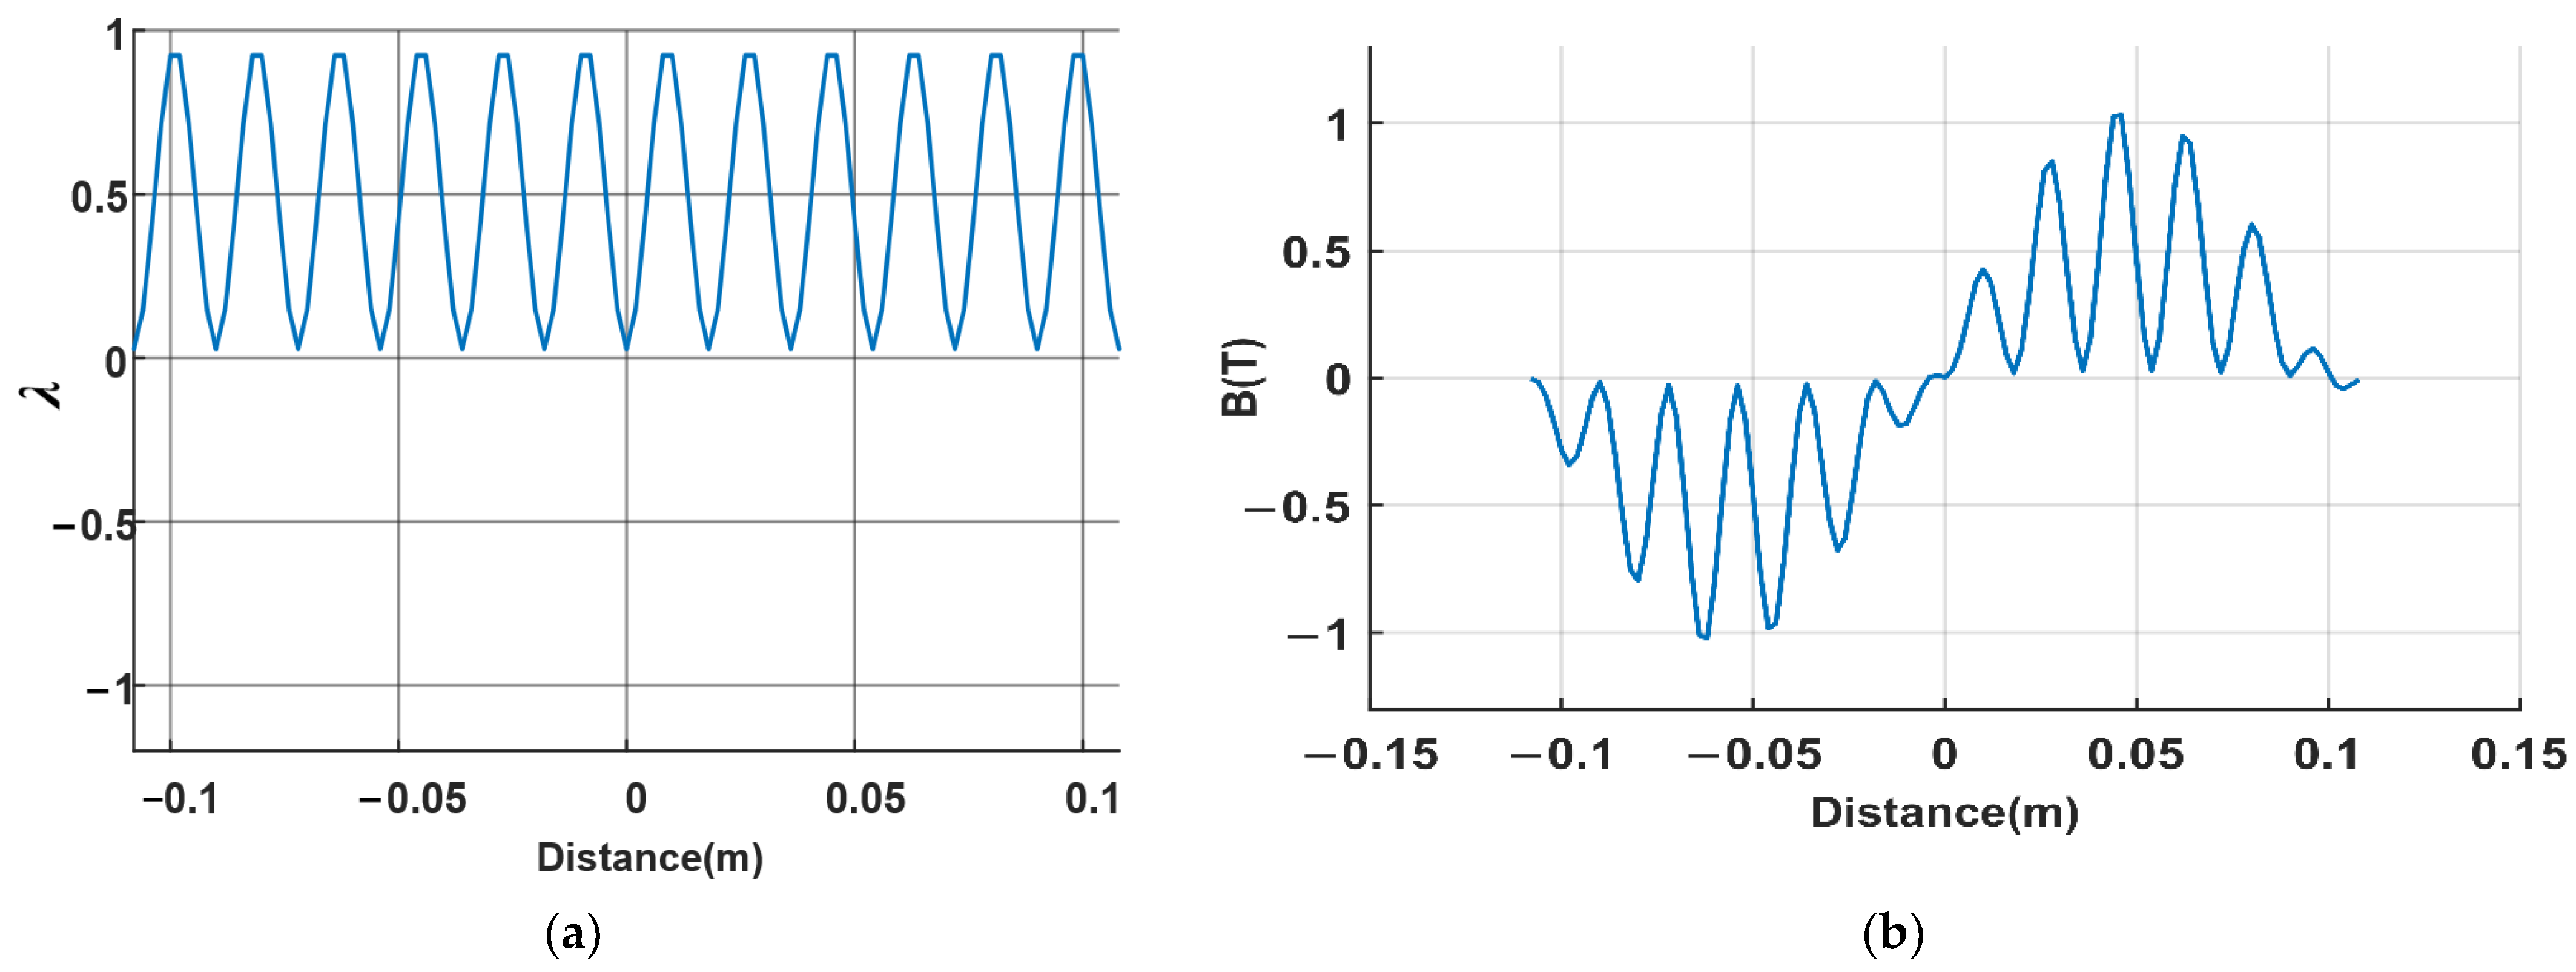
The air-gap relative permeance in a single slot was decomposed by Fourier transformation with the tooth pitch as the period. In this way, the air-gap relative permeance across the whole length range of the UP-LPST could be obtained, as shown in Figure 10a. Figure 10b shows that the magnetic field density distribution at the center of the air gap considering the effects of cogging and end could be obtained by multiplying the calculated air gap relative permeability by the slotless magnetic field. The air-gap magnetic field was not highly sinusoidal when considering the effect of slot and end and was not affected by slot openings that were opposite teeth. However, when the slots were opposite each other, the air-gap magnetic field was affected by the interaction of the iron cores on both sides, presenting a concave shape. At the same time, due to the influence of “out and in”, the magnetic flux density distribution at both ends was different.
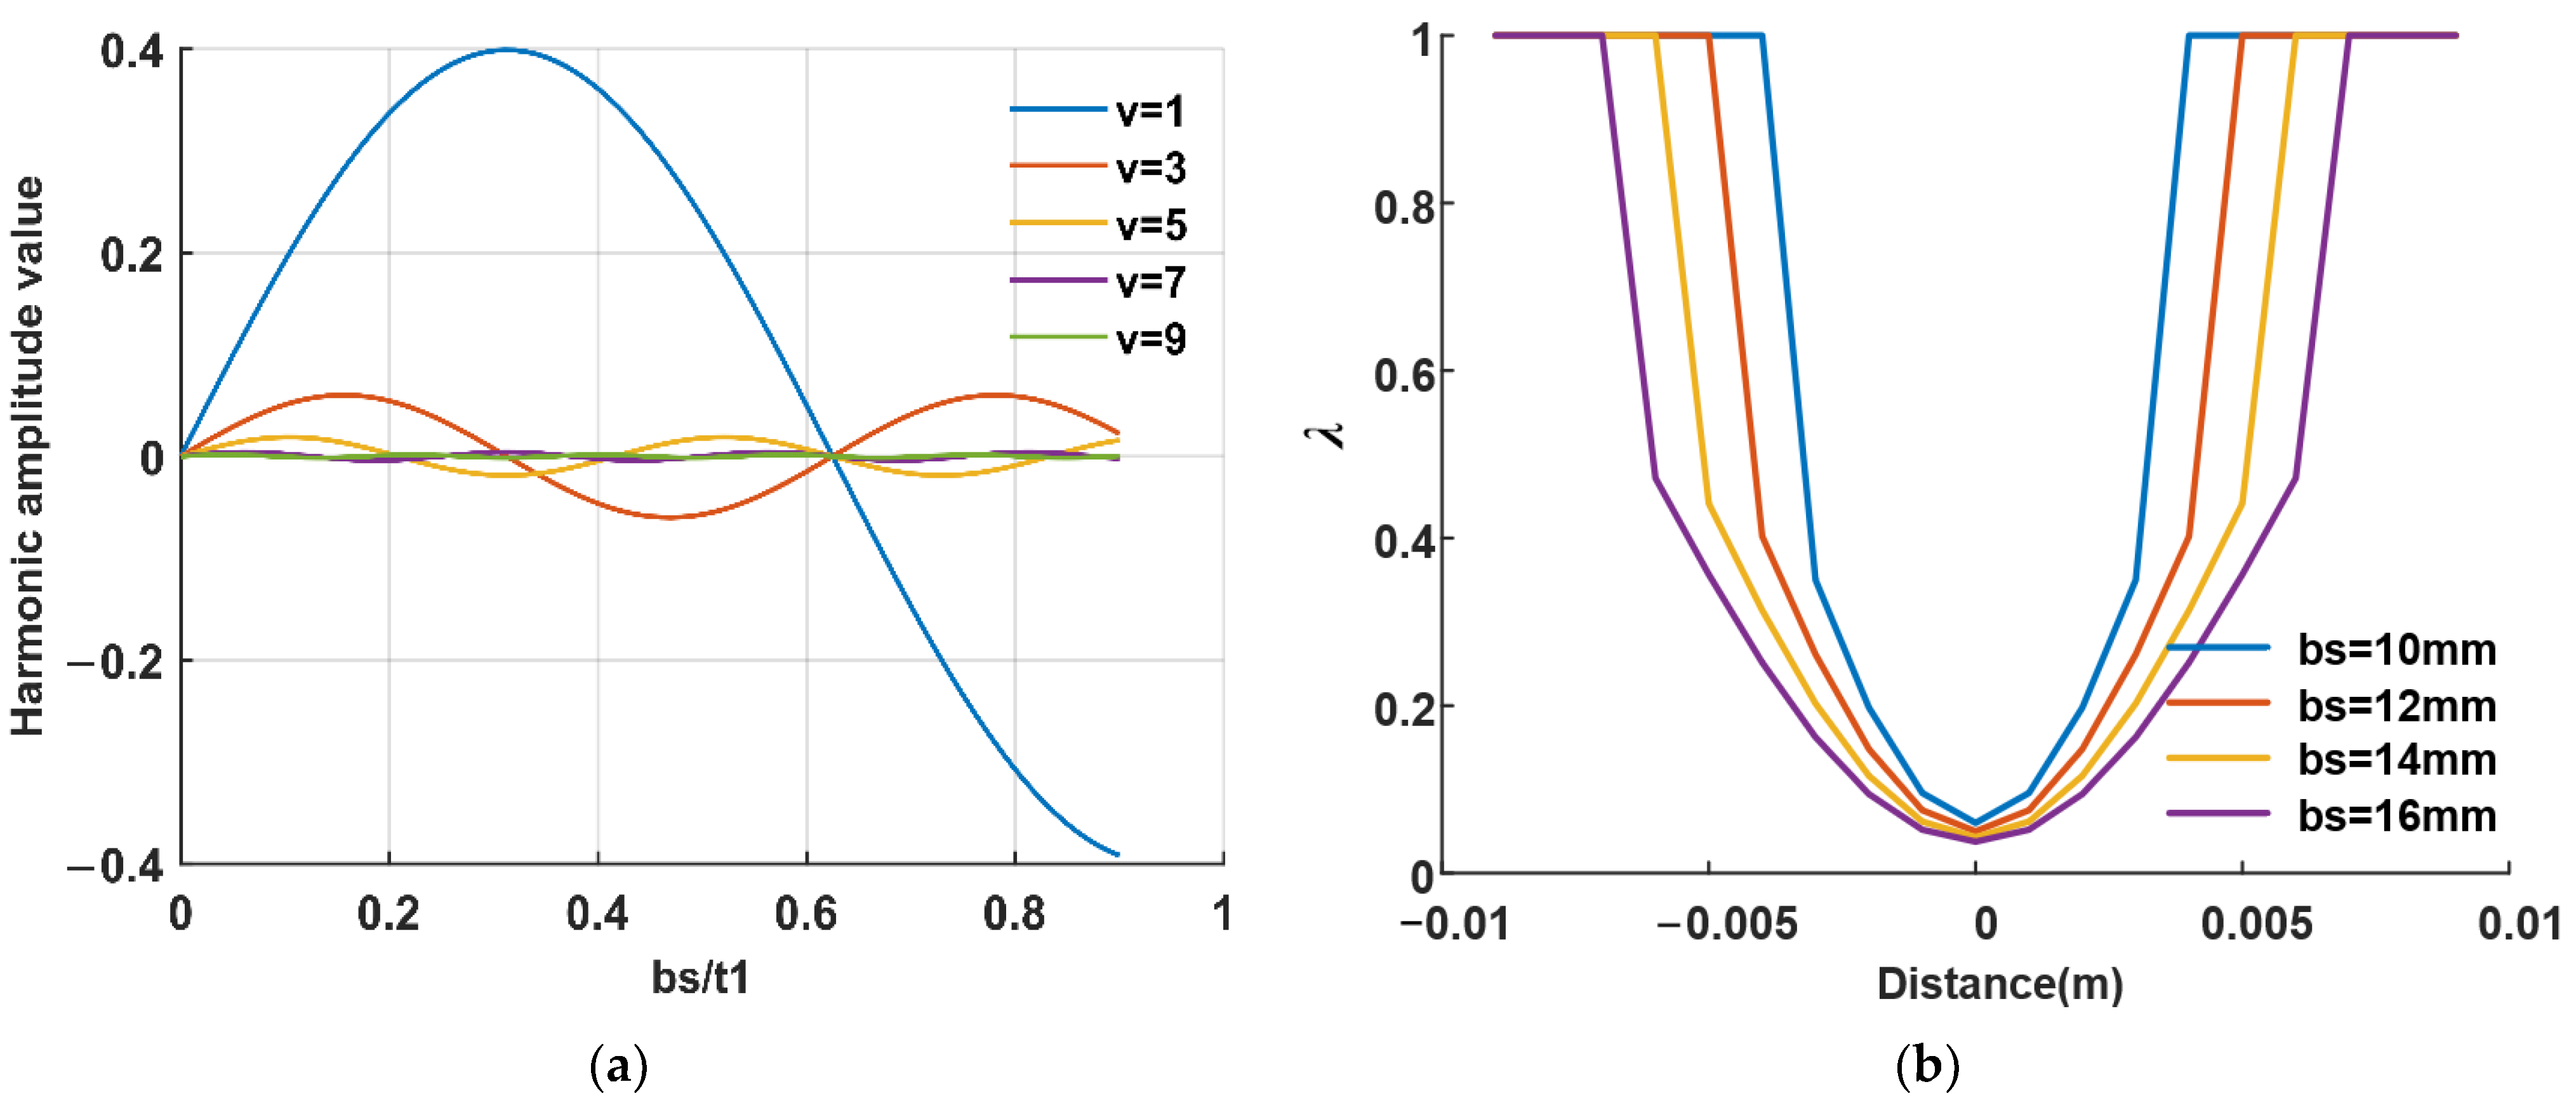
Figure 11 presents the schematic diagram of harmonic amplitude and flux density distribution under different slot spacing ratios. The main harmonic amplitudes could be obtained by the Fourier decomposition of the air-gap magnetic fields with different slot spacing ratios. When the slot opening increased, the harmonic amplitude of the basic teeth increased significantly, which reduced the performance of the straight-line phase-shifting transformer. In Figure 11b, the lengths of the slot openings are 10 mm, 11 mm, 12 mm, and 13 mm. The minimum flux density was located in the middle of the slot opening, while the maximum flux density was located in the tooth, and the large slot opening had a greater impact on the flux density.

4.2. FEM Verification

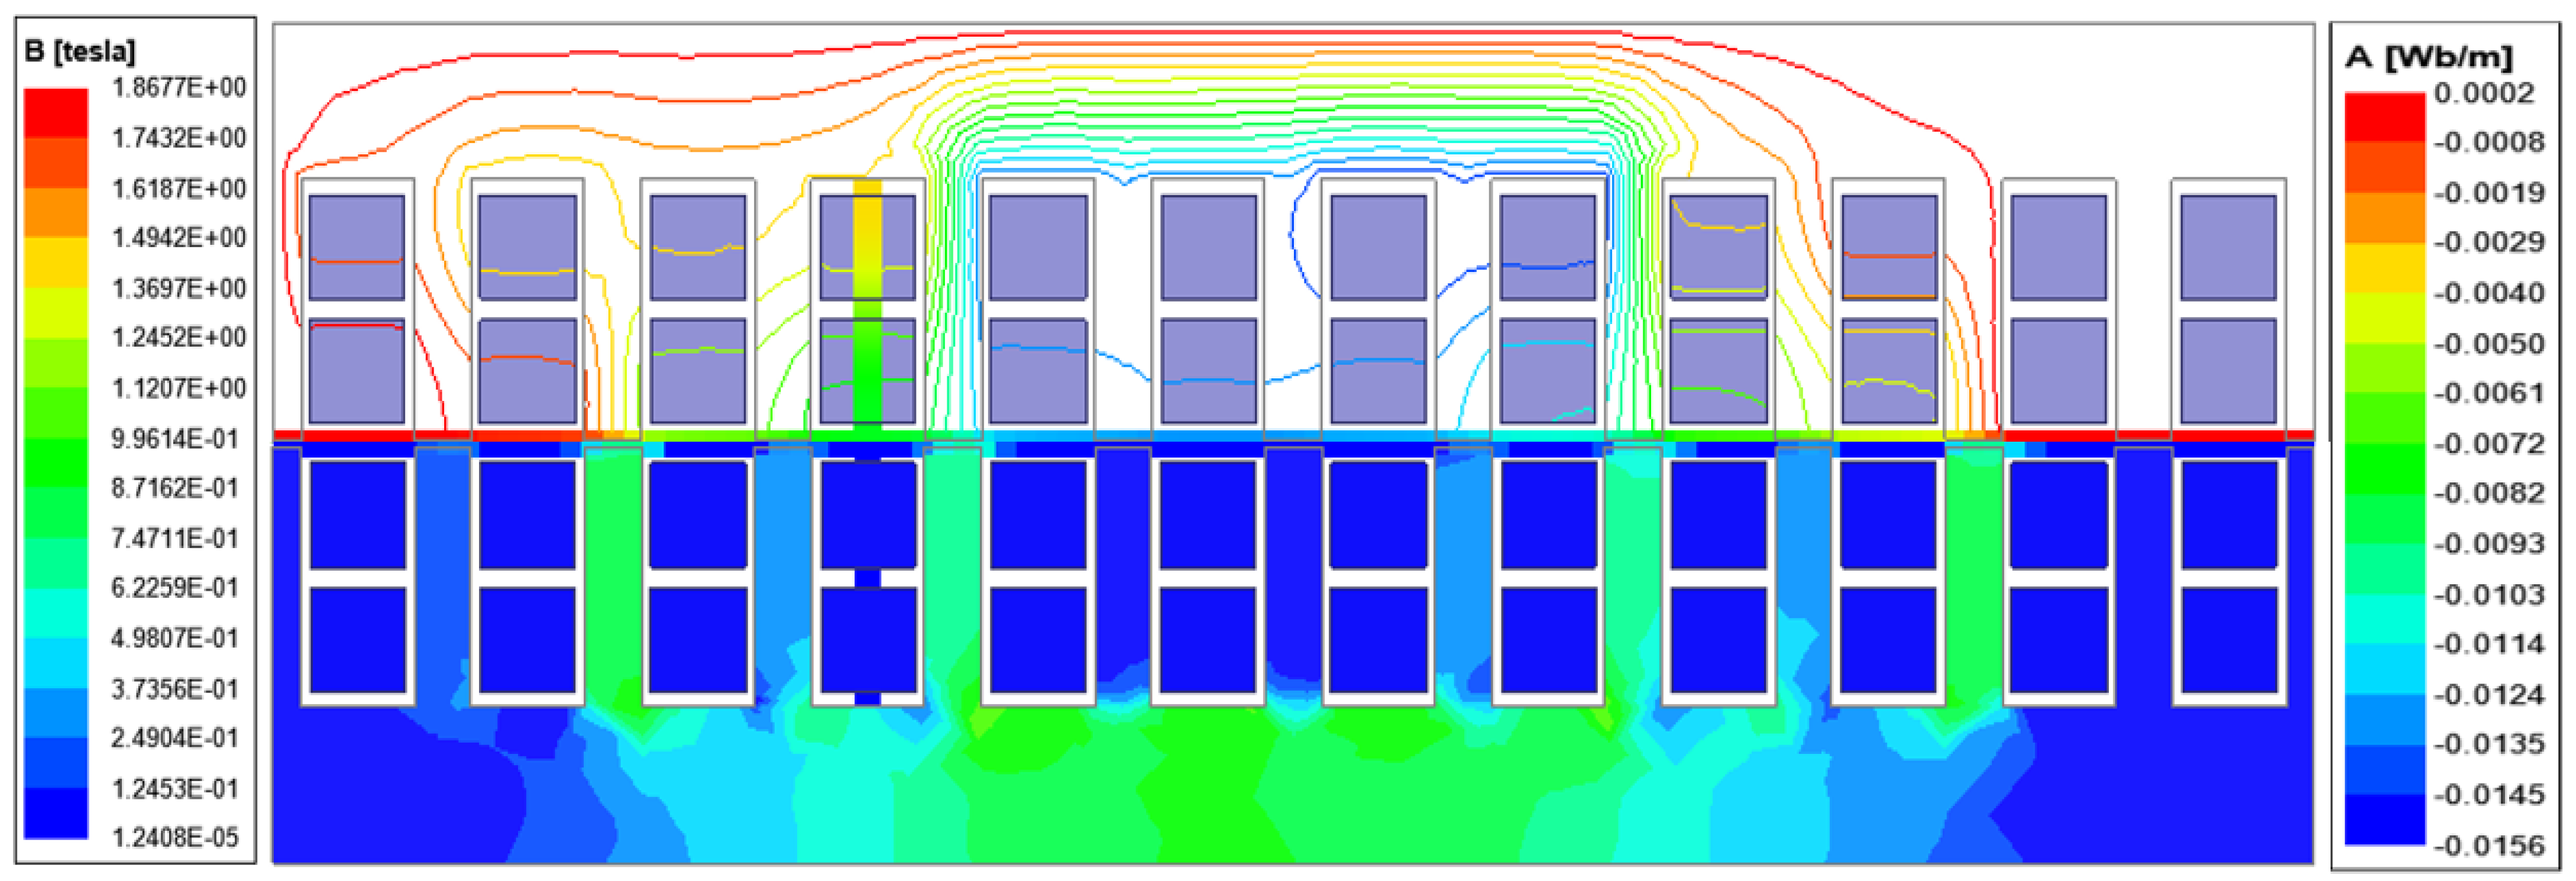
To verify the correctness of the analytical results, an FEM model of the UP-LPST was constructed according to Table 1, as shown in Figure 12. A 100V DC voltage was applied to the FEM model, and the magnetic field distribution data at the center line of the air gap were extracted and compared with the analytical results. The comparison results are shown in Figure 13. The results showed that the overall distribution fitted well, but the details were slightly different. The errors were mainly focused on the top and edge of the sawtooth wave. This was because the magnetic field lines at the teeth and air gap were assumed to have only normal components. However, near the opening of the slot, the effect of magnetic focusing on the air-gap magnetic field was great, which was one of the reasons for the error. At the same time, this method did not consider the magnetic flux leakage effect of the UP-LPST, so there was a 2% error between the analytical results and the FEM results.
Compared with the exact subdomain method (ESM) in [28], the error of the DMCM–SCT method was smaller due to the consideration of the influence of core saturation and edge, and the specific performance results are shown in Table 4.
According to Table 4, compared with ESM, the results obtained by DMCM–SCT were closer to those obtained by the finite element method. Although a certain calculation dimension was added, the overall effect was still better than ESM. However, the influence of end magnetic flux leakage was not considered in the calculation method, so there were still some errors in the results.

4.3. Test Verification

According to the data in Table 1, a prototype of the UP-LPST was manufactured, as shown in Figure 14. The test platform was mainly composed of a power supply driver module, a DSP, a signal amplification control circuit, a rectifier bridge, an inverter module, a terminal, and a UP-LPST. Since the air gap of the experimental prototype was only 0.3 mm, it was difficult to directly measure the actual air-gap flux density. Therefore, we carried out indirect verification by testing the no-load output voltage and current of the prototype.
Figure 15 shows the experimental waveform of the no-load output voltage of the prototype and the waveform of the FEM simulation calculation. By comparison, it could be found that the waveforms of the no-load output voltage calculated by FEM were basically the same as those measured by the experiment, but there were still slight differences. The main reason was that the manufacturing technology of the prototype was not ideal and the precision of core was not sufficient. At the same time, in the actual processing experiment, it was difficult to ensure that the length of the air gap was 0.3 mm, so the length of the air gap was not completely equal. However, the overall waveform direction was consistent, which indirectly verified the effectiveness of the analysis method in this paper.

5. Conclusions

The impact of connecting new energy sources to a power system on the power quality of the grid is mainly reflected in the voltage and current. The new power system will consume more reactive power during operation, which will cause a serious drop in the grid voltage. Therefore, a large number of rectifier and inverter devices need to be used in the grid connection. The existence of these devices will inevitably inject harmonic currents into the grid, resulting in the distortion of grid voltage and current waveforms. While affecting the power supply quality, it will also cause additional load losses to the power equipment flowing through the distorted current. The special structure and phase-shifting method of the linear phase-shifting transformer can effectively eliminate low-order harmonics and improve the output waveform quality. For the LPST, which mainly relies on air gaps for energy transfer, the establishment of an accurate magnetic field model has an important influence on the calculation and even the improvement of the system efficiency.
By focusing on the specifics of LPST energy transfer and analyzing its structure, the DMCM and SCT were extended to the LPST, and a magnetic field analysis model for the LPST was established. The model can simultaneously consider the effects of saturation, cogging, and edges on the magnetic field. Therefore, the model is more in line with the actual situation of the linear phase-shifting transformer. Under the conditions of a given input DC bus voltage, the accuracy of the model was proven by means of direct verification using a finite element model and indirect verification via an experiment. There was a degree of error in the results, because the magnetic leakage at the end of the linear phase-shifting transformer was not considered. However, the model can still be applied to phase-shifting transformers with similar structures, and even other power devices. Our model could play an important role in improving the efficiency of transformers and new power systems and reducing losses. However, this paper only analyzed the model under no-load conditions. An analysis under load conditions is the next step.

Author Contributions

Writing—original draft preparation, J.X.; investigation, H.W.; supervision, J.Z.; data curation, S.Y., C.Z., D.Y. and H.C. All authors have read and agreed to the published version of the manuscript.

Funding

This research was funded by the National Natural Science Foundation of Hubei under the grant 2018CFA008.

Institutional Review Board Statement

Not applicable.

Informed Consent Statement

Not applicable.

Data Availability Statement

Not applicable.

Conflicts of Interest

The authors declare no conflict of interest.

References

  1. Mastny, P.; Moravek, J.; Drapela, J.; Vrana, M.; Vojtek, M. Problems of Verification of Operating Parameters of DC/AC Inverters and Their Integration into the Distribution System in the Czech Republic. In Proceedings of the CIRED Porto Workshop 2022: E-Mobility and Power Distribution Systems, Porto, Portugal, 2–3 June 2022; pp. 304–308. [Google Scholar] [CrossRef]
  2. Iqbal, S.; Hossain, A.; Islam, J.; Surja, A.S.; Kabir, M. Enhancing Voltage Stability of Inter-Area Multi-Machine Power Systems using Reinforcement Learning-based STATCOM. In Proceedings of the 2022 International Conference on Advancement in Electrical and Electronic Engineering (ICAEEE), Gazipur, Bangladesh, 24–26 February 2022; pp. 1–4. [Google Scholar] [CrossRef]
  3. Jalilian, A.; Muttaqi, K.M.; Sutanto, D.; Robinson, D. Distance Protection of Transmission Lines in Presence of Inverter-Based Resources: A New Earth Fault Detection Scheme During Asymmetrical Power Swings. IEEE Trans. Ind. Appl. 2022, 58, 1899–1909. [Google Scholar] [CrossRef]
  4. Calar, M.; Durna, E.; Kayisli, K. 3-Phase Multi-Pulse Rectifiers with Different Phase Shifting Transformers and Comparison of Total Harmonic Distortion. In Proceedings of the 2022 9th International Conference on Electrical and Electronics Engineering (ICEEE), Alanya, Turkey, 29–31 March 2022; pp. 60–64. [Google Scholar] [CrossRef]
  5. Yuan, D.; Yin, Z.; Wang, S.; Duan, N. Multi-level Transient Modeling of the Aeronautic Asymmetric 18-pulse Phase-shifting Auto-transformer Rectifier in Full-cycle Design. IEEE Trans. Transp. Electrif. 2022, 8, 3759–3770. [Google Scholar] [CrossRef]
  6. Luo, M.; Dujic, D.; Allmeling, J. Leakage Flux Modeling of Medium-Voltage Phase-Shift Transformers for System-Level Simulations. IEEE Trans. Power Electron. 2018, 34, 2635–2654. [Google Scholar] [CrossRef]
  7. Chen, G.; Ding, L.; Tang, F.; Teng, Y. The study of increasing Chongqing sectional transmission capacity using phase-shifting transformer. Sichuan Electr. Power Technol. 2014, 37, 49–54. (In Chinese) [Google Scholar]
  8. Xiong, X.; Zhao, J.H.; Ding, H.; Sun, P.; Peng, W. Research on end effect of linear phase-shifting transformer. J. Xi’an Jiaotong Univ. 2017, 51, 110–115. (In Chinese) [Google Scholar]
  9. Zhang, Z.M.; Zhao, J.H.; Ma, Y.Z.; Xu, H. Analytical modeling of inverter system of linear phase-shifting transformer. Chin. J. Electr. Eng. 2019, 14, 54–60. (In Chinese) [Google Scholar]
  10. Zhao, J.H.; Xu, H.; Guo, G.Q. Design of 12/3-phase linear phase-shifting transformer. J. Nav. Eng. Univ. 2021, 33, 1–6. (In Chinese) [Google Scholar]
  11. Zhao, J.H.; Ma, Y.Z.; Sun, P. Multiple superposition inverter system based on linear phase-shifting transformer. Electr. Power Autom. Equip. 2019, 39, 183–188. (In Chinese) [Google Scholar] [CrossRef]
  12. Sterling, H. Harmonic Field Effects in Induction Machines. IEEE Rev. 1977, 23, 841. [Google Scholar] [CrossRef]
  13. Wu, L.J.; Zhu, Z.Q.; Staton, D.A.; Popescu, M.; Hawkins, D. Subdomain Model for Predicting Armature Reaction Field of Surface-Mounted Permanent-Magnet Machines Accounting for Tooth-Tips. IEEE Trans. Magn. 2011, 47, 812–822. [Google Scholar] [CrossRef]
  14. Wu, L.J.; Zhu, Z.Q.; Staton, D.; Popescu, M.; Hawkins, D. An Improved Subdomain Model for Predicting Magnetic Field of Surface-Mounted Permanent Magnet Machines Accounting for Tooth-Tips. IEEE Trans. Magn. 2011, 47, 1693–1704. [Google Scholar] [CrossRef]
  15. Zhu, Z.Q.; Wu, L.J.; Xia, Z.P. An Accurate Subdomain Model for Magnetic Field Computation in Slotted Surface-Mounted Permanent-Magnet Machines. IEEE Trans. Magn. 2009, 46, 1100–1115. [Google Scholar] [CrossRef]
  16. Jikun, Y.; Liyi, L.; Jiangpeng, Z. Analytical calculation of air-gap relative permeance in slotted permanent magnet synchronous motor. Trans. China Electrotech. Soc. 2016, 31, 45–52. [Google Scholar]
  17. Fu, L.; Zuo, S.; Ma, C.; Tan, Q. Analytical calculation of armature reaction field including slotting effects in PMSM with concentrated fraction-al-slot winding. Trans. China Electrotech. Soc. 2014, 29, 29–35. [Google Scholar]
  18. Zhu, Z.Q.; Howe, D. Instantaneous magnetic field distribution in brushless permanent magnet DC motors, part III: Effect of stator slotting. IEEE Trans. Magn. 1993, 29, 143–151. [Google Scholar] [CrossRef]
  19. Lv, Y.; Cheng, S.; Wang, D.; Chen, J. A Fast Method for Calculating the Air-Gap Flux and Electromagnetic Force Distribution in Surface Permanent Magnet Motors. In Proceedings of the 2020 IEEE 9th International Power Electronics and Motion Control Conference (IPEMC2020-ECCE Asia), Nanjing, China, 29 November–2 December 2020; pp. 1973–1977. [Google Scholar] [CrossRef]
  20. Tang, Y. Electromagnetic Fields in Motors, 2nd ed.; Science Press: Beijing, China, 1998. [Google Scholar]
  21. Lee, S.-H.; Yang, I.-J.; Kim, W.-H.; Jang, I.-S. Electromagnetic Vibration-Prediction Process in Interior Permanent Magnet Synchronous Motors Using an Air Gap Relative Permeance Formula. IEEE Access 2021, 9, 29270–29278. [Google Scholar] [CrossRef]
  22. Chang, J. New direct drive method for large telescope base on Arc PMLSM. Univ. Chin. Acad. Sci. 2013. [Google Scholar]
  23. Guo, G.; Zhao, J.; Wu, M.; Xiong, Y. Analytical Calculation of Magnetic Field in Fractional-Slot Windings Linear Phase-Shifting Transformer Based on Exact Subdomain Model. IEEE Access 2021, 9, 122351–122361. [Google Scholar] [CrossRef]
  24. Jiang, H.; Su, Z.; Wang, D. Analytical Calculation of Active Magnetic Bearing Based on Distributed Magnetic Circuit Method. IEEE Trans. Energy Convers. 2020, 36, 1841–1851. [Google Scholar] [CrossRef]
  25. Wang, N.; Wu, X.; Chen, J.; Guo, Y.; Cheng, S. A Distributed Magnetic Circuit Approach to Analysis of Multiphase Induction Machines with Nonsinusoidal Supply. IEEE Trans. Energy Convers. 2014, 30, 522–532. [Google Scholar] [CrossRef]
  26. Guo, Y.; Wang, D.; Liu, D.; Wu, X.; Chen, J. Magnetic Circuit Calculation of Non-Salient Pole Synchronous Generator Based on Distributed Magnetic Circuit Method. In Proceedings of the 2011 International Conference on Electrical Machines and Systems, Beijing, China, 20–23 August 2011; pp. 1–6. [Google Scholar] [CrossRef]
  27. Huang, C.; Sun, Z.; Xu, J.; Zeng, R.; Zhang, Y.; Han, Z.; Li, M. Calculation Method of Nonlinear Magnetic Circuit and Motor Performance Analysis for High-Power Linear Induction Motor. In Proceedings of the 2021 13th International Symposium on Linear Drives for Industry Applications (LDIA), Wuhan, China, 1–3 July 2021; pp. 1–6. [Google Scholar] [CrossRef]
  28. Guo, G.; Zhao, J.; Xiong, Y.; Wu, M. Analytical Calculation of Open-Circuit Magnetic Field in Linear Phase-Shifting Transformer Based on Exact Subdomain Model. IEEJ Trans. Electr. Electron. Eng. 2021, 17, 72–81. [Google Scholar] [CrossRef]
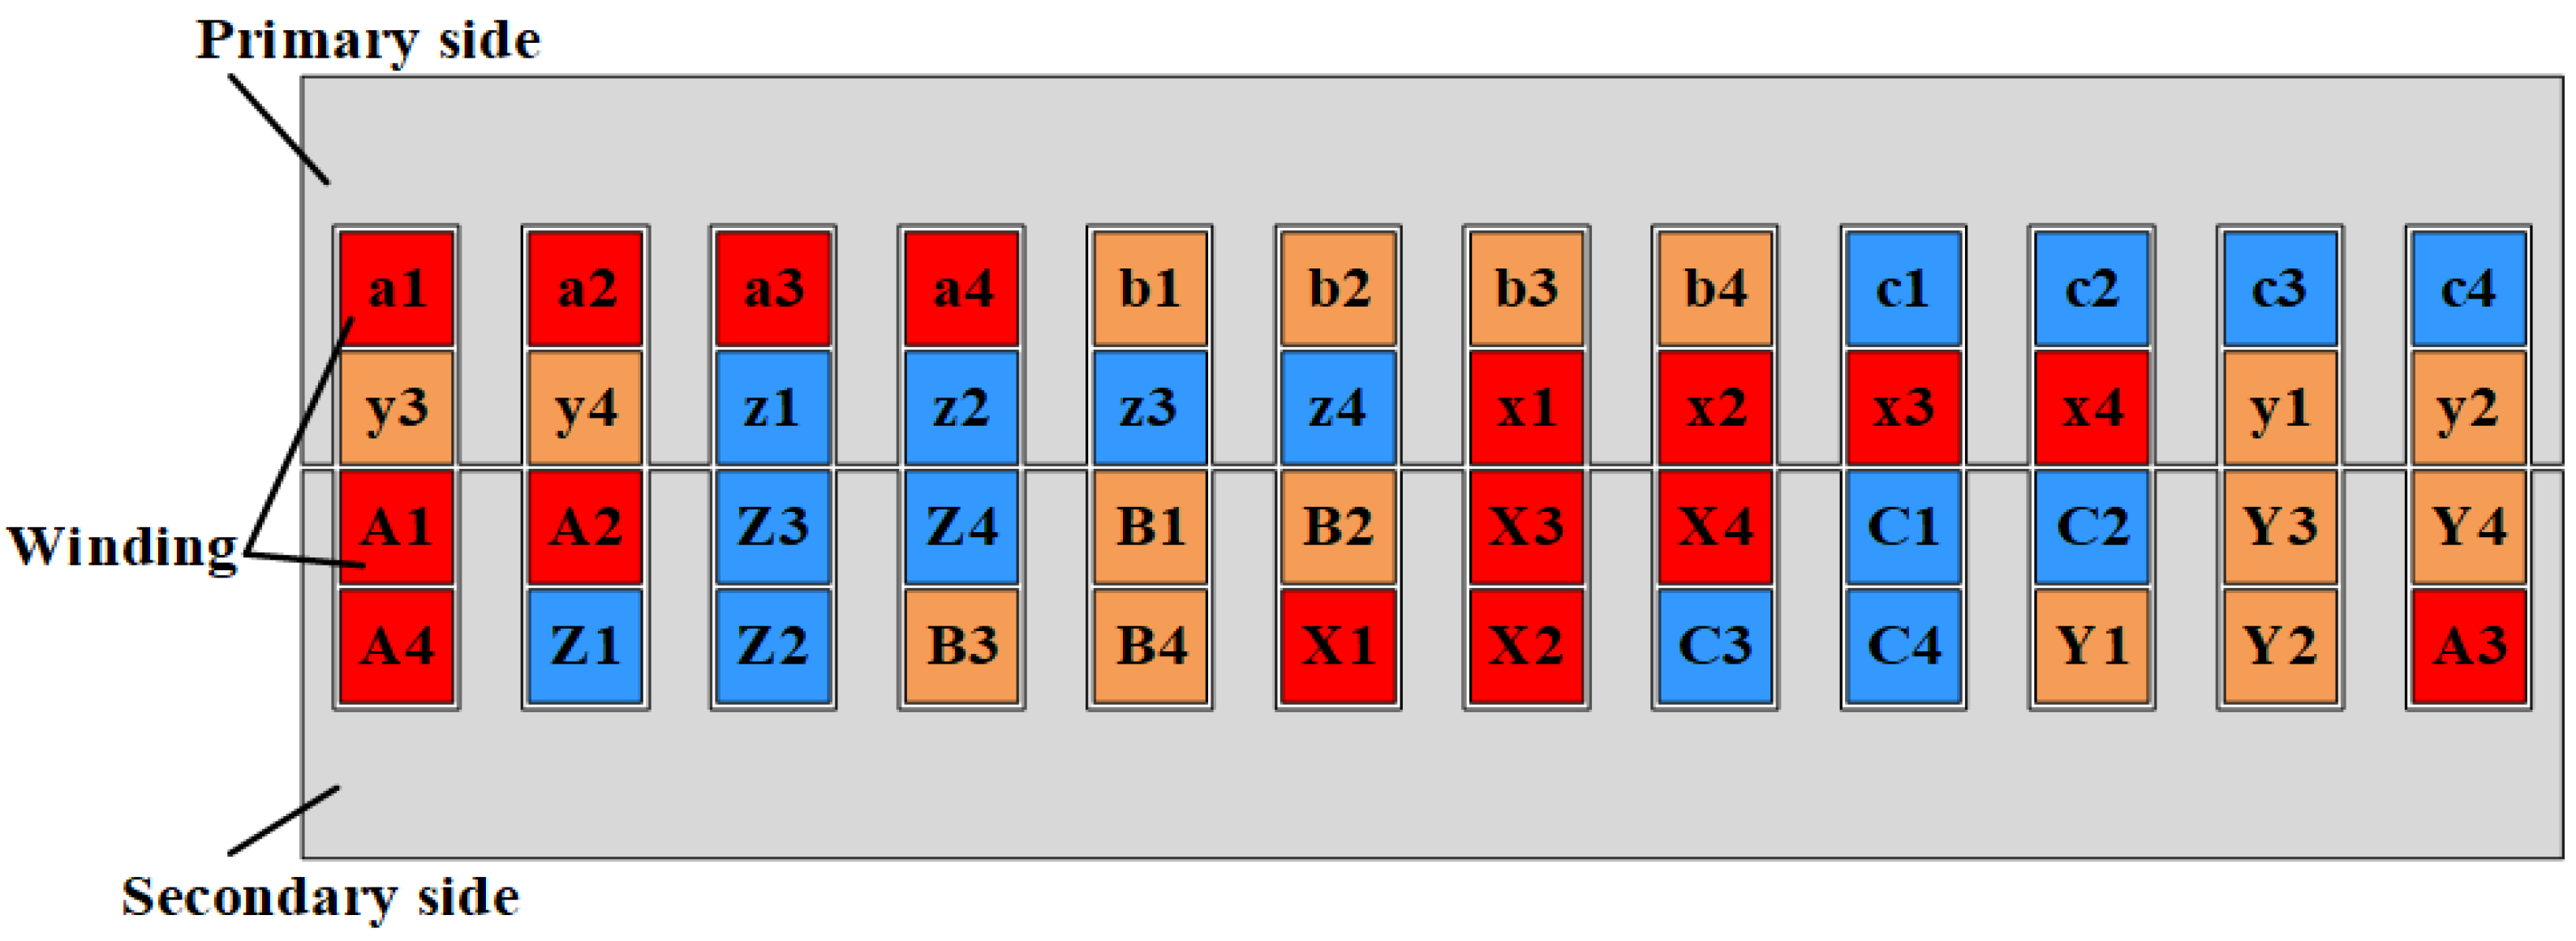
Figure 1. Schematic diagram of UP-LPST structure.
Processes 10 01596 g001
Figure 2. Schematic diagram of the block model of the UP-LPST.
Processes 10 01596 g002
Figure 3. Diagram of the simplified model.
Processes 10 01596 g003
Figure 4. The iterative flowchart of the UP-LPST based on the DMCM.
Processes 10 01596 g004
Figure 5. The slotless air-gap magnetic field within the length range of the UP-LPST.
Processes 10 01596 g005
Figure 6. SCT analysis diagram of UP-LPST cogging effect. (a) z plane; (b) w plane; (c) t plane.
Processes 10 01596 g006
Figure 7. SCT analysis diagram of UP-LPST end effect. (a) z plane; (b) w plane; (c) t plane.
Processes 10 01596 g007
Figure 8. Distribution of air-gap magnetic field density at the UP-LPST end.
Processes 10 01596 g008
Figure 9. Air-gap relative permeance at different positions in a single slot.
Processes 10 01596 g009
Figure 10. Distribution of air-gap relative permeance and flux density within the length range of the UP-LPST. (a) Air-gap relative permeance; (b) distribution of air-gap flux density under the influence of cogging and end.
Processes 10 01596 g010
Figure 11. Distribution of harmonic amplitude and magnetic field density at different slot spacing ratios. (a) Harmonic amplitude value; (b) single-slot flux density distribution.
Processes 10 01596 g011
Figure 12. The 2D FEM simulation model.
Processes 10 01596 g012
Figure 13. The air-gap flux density distribution of the UP-LPST.
Processes 10 01596 g013
Figure 14. Experimental transformer.
Processes 10 01596 g014
Figure 15. No-load phase-A output voltage diagram of finite element model and experiment. (a) FEM waveform; (b) experimental waveform.
Processes 10 01596 g015
Table 1. SCT table of z plane and w plane of finite slot depth model.
z Planeθ *w Plane
PointCoordinatePointCoordinate
z1bs/2 + j(h + δ)π/2w1−1
z2bs/2 + jδ3π/2w2a
z3−∞ + j00w3b
−∞ + jδ
z4+∞ + j00w4b
+∞ +
z5bs/2 + 3π/2w5a
z6bs/2 + j(h + δ)π/2w11
* The interior angle of a polygon.
Table 2. SCT table of z plane and w plane at the primary-side end.
z Planeθ *w Plane
PointCoordinatePointCoordinate
z13π/2w1−1
z2−∞ + j00w20
−∞ + jδ
z3+∞0w3±∞
+
* The interior angle of a polygon.
Table 3. Parameters of the UP-LPST.
SymbolValueMeaning
h24 mmDepth of the slot
bs12 mmWidth of the slot
t118 mmTooth pitch
δ0.3 mmAir-gap length
L216 mmLongitudinal length of core
D100 mmNormal width of core
τ105 mmPole pitch
Table 4. Comparison of the three methods.
MethodCore SaturationEnd EffectCalculation DimensionError
FEM109,506-
ESM××1136<5%
DMCM–SCT1300<2%
Publisher’s Note: MDPI stays neutral with regard to jurisdictional claims in published maps and institutional affiliations.