Article

Optimization of Glycerol Extraction of Chlorogenic Acid from Honeysuckle by Response Surface Methodology

1
Beijing Institute of Petrochemical Technology, Beijing 102617, China
2
Beijing Key Laboratory of Fuels Cleaning and Advanced Catalytic Emission Reduction Technology, Beijing 102617, China
*
Authors to whom correspondence should be addressed.
Processes 2023, 11(1), 110; https://doi.org/10.3390/pr11010110
Submission received: 27 November 2022 / Revised: 19 December 2022 / Accepted: 20 December 2022 / Published: 30 December 2022

Abstract

:
Using honeysuckle as raw material, chlorogenic acid (CGA) was extracted with different alcohols. Based on the single-factor experiment design, the relationship between each parameter and the response value was explored by Box–Behnken method to optimize the process conditions. Best extraction results were obtained under the conditions of solid-to-liquid ratio of 1:20, the ultrasonic time of 40 min, the ultrasonic vibrator power of 240 w, and the CGA extraction rate of 2.98%. The experimental data show that the extraction rate of CGA is related to the length of the alcohol carbon chain and the number of hydroxyl groups in the extractant. The results from this work can provide technical basis for the safe and efficient production of CGA from honeysuckle.

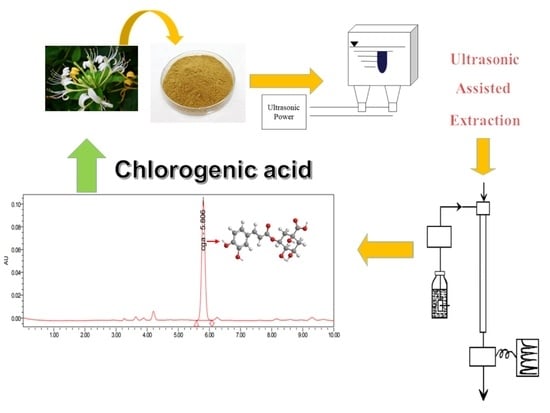
Graphical Abstract

1. Introduction

Honeysuckle is one of the important medicinal plants in East Asia and is widely used in traditional Chinese medicine to treat a variety of chronic diseases [1]. Honeysuckle mainly contains flavonoids [2], organic acid [3,4], phenols [5,6], trace nutritional elements [7,8], and volatile asseutiae oil [9,10]. It provides curing effects of anti-inflammatory [11,12], anti-tumor [13,14], anti-virus [15,16], anti-oxidant [17,18], and immunity enhancement [19,20]. The latest research found that honeysuckle is the main ingredient of some effective herbal Chinese medicines for treating COVID-19-related symptoms, showing promising medicinal and research value [21].
At present, popular approaches for extracting CGA are water extraction and alcohol precipitation, ultrasonic-assisted extraction, microwave-assisted extraction, microwave–ultrasonic combined extraction, and enzyme extraction [22]. Water extraction and alcohol precipitation method can produce high extraction efficiency, and remove impurities such as protein, polysaccharide, and tannin in the solution [23]. Commonly used organic solvents include ethanol, methanol, propanol, etc. Considering the cost, safety and commercial availability of the extractant, ethanol is generally selected over the other extractants [24]. However, due to the low yield of water extraction and alcohol precipitation, development of better reagent for CGA is the key to the extraction process.
Glycerol can be used as an excellent safe food extractant. Therefore, its application can thus be extended to the pharmaceutical area. In this paper, glycerol was used as the primary extractant and water was used as the secondary reagent for CGA extractant. The ultrasonic vibrator power, ultrasonic time, glycerol volume fraction, and solid-to-liquid ratio were used as single-factor experimental design parameters to investigate their effect on the CGA extraction from honeysuckle. The influence of acid extraction rate, the Box–Behnken method in Design-Expert was used to design a three-factor and three-level experiment to optimize the process [25]. The purpose of this study is to explore a green and optimized method of extracting chlorogenic acid with glycerol.

2. Experimental

Reagents and Materials

Table 1 gives the main experimental chemicals and their manufacturers. Table 2 shows the chromatographic parameters employed in this research; the CGA peaks in the honeysuckle extract were clearly separated from other components. The standard curve was determined by accurately weighing 10.0 mg of CGA standard product and 4.00 mL of methanol to prepare a 2.50 mg/mL solution. The solution was prepared to the following mass concentrations: 0.075, 0.15, 0.30, 0.60, and 1.20 mg/mL of CGA standard solutions. In HPLC analysis, a standard curve with the mass fraction (x, mg/mL) and peak area (y) of CGA as the following equation of y = 11677700x − 512544.42 (R2 = 0.9997).
The raw material of honeysuckle powder is purchased in Bozhou, Anhui Province, China. According to Chinese Pharmacopoeia as reference, the raw material is air-dried overnight before grinding into powders smaller than 3 mm using a 50-mesh standard stainless-steel sieve. An extractant amount of 3, 6, 9, 12, and 15 mL is accurately weighed and mixed with water to prepare a two-phase extract containing 20, 40, 60, 80, and 100% of alcohol, and a series of extractants is prepared. Next, five samples of 1.00 g honeysuckle powder are weighed and dissolved in the above extracts. It is carefully shaken to completely mix the honeysuckle powder and the extract, then the sample is put into an ultrasonic vibrator for extraction at 25 °C for 30 min. The sample is filtered with an organic membrane and diluted 10 times with a mobile phase. Peak areas were determined with liquid chromatography and CGA content was calculated by the following formula [26]:
Extraction   yield   ( mg / g ) = Mass   of   CGA   determined   ( mg ) Mass   of   dried   ramie   leaves   powder   ( g )

3. Results and Discussion

3.1. Extraction Using Different Alcohols

3.1.1. Effects of Alcohol Types

Alcohols with different carbon chains were selected as extractant, and the extraction effects of ethanol, n-propanol, n-butanol, and n-amyl alcohol with different volume fractions on CGA were determined, as shown in Figure 1a. The relative standard deviation ranged from 0.5 to 2.5%, demonstrating the high accuracy of the method (b). It can be shown from the figure that the extraction rate of CGA increases with the growing carbon chain of the alcohol. When n-butanol was used, the extraction rate is higher than that using ethanol. However, when n-amyl alcohol was used, the extraction rate decreased significantly, which may be attributed to the saturation of the binding sites of CGA and the main carbon chain of alcohols, so carbon chain extension alone does not enhance the extraction rate [27].

3.1.2. The Effect of Hydroxyl Number

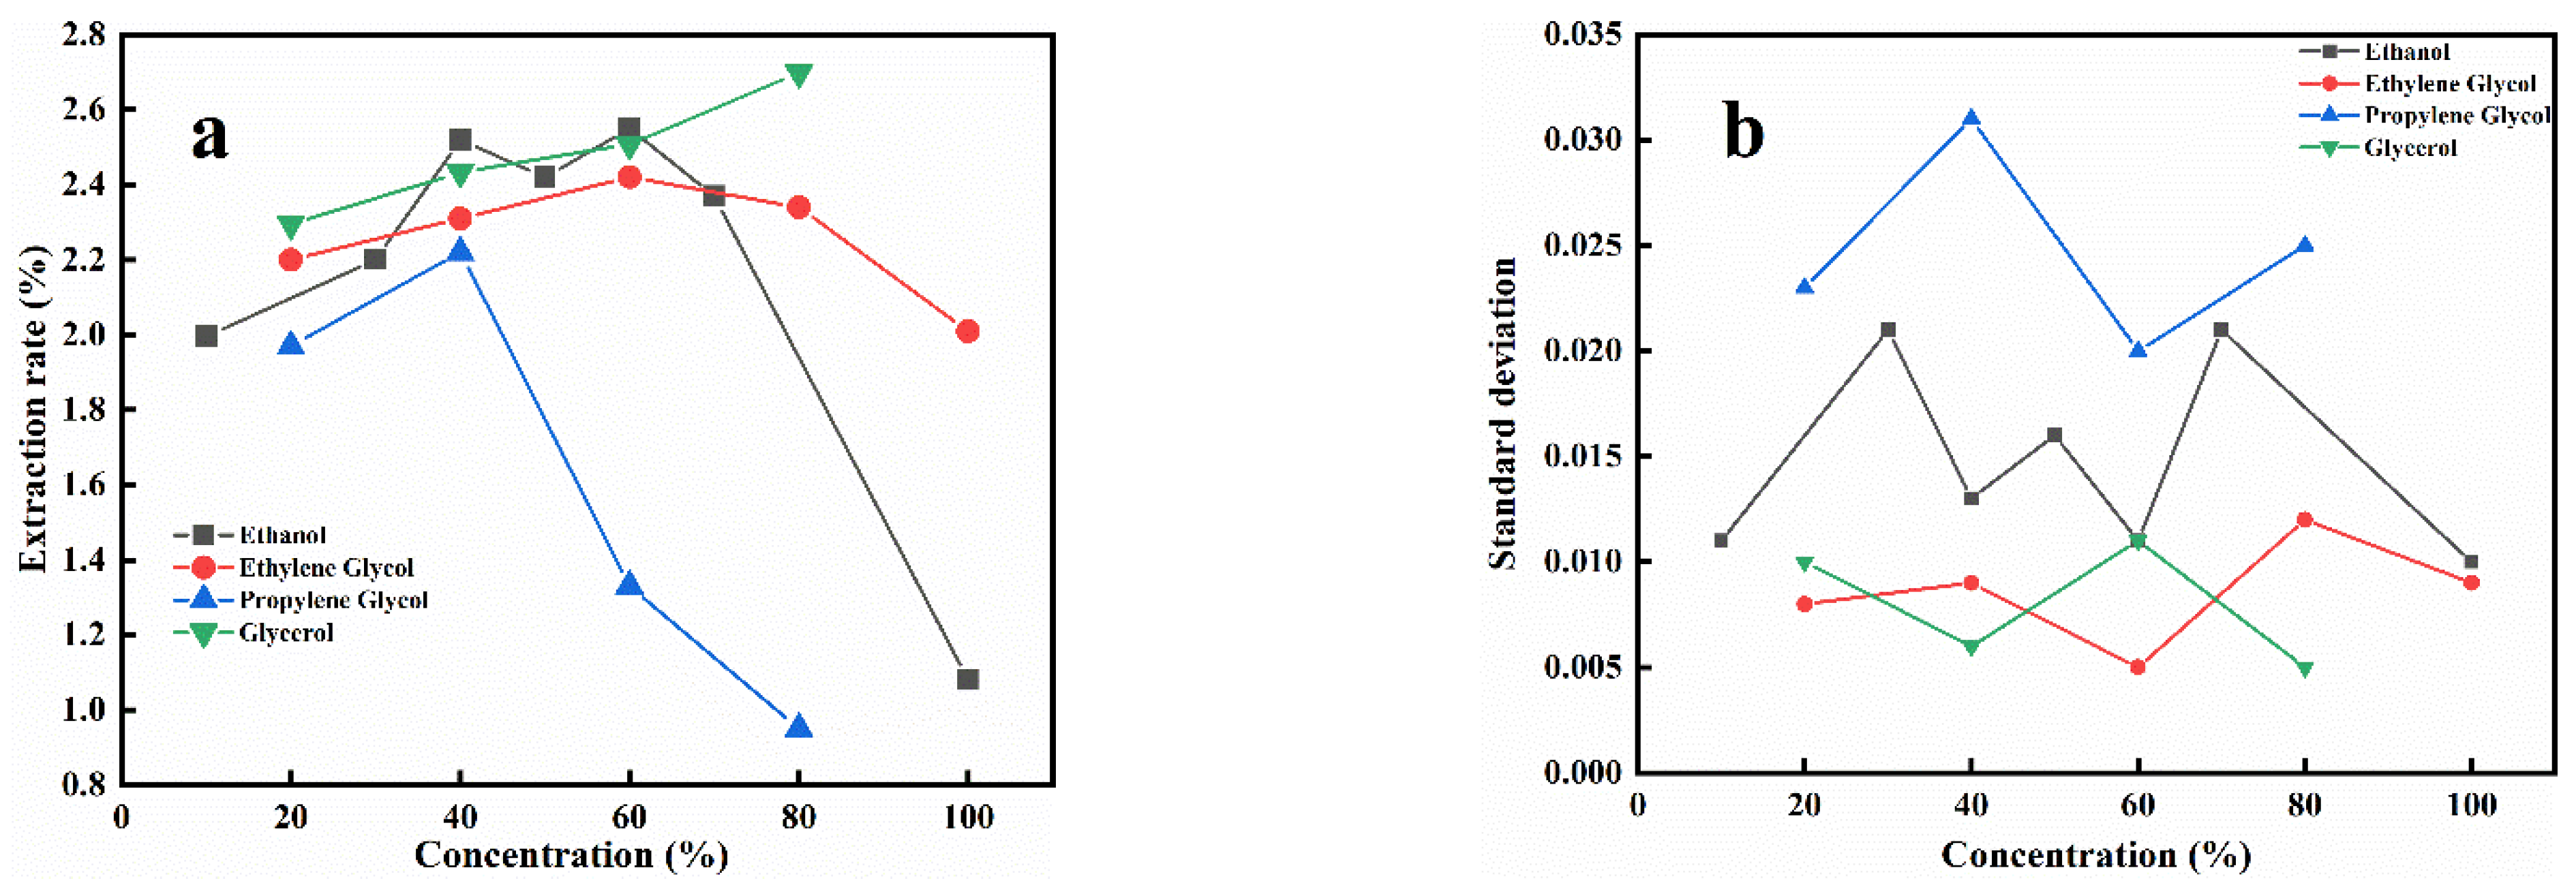
To explore the effect of alcohols with different hydroxyl numbers on the extraction rate of CGA, alcohols with different numbers of hydroxyl side chains were selected as extractants, such as ethanol, ethylene glycol, propylene glycol, and glycerol. Figure 2a shows that the extraction rate of CGA grows with the increase in the number of hydroxyl groups, while Figure 2b indicates a standard deviation between 0.5 and 3.0%, with small differences in data and high accuracy. When glycerol is used, the extraction rate is as high as 2.67%, which is higher than that from other alcohols due to the principle of similar compatibility of side chain functional groups. Glycerol can reduce the water activity of food and prolong the shelf life of food [28], and its physicochemical property makes it suitable for the use of CGA as medicine. Compared with n-butanol, glycerol is safer, greener, and a more efficient extractant for CGA production.

3.2. Single−Factor Experimental Design

3.2.1. Effect of Solid/Liquid Ratio on Extraction Rate

At 25 °C, the ultrasonic vibrator was set to 300 W, 30 min, using 60% glycerol extractant to study the effect of solid/liquid ratio on extraction rate. It can be seen from Figure 3 that the extraction rate of CGA grows linearly with the increase in the extractant volume when the solid/liquid ratio is in the range of 1:5 to 1:20 before slightly leveling off. This may be because the dissolution rate of CGA gradually increases and then stabilizes as the volume of the extractant increases. Therefore, the optimum ratio of solid to liquid is determined at 1:20 in view of raw material cost saving.

3.2.2. Effect of Glycerol Volume Fraction

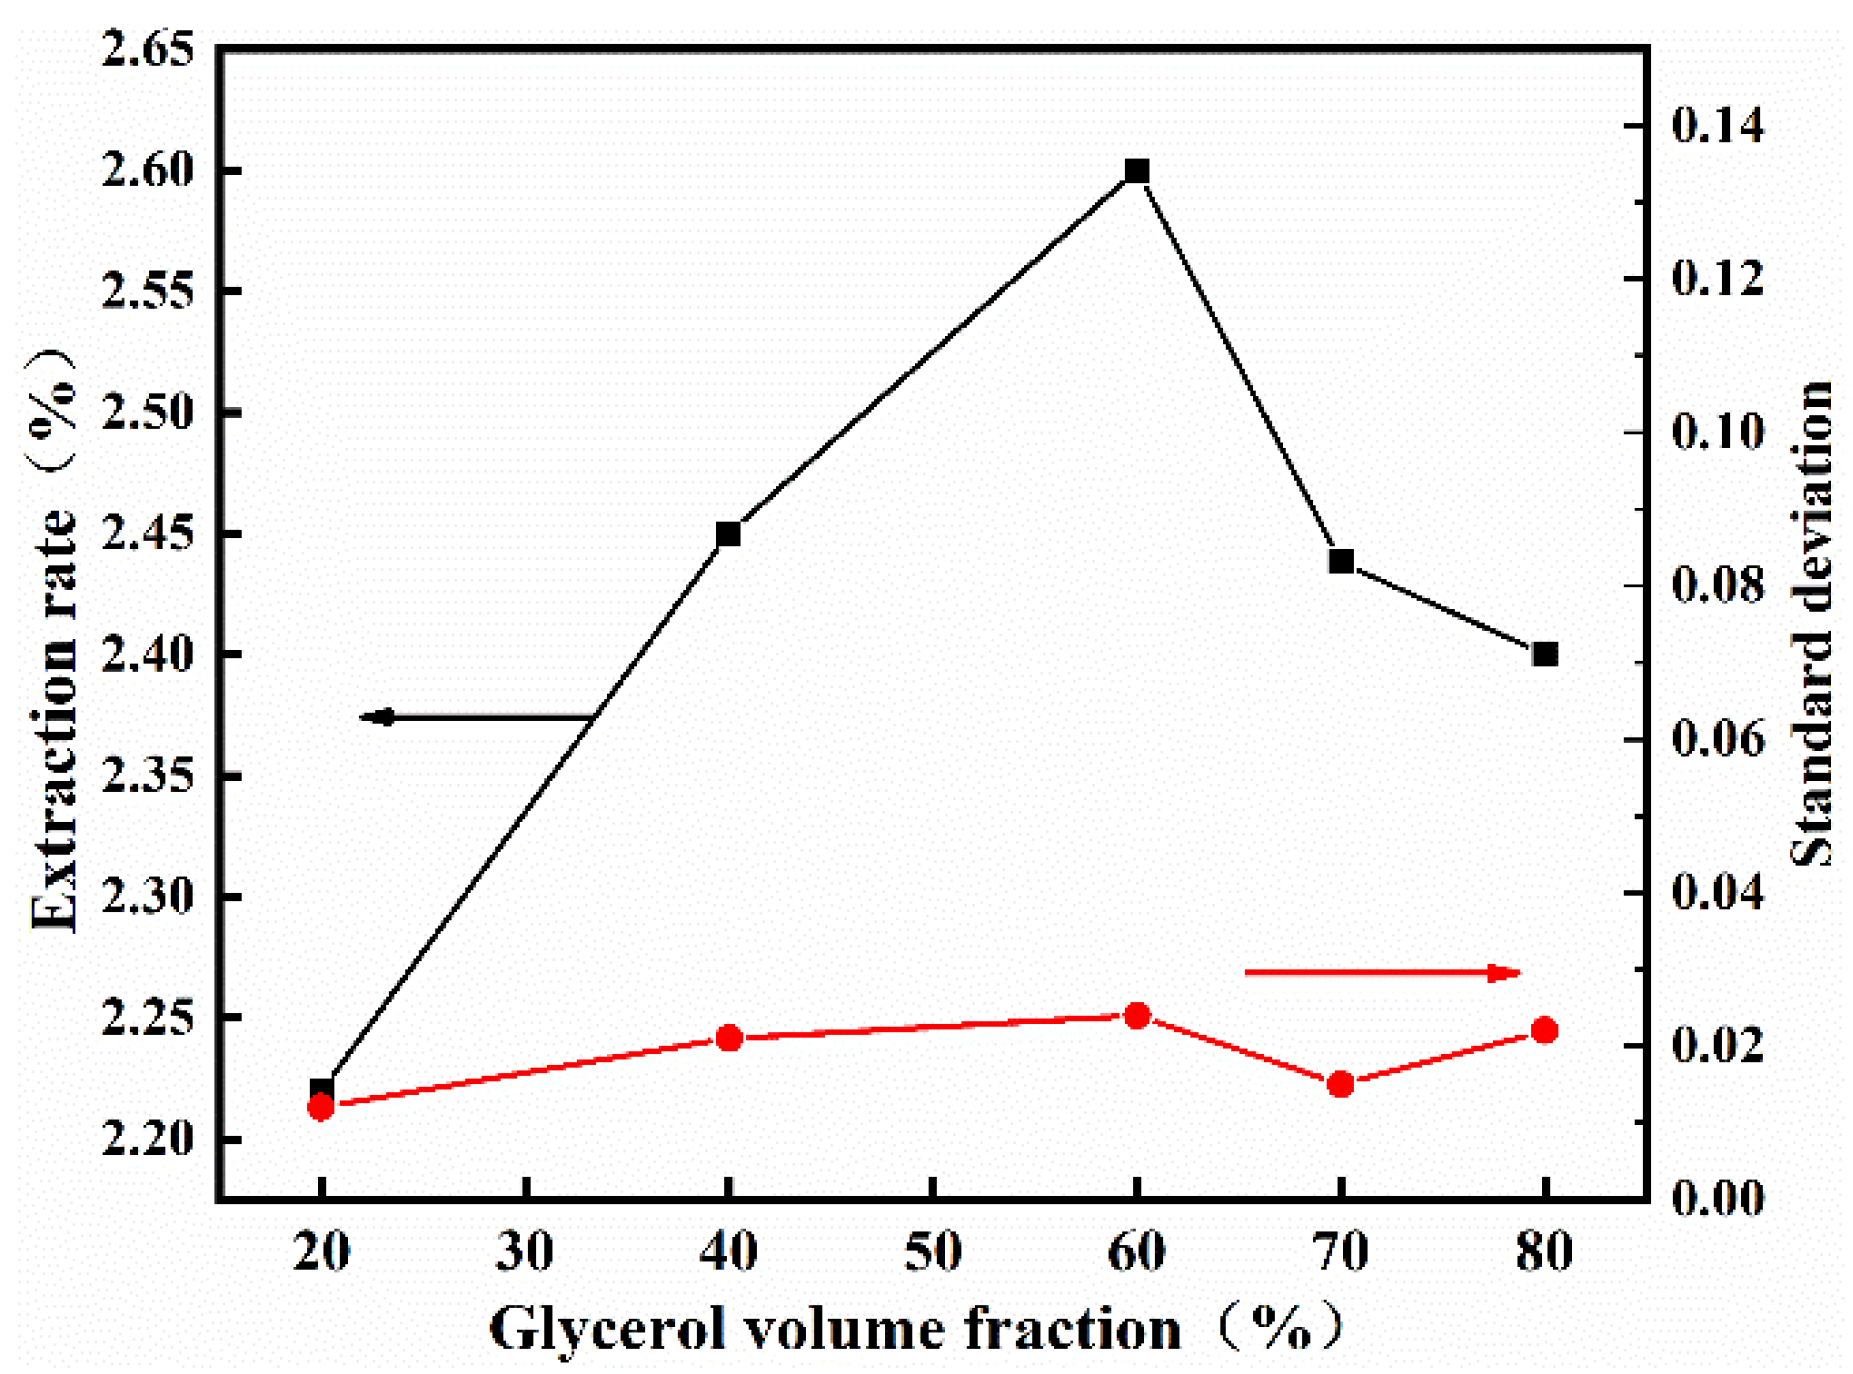
As shown in Figure 4, the effect of glycerol volume fraction on the extraction rate was investigated at 25 °C, using an ultrasonic liberator of 300 W for 30 min, and the raw material-to-liquid ratio at 1:20. It can be seen from the figure that the highest extraction rate of CGA is obtained when the volume fraction of glycerol is 60%. Therefore, when the volume fraction of glycerol is at 60%, the yield of CGA reaches the maximum value of 2.60%, and further increase in volume fraction does not improve the extraction rate of CGA.
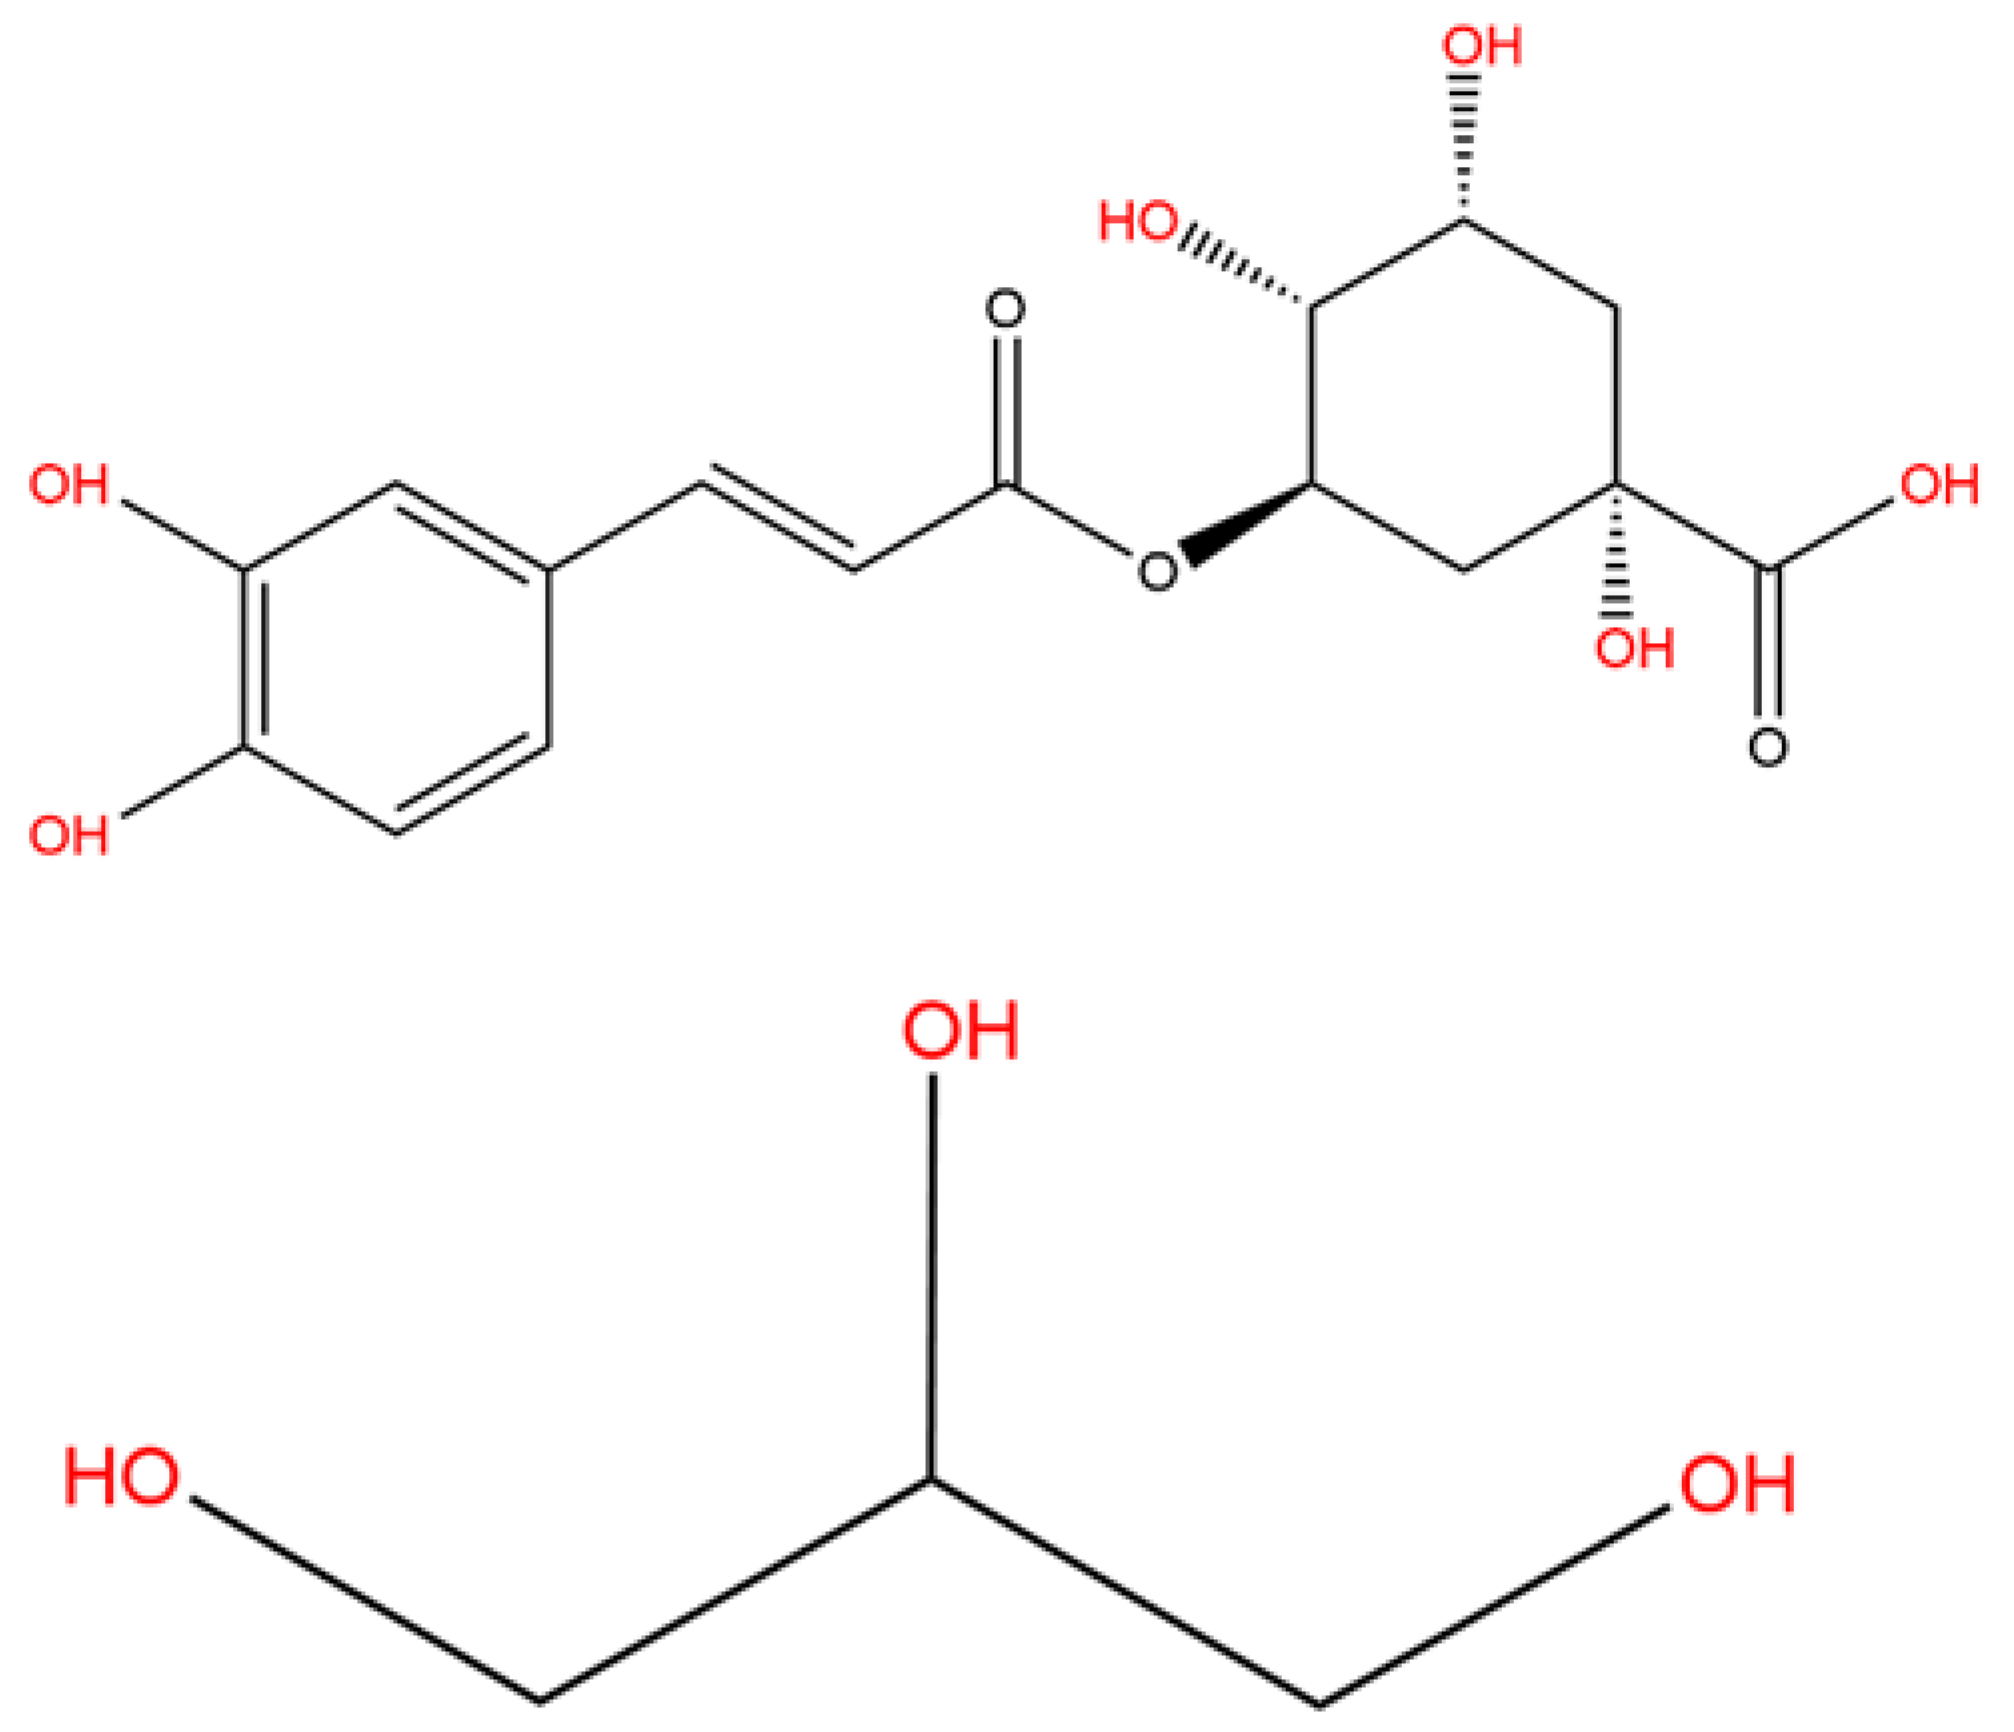
The esterification of caffeic acid and quinic acid forms CGA, which contains multiple chemical bonds with different polarities [29]. In view of the combination and the similar compatibility principle of the hydroxyl groups of chlorogenic acid, glycerol forms new free hydroxyl groups due to the hydrolysis of dissolution (Figure 5), which improves the extraction rate of chlorogenic acid.

3.2.3. The Effect of Ultrasonic Vibrator

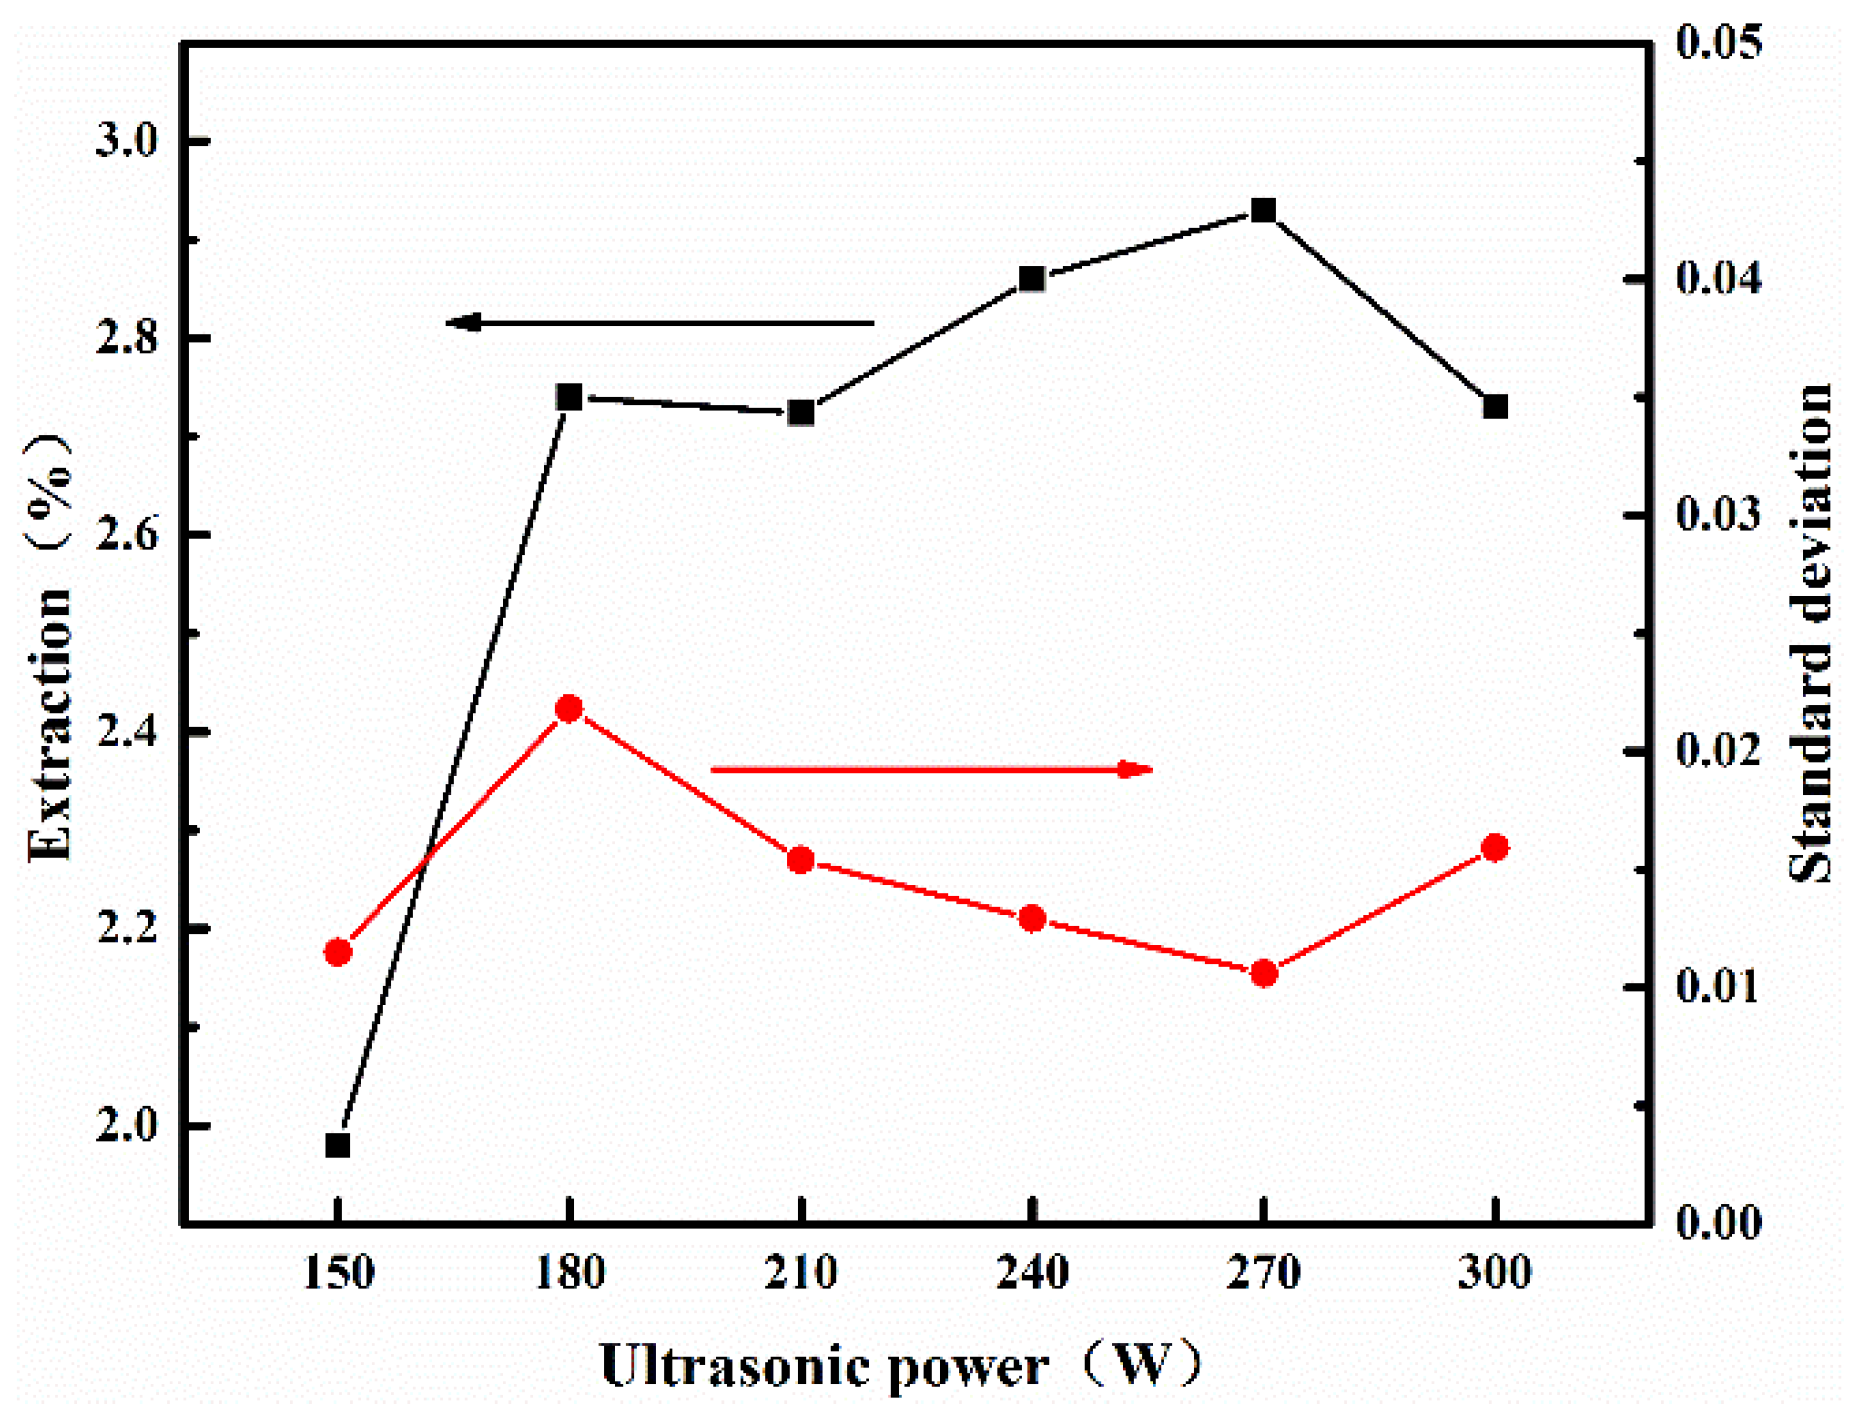
To probe the influence of ultrasonic vibration power on the extraction rate, the ultrasonic operation time was set to 30 min, the volume fraction of glycerol at 60%, and the solid raw material-to-extractant liquid ratio at 1:20 for the extractant experiment at ambient temperature. Figure 6 shows that the extraction rate of CGA increases rapidly between 150 W and 180 W, which proves that the ultrasonic vibrator has a significant effect on the extraction of CGA. With the power of 270 W, the peak area reaches the maximum yield of 2.92%. This is because the ultrasonic wave may facilitate the extraction process by exerting a strong destructive force on the cell wall. The decrease in the extraction rate when supersonic vibrating powder over 270 W was used, which can be attributed to the complete precipitation of CGA. Further increasing the power will destroy the structure of CGA and lead to a decrease in the extraction rate.

3.2.4. Effect of Ultrasonic Time

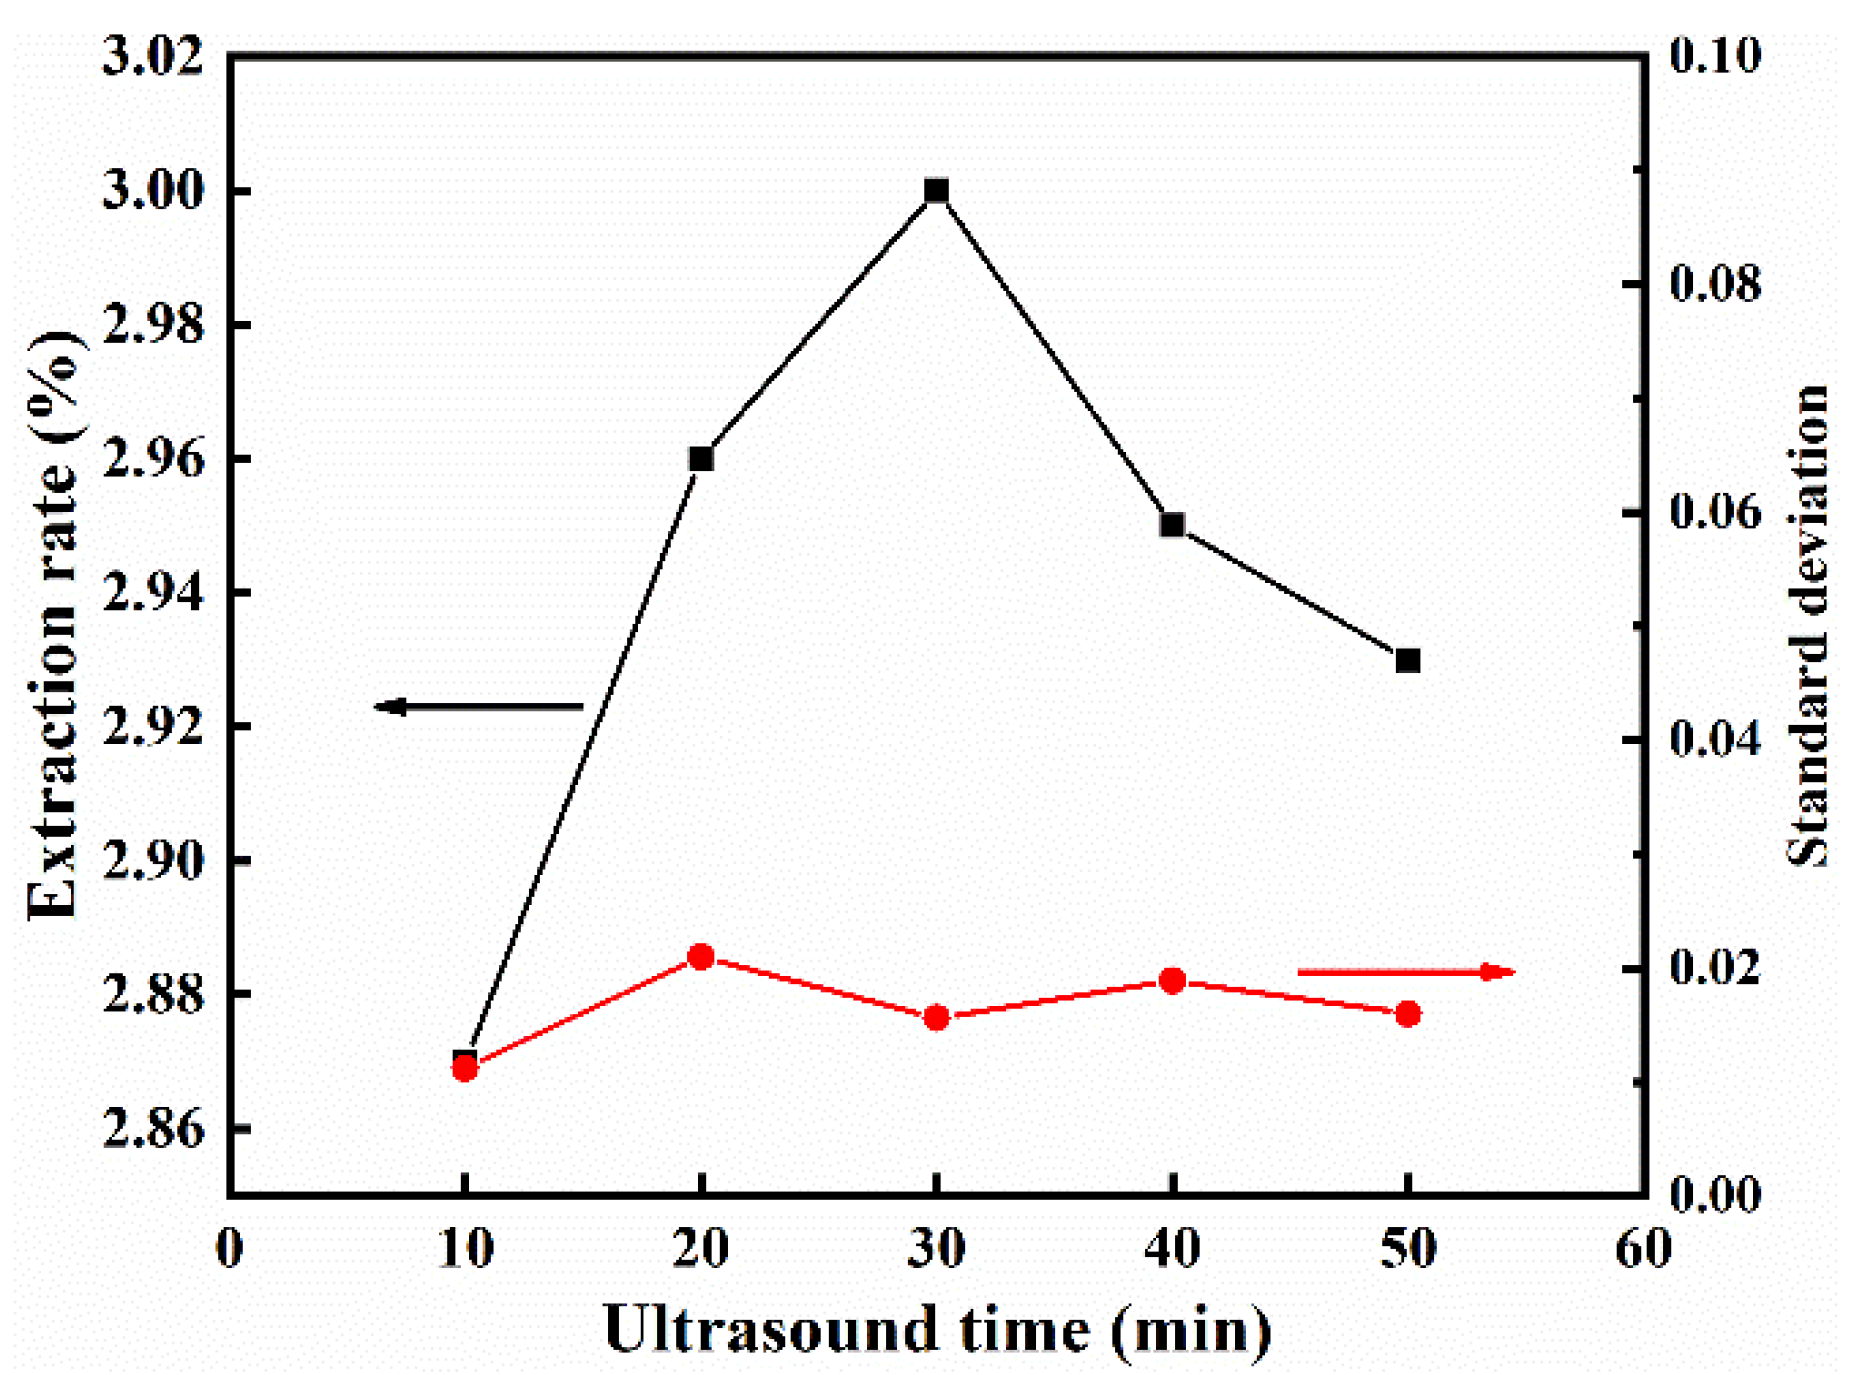
To study the influence of ultrasonic time on extraction rate at 25 °C, a sample was investigated under the conditions of the ultrasonic vibrator of 270 W, the glycerol volume fraction of 60%, and the solid material-to-liquid ratio at 1:20. The results from Figure 7 show that when the ultrasonic time is set in the range of 10–30 min, the extraction rate is positively correlated with the ultrasonic time. However, when the ultrasonic vibration time is greater than 30 min, CGA is unstable and easily oxidized because it contains 5 active hydroxyl groups, 1 carboxyl group, and diphenol hydroxyl group. Long–time ultrasonic vibration may cause CGA decomposition. Hence, 30 min was determined as the optimum extraction time.

3.3. Optimization of the Extraction Parameters by Response Surface Methodology

3.3.1. Response Surface Experimental Design

To further improve the extraction rate of CGA, the extraction conditions of glycerol were optimized by response surface method [30]. Ultrasonic vibrator power (A), glycerol volume fraction (B), and ultrasonic operation time (C) were selected to optimize the CGA extraction from honeysuckle. The Box–Behnken [31] three-factor and three-level experimental design was summarized in Table 3. On the bases of the single-factor experiment, the material-to-liquid ratio was set at 1:20 for the sake of cost saving. The ultrasonic time (A) and the volume fraction of glycerol (B) were selected under constant temperature conditions of the ultrasonic vibrator (C) to optimize the extraction process of CGA in honeysuckle. The prediction test plan is shown in Table 4.

3.3.2. Model Evaluation

The quadratic polynomial regression fitting result on the test data is shown in Table 4 and then to obtain the mathematical model is obtained as the follows:
Y = 2.91 + 0.003838A − 0.009750B + 0.026C + 0.024AB − 0.035AC + 0.018BC + 0.013A2 − 0.053B2 + 0.008828C2
The Table 5 value of “F” is employed to express the accuracy of the results from representative samples of proper population. The results of F = 8.79 and p = 0.0046 < 0.01 of the model suggest that the difference between the quadratic models used in this experiment is significant. The quadratic term of glycerol volume fraction was highly significant (p < 0.001). The interactions between one-factor parameter of ultrasonic time (C) and two-factor ultrasonic vibrator and time (A × C) were significant, while the other interaction parameters were not significant (0.01 ≤ p < 0.05 and p ≥ 0.05), indicating that the experimental error is minor. The determinant R2 = 0.9187 and the prediction R2 = −0.0353 suggest that the overall mean can better predict the response than the current model. It also indicates that the model can respond well to the changes in response values. The significance of the affecting factors is in the order of ultrasonic time, glycerol volume fraction, and ultrasonic vibrator power.

3.3.3. Response Surface Analysis

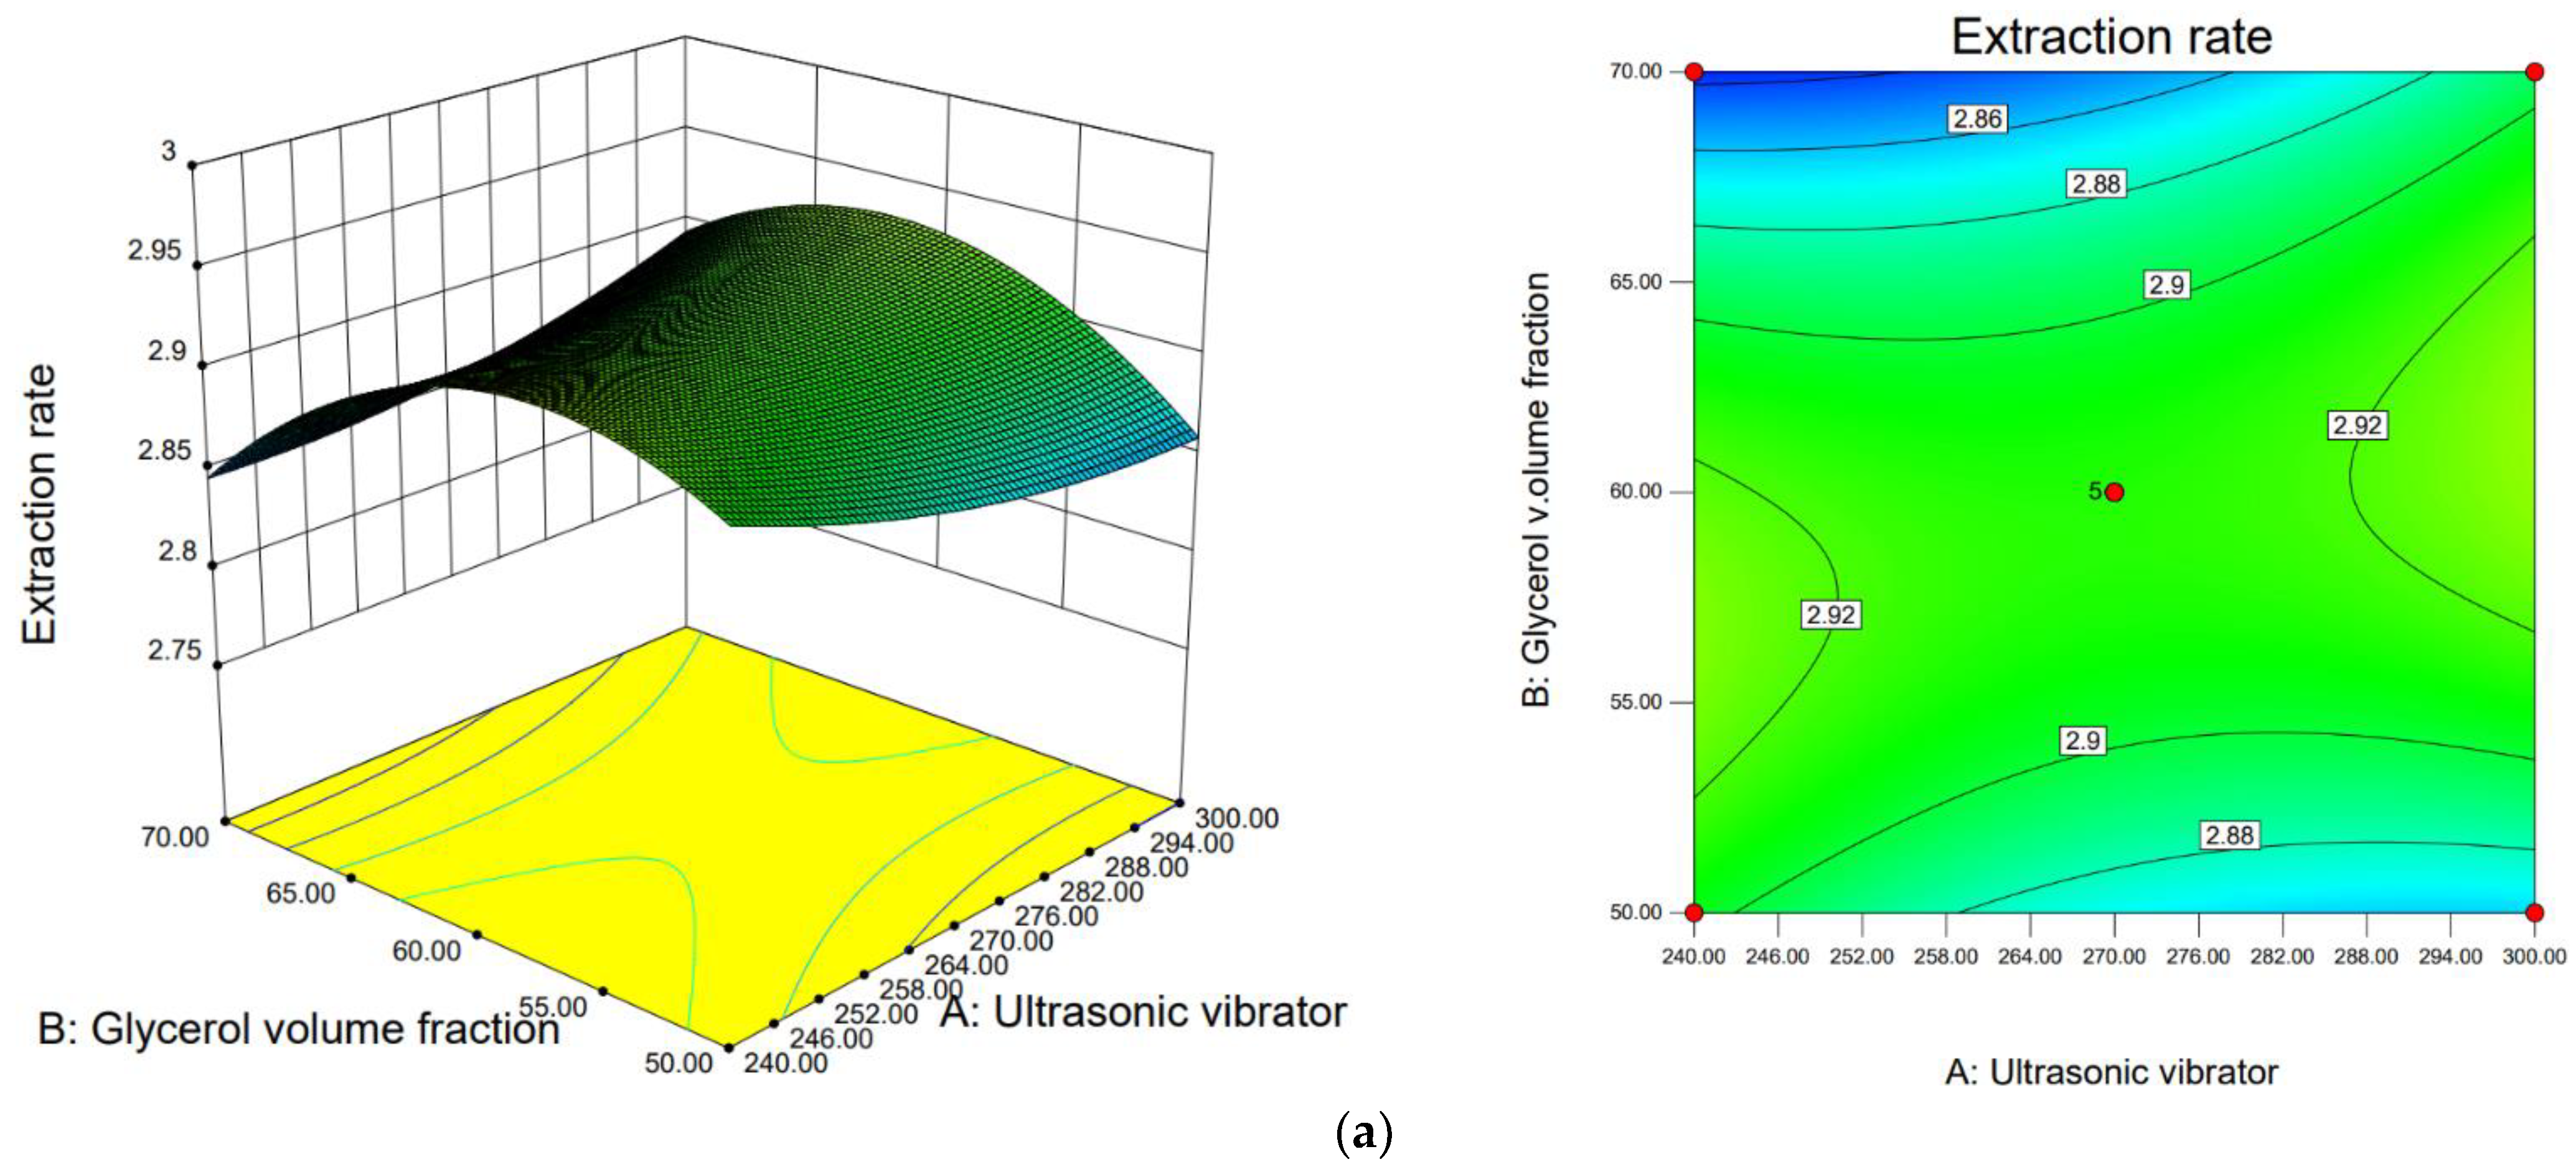
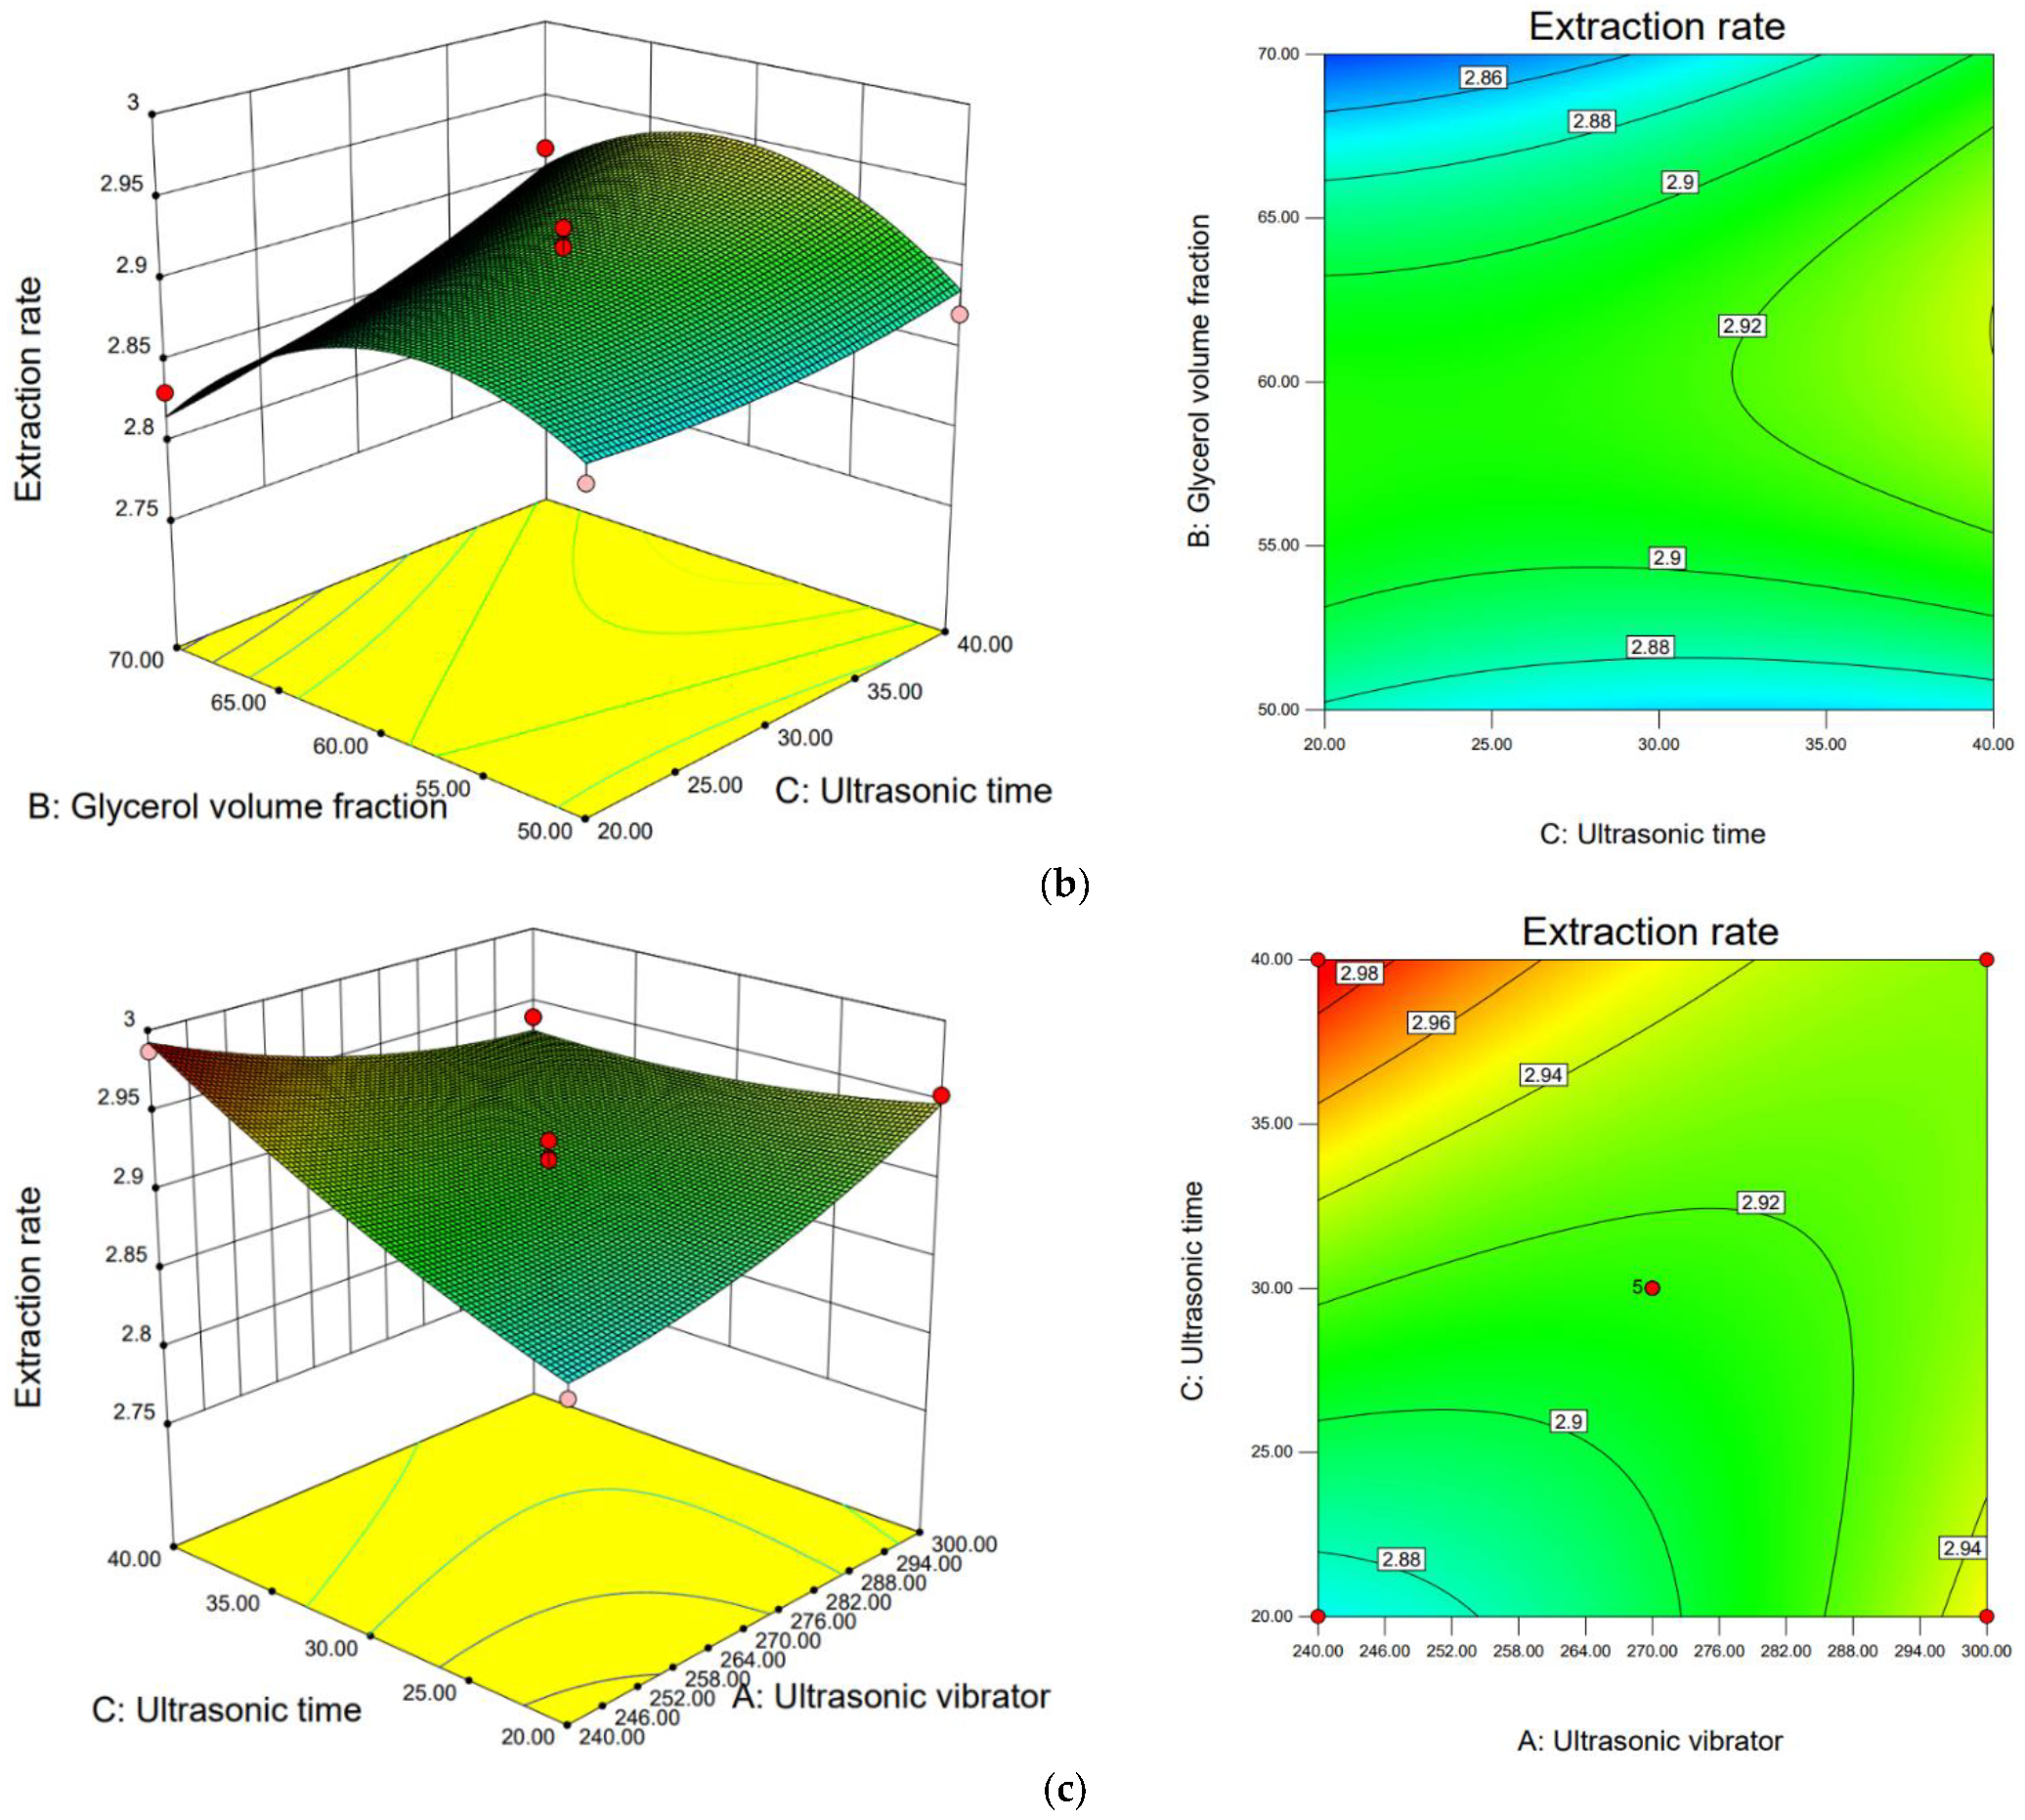
Response surface optimization of CGA extraction is represented in a 3D model diagram, as shown in Figure 8. The results indicate that when ultrasonic vibrator power remains unchanged, ultrasonic time is more significant than glycerol volume fraction. When ultrasonic time remains unchanged, ultrasonic vibrator power is more significant than glycerol volume fraction. Therefore, the influence of ultrasonic vibrator time and power is more significant than other factors. Through the optimization analysis, the optimal extraction conditions were determined with an ultrasonic vibrator power of 240 W, glycerol volume fraction of 58.5%, ultrasonic time of 40 min, and solid/liquid ratio of 1:20, for a predicted extraction rate of 2.99%. Actual experiments were carried out under the above conditions, and the CGA extraction rate of 2.98% was produced. This result is fairly consistent with the predicted value of the Box–Behnken experimental design model.

3.3.4. Verification of Experimental Data with Predicted Modeling Data

The optimal extraction conditions were obtained by Box–Behnken fitting and three parallel experiments were performed to verify the prediction results. The results are shown in Table 6 through three parallel experiments and the CGA extraction rates are all at about 2.98%, which is 0.01% different from the Box–Behnken fitting prediction value of 2.99%, indicating that the equation fits conditions properly and the established model is reasonably reliable.

4. Conclusions

This experiment innovatively proposed the use of glycerol to extract CGA from honeysuckle. The optimized process was obtained by the response surface analysis method, using ultrasonic power of 240 W, glycerol volume fraction of 58.5%, ultrasonic time of 40 min, and material-to-liquid ratio of 1:20 to obtain the optimized extraction rate of 2.98%, which was 11.3% higher than that using traditional ethanol extractant. The experimental design method in this paper facilitates the optimization of the extraction process using a simple but reliable approach. The results from this work can provide a promising application in the extraction of CGA for traditional Chinese medicine.

Author Contributions

Conceptualization, M.L. and Z.Z.; methodology, X.L.; software, X.L.; validation, X.L., F.W. and C.S.; formal analysis, Z.Z.; investigation, X.L.; re-sources, M.L.; data curation, X.L.; writing original draft preparation, X.L.; writing and review and editing, M.L.; visualization, M.L.; supervision, Z.Z.; project administration, M.L.; funding acquisition, M.L. All authors have read and agreed to the published version of the manuscript.

Funding

This research received no external funding.

Conflicts of Interest

The authors declare no conflict of interest.

References

  1. Jurikova, T.; Rop, O.; Mlček, J.; Sochor, J.; Balla, Š.; Szekeres, L.; Hegedȕsová, A.; Hubálek, J.; Adam, V.; Kizek, R. Phenolic profile of edible honeysuckle berries (Genus Lonicera) and their biological effects. Molecules 2012, 17, 61–79. [Google Scholar] [CrossRef] [PubMed] [Green Version]
  2. Yao, C.Y.; Song, Z.J.; Ruan, L.J.; Yan, B.X.; Wu, Q.H.; He, L.L.; Wu, Y.Q.; Liu, X.H.; Peng, Y.D.; Miao, J.H. A new methoxylated flavone from Lonicera hypoglauca and its chemotaxonomic significance. Biochem. Syst. Ecol. 2021, 97, 104249. [Google Scholar] [CrossRef]
  3. Tang, Y.R.; Zeng, T.; Zafar, S.; Yuan, H.W.; Li, B.; Peng, C.Y.; Wang, S.C.; Jian, Y.Q.; Qin, Y.; Choudhary, M.I.; et al. Lonicerae Flos: A review of chemical constituents and biological activities. Digit. Chin. Med. 2018, 1, 173–188. [Google Scholar] [CrossRef]
  4. Wang, X.Q.; Wei, F.Y.; Wei, Z.F.; Zhang, L.; Luo, M.; Zhang, Y.H.; Zu, Y.G.; Fu, Y.J. Homogenate-assisted negative-pressure cavitation extraction for determination of organic acids and flavonoids in honeysuckle (Lonicera japonica Thunb.) by LC–MS/MS. Sep. Purif. Technol. 2014, 135, 80–87. [Google Scholar] [CrossRef]
  5. Bao, T.; Karim, N.; Xie, L.H.; Xie, J.H.; Chen, W. Simulated gastrointestinal digestion and colonic fermentation of blue honeysuckle: Phenolic profile and protectivity on ethyl carbamate-induced oxidative damage. Process Biochem. 2022, 120, 74–84. [Google Scholar] [CrossRef]
  6. Gołba, M.; Sokół-Łętowska, A.; Kucharska, A.Z. Health properties and composition of honeysuckle berry Lonicera caerulea L. An update on recent studies. Molecules 2020, 25, 749. [Google Scholar] [CrossRef] [Green Version]
  7. Wang, A.; Zhao, R.X.; Liu, B.G.; Fan, W.X.; Zhang, H. Extracting characteristics of trace elements in honeysuckle flower tea. Agro Food Ind. Hi-Tech. 2008, 19, 53–55. [Google Scholar]
  8. Zhang, S.B.; Li, J.Y.; Guo, Y.S. Study on determination of metal elements in honeysuckle by Carbon Pick-Up acid dissolvation digestion with ICP-AES. Spectrosc. Spectr. Anal. 2007, 27, 1222–1224. [Google Scholar]
  9. Visan, D.C.; Radulescu, V.; Duţu, L.E. Volatile constituents from the flowers of two species of honeysuckle (Lonicera japonica and Lonicera caprifolium). Farmacia 2014, 62, 194–201. [Google Scholar]
  10. Muturi, E.J.; Doll, K.; Berhow, M.; Flor-Weiler, L.B.; Rooney, A.P. Honeysuckle essential oil as a potential source of ecofriendly larvicides for mosquito control. Pest Manag. Sci. 2019, 75, 2043–2048. [Google Scholar] [CrossRef] [Green Version]
  11. Wu, S.S.; He, X.; Wu, X.S.; Qin, S.; He, J.H.; Zhang, S.R.; Hou, D.X. Inhibitory effects of blue honeysuckle (Lonicera caerulea L) on adjuvant-induced arthritis in rats: Crosstalk of anti-inflammatory and antioxidant effects. J. Funct. Foods 2015, 17, 514–523. [Google Scholar] [CrossRef]
  12. Liu, M.; Tan, J.; He, Z.; He, X.; Hou, D.X.; He, J.; Wu, S. Inhibitory effect of blue honeysuckle extract on high-fat-diet-induced fatty liver in mice. Anim. Nutr. 2018, 11, 288–293. [Google Scholar] [CrossRef] [PubMed]
  13. Zhou, L.; Wang, H.; Yi, J.; Yang, B.; Li, M.; He, D.; Yang, W.; Zhang, Y.; Ni, H. Anti-tumor properties of anthocyanins from Lonicera caerulea ‘Beilei’ fruit on human hepatocellular carcinoma: In vitro and in vivo study. Biomed. Pharmacother. 2018, 104, 520–529. [Google Scholar] [CrossRef] [PubMed]
  14. Ge, L.L.; Li, J.M.; Wan, H.Q.; Zhang, K.D.; Wu, W.D.; Zou, X.T.; Wu, S.P.; Zhou, B.P.; Tian, J.; Zeng, X.B. Novel flavonoids from Lonicera japonica flower buds and validation of their anti-hepatoma and hepatoprotective activity in vitro studies. Ind. Crops Prod. 2018, 125, 114–122. [Google Scholar] [CrossRef]
  15. Liu, M.Z.; Yu, Q.; Yi, Y.; Xiao, H.H.; Putra, D.F.; Ke, K.; Zhang, Q.; Li, P.F. Antiviral activities of Lonicera japonica Thunb. Components against grouper iridovirus in vitro and in vivo. Aquaculture 2020, 519, 734882. [Google Scholar] [CrossRef]
  16. Zhang, X.; Huang, H.; Yang, T.; Ye, Y.; Shan, J.H.; Yin, Z.M.; Luo, L. CGA protects mice against lipopolysaccharide-induced acute lung injury. Injury 2010, 41, 746–752. [Google Scholar] [CrossRef] [PubMed]
  17. Golubev, D.; Zemskaya, N.; Shevchenko, O.; Shaposhnikov, M.; Kukuman, D.; Patov, S.; Punegov, V.; Moskalev, A. Honeysuckle extract (Lonicera pallasii L.) exerts antioxidant properties and extends the lifespan and healthspan of Drosophila melanogaster. Biogerontology 2022, 23, 215–235. [Google Scholar] [CrossRef]
  18. Hsu, H.F.; Hsiao, P.C.; Kuo, T.C.; Chiang, S.T.; Chen, S.L.; Chiou, S.J.; Ling, X.H.; Liang, M.T.; Cheng, W.Y.; Houng, J.Y. Antioxidant and anti-inflammatory activities of Lonicera japonica Thunb. var. sempervillosa Hayata flower bud extracts prepared by water, ethanol and supercritical fluid extraction techniques. Ind. Crops Prod. 2016, 89, 543–549. [Google Scholar] [CrossRef]
  19. Meng, X.L.; Cao, H.; Li, H.; Li, K.K.; Yang, G.K.; Zhang, Y.M.; Chang, X.L.; Zhang, X.D.; Zhang, J.X. Effect of dietary honeysuckle (Lonicera caerulea L.) supplementation on lipid metabolism, immunity and intestinal microbiota in grass carp (Ctenopharyngodon idellus). Aquac. Rep. 2022, 23, 101063. [Google Scholar] [CrossRef]
  20. Feng, J.C.; Chang, X.L.; Zhang, Y.R.; Lu, R.H.; Meng, X.L.; Song, D.Y.; Yan, X.; Zhang, J.X.; Nie, G.X. Characterization of a polysaccharide HP-02 from honeysuckle flowers and its immunoregulatory and anti-Aeromonas hydrophila effects in Cyprinus carpio L. Int. J. Biol. Macromol. 2019, 140, 477–483. [Google Scholar] [CrossRef]
  21. Li, H.J.; Li, Y.; Luo, C.X.; Liang, X.Y.; Liu, Z.X.; Liu, Y.Z.; Ling, Y.Z. New approach for targeted treatment of mild COVID-19 by honeysuckle through network pharmacology analysis. Comput. Math. Methods Med. 2022, 21, 9604456. [Google Scholar] [CrossRef] [PubMed]
  22. Olech, M.; Łyko, L.; Nowak, R. Influence of accelerated solvent extraction conditions on the LC-ESI-MS/MS polyphenolic profile, triterpenoid content, and antioxidant and anti-lipoxygenase activity of Rhododendron luteum sweet leaves. Antioxidants 2022, 9, 822. [Google Scholar] [CrossRef] [PubMed]
  23. Sharmila, G.; Muthukumaran, C.; Suriya, E.; Keerthana, R.M.; Kamatchi, M.; Kumar, N.M.; Anbarasan, T.; Jeyanthi, J. Ultrasound aided extraction of yellow pigment from Tecoma castanifolia floral petals: Optimization by response surface method and evaluation of the antioxidant activity. Ind. Crops Prod. 2019, 130, 467–477. [Google Scholar] [CrossRef]
  24. Huang, T.Y.; Ho, J.S.; Goh, S.W.; Chong, T.H. Ethanol recovery from dilute aqueous solution by perstraction using supported ionic liquid membrane (SILM). J. Clean. Prod. 2021, 298, 126811. [Google Scholar] [CrossRef]
  25. Beatriz, M.G.; Sandra, P.M.; Ana, M.G.; David, A.R.; Antonio, S.C. Box-Behnken experimental design for a green extraction method of phenolic compounds from olive leaves. Ind. Crops Prod. 2020, 154, 112741. [Google Scholar]
  26. Yang, Z.Z.; Tan, Z.J.; Li, F.F.; Li, X.D. An effective method for the extraction and purification of CGA from ramie (Boehmeria nivea L.) leaves using acidic ionic liquids. Ind. Crops Prod. 2016, 89, 78–86. [Google Scholar] [CrossRef]
  27. Ribeiro, L.F. Differences between isoamyl alcohol and ethanol on the metabolism and DNA ethylation of N-nitrosodiethylamine in the rat. Toxicology 2000, 151, 73–79. [Google Scholar] [CrossRef] [PubMed]
  28. Vittadini, E.; Clubbs, E.; Shellhammer, T.H.; Vodovotz, Y. Effect of high-pressure processing and addition of glycerol and salt on the properties of water in corn tortillas. J. Cereal Sci. 2004, 39, 109–117. [Google Scholar] [CrossRef]
  29. Sripad, G.; Prakash, V.; Rao, M.N. Extractability of polyphenols of sunflower seed in various solvents. J. Biosci. 1982, 4, 145–152. [Google Scholar] [CrossRef]
  30. Daraee, A.; Ghoreishi, S.M.; Hedayati, A. Supercritical CO2 extraction of CGA from sunflower (Helianthus annuus) seed kernels: Modeling and optimization by response surface methodology. J. Supercrit. Fluids 2019, 144, 19–27. [Google Scholar] [CrossRef]
  31. Haque, S.K.M. Box–Behnken experimental design for optimizing the HPLC method to determine hydrochlorothiazide in pharmaceutical formulations and biological fluid. J. Mol. Liq. 2022, 352, 118708. [Google Scholar] [CrossRef]
  32. Ghoreishi, S.M.; Heidari, E. Extraction of Epigallocatechin-3-gallate from green tea via supercritical fluid technology: Neural network modeling and response surface optimization. J. Supercrit. Fluids 2013, 74, 128–136. [Google Scholar] [CrossRef]
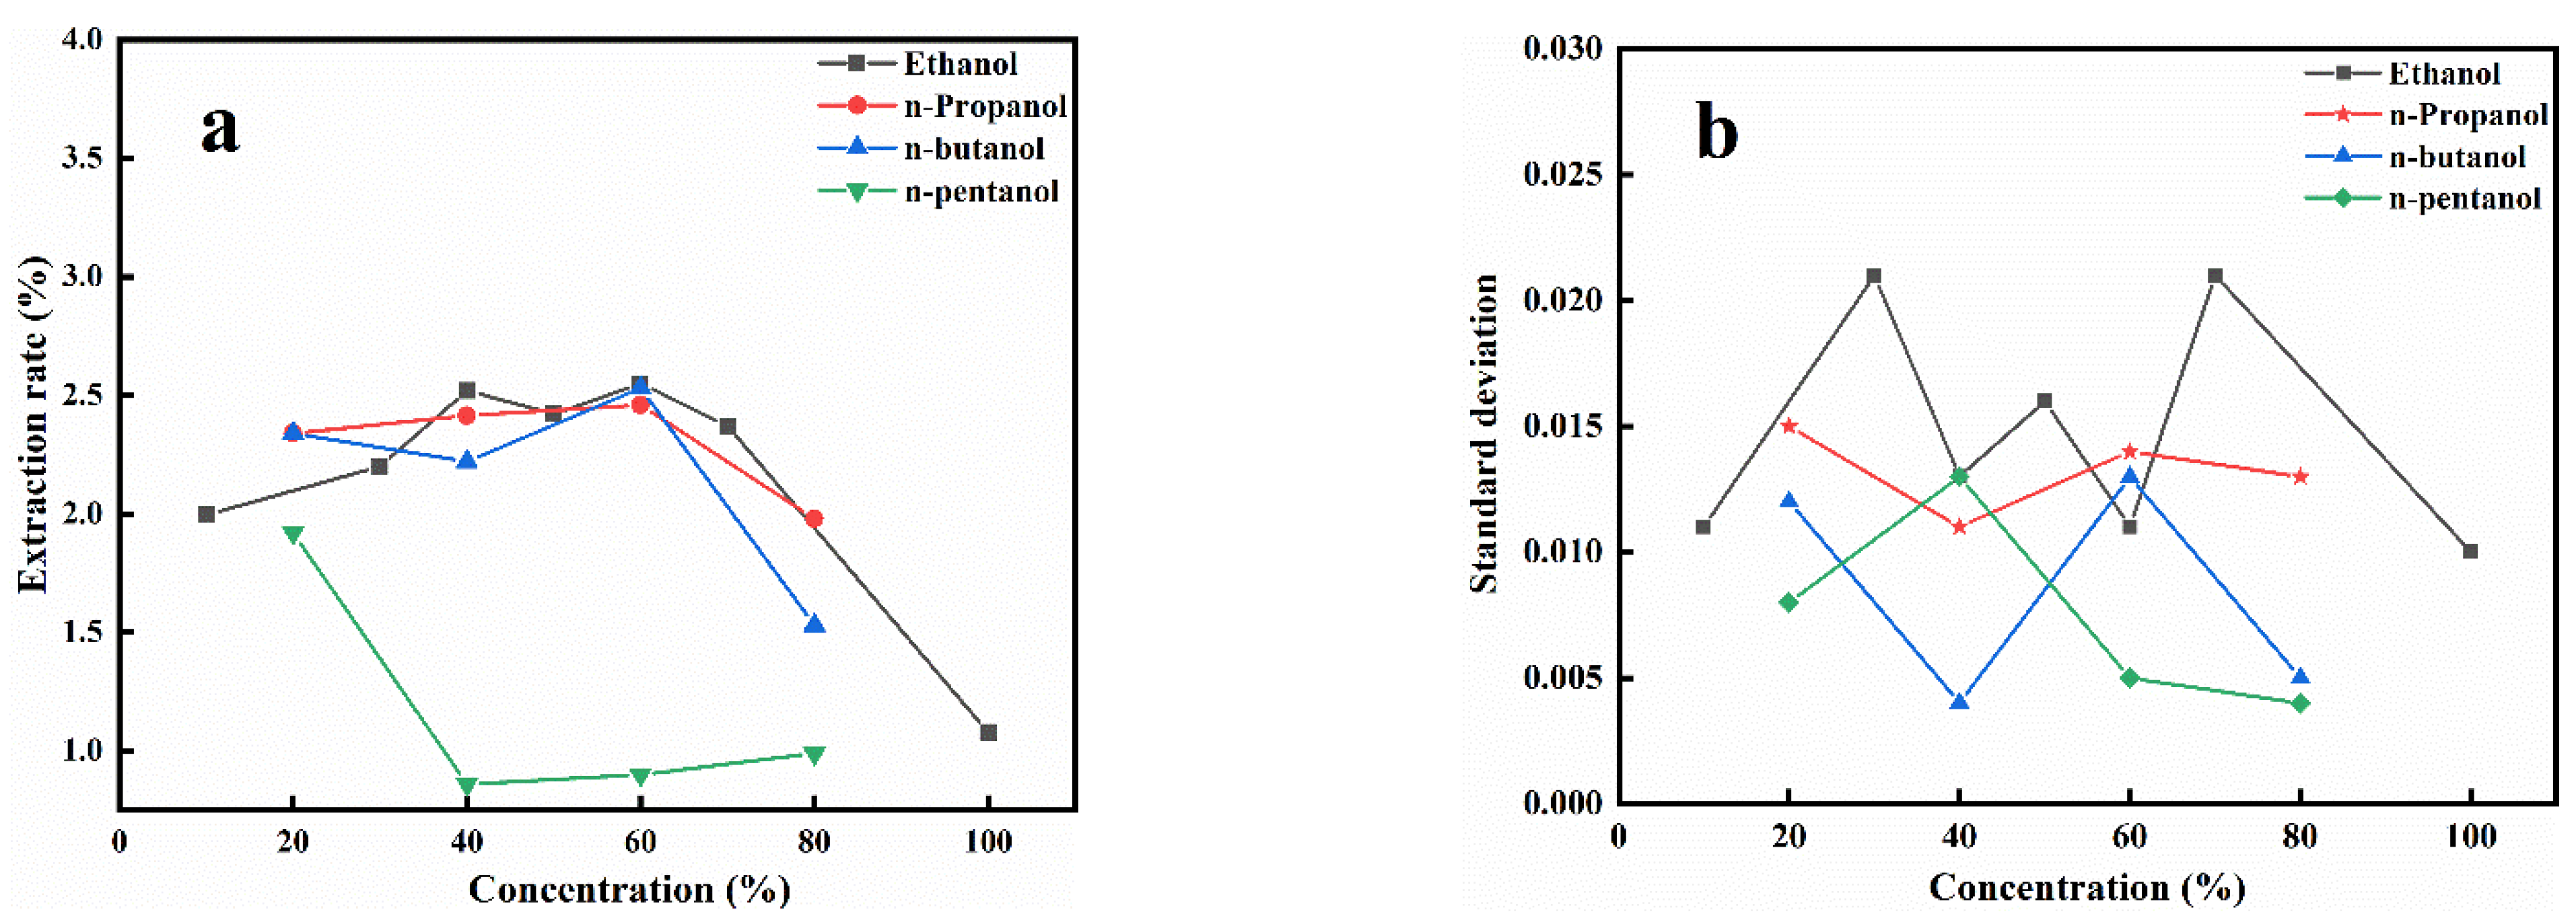
Figure 1. (a) Effects of alcohols with different carbon chain lengths on the extraction rate of CGA. (b) Standard deviation of the effect of carbon chain length on extraction rate.
Processes 11 00110 g001
Figure 2. (a) Effects of alcohols with different hydroxyl numbers on the extraction rate of CGA. (b) Standard deviation of the effect of the number of hydroxyls on the extraction rate.
Processes 11 00110 g002
Figure 3. Effect of solid/liquid ratio on extraction rate. (The black arrow represents the extraction rate curve and the red arrow represents the standard deviation curve.).
Processes 11 00110 g003
Figure 4. Effect of glycerol volume fraction on extraction yield. (The black arrow represents the extraction rate curve and the red arrow represents the standard deviation curve.)
Processes 11 00110 g004
Figure 5. Molecular structure of chlorogenic acid and glycerol.
Processes 11 00110 g005
Figure 6. Effect of ultrasonic vibrator on extraction rate. (The black arrow represents the extraction rate curve and the red arrow represents the standard deviation curve.)
Processes 11 00110 g006
Figure 7. Effect of sonication time on extraction rate. (The black arrow represents the extraction rate curve and the red arrow represents the standard deviation curve.)
Processes 11 00110 g007
Figure 8. Response surface plots showing the effects of variables on the average extraction yield of CGA: (a) interaction of the ultrasonic vibrator and glycerol volume fraction, (b) interaction of the glycerol volume fraction and ultrasonic time, and (c) interaction of the ultrasonic time and ultrasonic vibrator.
Processes 11 00110 g008aProcesses 11 00110 g008b
Table 1. Chemicals.
Table 1. Chemicals.
Raw Materials and ReagentsManufacturer
Honeysuckle pollenBozhou Celebration Medicine Hall, Anhui, China
CGA standardBeijing InnoChem Science & Technology Co., Ltd., Beijing, China
Anhydrous ethanol (analytical grade)Aladdin Biochemical Technology Co., Ltd., Shanghai, China
Phosphoric acid (analytical grade)Aladdin Biochemical Technology Co., Ltd., Shanghai, China
Sodium hydroxide (analytical grade)Beijing Chemical Works, Beijing, China
Acetonitrile (chromatographic grade)Beijing Mindray Technology Co., Ltd., Beijing, China
Distilled waterWatsons Distilled Water Co., Ltd., Beijing, China
Table 2. Waters 2695 HPLC used in this study.
Chromatographic ConditionsParameter
Waters 2487 UV detector2 channel, tunable UV/Vis
C18 Column (Kromasil 100–5 4.6 mm × 250 mm)AkzoNobel Sweden
Mobile phaseV(acetonitrile): V (0.4% phosphoric acid) = 1:9
Detection wavelength327 nm
Column temperature25 °C
Flow rate1 mL/min
Injection volume5 μL
Table 3. Factors and levels in response surface design.
LevelA
Ultrasonic Vibrator
(W)
B
Glycerol Volume Fraction
(%)
C
Ultrasound Time
(min)
−12405020
02706030
13007040
Table 4. Scheme and experimental results of response surface design.
Test NumberA
Ultrasonic Vibrator
(W)
B
Glycerol Volume Fraction
(%)
C
Ultrasound
Time
(min)
Extraction
Rate
(%)
1−1−102.925
21−102.869
3−1102.830
41102.872
5−10−12.862
610−12.954
7−1012.987
81012.940
90−1−12.860
1001−12.831
110−112.872
120112.915
130002.904
140002.918
150002.917
160002.929
170002.900
Table 5. Variance analysis of regression model.
Source of VarianceSum of SquareDegrees of FreedomMean SquareF Valuep Value
Model2.700 × 10−293.022 × 10−38.790.0046
A1.178 × 10−411.178 × 10−40.340.5767
B7.605 × 10−417.605 × 10−42.210.1806
C5.341 × 10−315.341 × 10−315.530.0056
AB2.401 × 10−312.401 × 10−36.980.0333
AC4.851 × 10−314.851 × 10−314.110.0071
BC1.296 × 10−311.296 × 10−33.770.0934
A27.434 × 10−417.434 × 10−42.160.1850
B21.2 × 10−211.200 × 10−234.240.0006
C23.251 × 10−413.251 × 10−40.950.3633
Residual2.407 × 10−373.439 × 10⁻⁴
Lack of fit1.862 × 10−336.207 × 10−44.550.0886
Pure error5.452 × 10−441.363 × 10⁻⁴
Sum3.000 × 10−216
p < 0.001 highly significant; 0.001 ≤ p < 0.05 moderately significant; and p ≥ 0.05 insignificant [32].
Table 6. Validation fitting results under optimal process conditions.
Extraction CyclesCGA Extraction Rate/%Average Extraction Yield/%
12.992.98
22.98
32.98
Disclaimer/Publisher’s Note: The statements, opinions and data contained in all publications are solely those of the individual author(s) and contributor(s) and not of MDPI and/or the editor(s). MDPI and/or the editor(s) disclaim responsibility for any injury to people or property resulting from any ideas, methods, instructions or products referred to in the content.