Abstract
Tectonic deformation of different intensities significantly controls shale pore structure, seepage channels, and gas content. The Longmaxi Formation shales in the southern Sichuan Basin have experienced multi-stage tectonic movements, resulting in a diverse fracture system and tectonic deformation. This study focuses on three representative tectonic morphologies: deeply buried strongly deformed (DBSD), deeply buried weakly deformed (DBWD) and shallowly buried weakly deformed (LBWD). We investigated the pore structure characteristics and heterogeneity of these shales under various tectonic conditions using total organic carbon (TOC) content, X-ray diffraction (XRD), scanning electron microscopy (SEM), a low-pressure N2/CO2 adsorption experiment (LP-N2/CO2 GA), and multi-scale fractal theory. The results reveal that strong tectonic compression and deformation conditions lead to the compression and flattening of organic pores by brittle minerals, resulting in long, oriented OM pores. Fracturing of brittle pore creates multiple internal fracture systems linked to dissolution pores, forming a complex micro-fracture–pore network. With intense tectonic deformation, mesopores tend to be compressed, increasing micropore pore volume (PV) and surface area (SA). The DBSD shale exhibits the highest micropore heterogeneity, while the LBWD shale shows the lowest heterogeneity. Fractal analysis indicates a significant decrease in micropore fractal dimension (Df) with increasing burial depth. In contrast, the surface and matrix fractal dimensions (Ds and Dm) of low-buried shale micropores and meso-macropores align vertically. Shale reservoirs in tectonically stable regions exhibit more favourable gas-bearing characteristics than strongly tectonically deformed areas. The LBWD has stable tectonic conditions that are favourable for shale gas preservation. Conversely, slip faults under deep burial conditions lead to extrusion and deformation of shale pore space, ultimately compromising the original reservoir capacity and hindering shale gas enrichment. These findings contribute significantly to our understanding of pore structure and heterogeneity in tectonically deformed shale reservoirs, providing invaluable guidance for the exploration, development, and prediction of shale gas resources.
1. Introduction
As the global economy develops and worldwide energy consumption continues to grow, unconventional oil and gas resources are changing the global energy supply model [1,2]. In the early 21st century, with the development of horizontal well fracturing and horizontal well drilling technology, hydrocarbon production in organic-rich shale formations increased rapidly in the United States, and shale oil and gas production areas such as Barnett, Marcellus, Utica, Permian, and Eagle Ford were developed [3,4,5]. Along with China’s rapid economic development, the demand for oil and gas has increased significantly, and the exploration and development of shale oil and gas have attracted significant attention [1,6,7,8,9,10]. In 2009, China’s oil import dependence reached 52%, exceeding 50% for the first time. In 2016, China’s oil dependence on foreign countries reached 65.5%. From 1993 to 2016, China’s dependence on foreign oil increased nearly 10 times [11]. The Sichuan Basin is the central production basin for shale gas exploration in China, with commercial shale gas development areas such as Weiyuan, Changning, Fuling, and Zhaotong established [2,7,10,12,13,14]. North American shale gas is mainly located in the Foreland Basin and the Craton Basin and is dominated by organic-rich marine shale with a large continuous distribution area, high vertical thickness, relatively low maturity, and oil and gas coexistence [15,16]. Different from the US shale gas system, most of the organic-rich shale formations in China have experienced multiple tectonic events after the end of hydrocarbon generation, limiting the storage and transport of shale gas [8,17,18]. In particular, the shale gas reservoirs have undergone substantial uplift and extrusion deformation, with complex tectonic features and the formation of multi-phase, multi-stage fracture systems on the margins of the Sichuan Basin [13,18]. In recent years, more and more shale gas fields have been discovered in strong tectonic zones in southern China (e.g., Fuling, Zhaotong, Luzhou, Changning). Most scholars have recognized the potential of complexly deformed shales, which has increased interest in the study of the pore structure of deformed shales [19,20,21,22,23,24,25]. Zhu et al. [24] compared the pore structure characteristics of brittle deformation shale (BDS) and ductile deformation shale (DDS), and believed that the evolution of pore structure is strongly affected by tectonic deformation, and that brittle deformation shale has more developed intergranular pores, microchannels, and microcracks. Increased connectivity. Li et al. [21] ductile deformed shale samples have more micropores than undeformed shale and brittle deformed shale samples, indicating that ductile tectonic deformation may damage larger pores due to the extrusion of complex tectonic stresses. Considering that shale gas reservoirs have complex pore structures and are heterogeneous, carrying out pore structure deformation characterization research in different complex tectonic backgrounds is crucial.
The development and evolution of shale reservoir pore structure (including pore morphology, heterogeneity, connectivity, brittleness, and wettability) is mainly influenced by material and diagenetic development, with the thermal evolution of OM being a key element affecting the micro-mesopores in shale reservoirs [10,26,27,28,29,30]. Shale is a soft and fragile material with low Young’s modulus and high Poisson’s ratio, so it is susceptible to temperature, pressure, tectonic stress, deformation environment, etc., [31,32,33,34,35,36]. Among these, the role of tectonic deformation is also crucial for modifying the pore structure of shale reservoirs [20,22,23,24,37,38]. At present, many scholars have also conducted a large number of studies to analyze the characteristics of shale reservoirs in terms of pore structure, storage capacity, transport type, adsorption, and gas content under different tectonic deformation conditions [19,20,21,22,23,24,25,37,38,39,40,41,42,43]. Liang et al. discussed the evolution of the pore-fracture structure of the Longmaxi Formation shales in a multilevel slip tectonic deformation zone on the western side of the Xuefeng Mountains in southeastern Sichuan, suggesting that shear stress can weaken the anisotropy of the shales and change the percentage of different pore types and contents [37]. Ju et al. indicated that microporosity in brittle and ductile shear of clay minerals may be the main factor affecting pore volume (PV) and surface area (SA) [20]. Zhu et al. insights into the products of internal tectonic deformation in shale slip formations and their constraints on shale gas reservoir space at the nanoscale [23]. Li et al. discussed the mechanism of coupling the structural evolution of tectonic coal chemistry and physical characteristics (such as nano-pore fractures with methane availability), revealing that tectonic stress is a crucial factor governing the structural development of organic macromolecules and pore fractures in coal rocks and methane availability [42]. During tectonic deformation, some scholars suggest that rigid particles in strongly deformed shales can mechanically resist tectonic stresses and act as a matrix framework to protect the organic matter (OM) micropores and intrapores developed in clay-OM nanocomposites, contributing to the adsorption properties of overmature shales [44]. However, in areas of high deformation, shale gas has poorly preserved conditions, and the overpressure environment or stress support mechanisms may be lost, disrupting OM pore morphology to shrink or collapse under an atmospheric pressure system [19]. Tectonic stresses can generally lead to essential modifications in OM molecules, micro- and nanoscale particles, and fracture structures, reducing structural heterogeneity and transforming reservoir properties, impacting shale gas storage and transport profoundly. However, due to the complexity of shale pore structure and the strong heterogeneity of shale reservoirs, the relationship between pore characteristics and tectonic deformation is still unclear and needs further study and discussion.
To address these challenges, we selected three representative shale gas wells (L11, N33, and L31) spanning from the Wufeng Formation to the top of the Longmaxi Formation, originating from distinct tectonic units. Well L11 originates from an extruded, weakly deformed, deep-buried backslope flank in the Luzhou area. Well N33 is situated in a shallow-buried, deep, stable tectonic zone slope in the Changning area. Additionally, we obtained 18 cores from strongly tectonically deformed, deep-buried, strike-slip fractures in the western Changning region. After conducting basic geochemical and rock mineral type testing on each sample, we performed N2 and CO2 adsorption experiments and employed scanning electron microscope (SEM) images to study the pore structure evolution under varying tectonic deformation conditions. Utilizing the Frenkel-Halsey-Hill (FHH) model and micropore filling fractal theory, we examined the micropore and meso-macropore heterogeneity in shale reservoirs under different tectonic deformation conditions. Furthermore, we discussed the interconnections between mineral composition, pore structure, and heterogeneity in diverse tectonic settings, and the role of tectonics in governing the pore system and heterogeneity. This study offers valuable insights into shale reservoir heterogeneity and its controlling factors under various tectonic deformation conditions.
2. Geological Setting
2.1. Geological and Stratigraphic Characteristics
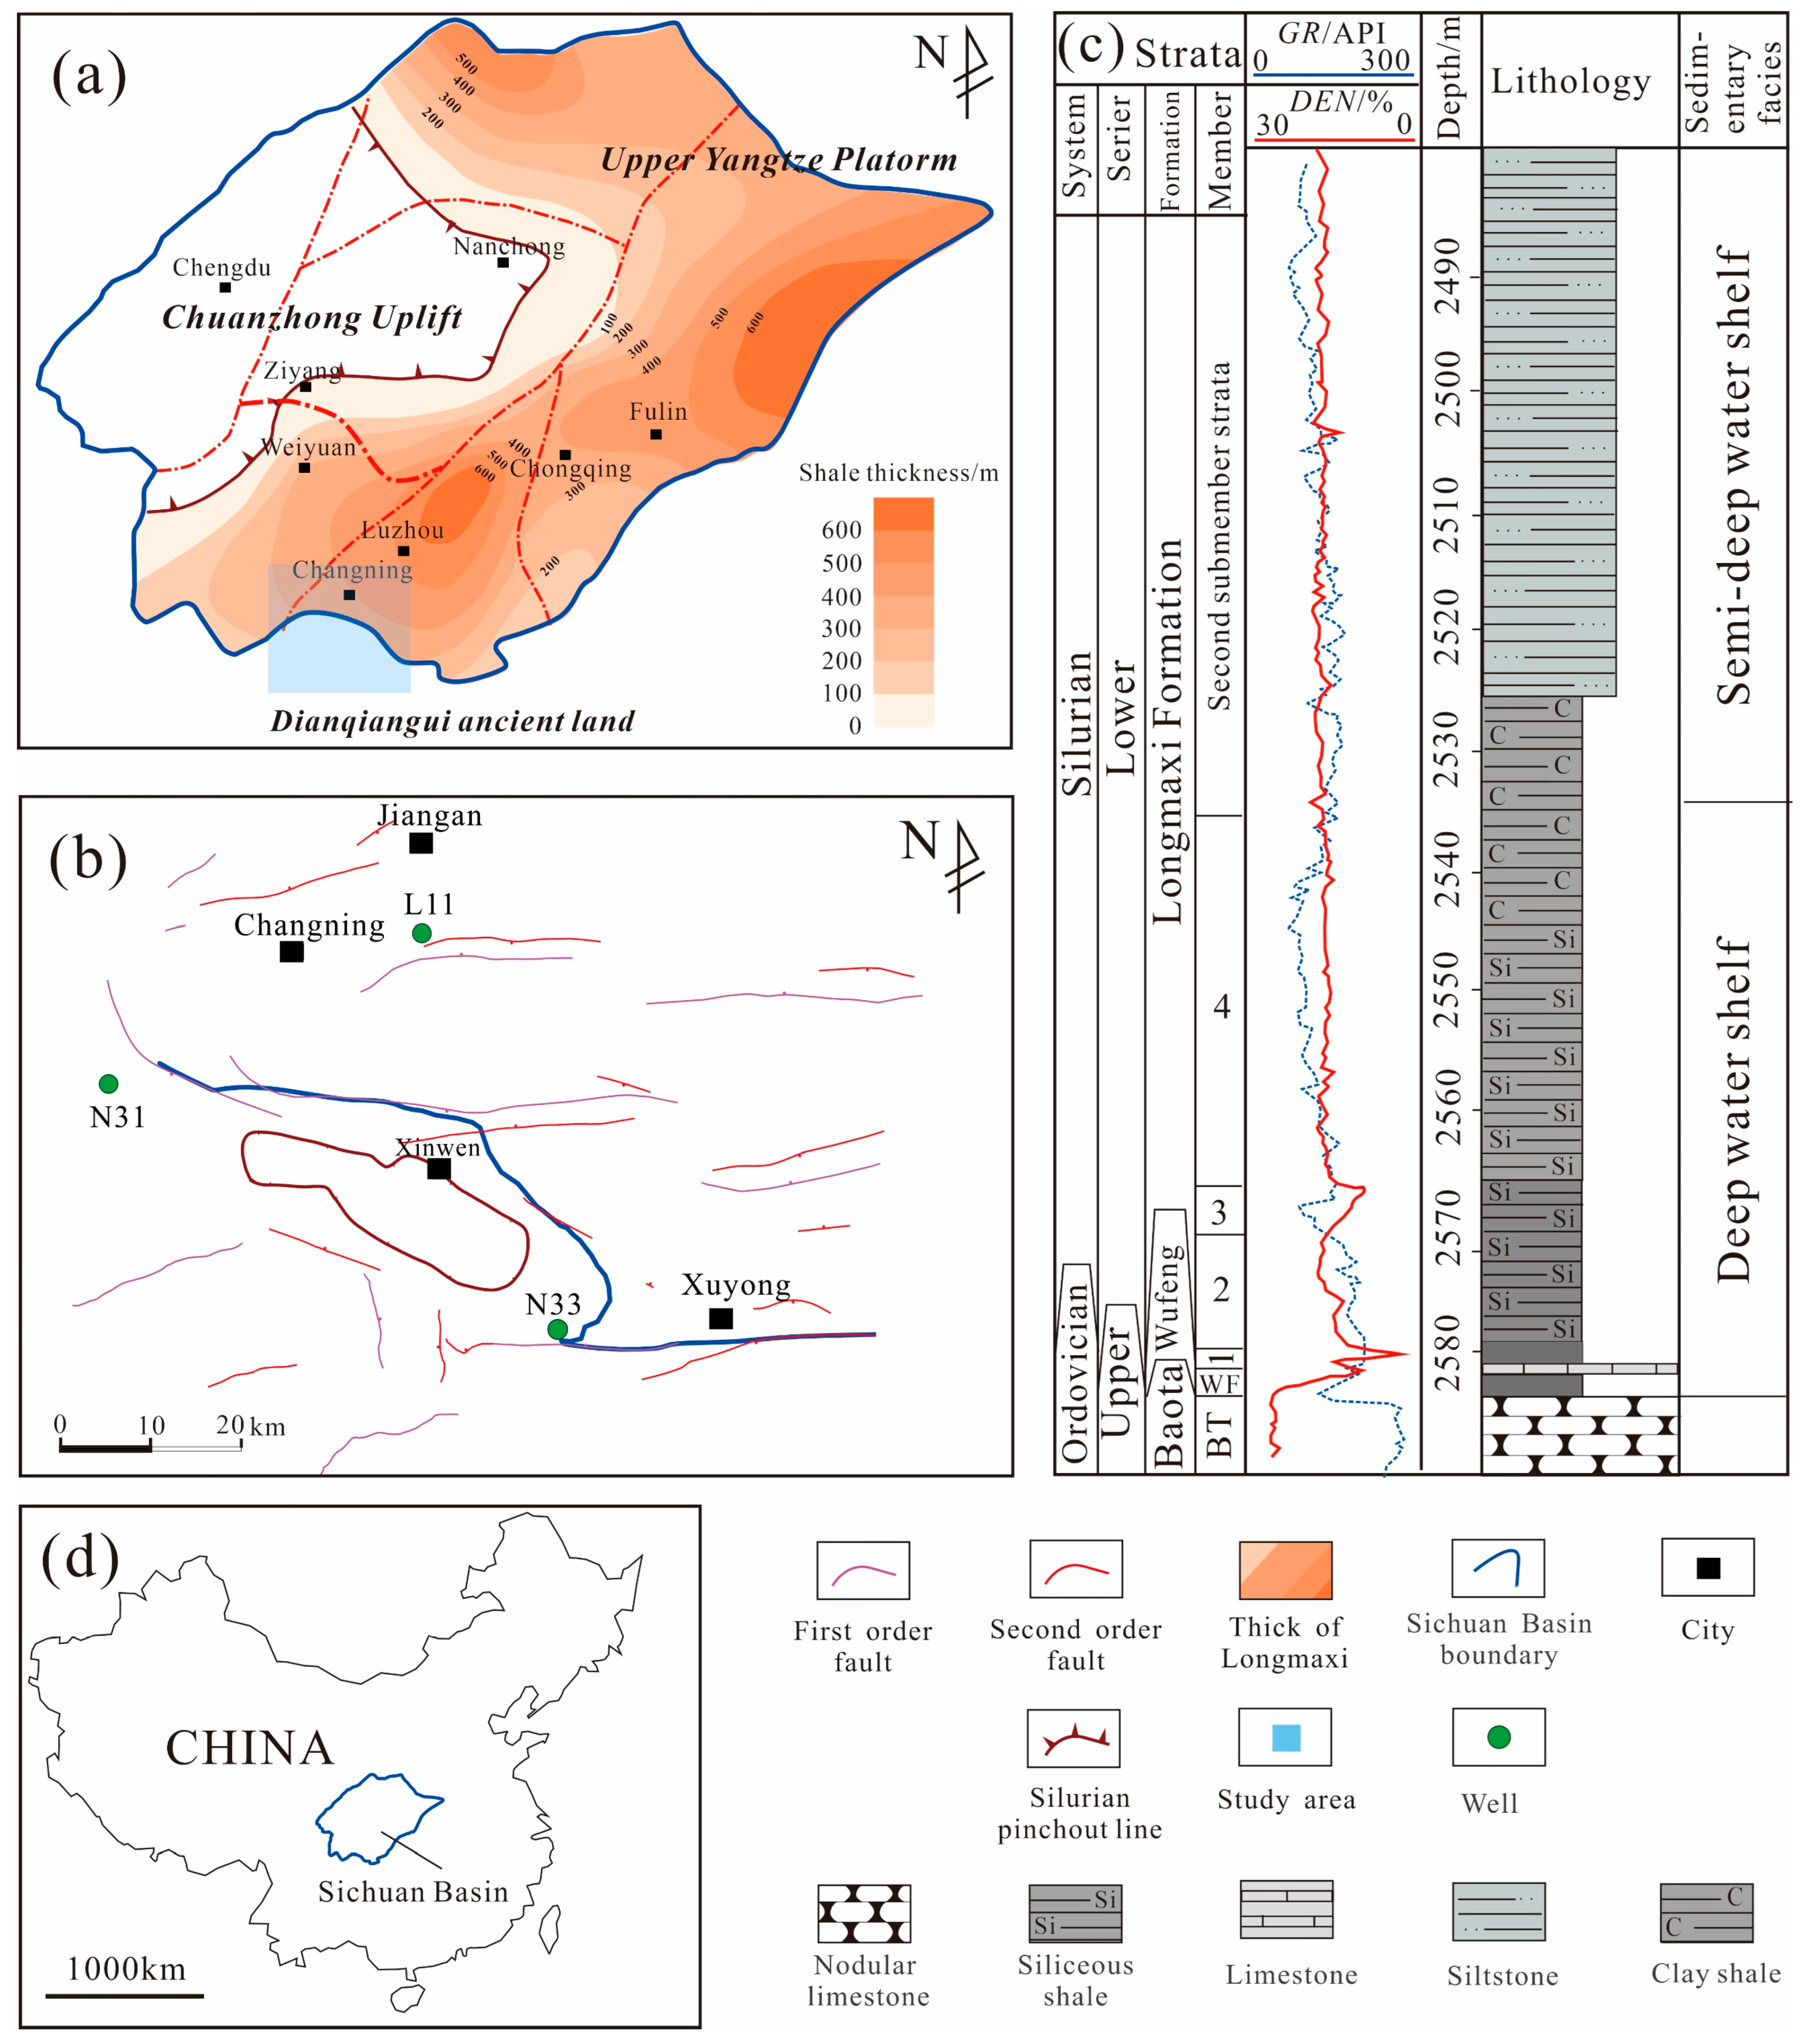
Many boundary systems control the Sichuan Basin and have an overall rhombic bounded tectonic basin (Figure 1a), whose margins are very tectonically complex, and the internal deformation of the basin is relatively weak [41]. The Changning and Luzhou areas are located in the southeastern part of the Sichuan Basin, trapped between the Huaying mountains fracture zone and the Qiyue mountains fracture zone (Figure 1b) [7]. The main gas-producing formation in southern Sichuan is the Upper Ordovician Wufeng-Lower Silurian Longmaxi Formation, with a relatively stable shale thickness of 250~350 m. The Longmaxi Formation shale quality reservoir is developed in the bottom deep water shelf sedimentary facies with a quiet, anoxic, strongly reducing deep water shelf sedimentary environment, and high total organic carbon content (TOC) content, mostly organic-rich siliceous shale lithofacies, and high shale gas content (Figure 1c) [42,43].
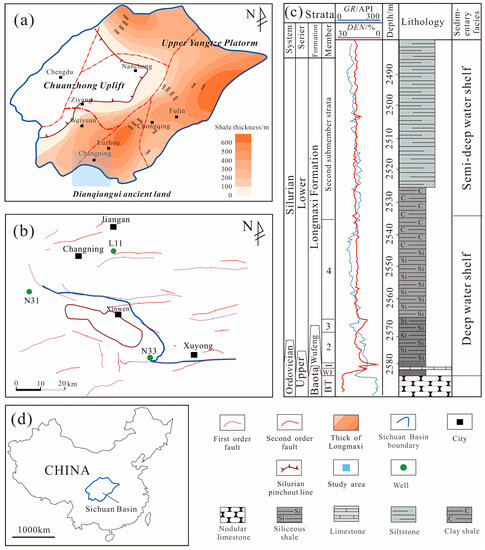
Figure 1.
(a) The study area is located in the low-steep structural zone in the southern Sichuan Basin; (b) Tectonic map of the Changning backslope area in the southern Sichuan Basin; (c) Comprehensive lithological histogram of the Longmaxi Formation; (d) Geographic location of the Sichuan Basin in the map of China.
2.2. Structural Deformation Characteristics
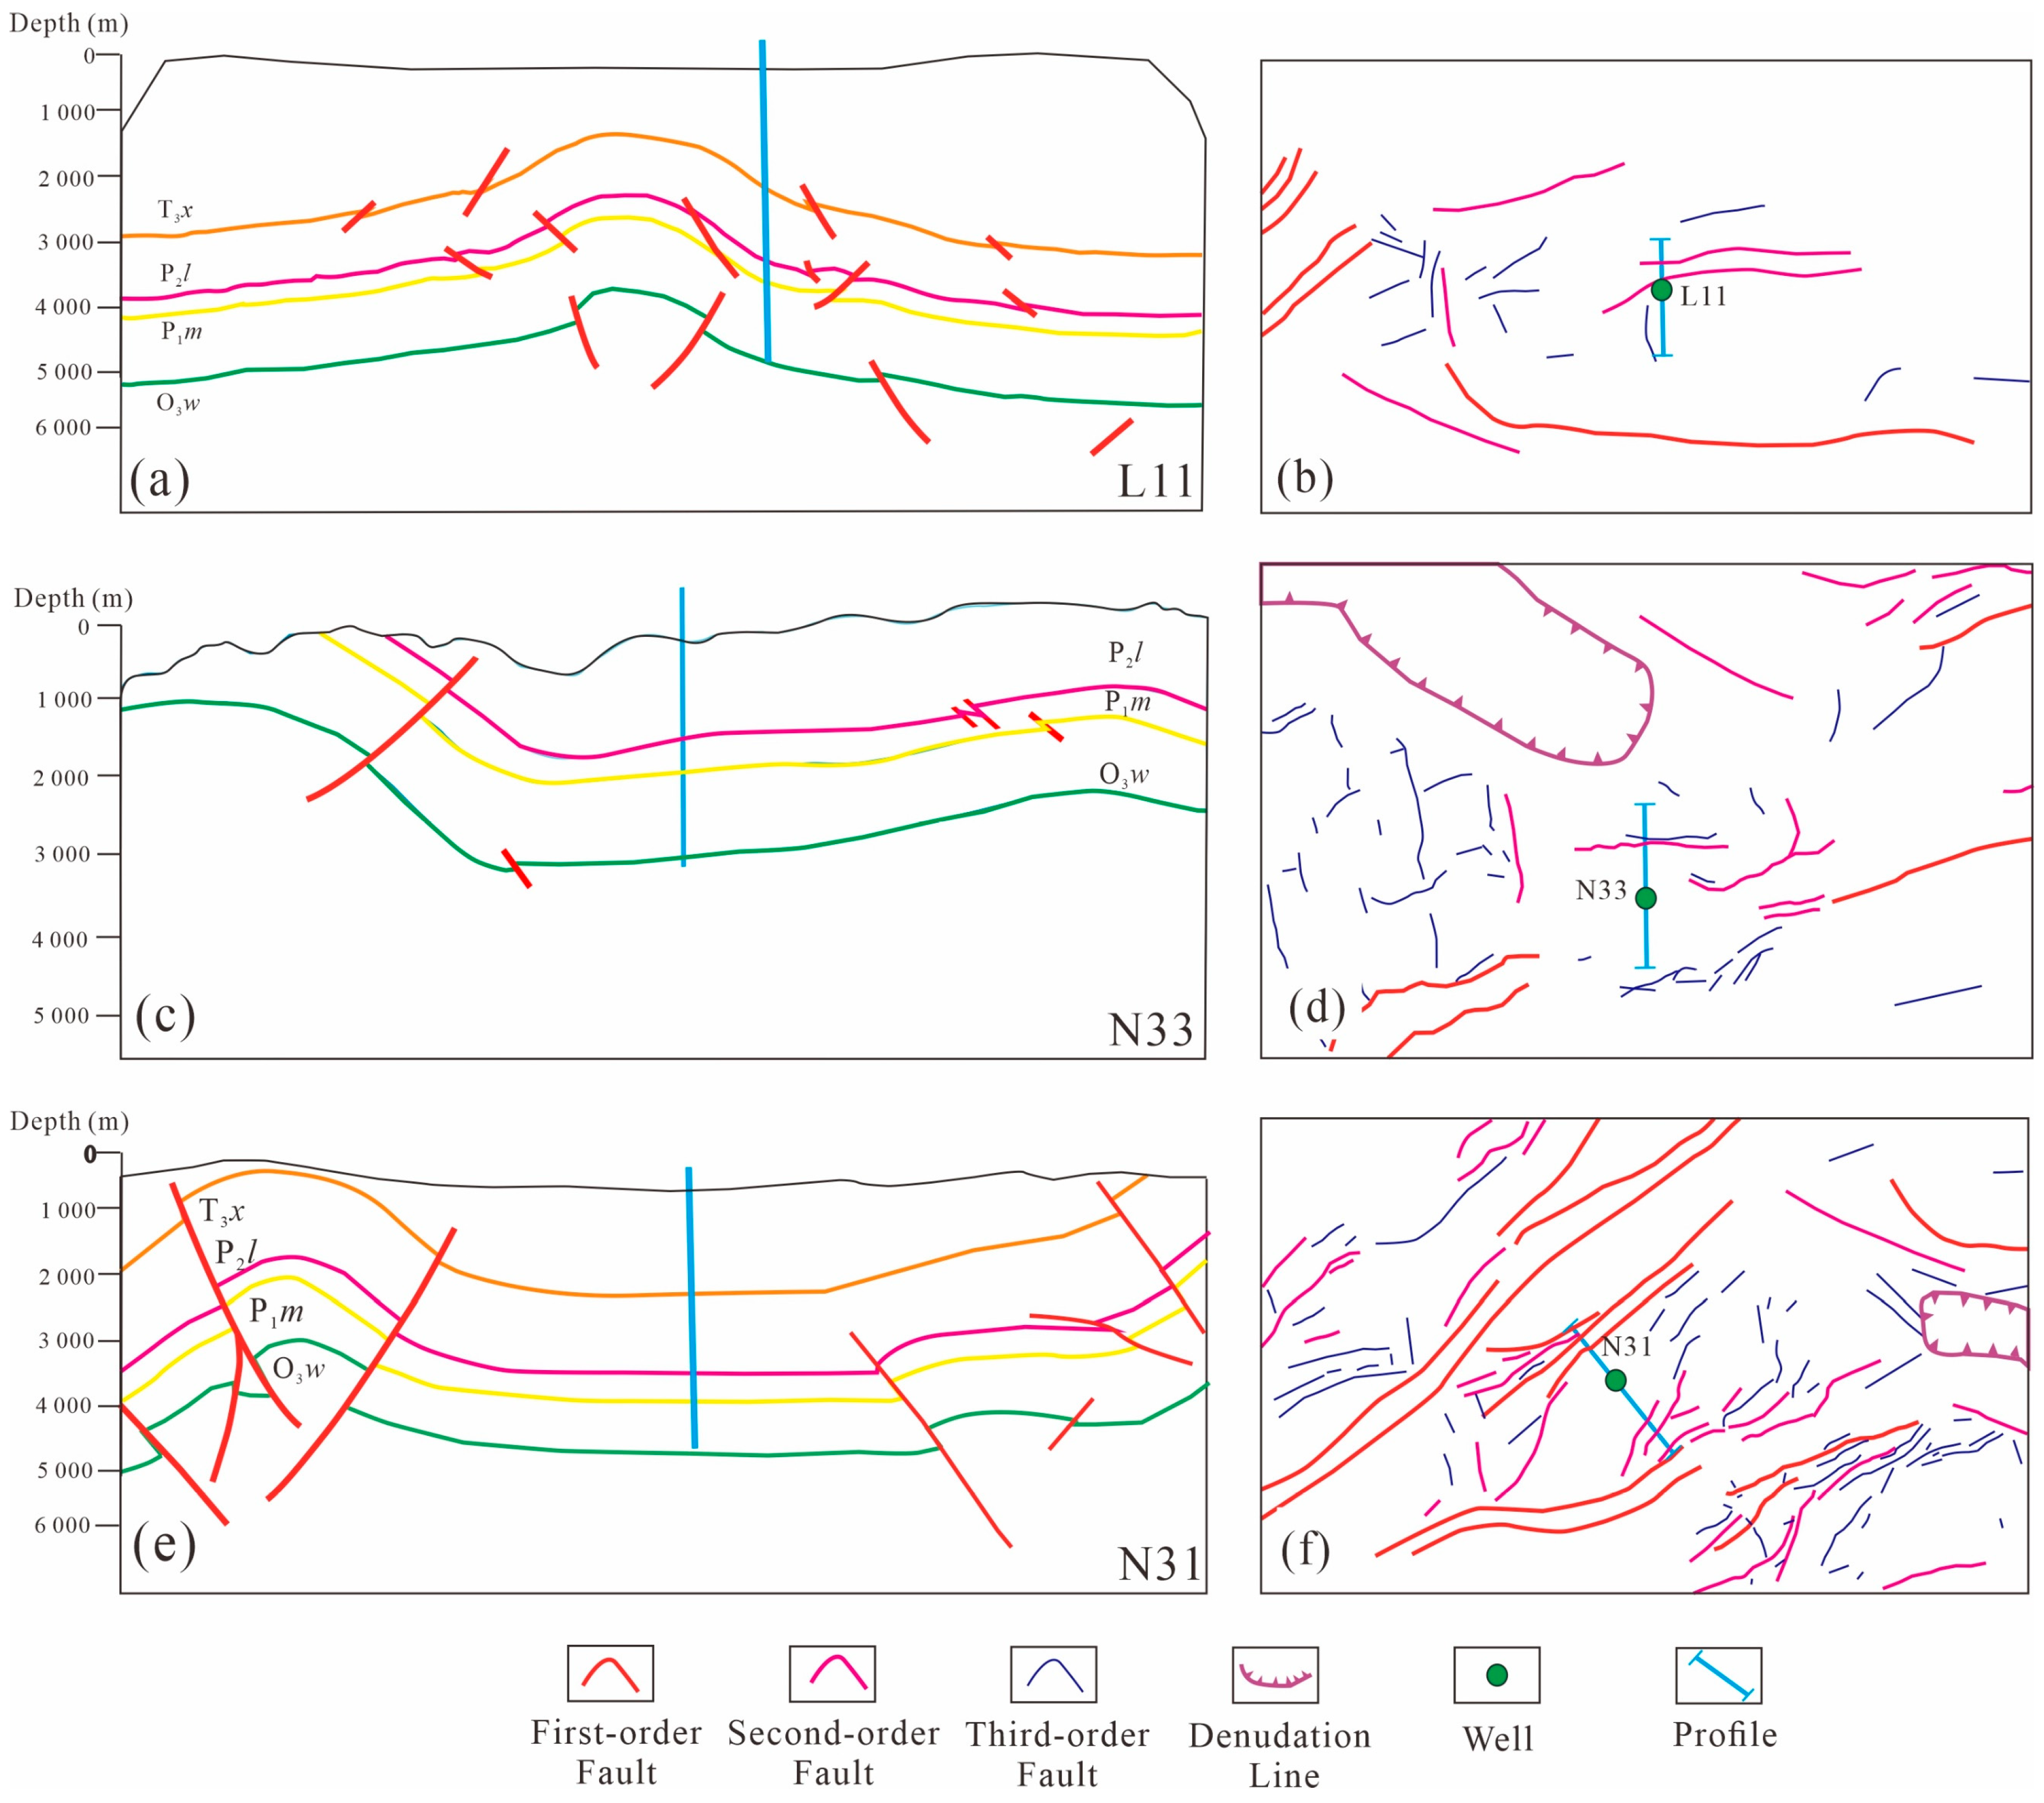
Three typical shale gas wells in the Sichuan Basin were selected for this study, each with a different regional tectonic feature (Figure 2). The L11 well was selected for the study near the core of the backslope in the southern part of the Luzhou area. The area is buried to a depth of 4500 m (Figure 2a); the site is affected by NW-oriented tectonic compression, forming a W-S-oriented secondary fracture at a distance of 1.1 km (Figure 2b).
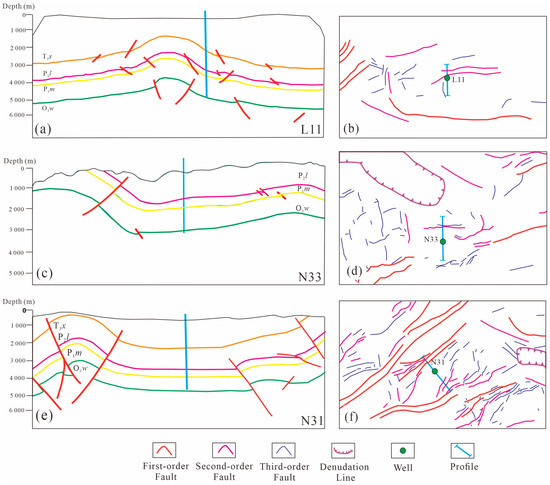
Figure 2.
(a) Seismic section interpretation of Well L11; (b) Tectonic plan of Well L11 on the Sanhekou backslope in the southern part of the Luzhou area; (c) Seismic section interpretation of Well N33; (d) Tectonic plan of Well N33 on the eastern side of the Changning area; (e) Seismic section interpretation of Well N31; (f) Tectonic plan of Well N31 in the southern part of the Sichuan Basin.
The N33 well area is relatively shallow at 3300 m and is dominated by small-scale reverse faulting and denuded Changning backslope. Most of the fractures in the area of Well N33 trend near W-E and N-S, and the Level I and Level II faults are not developed (Figure 2d). The N33 well is 2.4 km from the northern reverse fault, which is far from the fault and unaffected by it (Figure 2c). The N33 well is generally located on a gently sloping band of southward uplift with a weak degree of tectonic deformation (Figure 2c,d). The stratigraphy of the N31 well area is characterized by high southwest and low northeast paleography when the Wufeng Formation was deposited and has undergone many modifications such as the Caledonian movement, Hercynian movement, Indosinian movement, Yanshanian tectonic movement, and Himalayan movement, making the faults very well developed [39]. NNE and NE oriented retrograde faults, mostly Level I and II faults, are mainly developed in the area to the NE and SW (Figure 2e). Shale is deeply cleaved by fractures and has complex tectonic conditions (Figure 2f). It can be seen that the N33 well has more stable tectonic conditions than the N31 and L11 wells. Well L11 is in a region of weak tectonic deformation associated with deep-buried folds (DBWD). Well N31 is in an area of strong tectonic deformation associated with deep-buried fractures (DBSD). Well N33 is in a region of weak tectonic slope associated with shallowly buried deep structures (LBWD) (Figure 2a,c,d).
3. Samples and Experiments
3.1. Subsection
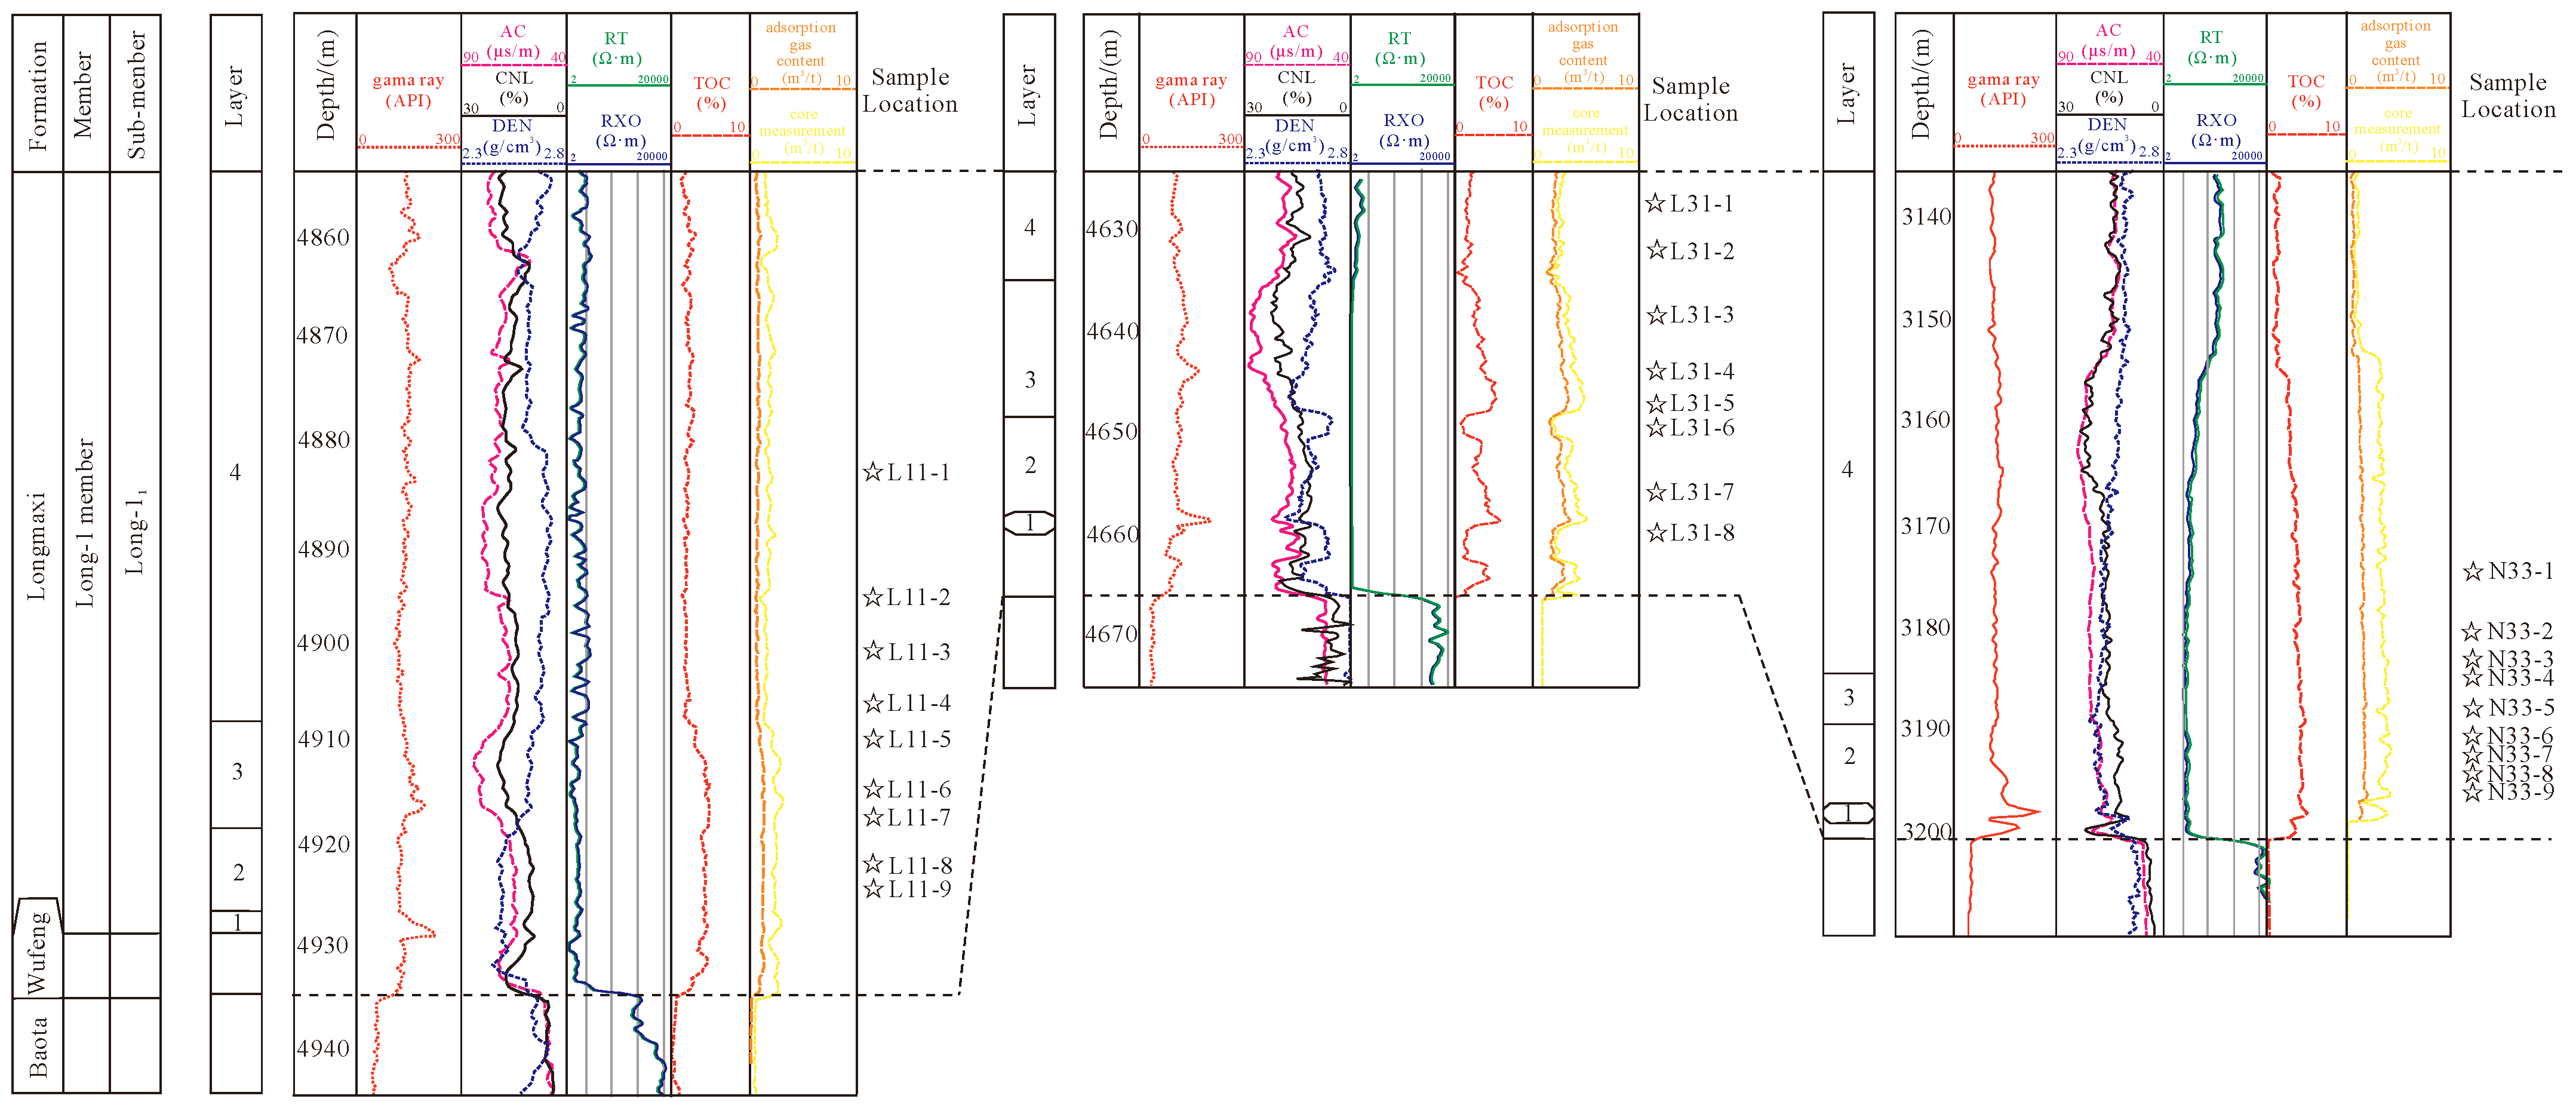
To compare the influence of tectonic movements on the heterogeneity of shale reservoirs in different tectonics, 26 shale samples from the Changning and Luzhou blocks in the southern Sichuan area were selected for this study (Figure 3). All samples were analyzed organo-geochemically and mineralogically, and selected samples were sorbed with a low-pressure N2/CO2 adsorption experiment (LP-N2/CO2GA) to determine pore structure, including porosity, pore size distribution (PSD), SA, and PV. Well L11 was sampled between 4884 and 4923 m, Well N33 was sampled between 3176 and 3195 m, and Well N31 was sampled between 4628 and 4662 m.
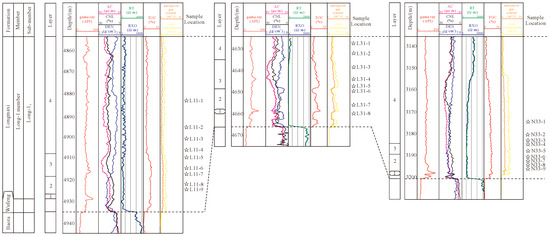
Figure 3.
Single well logging map and sampling locations for Wells L11, N33, and N31.
3.2. Experiments and Methods
3.2.1. Geochemical and Petrologic Analysis
The mineralogical composition and TOC analyses were conducted at the State Key Laboratory of Petroleum Resources and Exploration, China University of Petroleum, Beijing. Mineralogical composition determined by a D/max-2600 X-ray diffraction (XRD) instrument at 24 °C and 35% humidity. In this measurement, Cu Ka radiation with a voltage of 40 kV and a current of 30 mA was performed. The experimental procedures followed the Chinese oil and gas industry standard SY/T5463-2010.
All samples were crushed to a particle size of less than 100 μm according to the Chinese oil and gas industry standard (GB/T) 191452003. Each sample (approx. 10–20 g) was treated with an excess of hydrochloric acid (1:9 HCl: water) at 60 °C ± 5 °C to remove the carbonate. The samples were dried at 105 ± 2 °C for 2 h using an oven at room temperature. Finally, an LECOCS-200 carbon-sulfur analyzer was used in the experiment. Considering the lack of vitrinite in the Paleozoic marine shale, the laser Raman experiment was used to calculate the laser Raman maturity using parameters such as peak distance and intensity ratio of the D and G peaks [44]. Previous studies used multiple Raman parameters to calculate the equivalent vitrinite reflectance. This method can effectively solve the widespread VRo suppression problem in marine shale [45].
3.2.2. FE-SEM Analysis
The high-resolution FE-SEM allows visualization of the type of pore structure on the shale surface, observation of nanoscale pores, and acquisition of detailed images of the pore structure. In this study, the pore structure of shale samples was characterized using a Merlin high-resolution FE-SEM. The core samples were first cut into 1 cm × 1 cm slices, and then the shale surface was mechanically smoothed using a Leica EM TXP automatic target surface processing machine. Following this, the samples were polished using an Ar ion polisher and then sprayed with a skinny layer of carbon to increase the electrical conductivity of the shale surface. After preparation, the samples were observed for micrpore morphology and structural features using a Zeiss SIGMA scanning electron microscope.
3.2.3. LP-N2/CO2 GA
Quantitative characterization of shale nanoscale pores by low-pressure gas isothermal adsorption experiments using CO2 and N2 as adsorbents. All samples were crushed to a powder size of less than 60 mesh and all powders were degassed at 110 °C for 8 h to remove any moisture and volatiles. The degassed samples were placed in a Micromeritics ASAP 2460 instrument, and the isothermal adsorption curves were obtained by LP-N2GA and desorption experiments at 77.4 K. Density Functional Theory (DFT) and Brunauer-Emmett-Teller (BET) methods were used to determine the PV and SA distribution for mesopores to macropores, respectively, in the relative pressure(P/P0) range of 0.06–0.99 [45,46,47]. The pore structure characteristics of the samples, including PSD, SA, and PV, were calculated. The principle and procedure of low-temperature CO2 adsorption testing are similar to nitrogen adsorption. Based on the capillary condensation theory, the CO2 gas adsorption experiment is mainly used to determine the micropore PSD of shale [48]. CO2 adsorption was measured at different P/P0 from 0 to 0.03. The DFT can calculate the PSD of PV and SA [47,49].
3.3. Fractal Theory from CO2 and N2
3.3.1. Fractal Theory of LP-N2 GA
FHH theory is based on a positive proportional relationship between the volume of adsorbate covering the surface area and the fractal dimension of the pores materials [50]. FHH assumes capillary condensation adsorption theory for the presence in pore materials [30,51]. Based on this assumption, the FHH model calculates the relative pressure and the volume of adsorbed gas [30,35,50,51]. The FHH equation can be expressed in logarithmic form, and the specific expression is calculated as:
where V is the nitrogen adsorption volume, represent the monolayer adsorption volume, is the saturated vapor pressure, and A and C are fitting coefficients [52]. The FHH fractal dimension is A + 3. The is between 0 and 0.45, the surface fractal dimension (Ds) is calculated. When the is between 0.45 and 1, the matrix fractal dimension (Dm) is calculated.
3.3.2. Fractal Theory of LP-CO2 GA
Fractal dimension from low-temperature N2 adsorption is currently the most common method for pore structure heterogeneity studies. However, due to the limitations of measurement accuracy and gas adsorption mechanism, the mesopore range is the most applicable and reliable, while the heterogeneity of the micropore cannot be accurately characterized. This study focuses on the micropore filling theory to calculate the fractal dimension, which can be found in Xiong et al. [53]. Previous studies have shown that adsorbent molecules are usually filled with micropores, and the PSD of micropores is the core factor affecting the heterogeneity of micropore-activated carbon. A micropore fractal model based on the PSD function J(x) and the pore diameter was proposed [54]:
where x represents the pore size in nm; J(x) is the PSD function for heterogeneity solid micropores, which can be obtained from the Dubinin-Astakhov (DA) equation and the Jaroniec-Choma (J-C) equation, whose expressions are [53]:
where Γ is the gamma function, whose expression is:
where ρ represents the scale parameter of the gamma distribution, kJ·mol−1; z is a function of the characteristic energy in the DA equation; and v is shape parameters, dimensionless; the following micropore adsorption equation can obtain ρ and v [46,47]:
where θ represents the micropore filling; V represents the adsorption volume at equilibrium pressure P, cm3/g; V0 represents the total adsorption volume, cm3/g; β is the affinity coefficient, which is 0.38 for CO2; and A represents the adsorption potential, kJ·mol−1, and is expressed as [46]:
where R represents the molar constant of the gas with a value of 8.314 J·mol−1·K−1; T represents the absolute temperature, K; and z in Equation (5) is a function of the characteristic energy in the DA equation, and this parameter is related to the pore diameter x. Stoeckli et al. found the following relationship between z and the pore diameter x [48]:
In summary, the steps to calculate the fractal dimension of the micropore using CO2 adsorption data are as follows: firstly, the adsorption data are obtained from the CO2 adsorption data and DR equation; secondly, the parameters ρ and v are obtained by the non-linear fitting; z is calculated using the micropore PSD data, and the function J(x) is obtained using Equation (3); finally, ln x and ln J(x) are fitted using Equation (2) to obtain the slope of the double logarithmic curve, and the fractal dimension of the Df is further obtained [49].
4. Results
4.1. Geochemical Characteristics, Mineralogical Compositions, and Lithofacies
Based on XRD whole-rock mineral composition analysis, the mineral species contained in the shales of the Wufeng-Longmaxi Formation in the Changning-Luzhou block are generally consistent (Table 1). All include quartz, feldspar, calcite, dolomite, pyrite, and clay minerals, with quartz and clay minerals dominating. The quartz content of the Longmaxi Formation samples from Wells L11, N33, and N31 ranged from 29.1% to 47.2%, 40% to 67%, and 30.3% to 73.9%, averaging 39.63%, 52.11%, and 46.63%, respectively. The clay mineral content ranged from 17% to 45.8% (averaging 28.31%), 10% to 23% (averaging 16.89%), and 4.6% to 43.8% (averaging 22.85%).

Table 1.
Lithofacies, TOC, and mineralogical compositions of Longmaxi Formation shale in the southern Sichuan Basin.
In addition, the carbonate mineral content of the samples (calcite and dolomite) differed slightly, averaging 20.42%, 23.78%, and 21.75%; the pyrite content of all samples was below 10%. To better analyze the characteristics of the different samples, the previous three-stage element method was used for the lithofacies classification of the reservoir (Figure 4) [50,51]. The results show differences in lithofacies in Wells L11, N33, and N31. The selected samples from Well N33 are mainly S-1 and S-2 lithofacies, while the lithofacies from Well L11 are mostly M-1 and M-2, while the lithofacies from Well N31 are more scattered, mainly siliceous and mixed lithofacies. The average TOC of Wells L11, N33, and N31 were 3.35%, 4.19%, and 4.43%, respectively. The TOC distribution was more stable in Well N33, while Wells L11 and N31 showed a greater variation of TOC content in the vertical direction. The TOC content is 1.5% at the top and can reach more than 4% at the bottom of the Longmaxi Formation, suggesting that the depositional environment is highly variable.
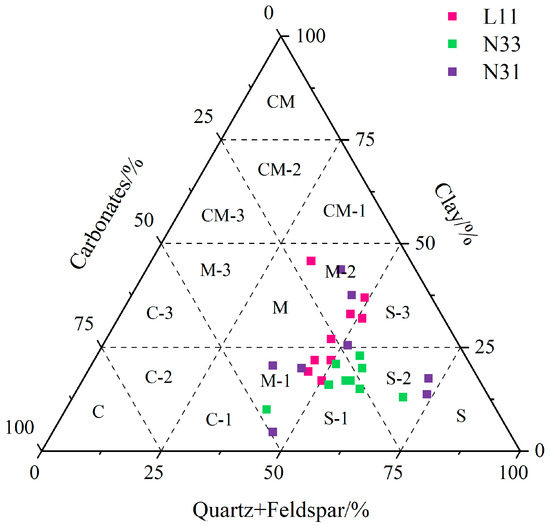
Figure 4.
Ternary diagram of Well L11, Well N31, and Well N31 of Longmaxi shale mineralogy. (S: Siliceous shale lithofacies; S-1: Carbonate-rich siliceous shale lithofacies; S-2: Mixed siliceous shale lithofacies; S-3: Clay-rich siliceous shale lithofacies; M: Mixed-shale lithofacies; M-1: Calcareous/siliceous mixed-shale lithofacies; M-2: Argillaceous/siliceous mixed-shale lithofacies; M-3: Argillaceous/calcareous mixed-shale lithofacies; CM: Argillaceous shale lithofacies; CM-1: Silica-rich argillaceous shale lithofacies; CM-2: Mixed argillaceous shale lithofacies; CM-3: Carbonate-rich argillaceous shale lithofacies).
4.2. Core Fractures
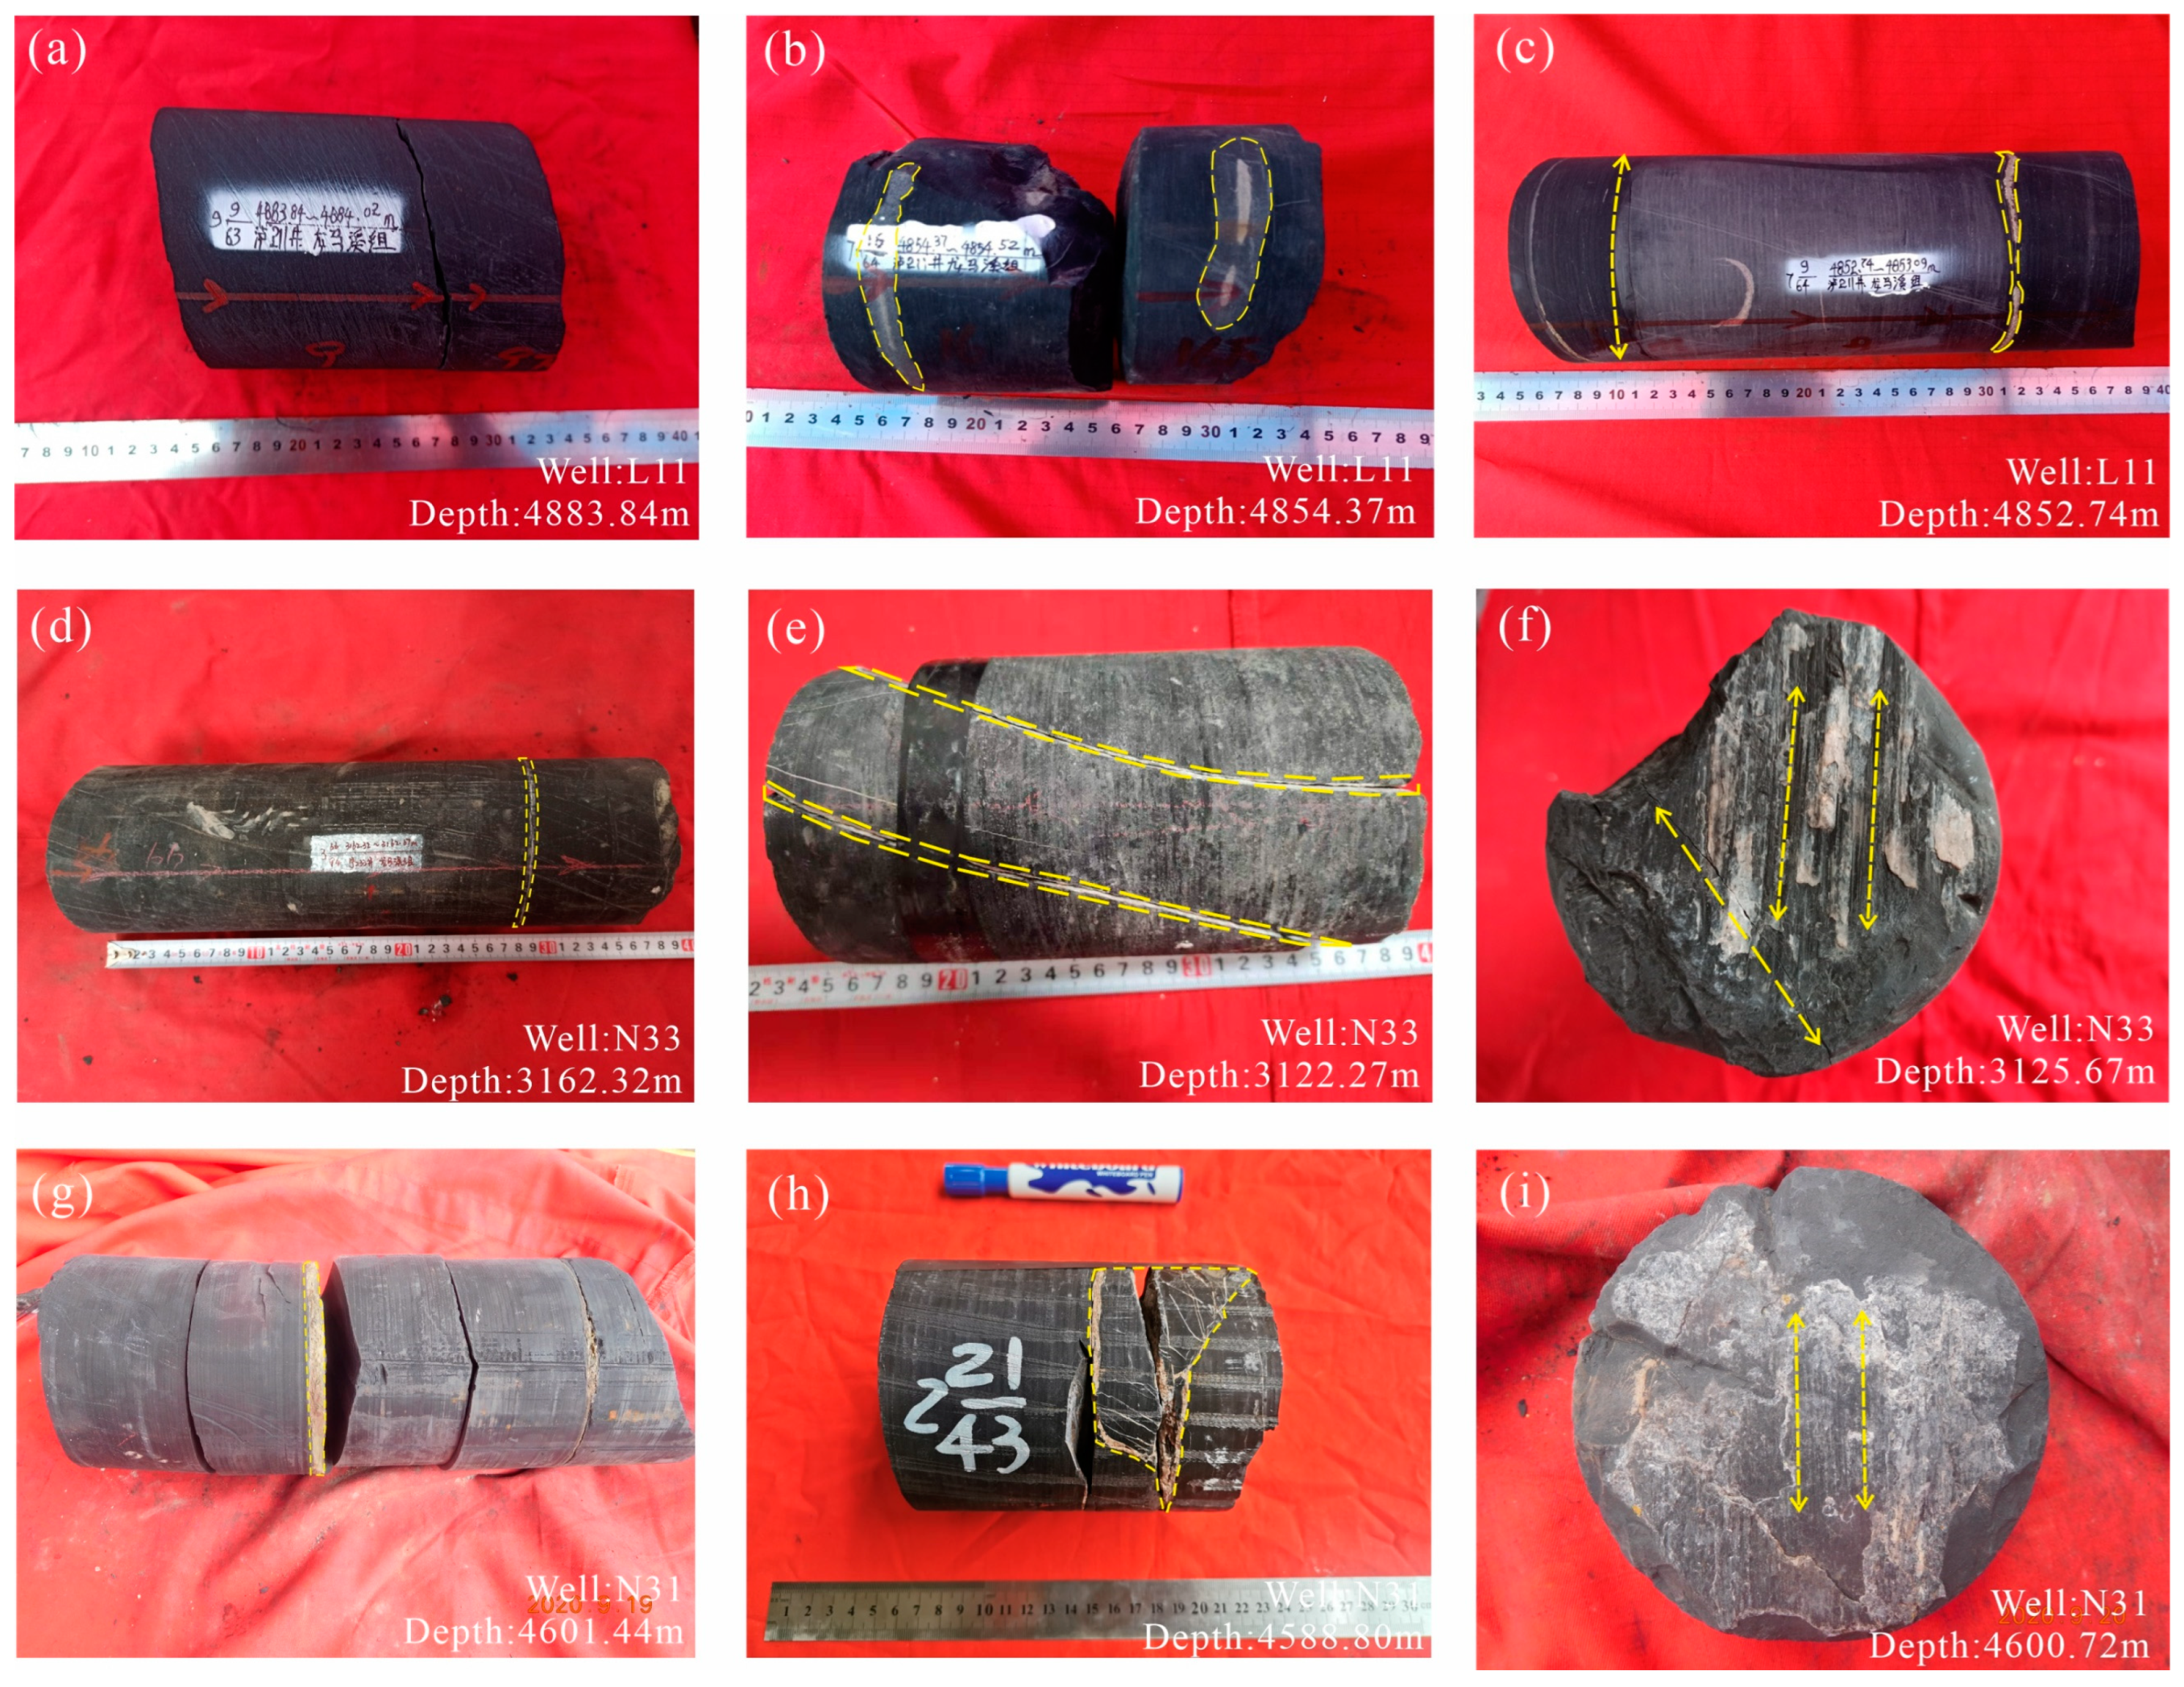
Based on the description of the shale cores in the study area, non-tectonic and tectonic fractures are mainly developed within the Longmaxi Formation shales in the three tectonic units. Tectonic cracks include slip, tension, and shear cracks; non-structural cracks are mainly laminated and interlaminar cracks [21,22,39,52]. Non-tectonic fractures are widespread within the laminated shale, mostly filled with calcite and pyrite, and parallel to the laminae of the shale. For the L11 well, it is characterized by a large depth of burial (over 4600 m), few macro-tectonic fractures, and low porosity due to its location in the backsloping core and the presence of calcite lenticular bodies at the top of the Longmaxi Formation (Figure 5a,b). Some pyrite inclusions are less than 1 cm thick (Figure 5c). Well N33 is on a tectonic slope with a shallow burial depth (3300 m), and the tectonic compressional stresses are not intense (Figure 5d). Highly angular tectonic fractures formed by shear action can be seen in the lithology, which is less open and extends over a longer distance and mainly fills with calcite and quartz veins internally (Figure 5e). At the fracture surface, calcite veins are attached to the shale surface, which fills the fractures at the surface and then slides to create an irregular surface pattern (Figure 5f). Well N31 is controlled by NW extrusion, developing slip and reverse faulting, forming laminated pyrite features and rough fracture surfaces (Figure 5g,i). At the same time, due to the development of strike-slip fractures in the area, there are often some downward concave secondary faults, forming flower-like formations (Figure 5h). A complex network of fractures formed by shearing and sliding tectonic activity can be seen in the shale cores (Figure 5i).
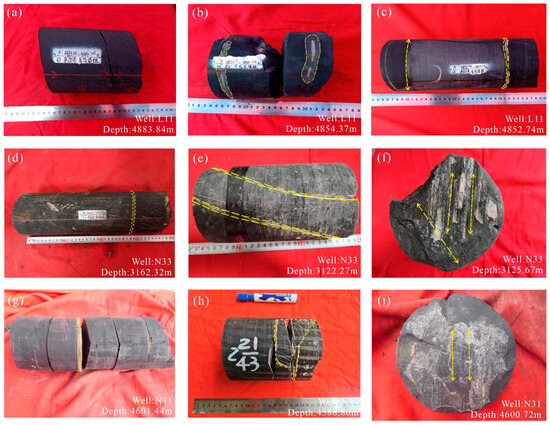
Figure 5.
Photographs of fractures and pyrite stripes in shale core samples from three wells. (a) Macro-tectonic fractures, Well: L11, Depth: 4883.84 m; (b) Calcite lenticular bodies, Well: L11, Depth: 4854.37 m; (c) Pyrite inclusions, Well: L11, Depth: 4852.74 m; (d) Horizontal fracture, Well: N33, Depth: 3162.32 m; (e) Highly angular tectonic fractures, Well: N33, Depth: 3122.27 m; (f) Calcite veins adhering to the surface, Well: N33, Depth: 3125.67 m; (g) Pyrite interlayer, Well: N31, Depth: 4601.44 m; (h) Netted cracks, Well: N31, Depth: 4588.80 m; (i) Mirror scratches, Well: N31, Depth: 4600.72 m.
4.3. Quantitative Analyses of Pore Structure
4.3.1. CO2 Adsorption for Micropore Structure
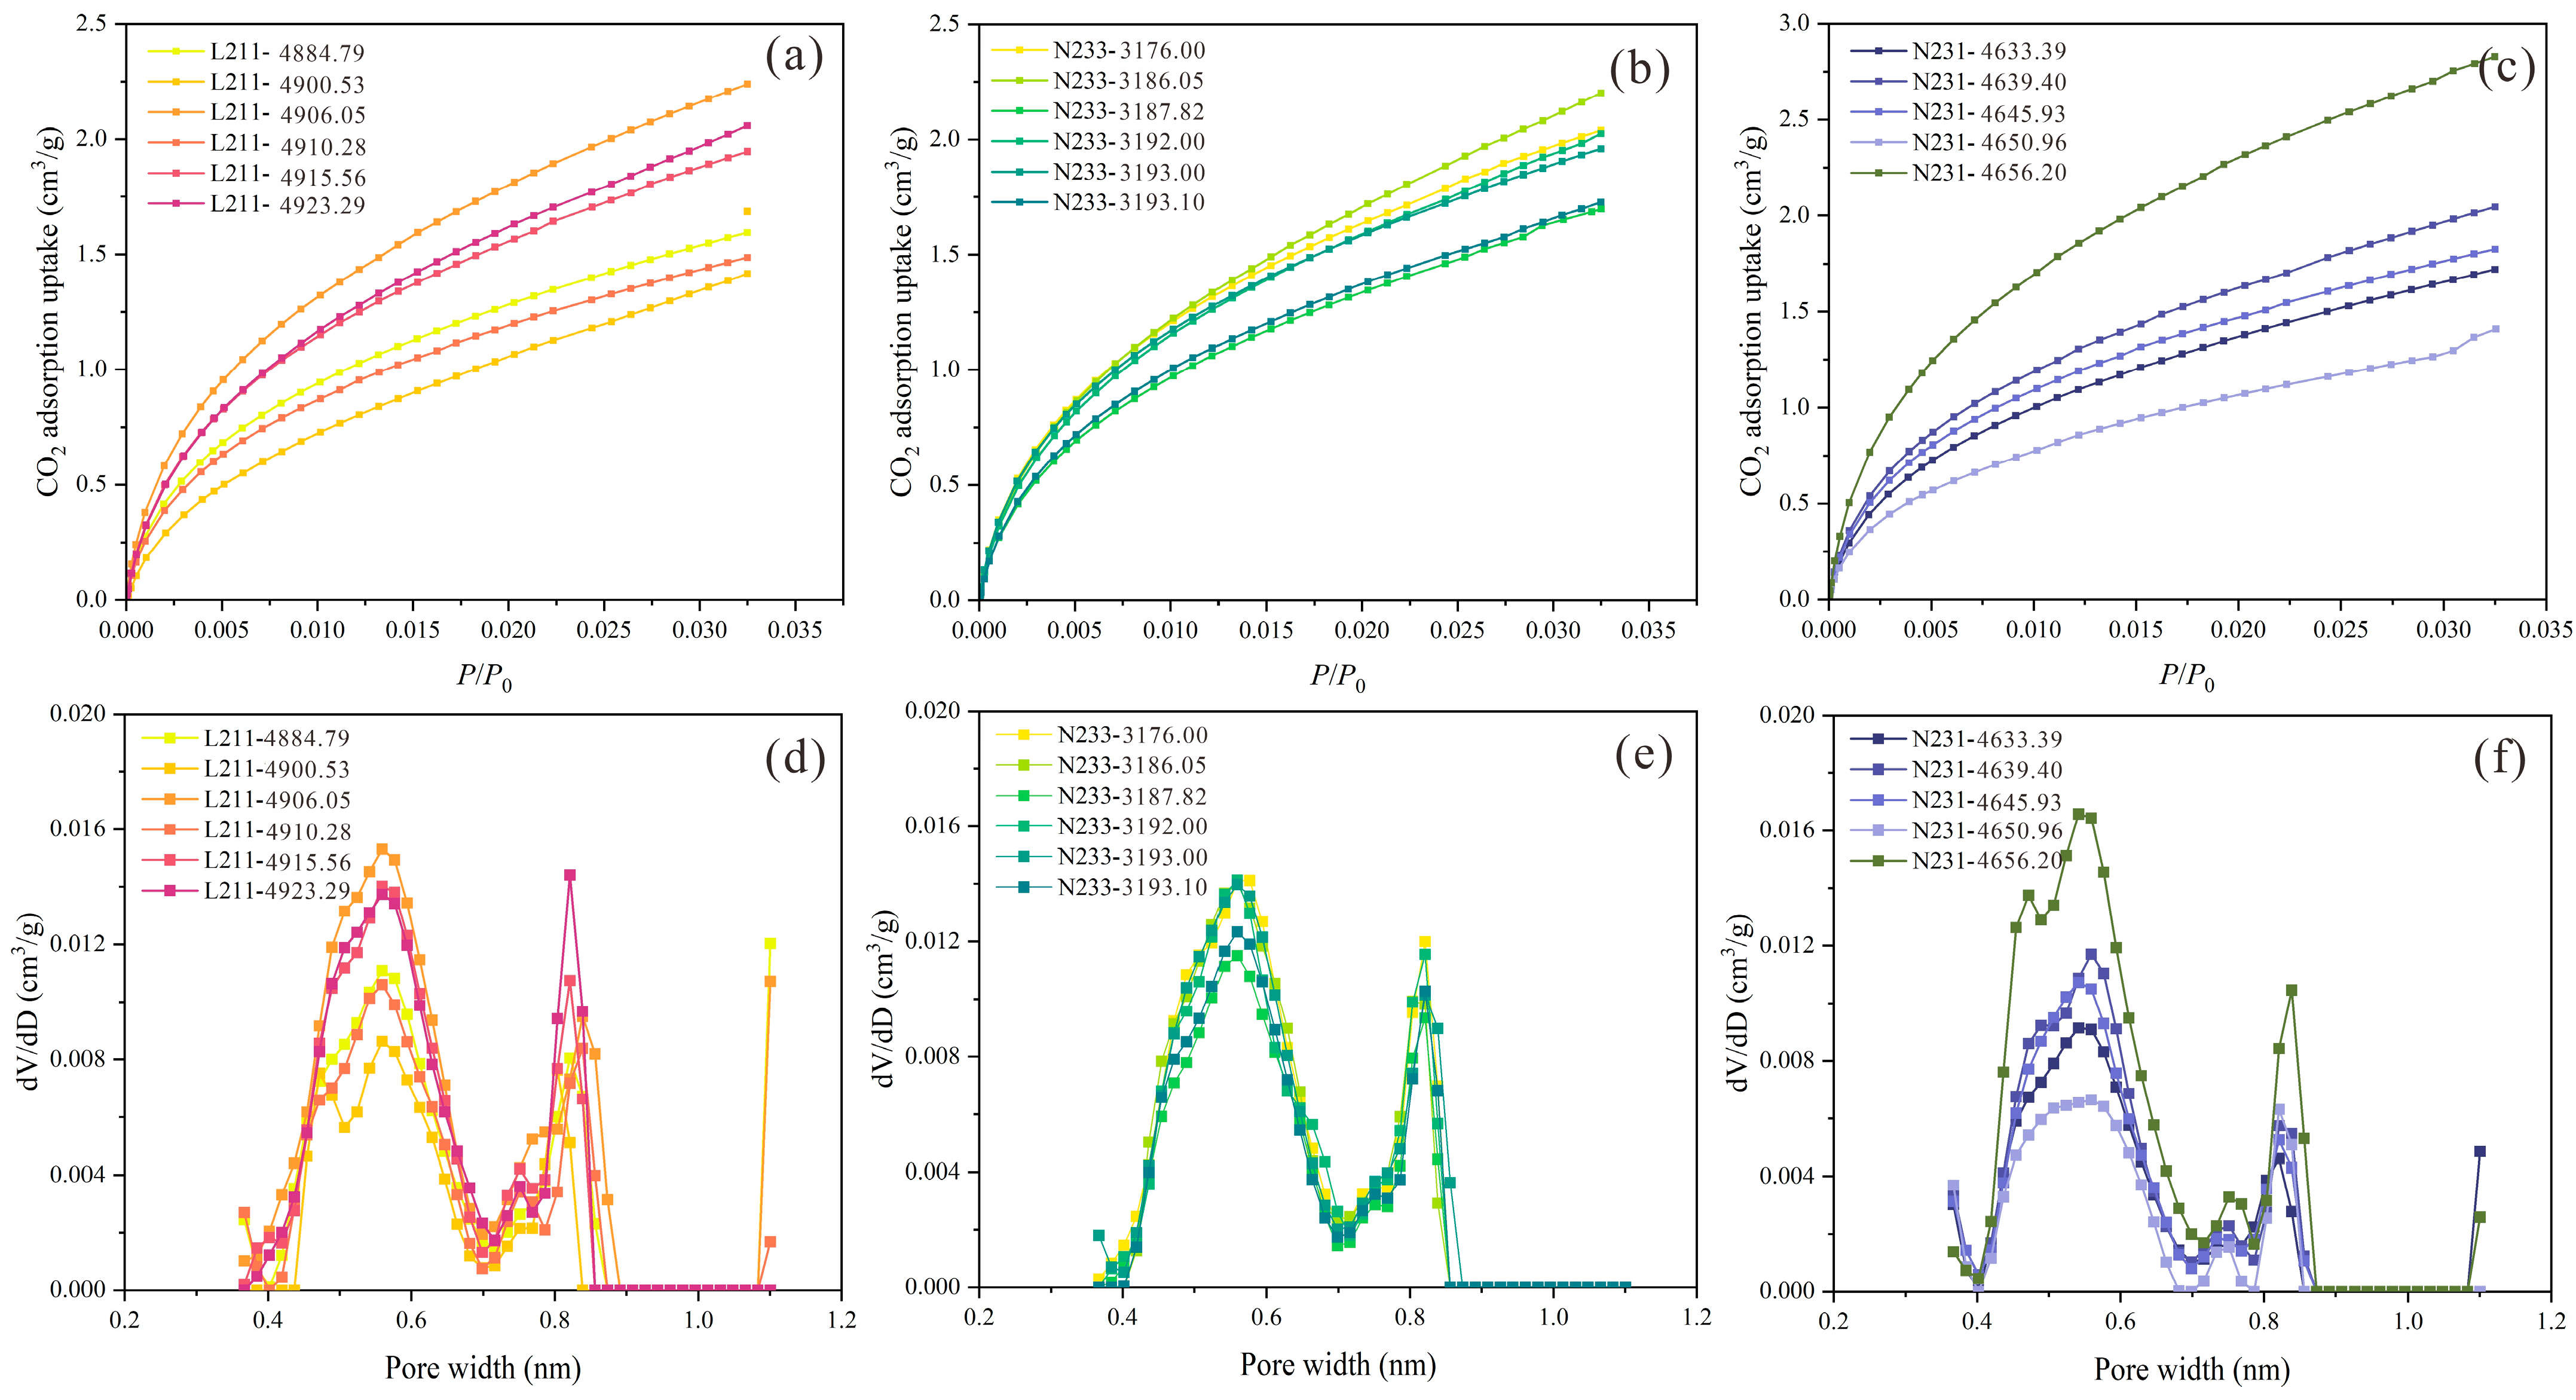
Seventeen shale core samples from different tectonic units of the Longmaxi Formation were selected for CO2 adsorption experiments. Figure 6a–c shows that the CO2 adsorption isotherms for each sample show a similar shape and are of type 1 [53], indicating the emergence of micropore materials with relatively P/P0 [54]. A slow increase in adsorption in the test pressure range (0 < P/P0 < 0.035) (Figure 6). Table 2 summarizes the pore structure parameters of the LP-CO2GA tested with the DFT model. The results show that the pore structure of the micropores within the different tectonic units varies considerably. To avoid the influence of samples in different formations, this study compared the pore structure characteristics with the same small layers under different tectonic units. The results show that Well N31 has the highest average PV (0.0025 cm3/g) and SA (15.3826 m2/g) and Well L11 has the lowest average PV (0.0022 cm3/g) and SA (14.0428 m2/g). Well N33 has a moderate micropore PV (0.0021 to 0.0026 cm3/g, average 0.0023 cm3/g) and micropore SA (13.384 to 17.401 m2/g, average 15.217 m2/g). The results show that tectonic movements control the micropores within the different tectonic regions and the micropores are more developed in weak tectonic deformation.
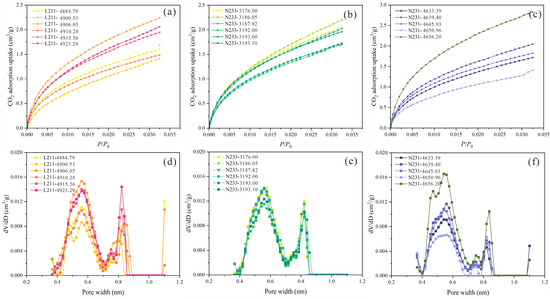
Figure 6.
CO2 adsorption curves and PV distribution characteristics of three wells (L11, N33, and N31). (a) DBWD for CO2 adsorption; (b) LBWD for CO2 adsorption; (c) DBSD for CO2 adsorption; (d) DBWD for dV/dD micropore volume; (e) LBWD for dV/dD micropore volume; (f) DBSD for dV/dD micropore volume.
Table 2.
PV, SA, and pore size results of the shale samples.
Micropore size distribution was calculated from CO2 adsorption data using the DFT model. Figure 6d–f shows the micropore volume distribution within the different Longmaxi Formation. The results show consistency in the micropore size distribution within the different tectonic units, showing a bimodal morphology. All samples show high values at 0.5–0.6 nm and 0.8–0.85 nm, revealing the complex micropore structure in the Longmaxi Formation. Within the same tectonic background, the rate of micropore PV varies, has higher burial, and a higher rate of micropore PV. Considering that the vertical TOC content increases with depth, this may influence the large number of micropores contained within the TOC [27].
4.3.2. N2 Adsorption for Micropore Structure
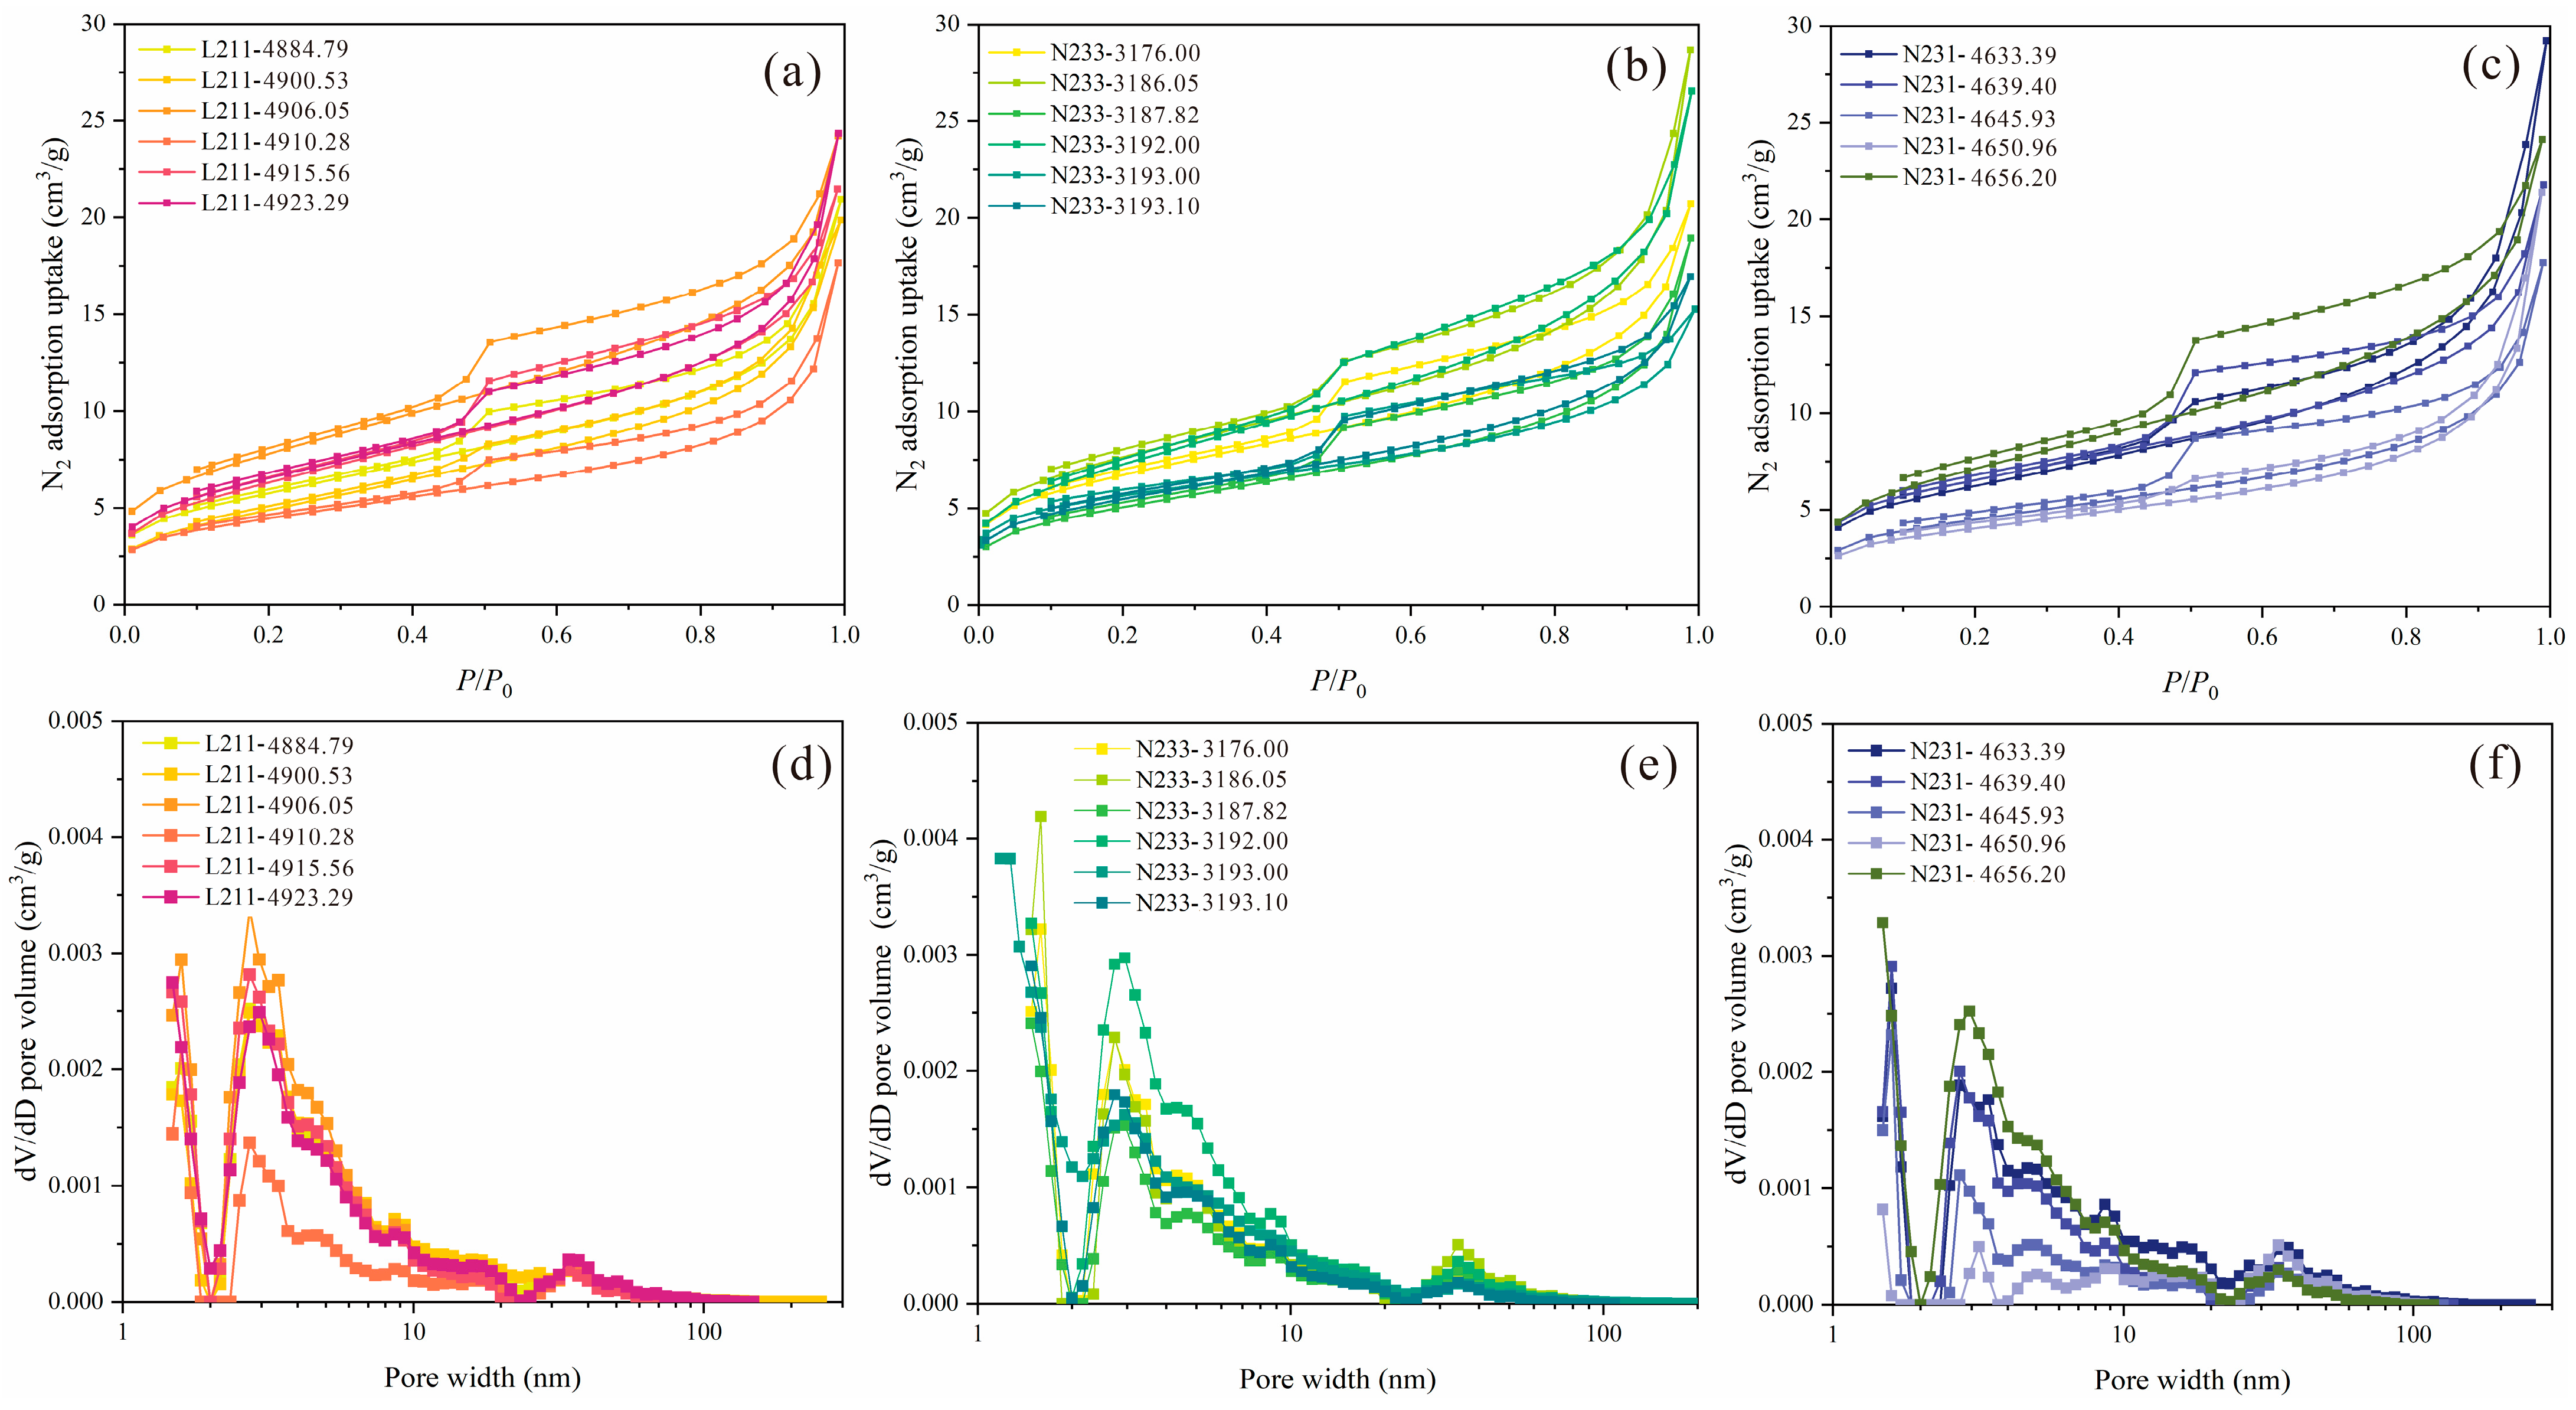
N2 adsorption tests were carried out on 17 shale core samples from different tectonic regions of the Longmaxi Formation, and the results showed that the overall shape of the nitrogen adsorption-desorption curve of all samples was inverse “S” shape. According to the IUPAC classification of standard sorption isotherm types, the samples tested were similar to Type IV isotherms, reflecting predominantly micro- and mesopores [53]. Due to multilayer adsorption, the adsorption-desorption process is irreversible, and the curves separate during the adsorption process, forming a hysteresis line. The test sample hysteresis line types are mainly of types H2 and H3 (Figure 7), indicating that most of the pores in the study area are ink bottle pores and slit pores with parallel plate structures [54]. This result is consistent with the pore structure characteristics seen in previous SEM microscope observations [30,50,51,55].
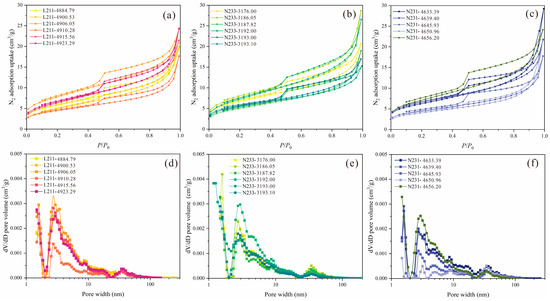
Figure 7.
N2 adsorption curves and PV distribution characteristics of three wells (L11, N33, and N31). (a) DBWD for N2 adsorption; (b) LBWD for N2 adsorption; (c) DBSD for N2 adsorption; (d) DBWD for dV/dD meso-macropore volume; (e) LBWD for dV/dD meso-macropore volume; (f) DBSD for dV/dD meso-macropore volume.
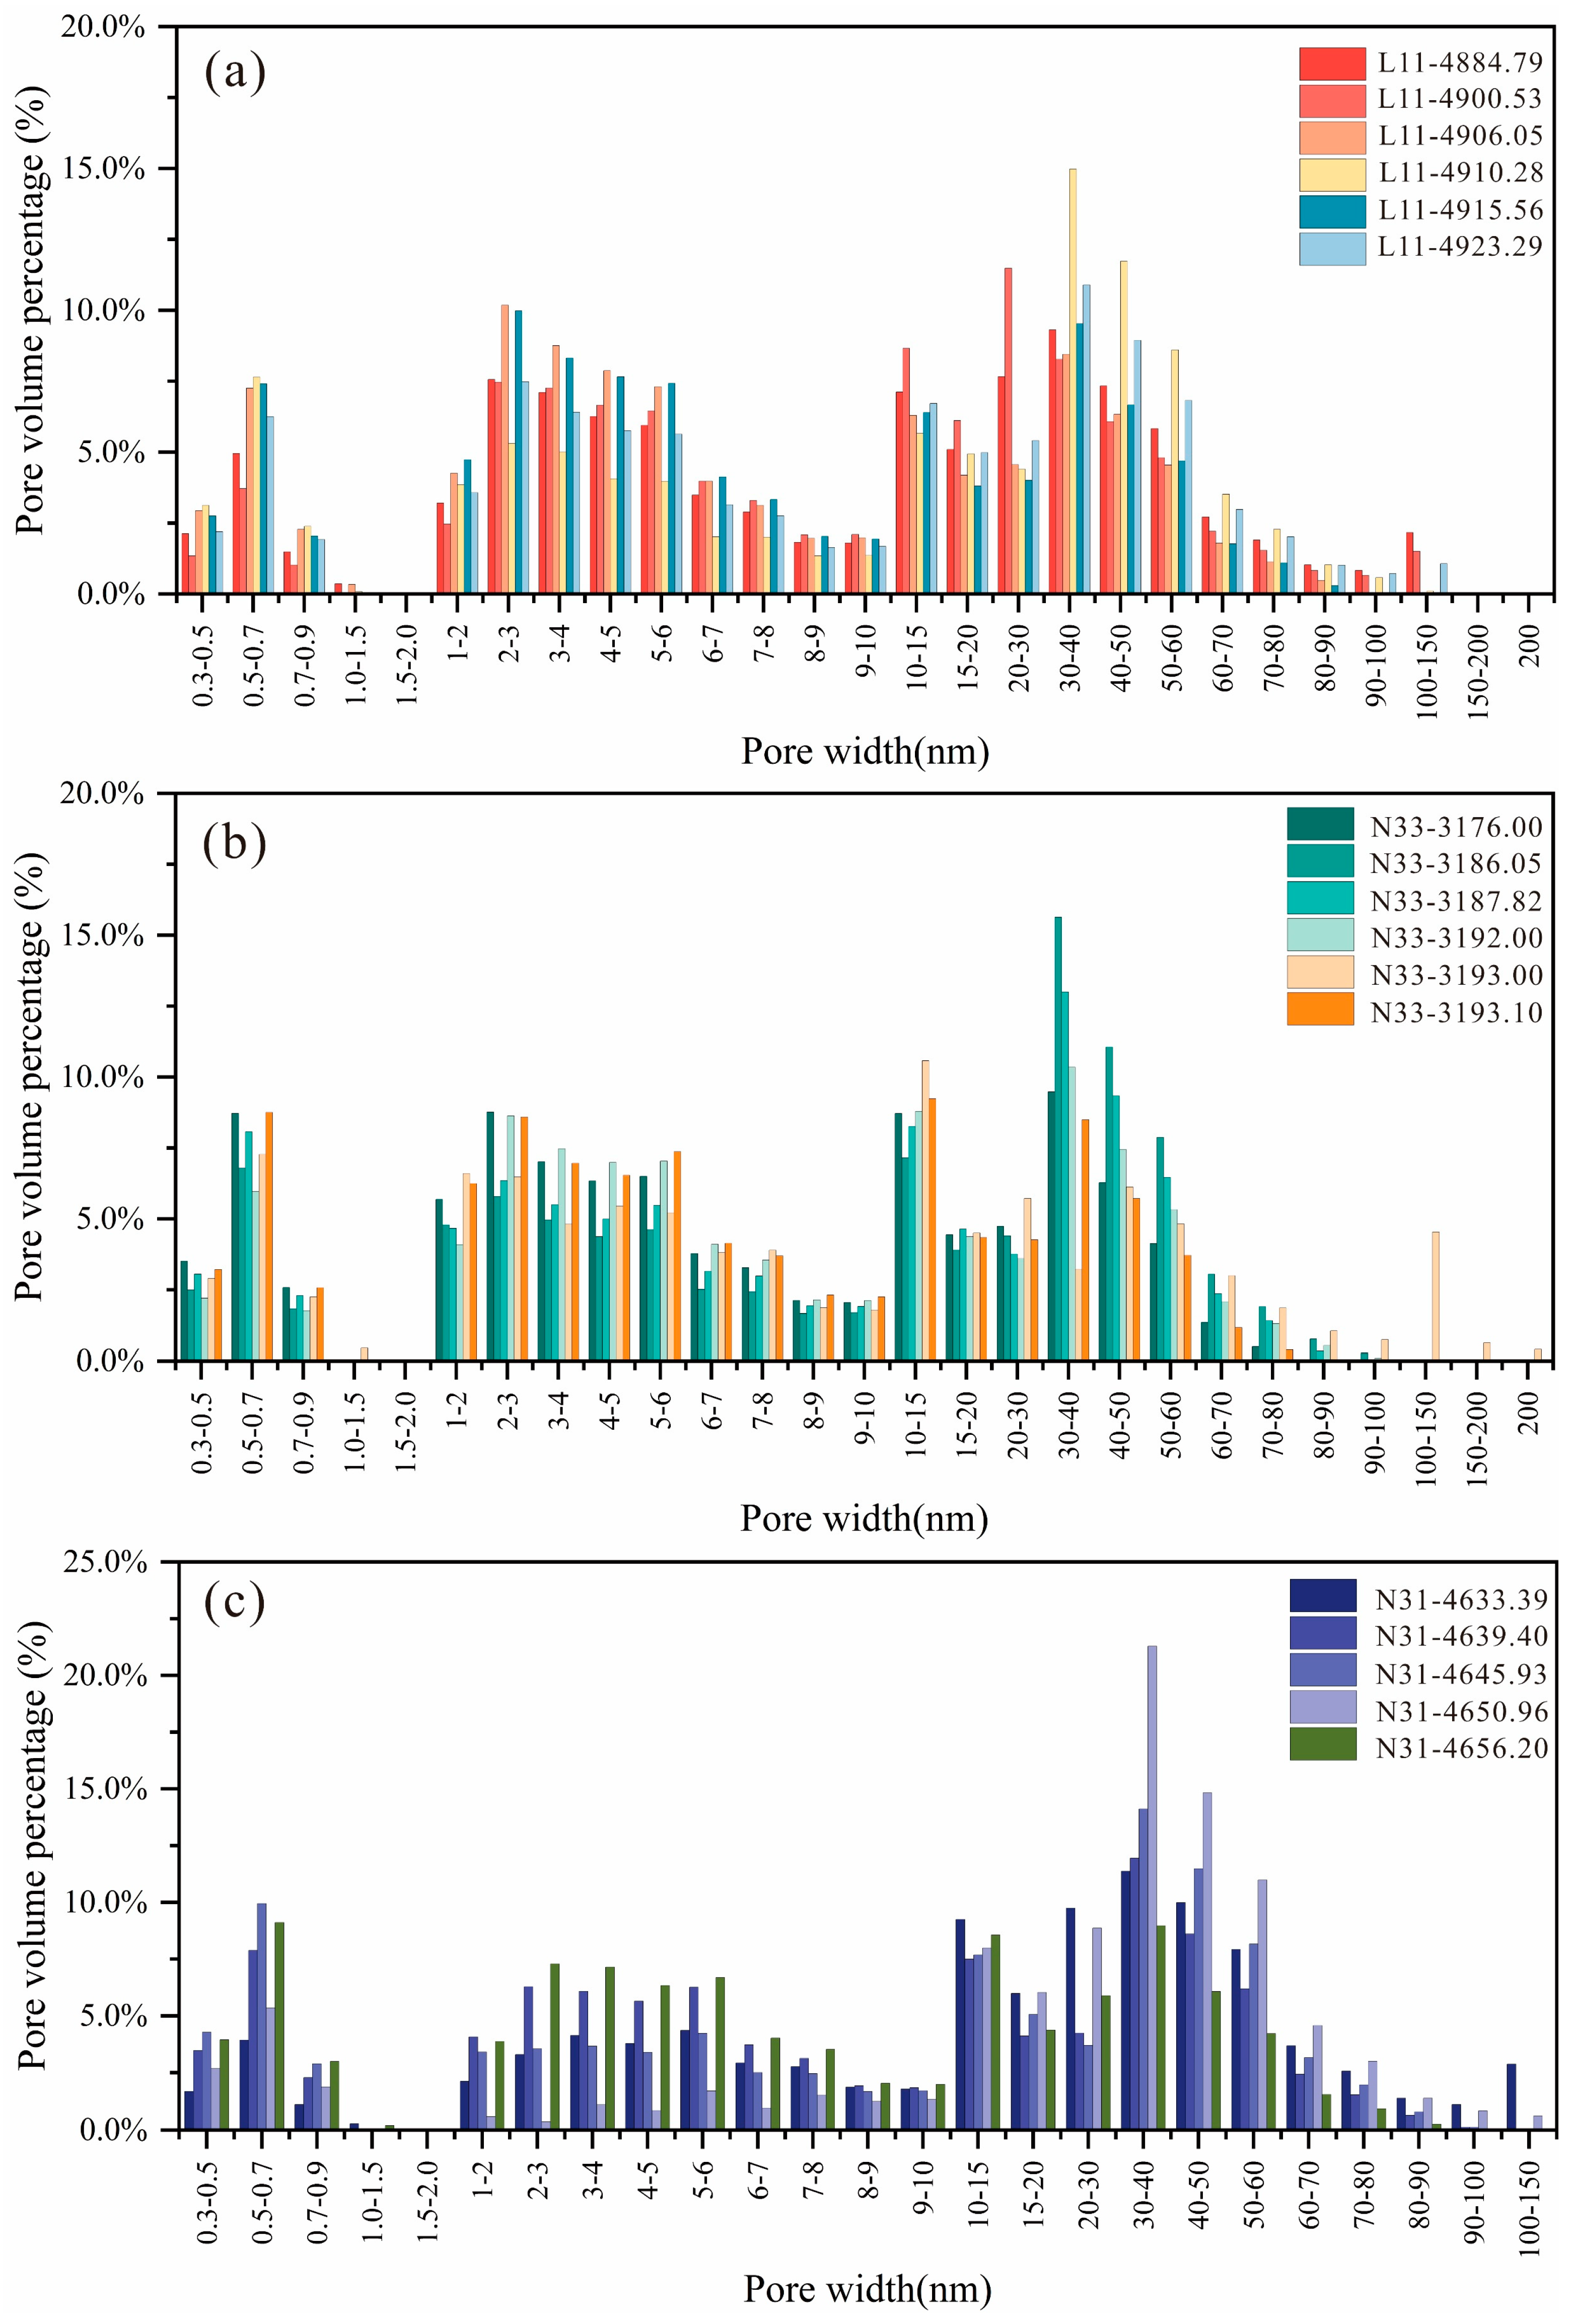
As can be seen from Figure 7a, the PSD of the shale samples from the lower quality section of the Longmaxi Formation is consistent, with all samples showing significant bimodal peaks at 1.6 nm and 3.0 nm (Figure 7). However, due to the difference in depth of burial of different samples, the pore development in the upper is worse than that of the quality shale section at the bottom of the Longmaxi Formation, and the number of large pores with an average pore diameter greater than 50 nm is low. The experimental tests showed that the average values of SA in the samples from Wells L11, N33, and N31 were 21.2161 m2/g, 21.9987 m2/g, and 19.7632 m2/g for meso-macropores, respectively; In contrast, the average PV values are 0.0317 cm3/g, 0.0322 cm3/g, and 0.0351 cm3/g, respectively. The micropore SA average percentage for Wells L11, N33, and N31 to the TSA was 39.91%, 41.10%, and 43.72%, which shows the dominance of micropores to TSA. The SA average percentage for Wells L11, N33, and N31 of mesopore PV to the TPV (total pore volume) was 93.14%, 92.33%, and 92.90%, indicating that the contribution of mesopore and macropore PV to the TPV is higher. The PV percentage distribution confirms that there is a similarity from the three tectonic contexts, with approximately 50% of the pores in the Longmaxi Formation being pores with pore throat diameters under the range of 10–50 nm (Figure 8). Within the same tectonic unit, there are differences of the PV at different depths.
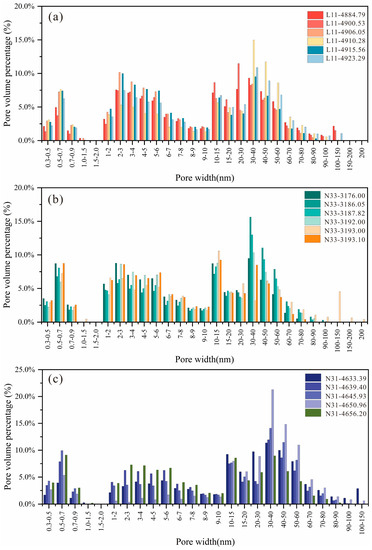
Figure 8.
Percentage of PV distribution characteristics of micropores and meso-macropores in three wells (L11, N33, and N31). (a) Pore volume percentage distribution of the DBWD; (b) Pore volume percentage distribution of the DBSD; (c) Pore volume percentage distribution of the LBWD.
4.4. Pore Fractal Characteristics
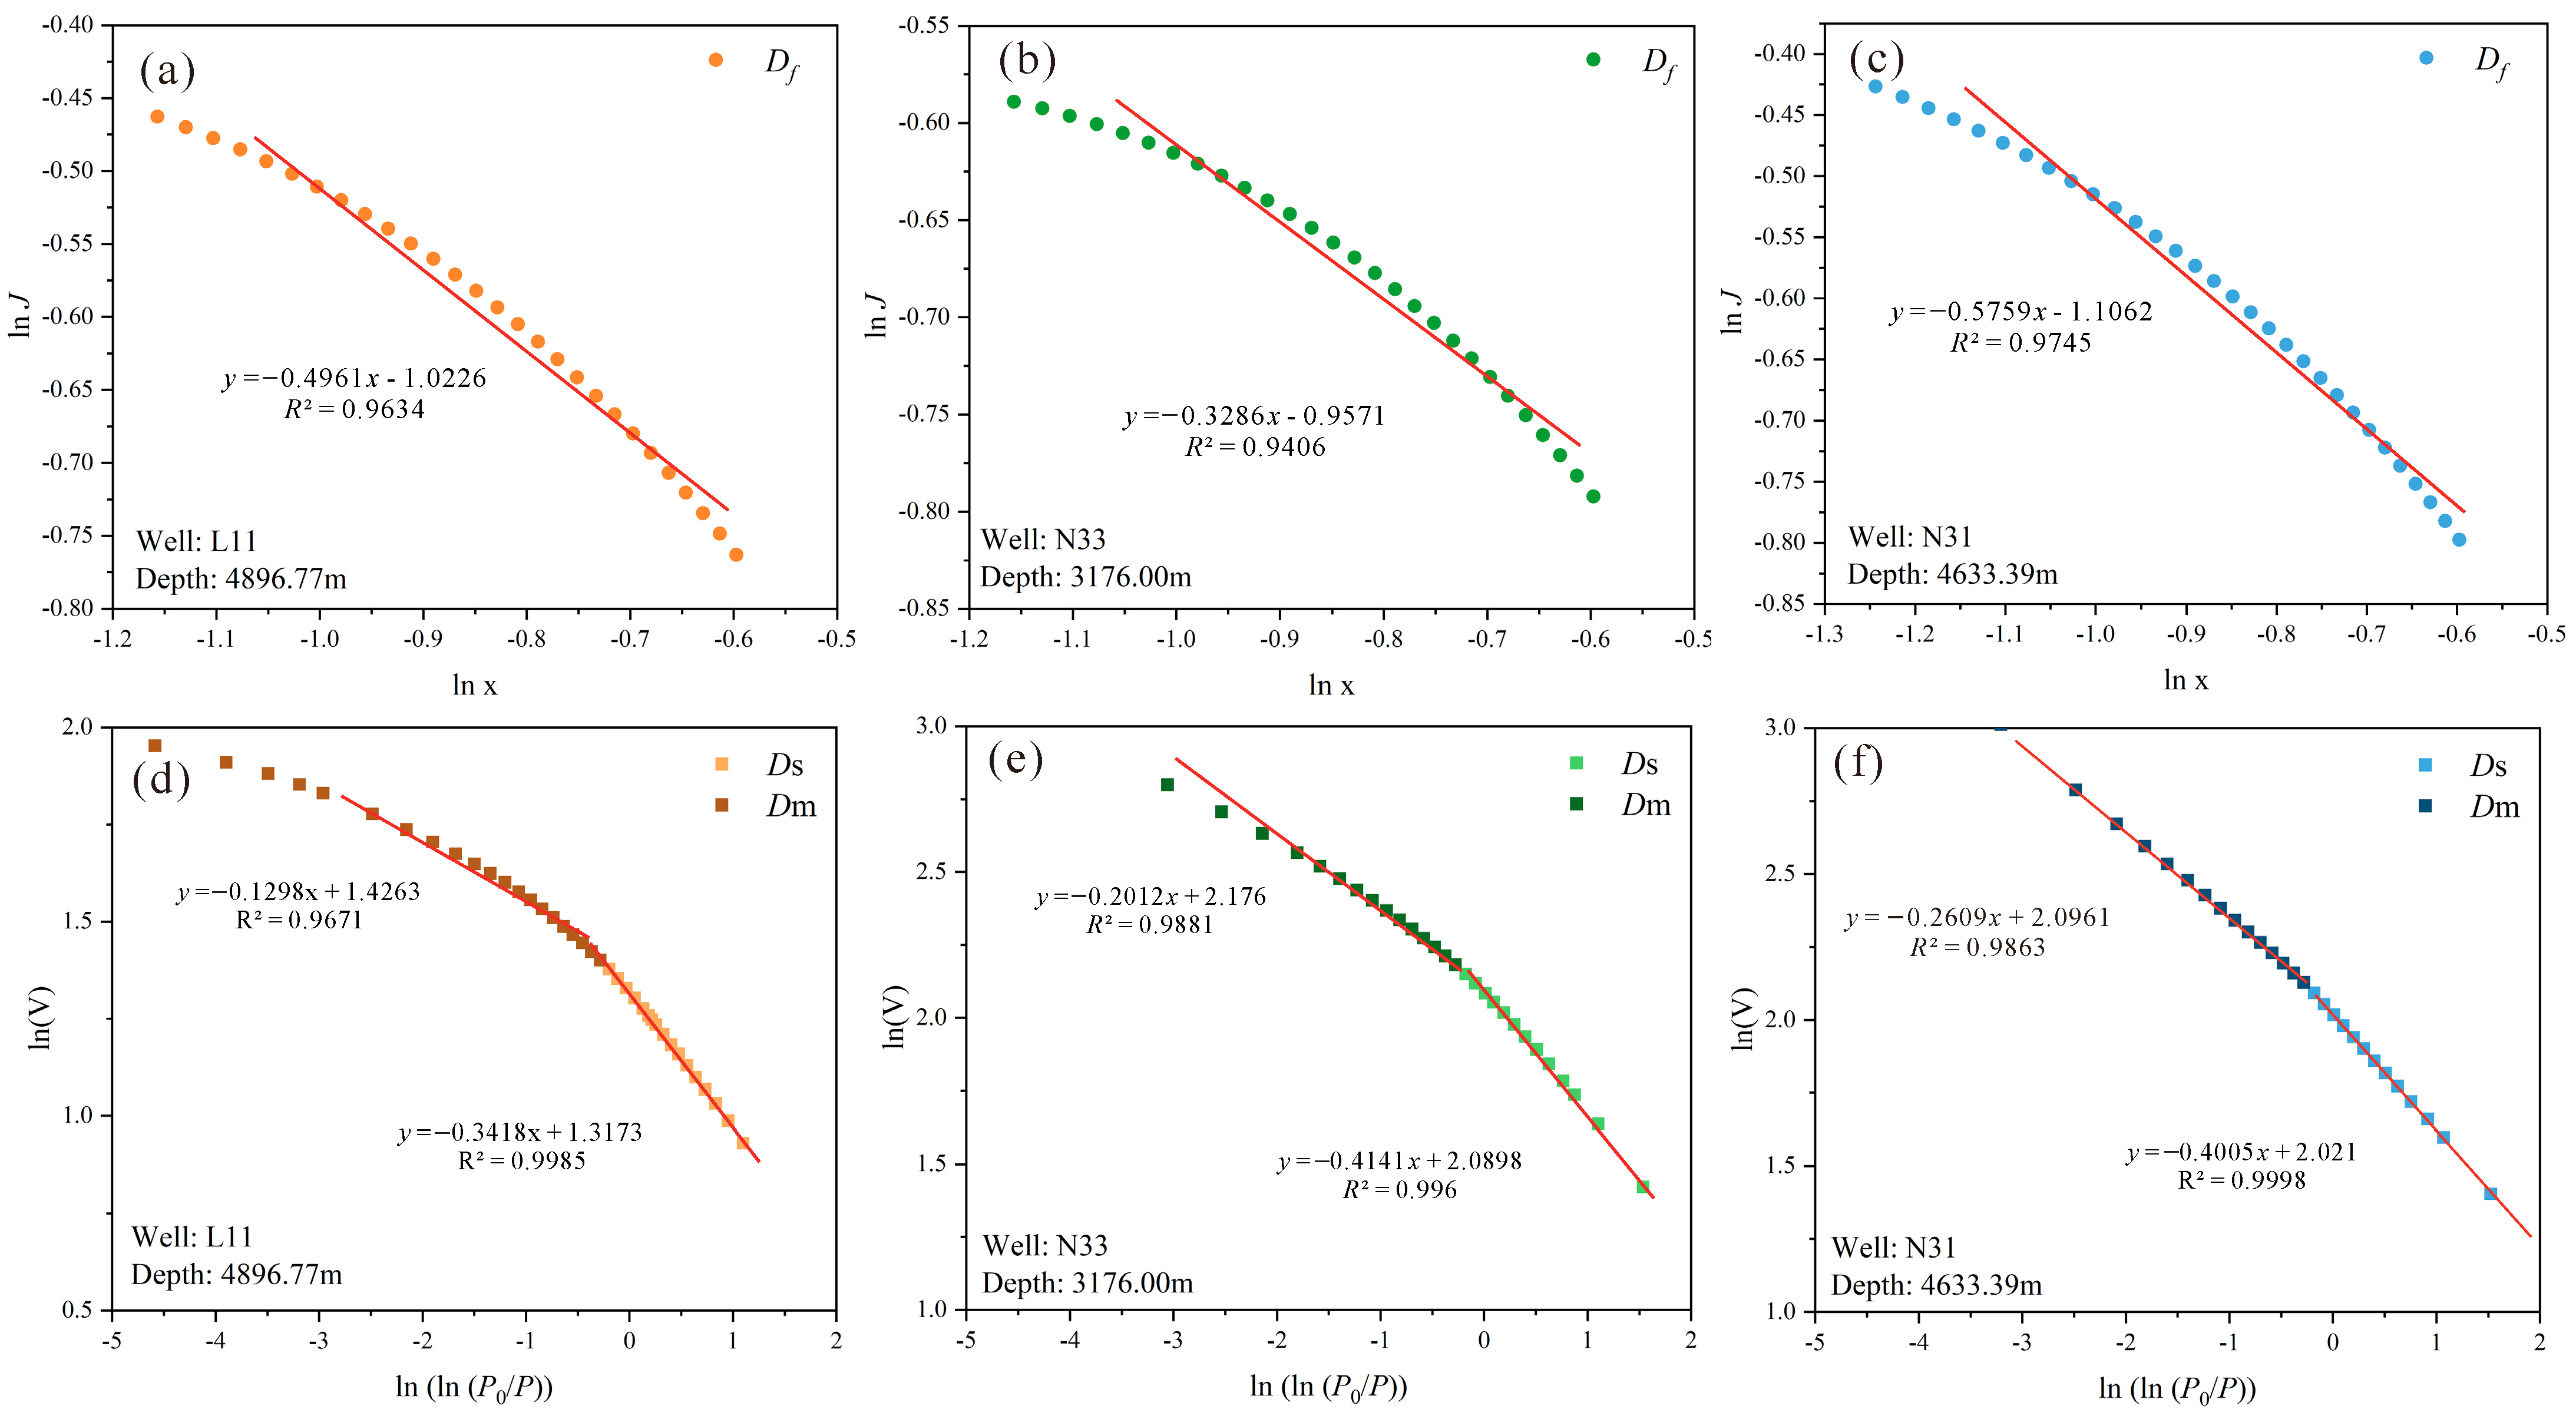
For the fractal dimension, we used two methods to calculate pore heterogeneity under different structural background conditions. CO2 adsorption is used to obtain the fractal dimension characterizing the micropores (Df); N2 adsorption is used to obtain the fractal dimension characterizing the shale mesopores, including two types: (1) fractal dimension of the surface area (Ds); (2) fractal dimension of the pore structure matrix (Dm). According to Equation (2), the sample fit formulas and correlation coefficients were calculated by plotting J(x) and x logarithmically (Figure 9). The results show that the correlation coefficient of the micropore fractal model fit is more than 0.97, indicating that the model fit is good and suitable for the characterization of the shale micropore structure [49]. The Df distribution of all samples was between 2 and 3, which was consistent with fractal theory. The Df distribution of Well L11, N33 and N31 ranged from 2.206 to 2.535, 2.254 to 2.382, 2.235 to 2.611, with an average of 2.388, 2.320 and 2.535. The Df of Well L11 decreases with increasing depth, indicating that the heterogeneity of the micropores is gradually decreasing. As the depth of burial increases, the micropores are stressed more effectively, and the pore shape tends to be uniform, indicating a reduction in micropore heterogeneity. This trend is not present in the Df distribution characteristics of the N33 well samples, suggesting that multiple factors may control micropore heterogeneity.
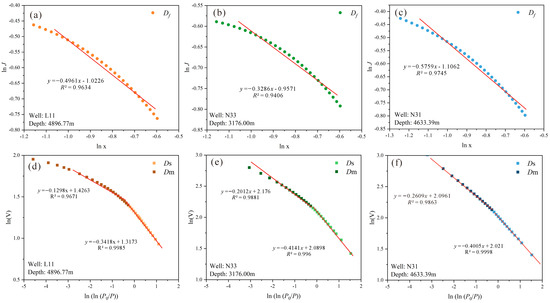
Figure 9.
Fractal model for carbon dioxide adsorption on samples from different tectonic units and FHH model for nitrogen adsorption. (a) Fractal dimension of the micropores, Well: L11; Depth 4896.77 m; (b) Fractal dimension of the micropores, Well: N33; Depth 3176.00 m; (c) Fractal dimension of the micropores, Well: N31; Depth 4633.39 m; (d) Fractal dimension of the surface and matrix, Well: L11; Depth 4896.77 m; (e) Fractal dimension of the surface and matrix, Well: N33; Depth 3176.00 m; (f) Fractal dimension of the surface and matrix, Well: N31; Depth 4633.39 m.
At a relative pressure (P/P0) of about 0.45, the adsorption and desorption isotherm curves do not overlap, and a hysteresis line appears in the Longmaxi Formation shale sample. Therefore, the relative pressure of 0.45 is used as the cut-off point, and two pressure stages are divided into low relative pressure (0 < P/P0 < 0.45) and high relative pressure (0.45 < P/P0 < 1.0) to calculate the fractal dimension (Figure 9). The fractal dimension calculated in the low-pressure interval indicates the irregularity, roughness, and complexity of the pore surface (Ds). The matrix fractal dimension (Dm) calculated in the high-pressure interval suggests the complexity of the pore space and the irregularity of the structure, the results of which are shown in Table 3. Dm was higher than Ds for the same sample, indicating that the pore structure was more heterogeneous than the pore surface.
Table 3.
Fractal dimensions derived from the FHH model for N2 adsorption and micropore-filled model for CO2 adsorption.
5. Discussion
5.1. Effect of Mineral Compositions and TOC on Pore Structure in Different Tectonic Locations
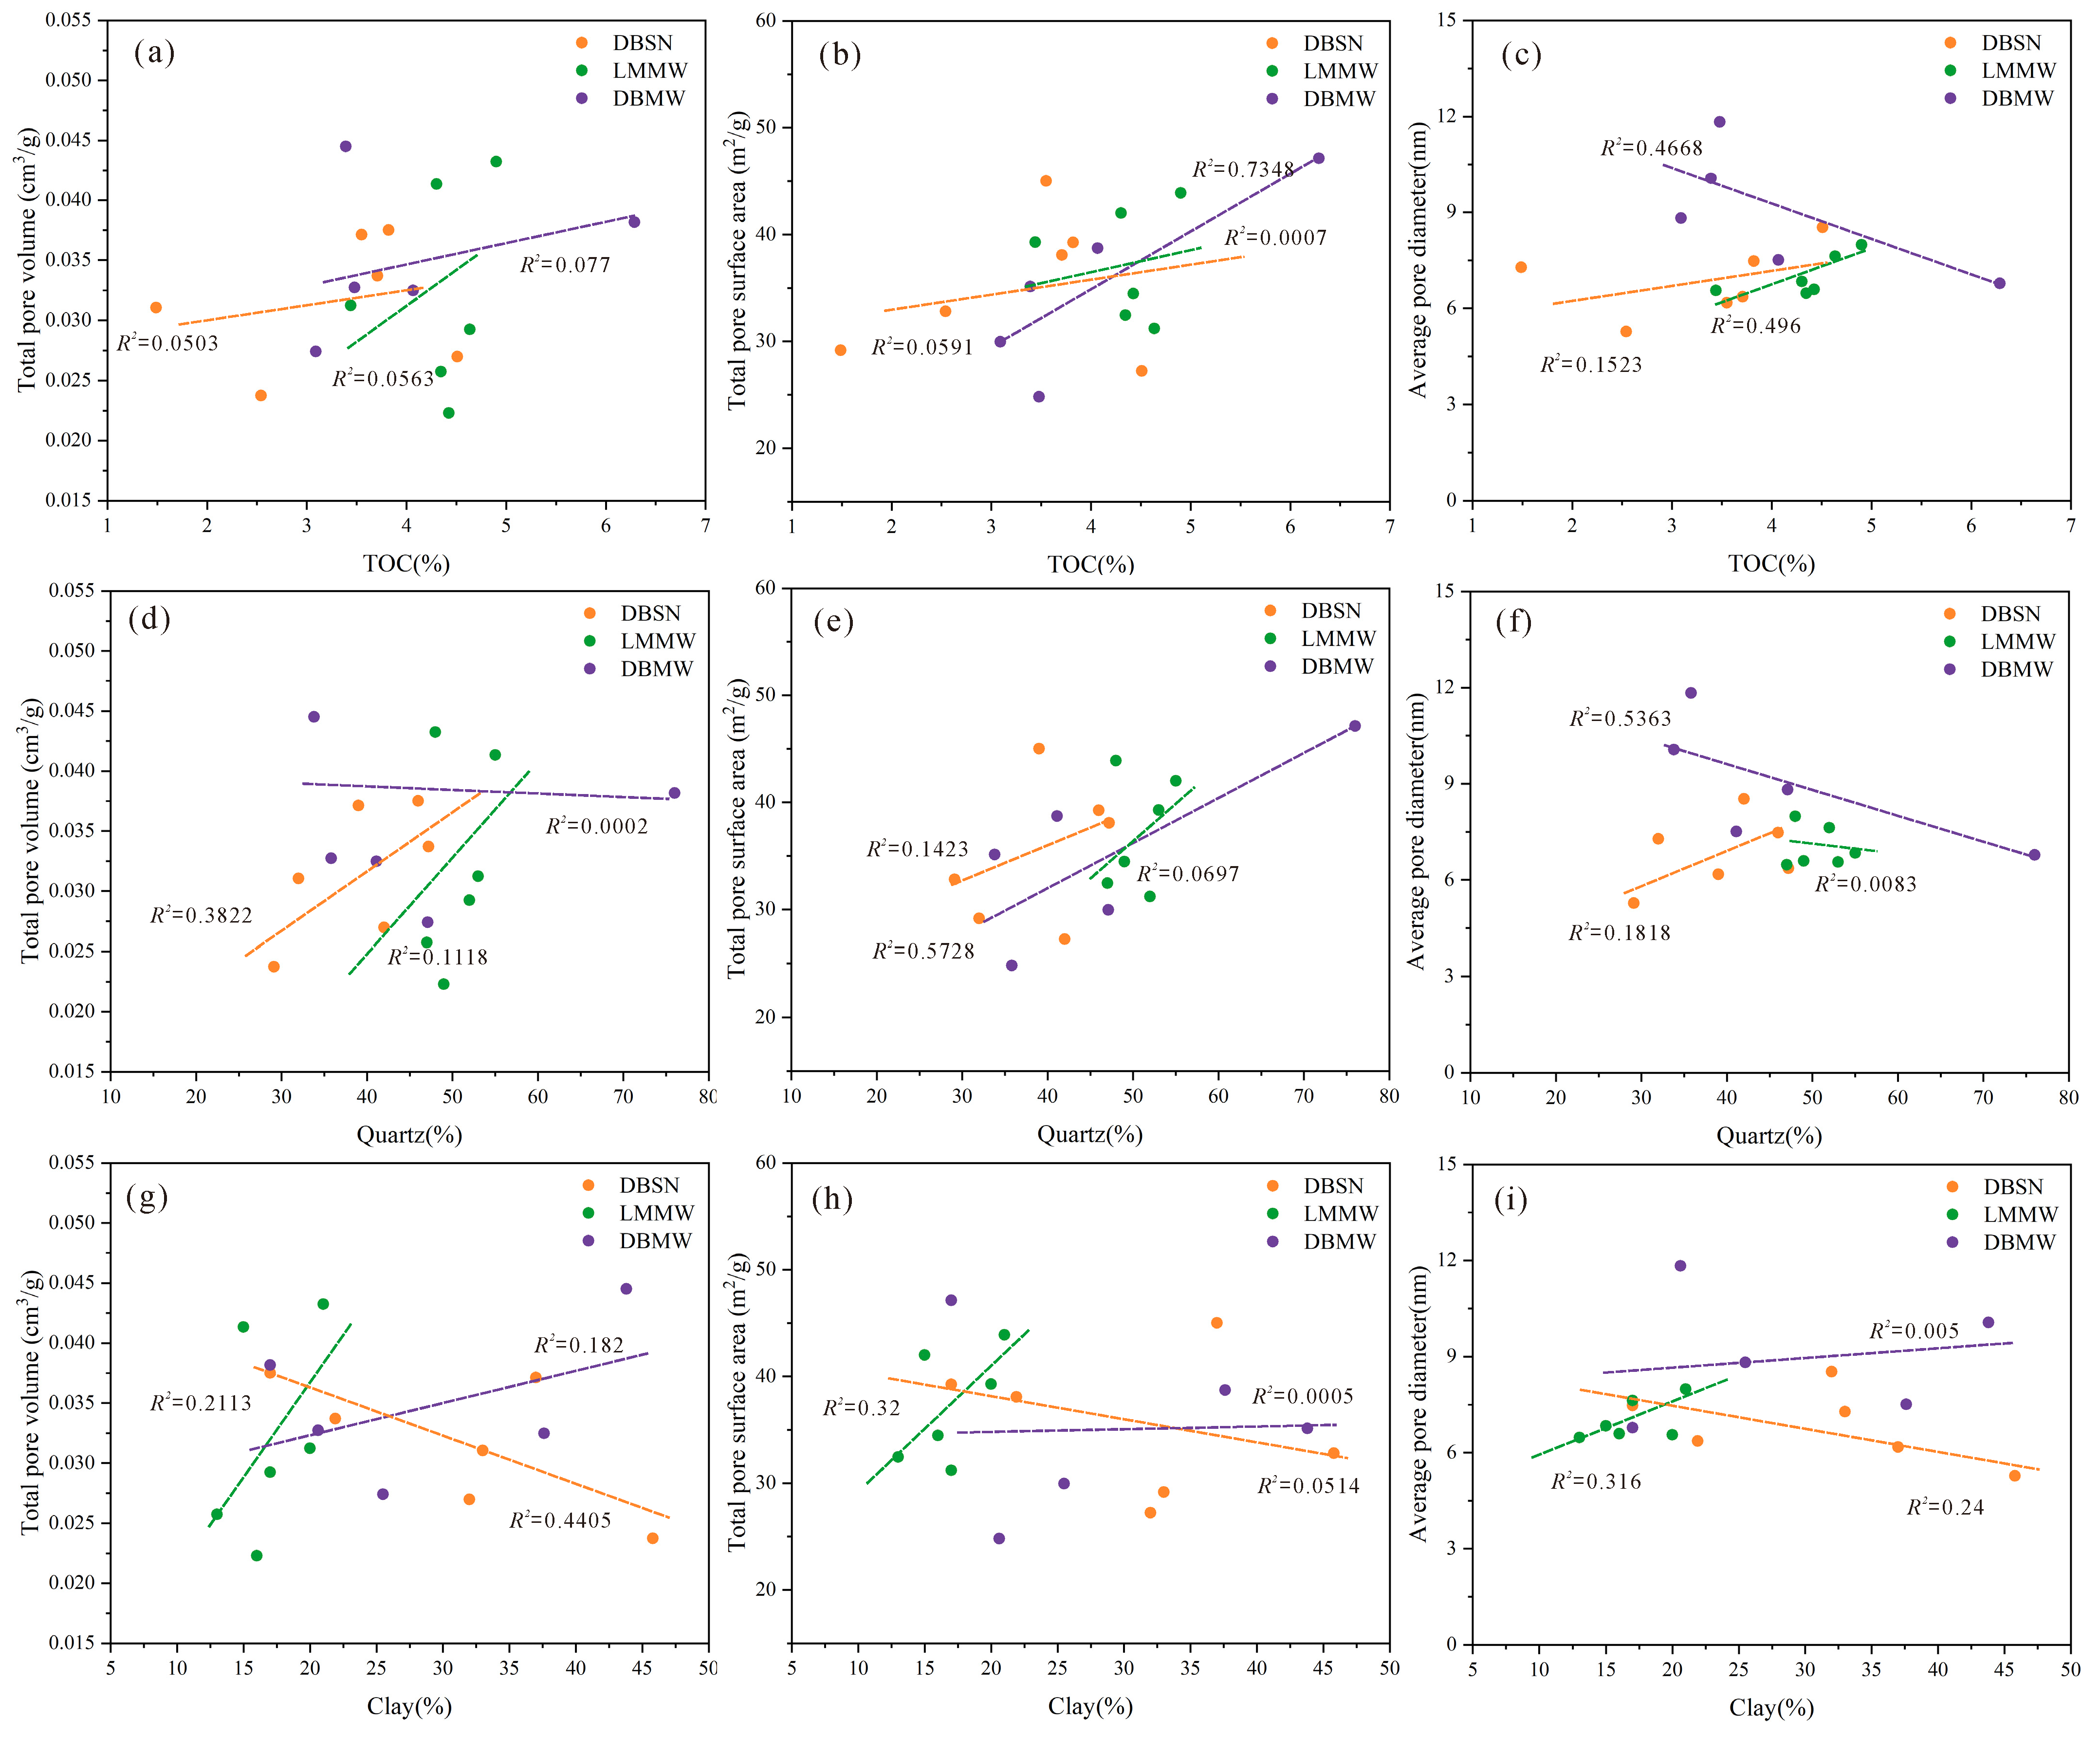
In the present study, the relationship between the main shale components such as TOC, quartz and clay minerals, and pore structure parameters was analyzed for different tectonic background conditions (Figure 10). TOC control the number of OM pores within the gas window, which can further control the pore structure characteristics [27,29,56,57]. Compared to other minerals, many studies have demonstrated that OM pores, especially pyrobitumen pores, can provide a large PV and SA [29]. Previous studies show a positive correlation between TOC content and PV, SA, and average pore diameter in Longmaxi Formation [29,30,51,55]. The results of the present study are agreement with the previous findings (Figure 10a–c). The thermal evolution has reached an overmature stage, and there is a large amount of OM pore space within all three tectonic units.
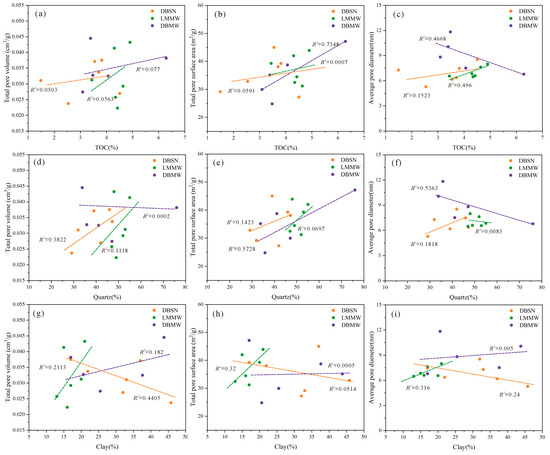
Figure 10.
Correlation analysis of mineral composition and pore structure parameters of samples from different tectonic units. (a) relationship between TOC and Total pore volume; (b) relationship between TOC and total surface area; (c) relationship between TOC and average pore diameter; (d) relationship between quartz and total pore volume; (e) relationship between quartz and total surface area; (f) relationship between quartz and average pore diameter; (g) relationship between clay and total pore volume; (h) relationship between clay and total surface area; (i) relationship between clay and average pore diameter.
However, the OM pore space can be deformed under different burial depths and tectonic deformation conditions. Some samples possess high TOC, but the OM is more plastic and prone to bending and deformation under external forces from DBSD examples. This result was shown in the SEM results of previous studies [22,23,37,39]. Compression and collapse of OM pores under compression conditions, resulting in a reduction in pore diameter, showing negative correlation and poor correlation characteristics (Figure 10a–c) [15,22]. Previous results show that most of the quartz was derived from biogenic silicon in the Longmaxi Formation and that the marine shelf environment, where large amounts of biogenic silicon and OM were deposited together, resulted in a significant positive correlation between TOC content and quartz content [58]. In this study, the relationship between quartz content and pore structure parameters was primarily positive in samples with weak tectonic deformation (Figure 10d–f), indicating that higher quartz content also shows higher TOC content, which promotes PV and SA development. In contrast, the relationship between quartz and TPV within the DBWD samples was insignificant and negatively correlated with the average pore diameter (Figure 10d–f). This phenomenon indicates that the strong tectonic compression and deformation have caused damage to the original correlation. Previous studies have shown that during mechanical compaction or deformation, clay minerals tend to form folds or bends [22,42]. During this process, pores with different diameters and shapes are associated, including high-angle faults or fractures perpendicular to the clay layer, most elongated and easily connected to microfractures [23,24,59]. In the present study, the relationship between clay content and pore structure parameters differed for various tectonic backgrounds (Figure 10g–i). The LBWD samples all show a positive correlation between clay mineral content and pore structure parameters. This phenomenon may be due to the shallow burial depth, which was subjected to appropriate compression stresses and formed a series of microfractures, resulting in a positive correlation. DBSD samples are subject to compression stress and burial depth; this correlation may not be significant (Figure 10g–i). In contrast to the two tectonic backgrounds, higher clay minerals are more prone to deformation at the deep burial, with compression and collapse of the pores within the clay minerals, resulting in a significant reduction in PV and SA under higher clay content [57].
5.2. Effect of Tectonic Deformation on Pore Morphology
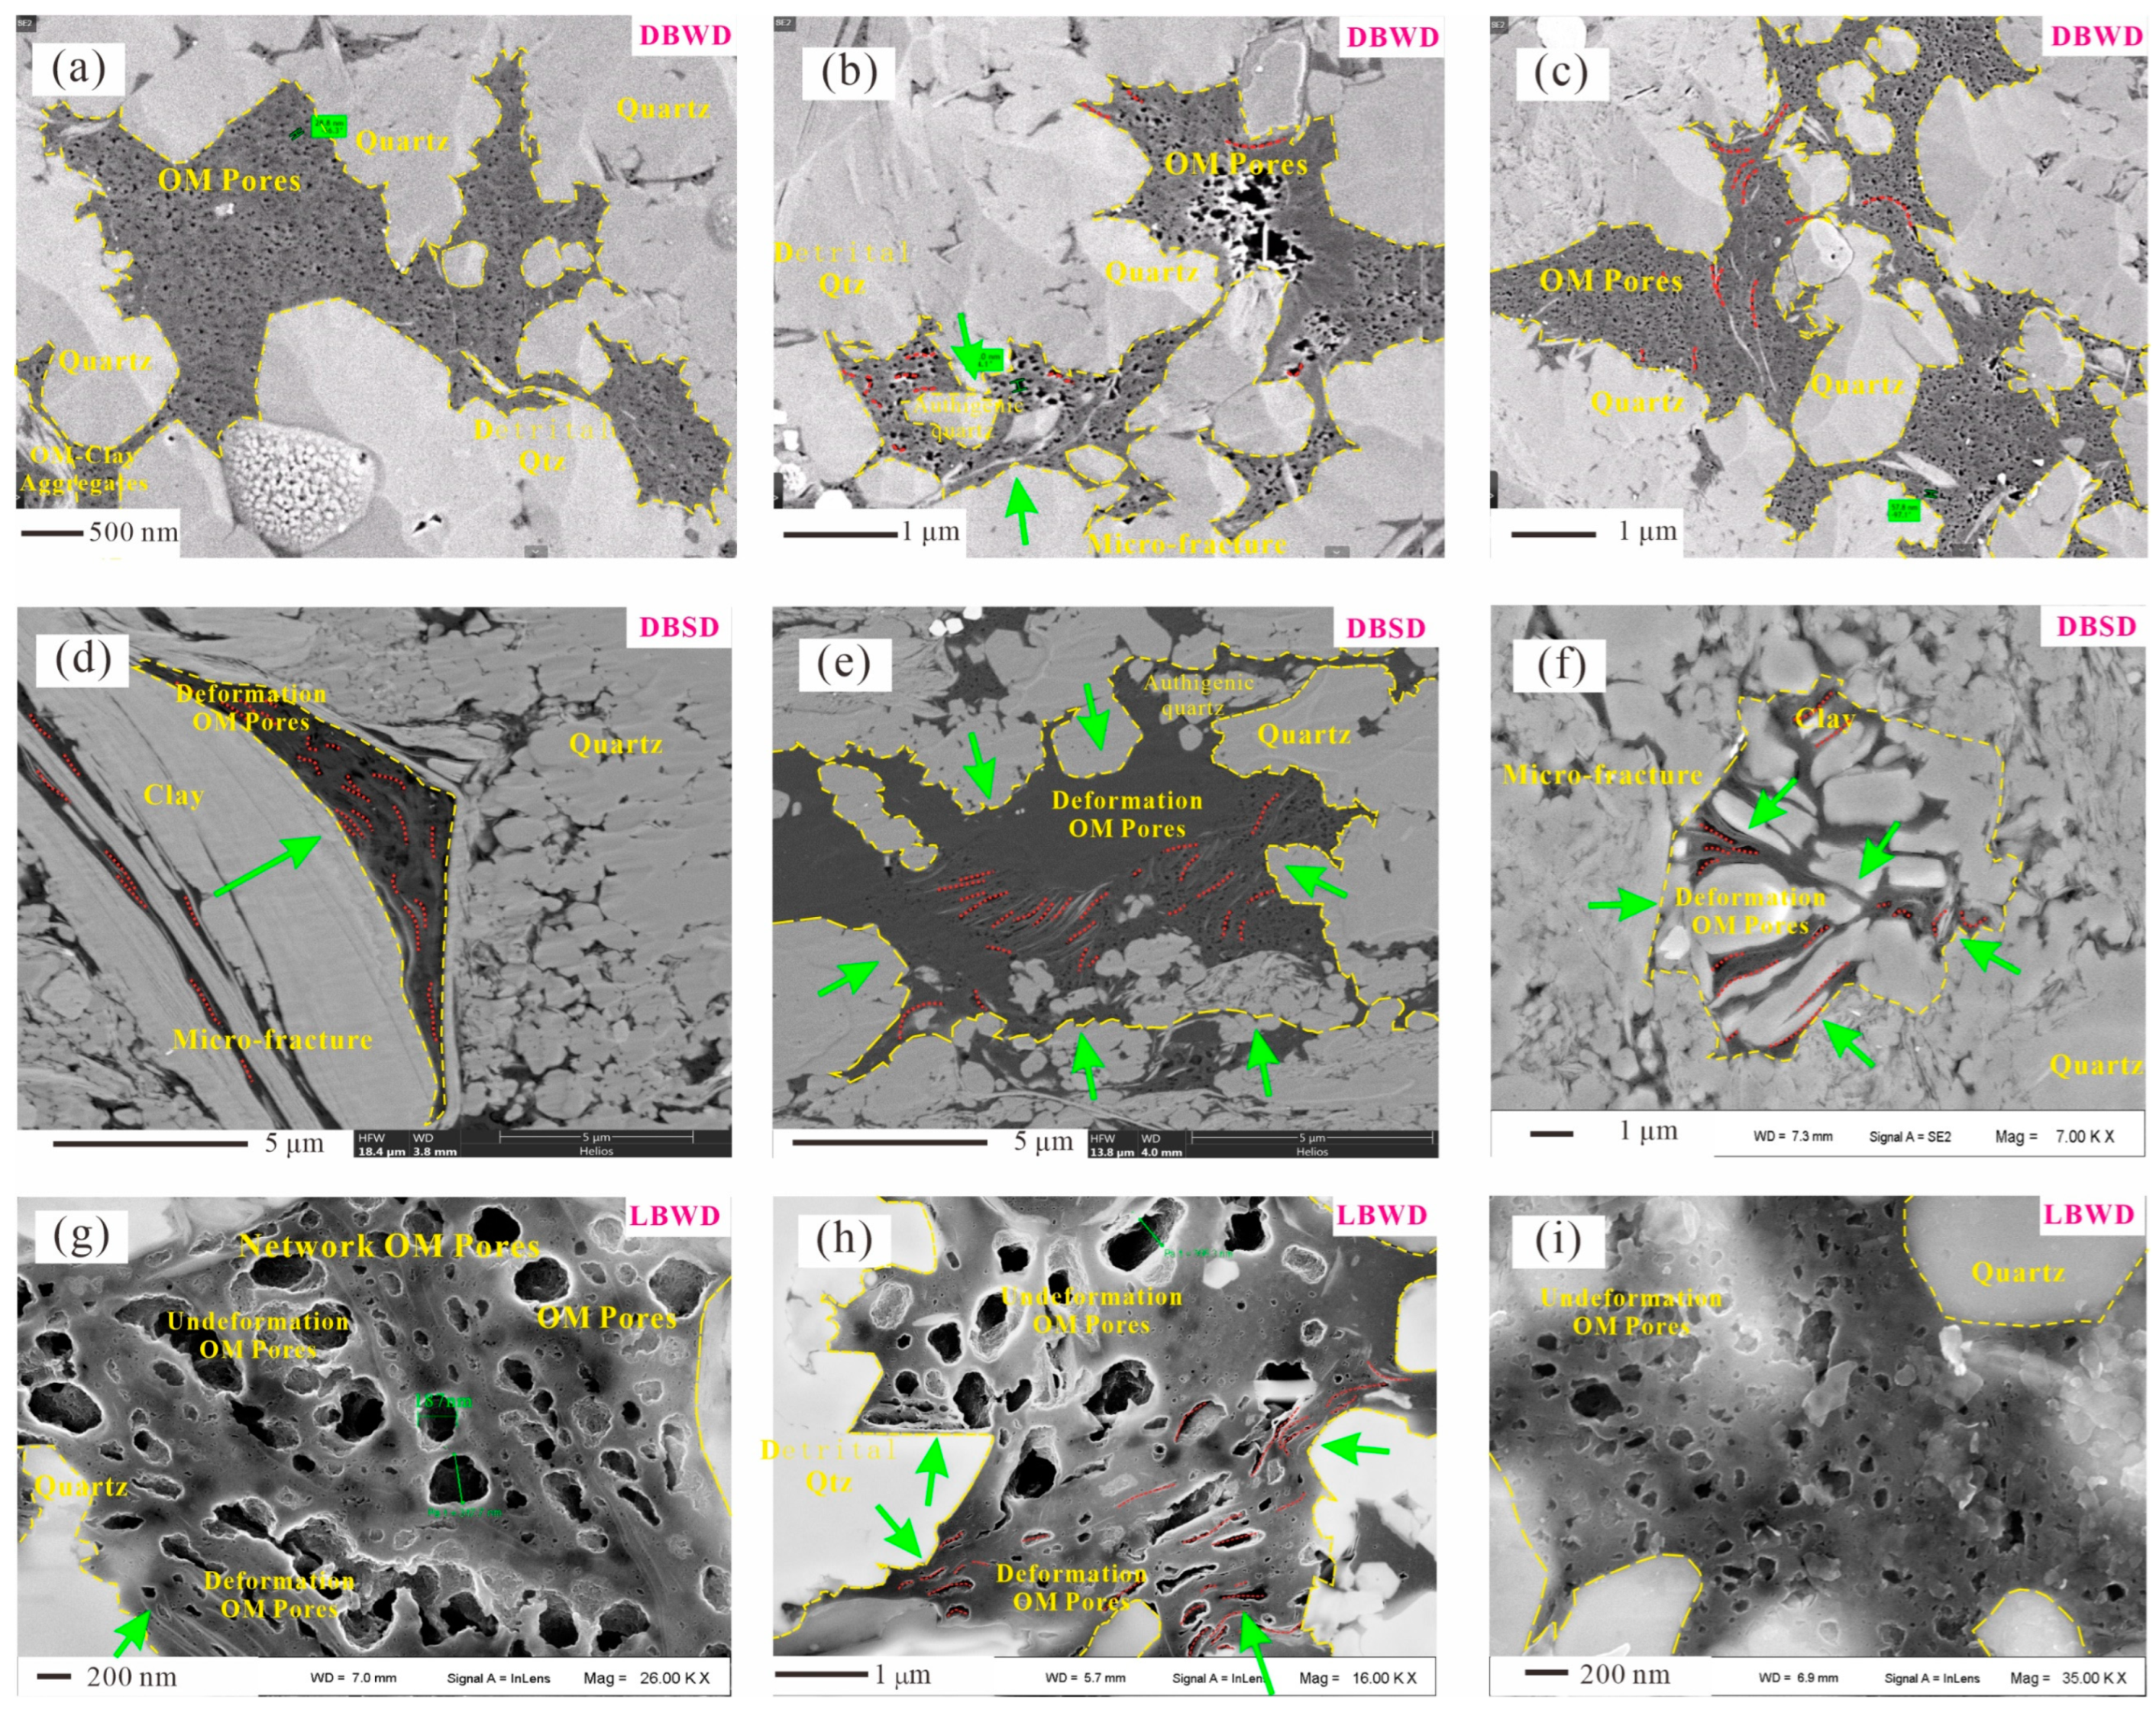
The pores are deformed by external forces, particularly tectonic compression, overlying stress, water-rock interaction, and recrystallization, which cause the exterior of the rock to be subjected to varying degrees of shear and compression stresses, resulting in a series of deformations [4,19,20,21,22,23]. In general, however, the stresses effect on the pores and matrix of shale reservoirs cannot be described quantitatively [22]. However, we can clarify the stress characteristics and deformation intensity of shale reservoirs under different tectonic background conditions by analyzing them from a macro perspective. In the present study, SEM was used to clarify the morphological characteristics of the pores within the shale matrix and the mineral deformation characteristics under different intensity tectonic stresses (Figure 11). The direction of force on the organic matter has been marked in green.
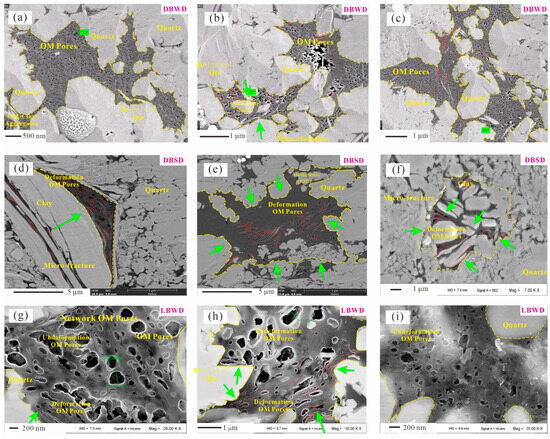
Figure 11.
SEM of OM pores within different tectonic units of the Longmaxi Formation. (a–c) OM pore characteristics under DBWD; (d–f) OM pore characteristics under DBSD; (g–i) OM pore characteristics under LBWD.
The morphology of OM pores in shales is often controlled by thermal maturation, OM, type and tectonic deformation. Previous studies of OM pore evolution during thermal evolution have also identified many unusually shaped, unexplained OM pores that have been altered by external forces, particularly tectonic deformation [28,56,57]. In the present study, we compared the pore characteristics of OM in different tectonic backgrounds. OM pores are influenced by thermal maturation and form the networked pores from the backslope slope structure(Well L11) (Figure 11a–c). On the one hand, the shale is exposed to more significant upward and lateral stresses due to the deep burial. Some of the brittle mineral particles form a more solid framework, and the organic pores filled within are less prone to deformation. At the same time, the OM pores have small pore diameters with rounded and sub-circular. The pore morphology does not change significantly under proper compression [15,28]. In the case of organic-clay mineral aggregates, they are more susceptible to control by tectonic deformation. In the DBSD tectonic background, the macropore influence of strike-slip fractures has resulted in the formation of flower-like structures, allowing for a more significant degree of deformation of OM and minerals. Due to the ductility of OM, clay layers mixed with OM tend to form folds or bends during mechanical compaction or deformation [60].
Figure 11d shows that the clay minerals have been significantly deformed by the compression, which also affects the OM in contact, resulting in compression of the OM pores. Clay minerals subjected to lateral compression (green arrows). Part of the OM pore space is laminated by compression (Figure 11e). OM is compressed by the surrounding rock (green arrow). OM pores and intrapores associated with clay mineral layers and multiple pores are interconnected to form large pores or microfractures (Figure 11f). In lower burial, the OM is often wrapped by the framework of brittle minerals (quartz, feldspar, calcite, etc.), and the OM pore shape near the edge of the minerals tends to be distributed around the edges of the brittle mineral grains (Figure 11g,h). OM pores are also affected by tectonic stresses (Figure 11i).
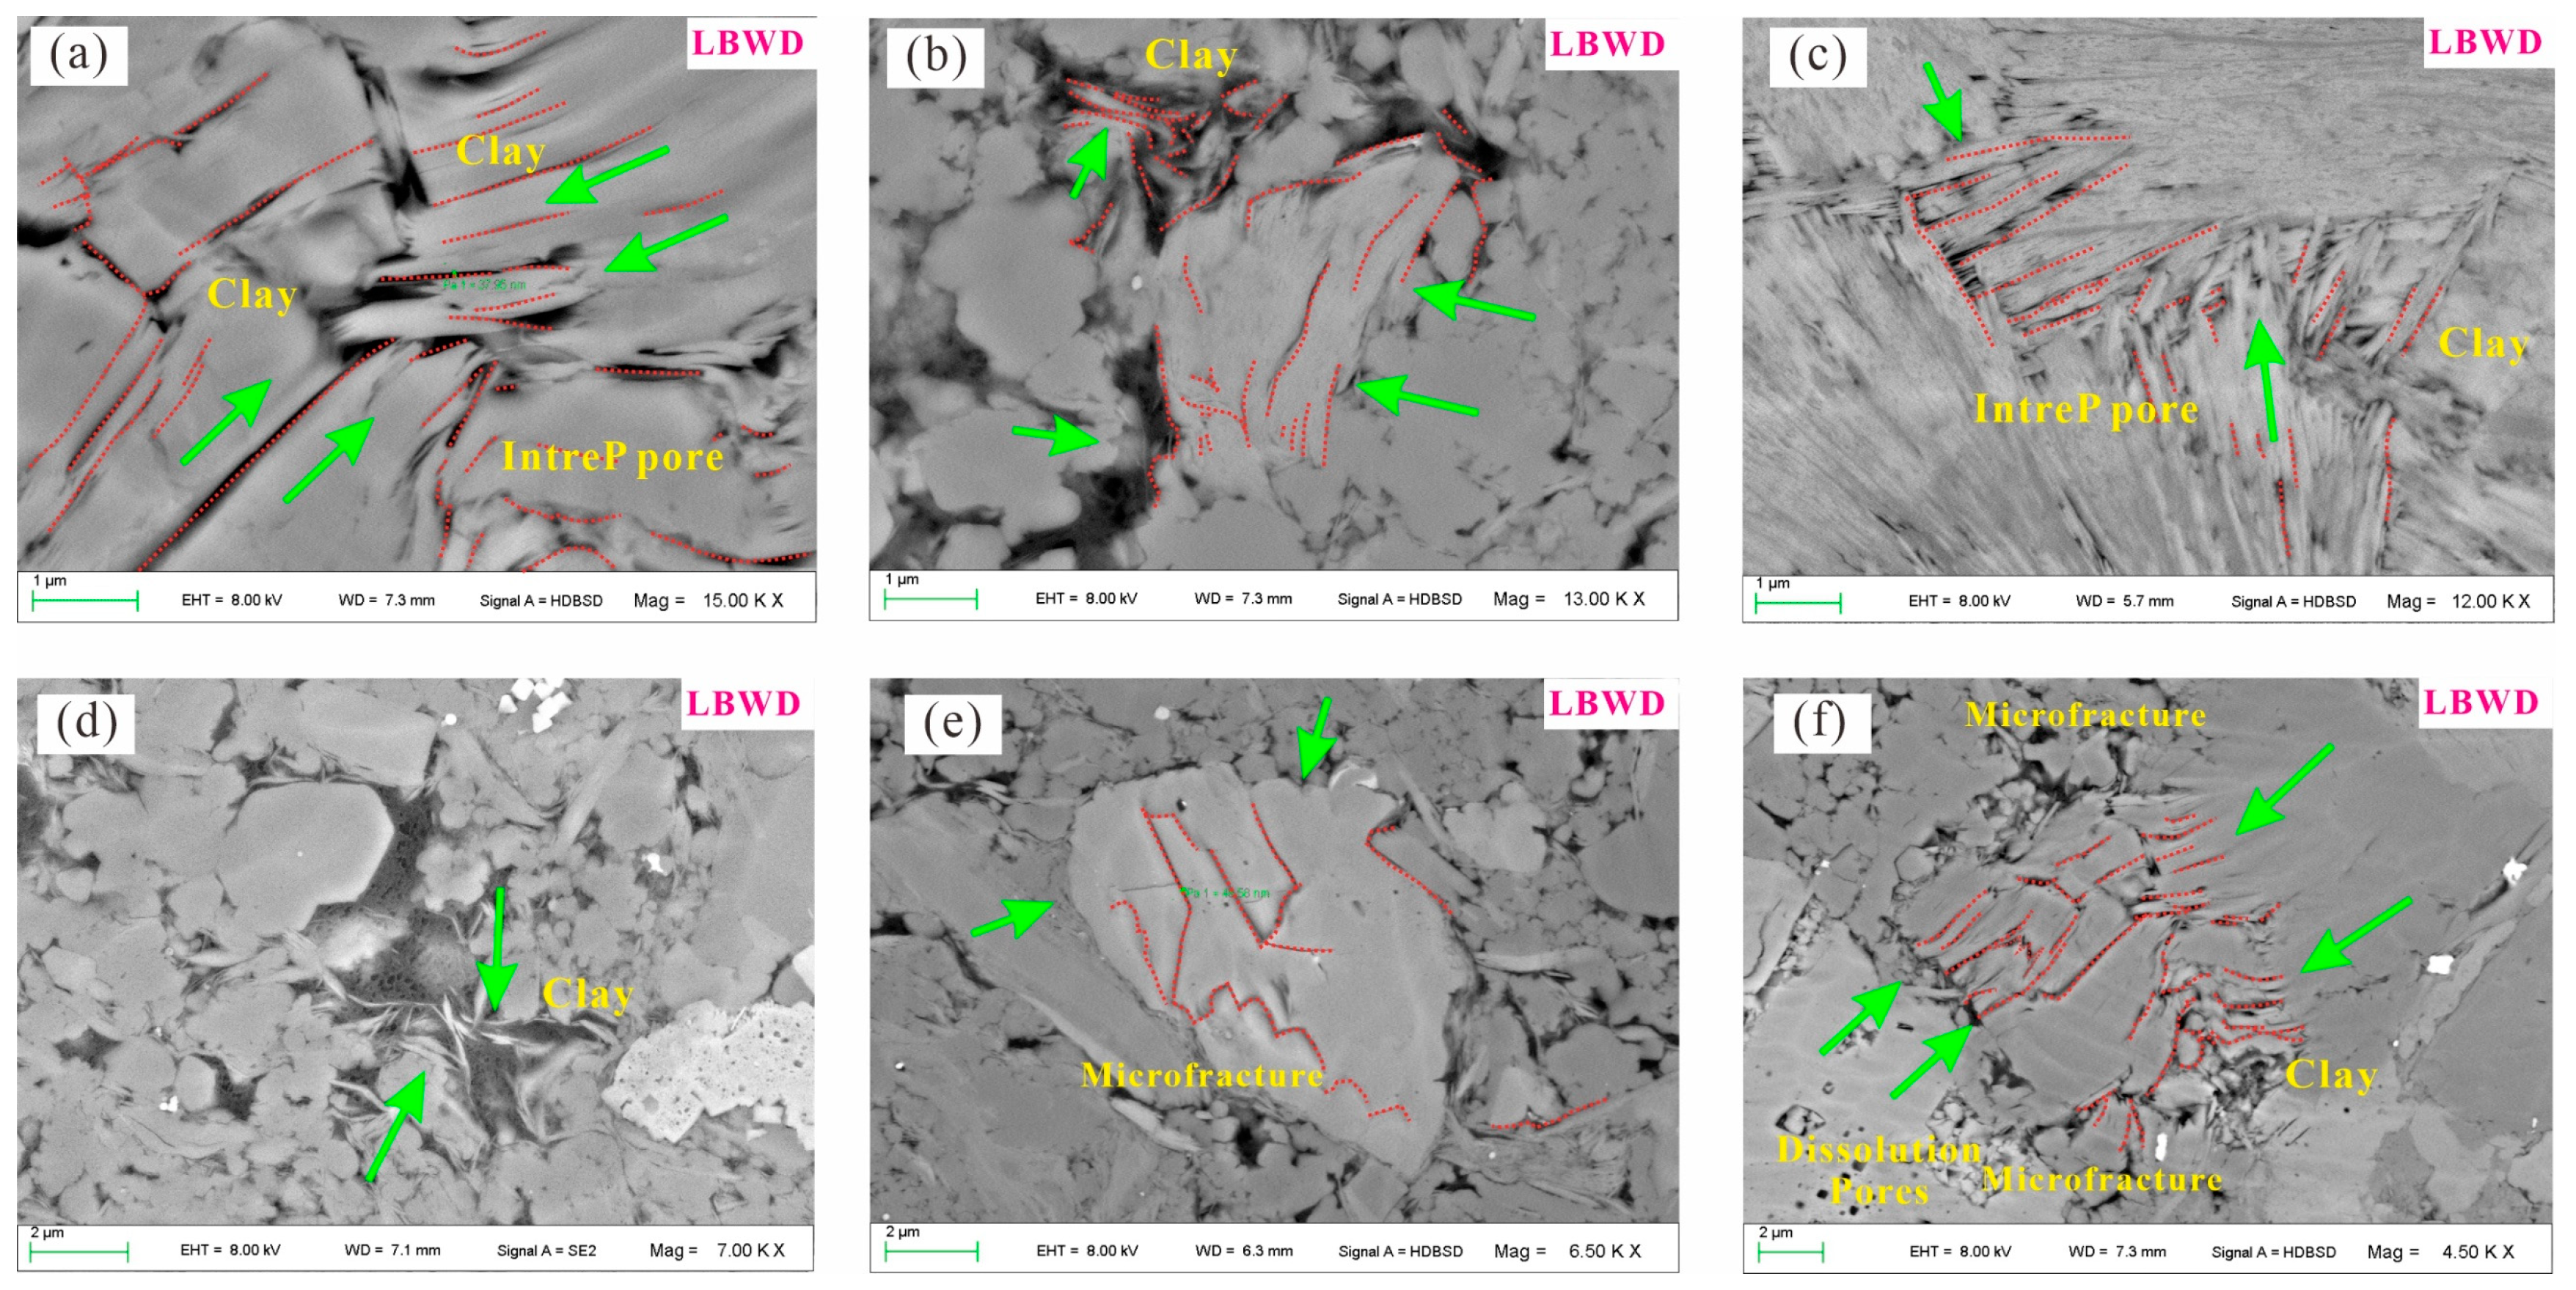
Subjected to compressive stress in the direction of the green arrow, the clay and brittle minerals show a more complex folded pattern (Figure 12). The tendency to fold or bend during tectonic deformation for clay minerals can generate pore spaces of different diameters and shapes, including high-angle faults or fractures vertical to the clay formation. The pores within the clay grains tend to be long in extension, variable in width, and regularly arranged (Figure 12a–d). Figure 12b shows that the laminated clay minerals are compressed and can easily connect to create microcracks based on the original slender intra- and interpores. If these microfractures can be related to OM, they can provide good access for shale gas transport (Figure 12d).
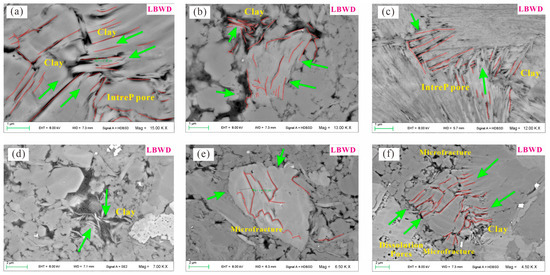
Figure 12.
SEM of brittle minerals within different tectonic units of the Longmaxi Formation (intrapore pores, interpore pores, microfractures). (a) clay minerals extruded in both directions; (b) clay minerals extruded laterally; (c) clay minerals extruded laterally; (d) organic matter-clay mineral aggregates; (e) calcite minerals crushed to produce fractures; and (f) calcite and clay minerals squeezed to produce fractures.
Loucks et al. state that burial and compaction distort and close the PV and block the pore throat [32]. For brittle minerals, the deformation of dissolution intrapores extends in the direction of weakening the rigid pores based on the original pores, resulting in the connection of adjacent solution pores and fractures under the action of deformation [22]. SEM shows that some of the brittle minerals have cracked and can form multiple fracture systems, which are connected to some of the dissolution pores, creating a microfracture-pore network (Figure 12e). In addition, some rigid particles are gradually pulled and connected, leading to particle fragmentation and the forming of cracks of a few nanometres to a few microns (Figure 12f). These cracks are connected to inter and intrapores. The interaction between the grains and the tectonic action provides a gas storage and transport framework.
In this study, the PV and SA characteristics of micropores, mesopores, and macropores were also calculated for shale reservoirs in different tectonic backgrounds (Figure 13 and Table 2). The CO2 adsorption experiments provide mainly micropore data, while the N2 adsorption experiments provide mainly mesopores and macropores data. The results show that the TPV is relatively large for different burials in the vertical direction. The TPV of slow tectonic shales is higher than that of strong tectonic deformation (Figure 13a,c). For the N31 well, the stronger the influence of right-slip tectonic movement, the greater the degree of tectonic deformation and the smaller the TPV. For micropores, the volume share of micropores in areas of strong tectonic deformation reaches an average of 14.23%, which is 10% higher than in tectonically gentle areas (Figure 13a). Due to the strong tectonic compression, most mesopores deform and increase the micropore volume proportion. Due to the influence of strike-slip faults, only 30% of the mesopore volume (2–10 nm) is strongly deformed, while the average percentage can reach 40% in wide and gentle structures (Figure 13b). All samples behaved similarly in large pores, representing 10% of the TPV. The micropores mainly contribute to the SA, while the contribution of the macropores is almost negligible (Figure 13b,d and Table 2). The SA of the samples from the different structural units did not obviously deviate, with an average of 12.64–13.51 m2/g (Figure 13c). Similar to PV, tectonically deformed strong shales have the highest percentage of micropore SA (72.87% on average) and the lowest percentage of mesopore SA (20.73% on average) (Figure 13d). The proportion of micropores is higher in shales with strong tectonic deformation than in wide and gentle tectonics in shales. The percentage of mesopore SA is highest in shales with wide and slow tectonics, averaging over 30%. In some of the mesopores and macropores, the percentage of pore SA of the different tectonic units is similar and around 5%. (Figure 13d).
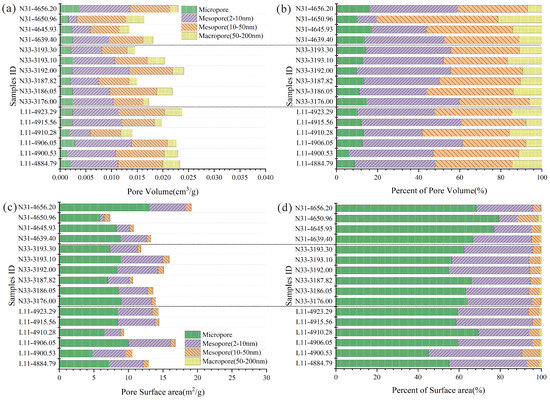
Figure 13.
SA, PV, and the proportion of micropores, mesopores, and macropores in shale samples from different tectonic contexts. (a) pore volume of micropores, mesopores and macropores in different tectonic background; (b) Percent pore volume of micropores, mesopores and macropores in different tectonic background; (c) surface area of micropores, mesopores and macropores in different tectonic background; (d) Percent surface area of micropores, mesopores and macropores in different tectonic background.
5.3. Effect of Tectonic Deformation on Shale Pore Heterogeneous
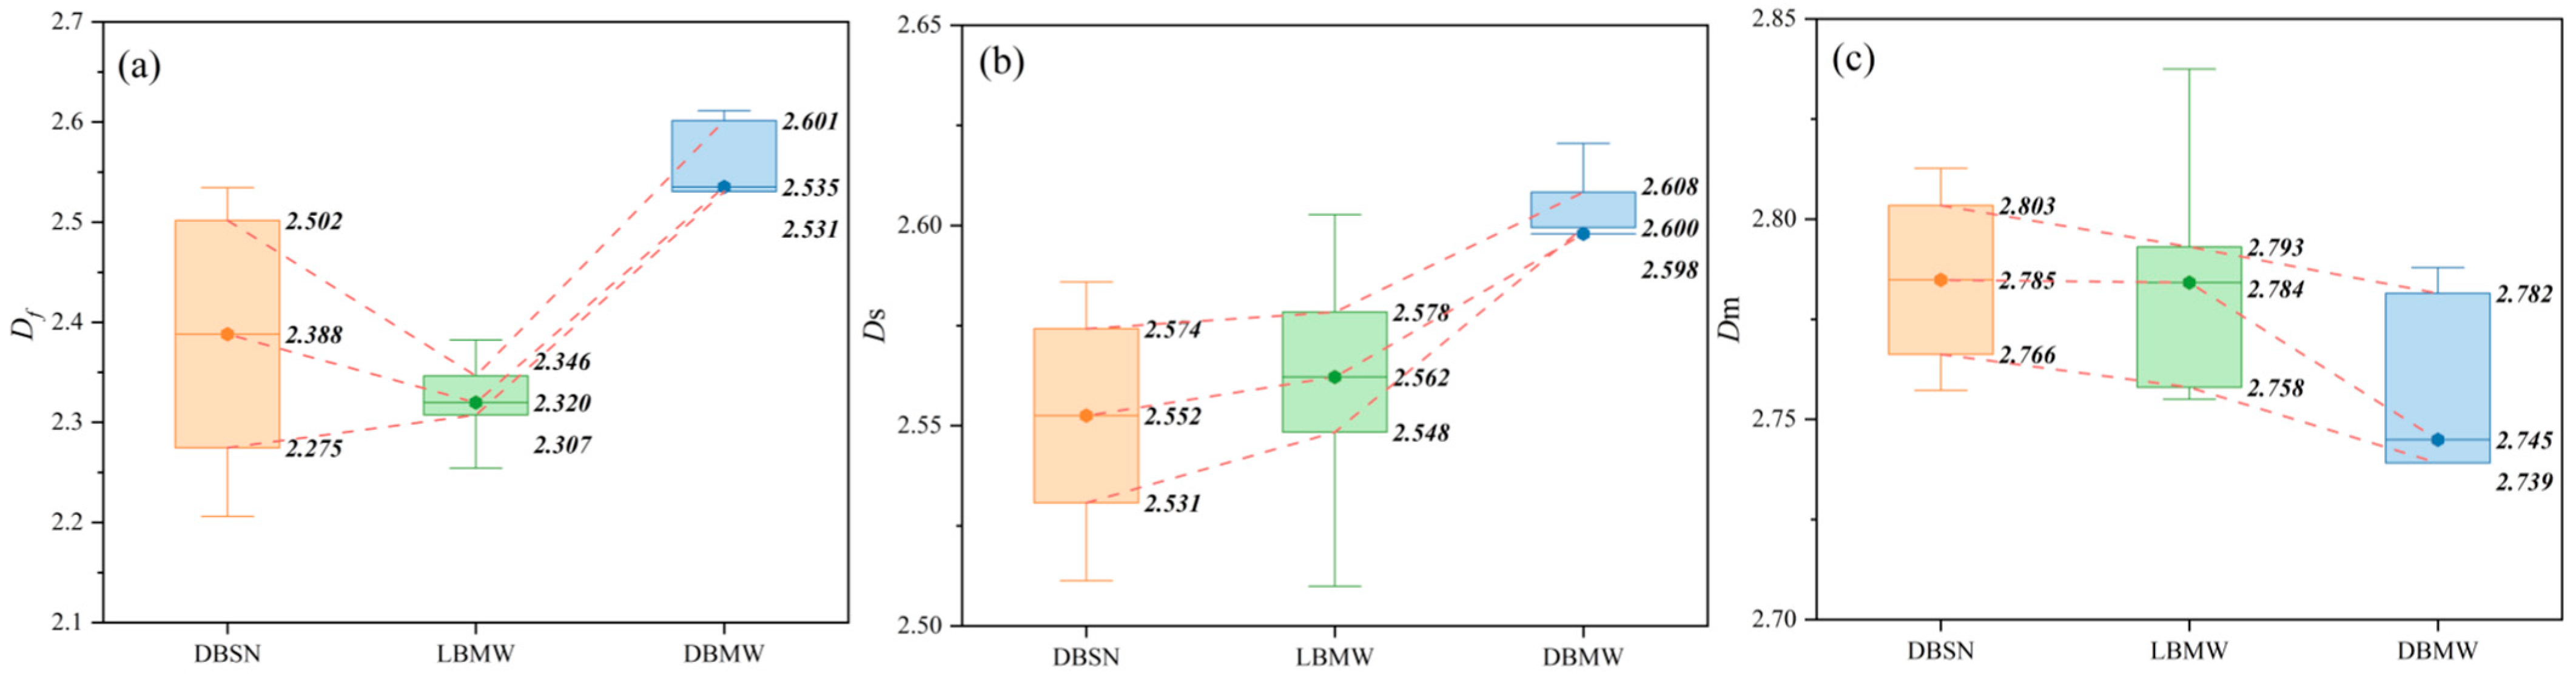
Under macropore tectonic movements, the pores of shale reservoirs are subjected to shear and compression stresses, resulting in changes to the pore structure of the matrix [19,20,23]. Considering the strong heterogeneity of shale reservoirs, the pore structure heterogeneity characteristics of shale reservoirs also change under different tectonic background conditions. (Figure 14) By calculating the fractal dimension of the micropores, the results show that the well with strong tectonic movements (Well N31) has a high degree of micropore heterogeneity (Figure 14a). In comparison, the LDSD structure has the lowest micropore heterogeneity. This result indicates that under micropore conditions, tectonic extrusion stresses can cause the deformation of many OM micropores, with some of the rounded pores being squeezed by clay and brittle minerals, enhancing micropore heterogeneity. The fractal dimension surface of the meso-macropores has similar characteristics, with the strongest deformation and the highest surface fractal dimension, indicating a high degree of surface roughness caused by strong tectonic forces (Figure 14b). This may be mainly related to the deformation of the brittle minerals under compression, forming a complex system of microfractures and pores. In areas of weak tectonic deformation, the degree of heterogeneous variation of surfaces area is low burial. For the shale matrix, the heterogeneity of the meso-macropores shows that samples with strong tectonic deformation possess a lower degree of pore matrix heterogeneity. In comparison, those with less tectonic deformation (Wells L11 and N33) have higher pore matrix heterogeneity (Figure 14c). Some of the clay pores are subjected to the same directional force within the clay particles under compression stress, resulting in a directionally oriented arrangement of the pores, decreasing the pore heterogeneity.
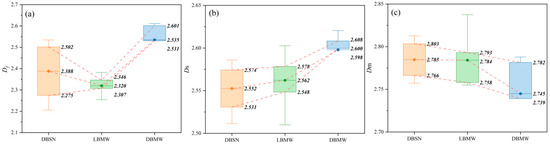
Figure 14.
Box plot of pore fractal dimension statistics for different tectonic units of the Longmaxi Formation. (a) fractal dimension of micropore; (b) fractal dimension of surface; (c) fractal dimension of matrix.
5.4. Synergistic Effect of Burial and Tectonic Deformation on Shale Gas Preservation
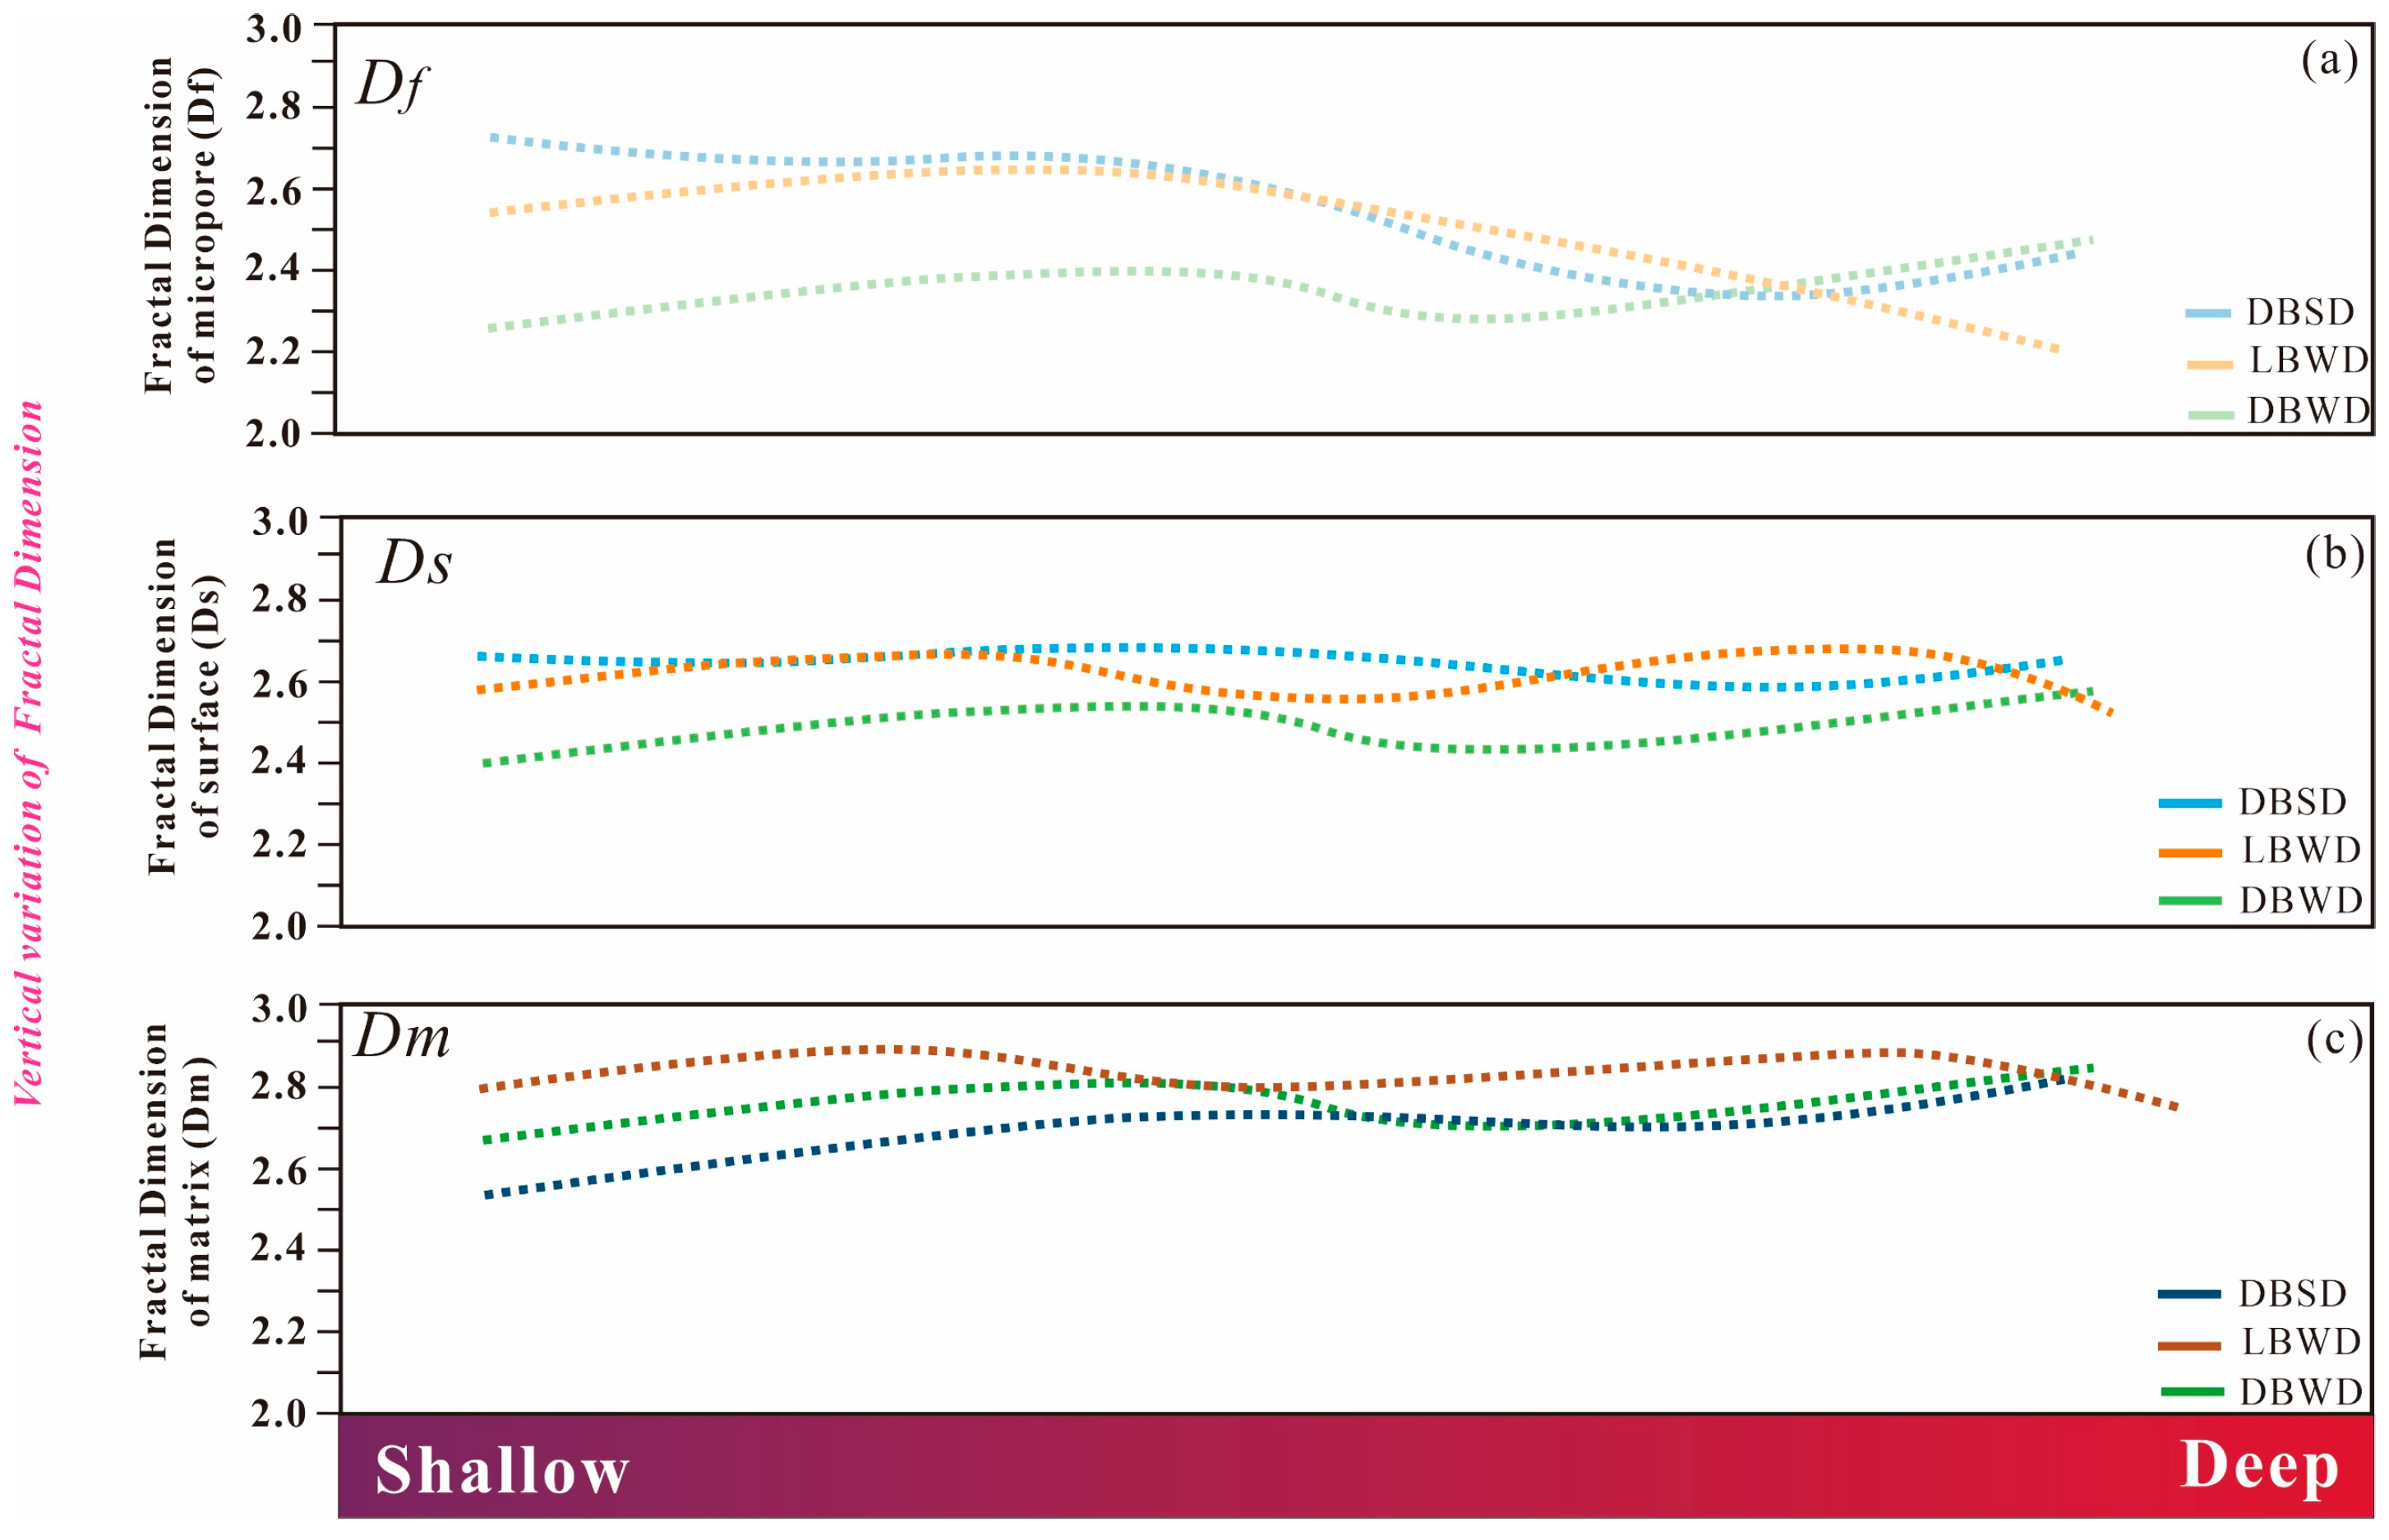
The heterogeneity of pores in shale reservoirs is influenced by tectonic deformation and burial. Analyzing pore heterogeneity under varying tectonic backgrounds and burial depths can elucidate dominant layers for different tectonic conditions. In deep burial conditions, Df gradually decreases with increasing burial depth, and micropore heterogeneity diminishes from 2.6 to 2.2. This trend is evident in Wells L11 and N31 (burial depth up to 4500 m) (Figure 15). The deep burial depth subjects most micropores to strong extrusion stresses, resulting in homogenization and flattening.
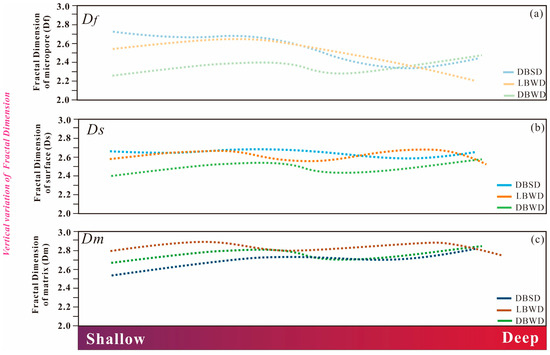
Figure 15.
Vertical distribution of the pore fractal dimension with different tectonic units in the Longmaxi Formation. (a) Vertical variation of fractal dimension of micropore; (b) Vertical variation of fractal dimension of surface; (c) Vertical variation of fractal dimension of matrix.
At shallow burial conditions, micropore heterogeneity within OM pores is less influenced by burial depth, and the trend of Df aligns with Ds and Dm. Pore heterogeneity (Ds and Dm) of meso-macropores exhibits strong consistency, with a pattern of variation from low to deep, showing an increasing, then decreasing, and then increasing trend. This variation may relate to differences in lithology and depositional setting rather than burial depth or tectonic action. Previous studies reveal lithofacies variation from deep to low, with siliceous shale, dolomite-bearing siliceous shale, clay-bearing siliceous shale, and clay shale lithofacies in the Longmaxi Formation [61]. Higher siliceous shale lithofacies increase SA and pore structure heterogeneity due to enhanced TOC content at the base, promoting meso-macropore heterogeneity [55]. Conversely, extensively developed clay minerals at the top reduce pore heterogeneity.
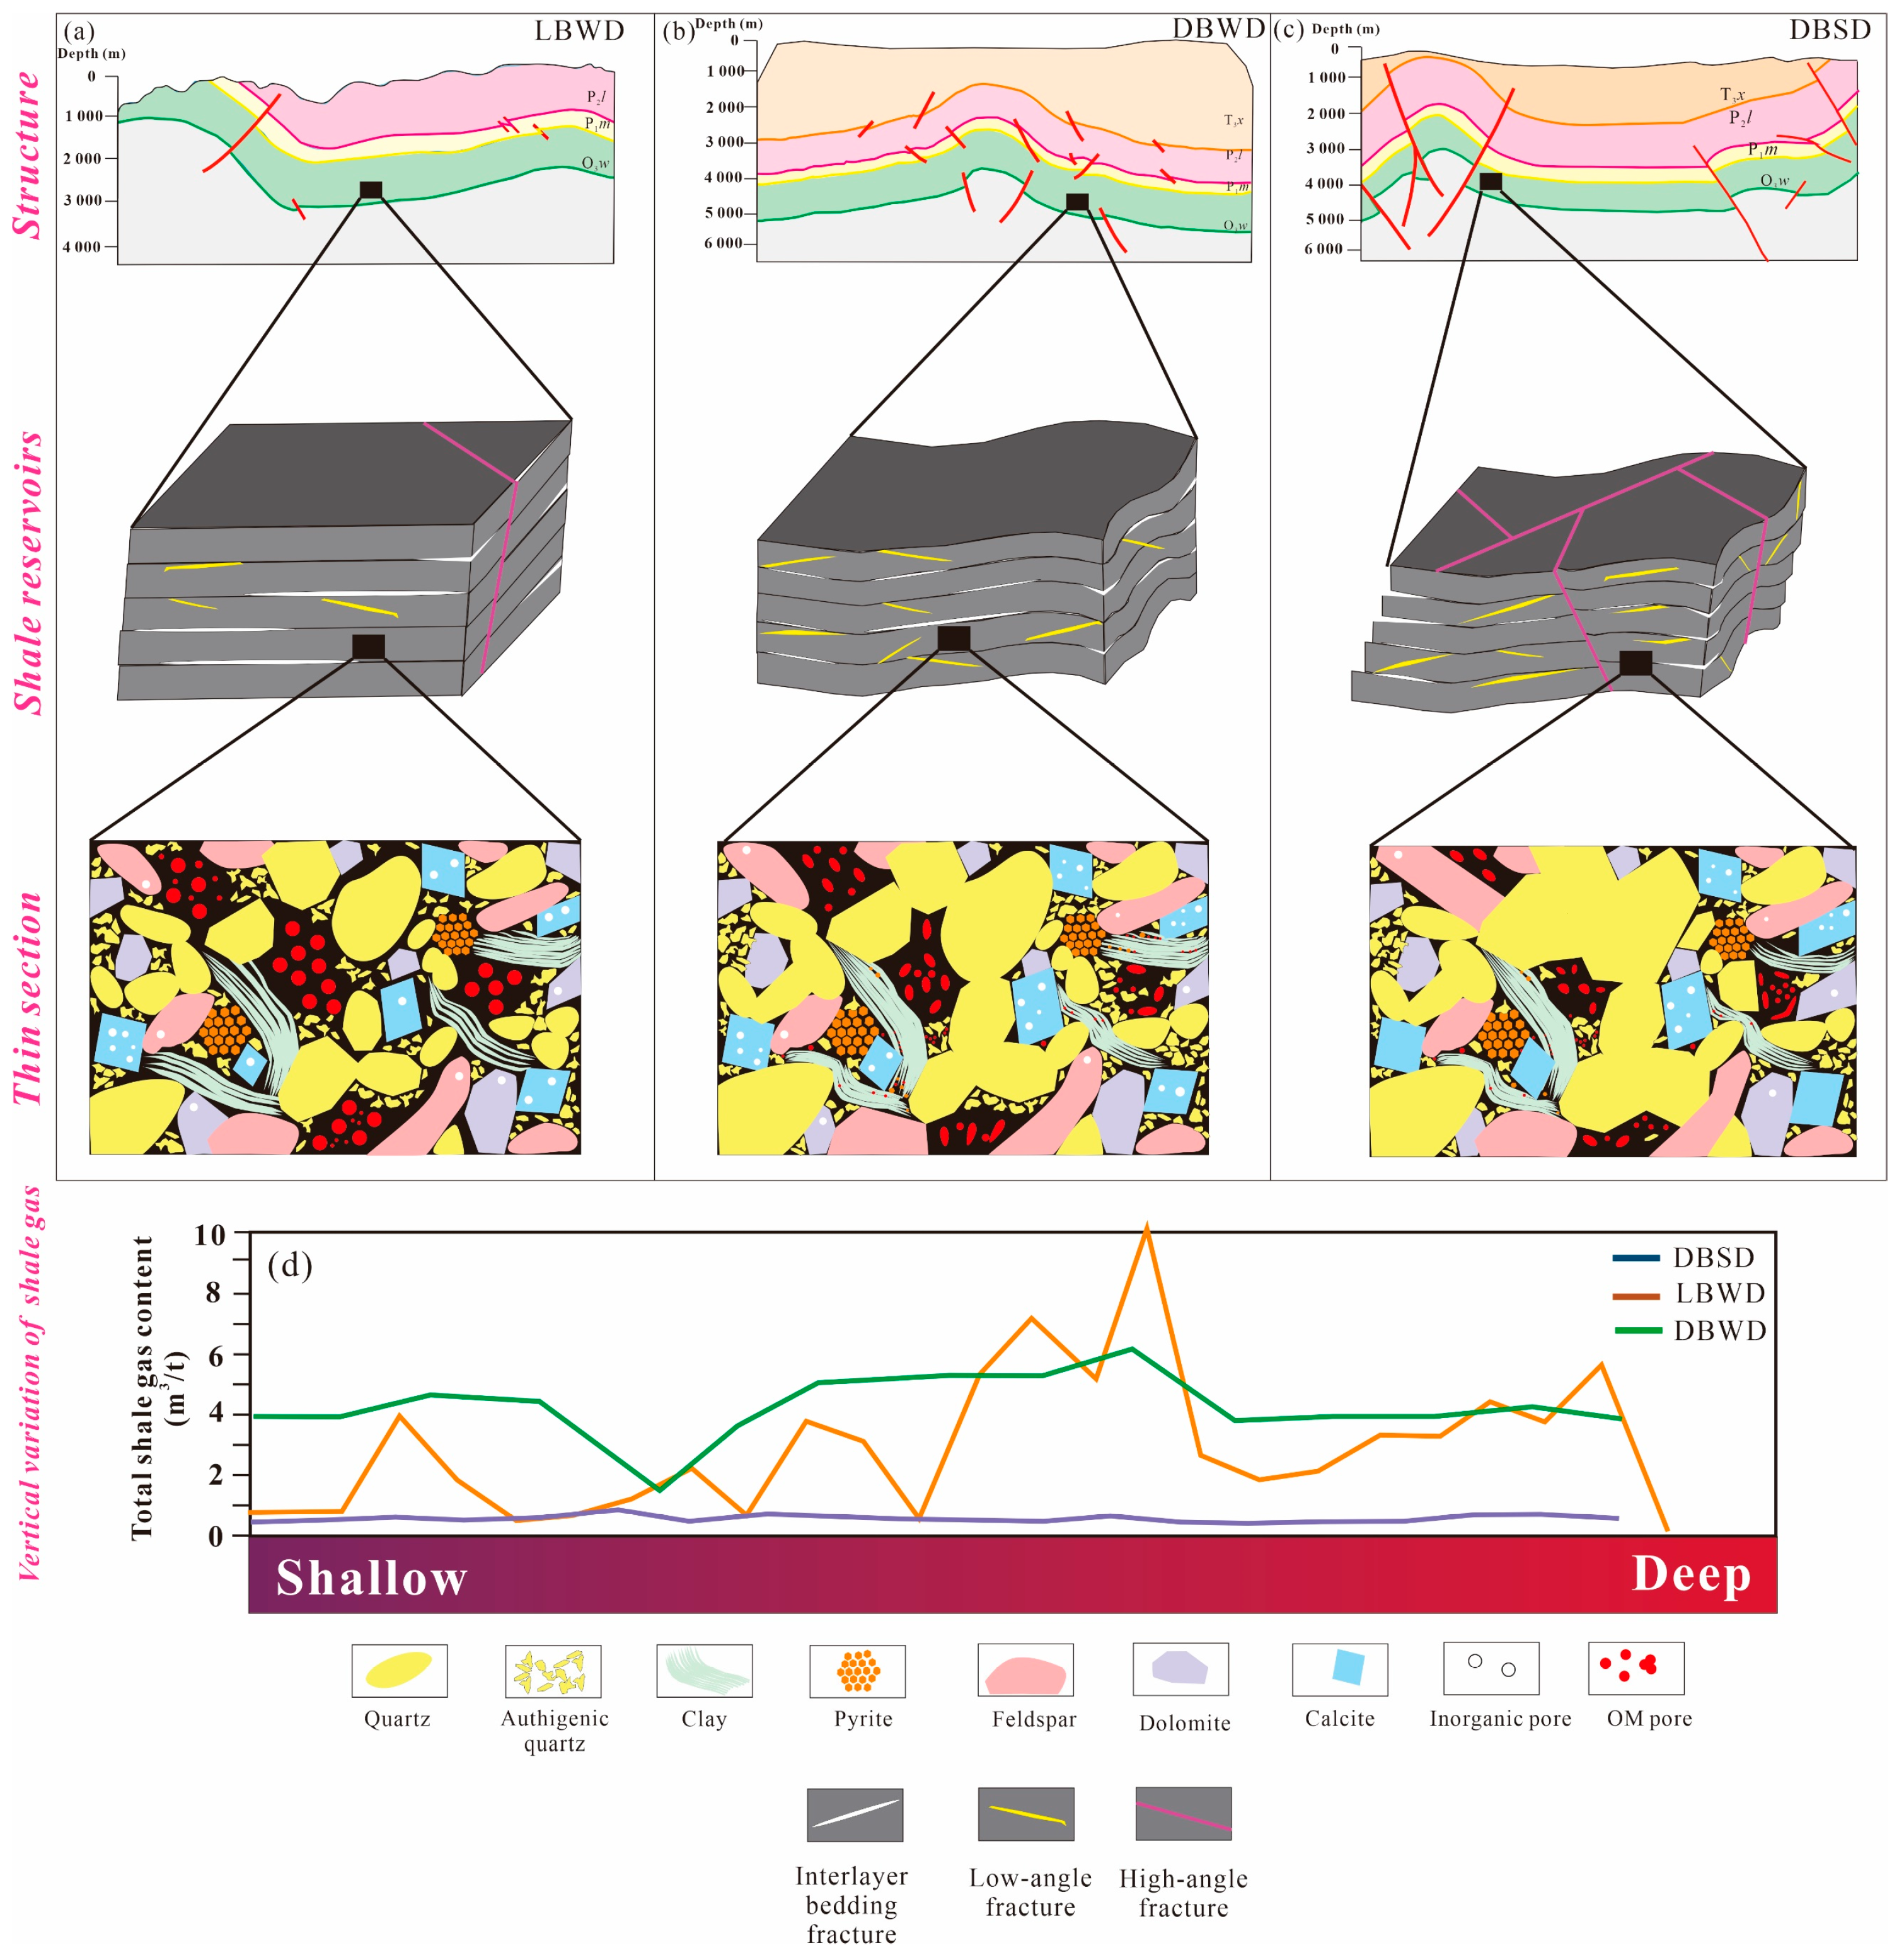
Gas content varies significantly across different tectonic backgrounds. More stable slope areas have measured gas content exceeding 3.0 m3/t. In contrast, slope regions close to the backslope exhibit substantial vertical variation in gas content, with some samples reaching 5.0 m3/t and most containing no gas. The stable area on the tectonic slope and shallow burial depth provide better conditions for shale gas preservation, enabling the preservation of overpressure formed by the gas reservoir (Figure 16) [10]. In contrast, areas close to the backslope experience gas-bearing dissipation due to the proximity of the Level 1 fracture zone and lateral compressional stresses, leading to significant vertical gas-bearing variation. The burial depth of Well N31 results in negligible original effective storage space for shale gas, and the influence of lateral slip structures deforms and fractures some pores, compromising gas preservation and yielding extremely low gas content (Figure 16).
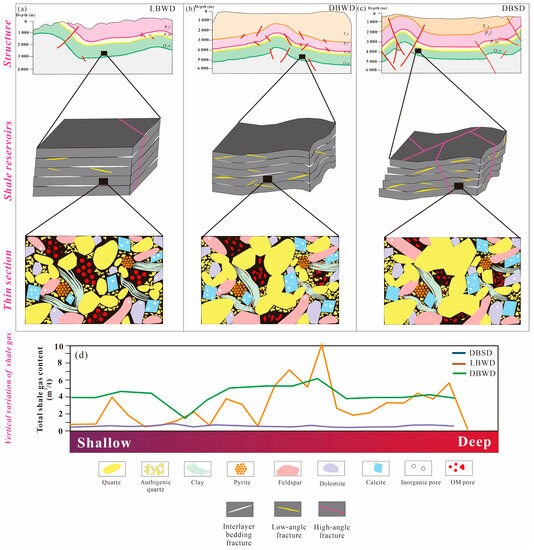
Figure 16.
Conceptual model and the vertical distribution of the shale content gas for different tectonic units of the Longmaxi Formation. (a) LBWD; (b) LBWD; (c) LBWD; (d) shale gas content vertical variation.
In summary, tectonic deformation and burial significantly impact shale reservoir pore heterogeneity and gas content distribution. Understanding these factors provides crucial insights for shale gas exploration and development.
6. Conclusions
This study investigates the pore structure characteristics of shales in diverse tectonic contexts in the Changning and Luzhou areas of the southern Sichuan Basin. Mineralogical, organic geochemical, and LP-N2/CO2 GA experiments, along with fractal theory, were employed for this purpose. The following findings were discussed:
Strong tectonic compression and deformation conditions lead to the compression and flattening of organic pores by brittle minerals, resulting in long, oriented OM pores. Fracturing of brittle particles creates multiple internal fracture systems linked to dissolution pores, forming a complex micro-fracture-pore network. Clay minerals are prone to folding or bending during tectonic deformation, producing pores of various diameters and shapes, including high-angle faults or fractures.
Shale cores from tectonically deformed regions exhibit lower PV and SA compared to weakly deformed shales. Tectonically deformed shales have the highest SA and PV of micropores, and the lowest for mesopores. Mesopores and macropores are more susceptible to geotectonic action than micropores. Strong tectonic deformation squeezes most mesopores, resulting in a higher percentage of micro-PV and SA.
Micropore heterogeneity is higher in shales subjected to strong tectonic movements, while gentle slopes in low burial regions exhibit the lowest heterogeneity. Strongly deformed areas have the highest Ds and lowest Dm. Df decreases significantly with increasing burial depth for larger burial depths; in contrast, fractal dimensions (Ds and Dm) of meso-macropores in low burial are aligned vertically.
Shale reservoirs in tectonically stable areas exhibit better gas content than those in regions of strong tectonic deformation. Under deep burial conditions, proximity to first-order fractures causes shale gas to dissipate, resulting in significant variation in vertical gas content; under low burial conditions, tectonically stable shale reservoirs offer better shale gas preservation conditions. Slip faults can extrude and deform shale pore space, compromising the original reservoir space and hindering shale gas enrichment.
Author Contributions
X.S.: Writing and Methodology, Data analyses. Z.L.: Writing and Methodology. Z.J.: Resources, Supervision, Project administration. Y.Y. and Y.L. (Yi Li): Resources and Supervision. Y.L. (Yanyou Li) and R.L.: Method and Writing. F.D.: Method, Resources. All authors have read and agreed to the published version of the manuscript.
Funding
Grateful acknowledgment is made for the financial support provided by the National Natural Science Foundation of China (No. 41872135, No. 42072151, No. 42272137), National Energy Shale Gas R & D (Experiment) Center Grant (No. 2022-KFKT-15) and the Strategic Cooperation Technology Projects of CNPC and CUPB (ZLZX2020-01).
Institutional Review Board Statement
Not applicable.
Informed Consent Statement
Not applicable.
Data Availability Statement
The data presented in this study are available upon request from the corresponding author. The data are not publicly available because some of the basic research involves confidentiality.
Acknowledgments
We are grateful to the editors and reviewers for their constructive comments and suggestions.
Conflicts of Interest
The authors declare that they have no known competing financial interests or personal relationships that could have appeared to influence the work reported in this paper.
Nomenclature
| DBSD | deeply buried strongly deformed |
| DBWD | deeply buried weakly deformed |
| LBWD | shallowly buried weakly deformed |
| BDS | brittle deformation shale |
| DDS | ductile deformation shale |
| XRD | X-ray diffraction |
| TOC | total organic carbon content |
| LP-N2/CO2GA | a low-pressure N2/CO2 adsorption experiment |
| Vm | molar volume of the liquid |
| R | universal gas content |
| T | absolute temperature |
| P/P0 | relative pressure |
| N(P/P0) | adsorption isotherm data |
| J(x) | pore size distribution function |
| Θ | micropore filling |
| Df | micropore fractal dimension |
| Ds | surface fractal dimension |
| Dm | matrix fractal dimensions |
| OM | organic matter |
| FHH | Frenkel-Halsey-Hill |
| BJH | Barret-Joyner-Halenda |
| DFT | density functional theory |
| SEM | scanning electron microscope |
| PV | pore volume |
| SA | surface area |
| TPV | total pore volume |
| TSA | total surface area |
| BET | Brunauer-Emmett-Teller |
| DA | Dubinin-Astakhow |
| DR | Dubinin-Radushkevich |
| PSD | pore size distribution |
References
- Chen, S.; Zhu, Y.; Wang, H.; Liu, H.; Wei, W.; Fang, J. Shale gas reservoir characterisation: A typical case in the southern Sichuan Basin of China. Energy 2011, 36, 6609–6616. [Google Scholar] [CrossRef]
- Zou, C.; Zhao, Q.; Dong, D.; Yang, Z.; Qiu, Z.; Liang, F.; Wang, N.; Huang, Y.; Duan, A.; Zhang, Q.; et al. Geological characteristics, main challenges and future prospect of shale gas. J. Nat. Gas Geosci. 2017, 2, 273–288. [Google Scholar] [CrossRef]
- Loucks, R.G.; Reed, R.M.; Ruppel, S.C.; Jarvie, D.M. Morphology, Genesis, and Distribution of Nanometer-Scale Pores in Siliceous Mudstones of the Mississippian Barnett Shale. J. Sediment. Res. 2009, 79, 848–861. [Google Scholar] [CrossRef]
- Slatt, R.M.; O’Brien, N.R. Pore types in the Barnett and Woodford gas shales: Contribution to understanding gas storage and migration pathways in fine-grained rocks. AAPG Bull. 2011, 95, 2017–2030. [Google Scholar] [CrossRef]
- Cheng, Y.; Chen, G.; Yin, Q.; Xia, C.; Wang, F.; Zhou, L.; Lu, P.; Ma, L. Exploration and development status of shale gas in china and enlightenment from north american prosperous shale gas. J. Kunming Metall. Coll. 2017, 33, 16. [Google Scholar] [CrossRef]
- Hao, F.; Zou, H.; Lu, Y. Mechanisms of shale gas storage: Implications for shale gas exploration in China. AAPG Bull. 2013, 97, 1325–1346. [Google Scholar] [CrossRef]
- Fu, C. China’s Shale Gas and Shale Oil Resources: Opportunities and Challenges. Energy Explor. Exploit. 2014, 32, 759–769. [Google Scholar] [CrossRef]
- Guo, T. Key geological issues and main controls on accumulation and enrichment of Chinese shale gas. Pet. Explor. Dev. 2016, 43, 349–359. [Google Scholar] [CrossRef]
- Guo, X.; Hu, D.; Li, Y.; Wei, Z.; Wei, X.; Liu, Z. Geological factors controlling shale gas enrichment and high production in Fuling shale gas field. Pet. Explor. Dev. 2017, 44, 513–523. [Google Scholar] [CrossRef]
- Jiang, Z.; Song, Y.; Tang, X.; Li, Z.; Wang, X.; Wang, G.; Xue, Z.; Li, X.; Zhang, K.; Chang, J.; et al. Controlling factors of marine shale gas differential enrichment in southern China. Pet. Explor. Dev. 2020, 47, 661–673. [Google Scholar] [CrossRef]
- Wang, Q.; Li, S.; Li, R. China’s dependency on foreign oil will exceed 80% by 2030: Developing a novel NMGM-ARIMA to forecast China’s foreign oil dependence from two dimensions. Energy 2018, 163, 151–167. [Google Scholar] [CrossRef]
- Dai, J.; Zou, C.; Liao, S.; Dong, D.; Ni, Y.; Huang, J.; Wu, W.; Gong, D.; Huang, S.; Hu, G. Geochemistry of the extremely high thermal maturity Longmaxi shale gas, southern Sichuan Basin. Org. Geochem. 2014, 74, 3–12. [Google Scholar] [CrossRef]
- Guo, X.; Li, Y.; Borjigen, T.; Wang, Q.; Yuan, T.; Shen, B.; Ma, Z.; Wei, F. Hydrocarbon generation and storage mechanisms of deep-water shelf shales of Ordovician Wufeng Formation-Silurian Longmaxi Formation in Sichuan Basin, China. Pet. Explor. Dev. 2020, 47, 204–213. [Google Scholar] [CrossRef]
- Tang, X.; Jiang, Z.; Song, Y.; Luo, Q.; Li, Z.; Wang, G.; Wang, X. Advances on the Mechanism of Reservoir Forming and Gas Accumulation of the Longmaxi Formation Shale in Sichuan Basin, China. Energy Fuels 2021, 35, 3972–3988. [Google Scholar] [CrossRef]
- Schieber, J. Common Themes in the Formation and Preservation of Intrinsic Porosity in Shales and Mudstones—Illustrated with Examples Across the Phanerozoic. In Proceedings of the SPE Unconventional Gas Conference, Pittsburgh, PA, USA, 23–25 February 2010. [Google Scholar]
- Hackley, P.C.; Cardott, B.J. Application of organic petrography in North American shale petroleum systems: A review. Int. J. Coal Geol. 2016, 163, 8–51. [Google Scholar] [CrossRef]
- Guo, T.; Zeng, P. The Structural and Preservation Conditions for Shale Gas Enrichment and High Productivity in the Wufeng—Longmaxi Formation, Southeastern Sichuan Basin. Energy Explor. Exploit. 2015, 33, 259–276. [Google Scholar] [CrossRef]
- He, Z.; Nie, H.; Li, S.; Luo, J.; Wang, H.; Zhang, G. Differential enrichment of shale gas in upper Ordovician and lower Silurian controlled by the plate tectonics of the Middle-Upper Yangtze, south China. Mar. Pet. Geol. 2020, 118, 104357. [Google Scholar] [CrossRef]
- Gou, Q.; Xu, S.; Hao, F.; Yang, F.; Shu, Z.; Liu, R. The effect of tectonic deformation and preservation condition on the shale pore structure using adsorption-based textural quantification and 3D image observation. Energy 2021, 219, 119579. [Google Scholar] [CrossRef]
- Ju, Y.; Sun, Y.; Tan, J.; Bu, H.; Han, K.; Li, X.; Fang, L. The composition, pore structure characterization and deformation mechanism of coal-bearing shales from tectonically altered coalfields in eastern China. Fuel 2018, 234, 626–642. [Google Scholar] [CrossRef]
- Li, Z.; Jiang, Z.; Liang, Z.; Yu, H.; Yang, Y. Pore-structure characterisation of tectonically deformed shales: A case study of Wufeng-Longmaxi Formation in western Hunan Province, southern China. Aust. J. Earth Sci. 2019, 66, 1075–1084. [Google Scholar] [CrossRef]
- Li, X.; Zhu, H.; Zhang, K.; Li, Z.; Yu, Y.; Feng, X.; Wang, Z. Pore characteristics and pore structure deformation evolution of ductile deformed shales in the Wufeng-Longmaxi Formation, southern China. Mar. Pet. Geol. 2021, 127, 104992. [Google Scholar] [CrossRef]
- Zhu, H.; Ju, Y.; Huang, C.; Han, K.; Qi, Y.; Shi, M.; Yu, K.; Feng, H.; Li, W.; Ju, L.; et al. Pore structure variations across structural deformation of Silurian Longmaxi Shale: An example from the Chuandong Thrust-Fold Belt. Fuel 2019, 241, 914–932. [Google Scholar] [CrossRef]
- Zhu, H.; Ju, Y.; Qi, Y.; Huang, C.; Zhang, L. Impact of tectonism on pore type and pore structure evolution in organic-rich shale: Implications for gas storage and migration pathways in naturally deformed rocks. Fuel 2018, 228, 272–289. [Google Scholar] [CrossRef]
- Wang, X.; Cheng, Y.; Zhang, D.; Liu, Z.; Wang, Z.; Jiang, Z. Influence of tectonic evolution on pore structure and fractal characteristics of coal by low pressure gas adsorption. J. Nat. Gas Sci. Eng. 2021, 87, 103788. [Google Scholar] [CrossRef]
- Liang, Z.; Jiang, Z.; Li, Z.; Song, Y.; Gao, F.; Liu, X.; Xiang, S. Nanopores Structure and Multifractal Characterization of Bulk Shale and Isolated Kerogen—An Application in Songliao Basin, China. Energy Fuels 2021, 35, 5818–5842. [Google Scholar] [CrossRef]
- Tang, X.; Jiang, Z.; Li, Z.; Gao, Z.; Bai, Y.; Zhao, S.; Feng, J. The effect of the variation in material composition on the heterogeneous pore structure of high-maturity shale of the Silurian Longmaxi formation in the southeastern Sichuan Basin, China. J. Nat. Gas Sci. Eng. 2015, 23, 464–473. [Google Scholar] [CrossRef]
- Wang, G. Deformation of organic matter and its effect on pores in mud rocks. AAPG Bull. 2020, 103, 21–36. [Google Scholar] [CrossRef]
- Zhang, Y.; Yu, B.; Pan, Z.; Hou, C.; Zuo, Q.; Sun, M. Effect of thermal maturity on shale pore structure: A combined study using extracted organic matter and bulk shale from Sichuan Basin, China. J. Nat. Gas Sci. Eng. 2020, 74, 103089. [Google Scholar] [CrossRef]
- Tang, X.; Jiang, Z.; Jiang, S.; Li, Z. Heterogeneous nanoporosity of the Silurian Longmaxi Formation shale gas reservoir in the Sichuan Basin using the QEMSCAN, FIB-SEM, and nano-CT methods. Mar. Pet. Geol. 2016, 78, 99–109. [Google Scholar] [CrossRef]
- Eliyahu, M.; Emmanuel, S.; Day-Stirrat, R.J.; Macaulay, C.I. Mechanical properties of organic matter in shales mapped at the nanometer scale. Mar. Pet. Geol. 2015, 59, 294–304. [Google Scholar] [CrossRef]
- Kumar, V.; Curtis, M.E.; Gupta, N.; Sondergeld, C.H.; Rai, C.S. Estimation of Elastic Properties of Organic Matter and Woodford Shale Through Nano-indentation Measurements. In Proceedings of the SPE Canadian Unconventional Resources Conference, Calgary, AB, Canada, 30 October–1 November 2012. [Google Scholar]
- Meng, M.; Ge, H.; Shen, Y.; Ji, W.; Li, Z. Insight into Water Occurrence and Pore Size Distribution by Nuclear Magnetic Resonance in Marine Shale Reservoirs, Southern China. Energy Fuels 2022, 37, 319–327. [Google Scholar] [CrossRef]
- Meng, M.; Peng, J.; Ge, H.; Ji, W.; Li, X.; Wang, Q. Rock Fabric of Lacustrine Shale and Its Influence on Residual Oil Distribution in the Upper Cretaceous Qingshankou Formation, Songliao Basin. Energy Fuels 2023, 37, 7151–7160. [Google Scholar] [CrossRef]
- Wang, M.; Li, Z.; Liang, Z.; Jiang, Z.; Wu, W. Method Selection for Analyzing the Mesopore Structure of Shale—Using a Combination of Multifractal Theory and Low-Pressure Gas Adsorption. Energies 2023, 16, 2464. [Google Scholar] [CrossRef]
- Liang, Z.; Jiang, Z.; Han, Y.; Wang, B.; Wu, W.; Li, Z.; Li, Y.; Xue, Z. A Modified Dent-Fractal Mathematical Model to Investigate the Water Vapor Adsorption on Nanopore Structure Heterogeneity from the Longmaxi Shale, Sichuan Basin, China. Energy Fuels 2023, 37, 9131–9150. [Google Scholar] [CrossRef]
- Liang, M.; Wang, Z.; Gao, L.; Li, C.; Li, H. Evolution of pore structure in gas shale related to structural deformation. Fuel 2017, 197, 310–319. [Google Scholar] [CrossRef]
- Ma, Y.; Ardakani, O.H.; Zhong, N.; Liu, H.; Huang, H.; Larter, S.; Zhang, C. Possible pore structure deformation effects on the shale gas enrichment: An example from the Lower Cambrian shales of the Eastern Upper Yangtze Platform, South China. Int. J. Coal Geol. 2020, 217, 103349. [Google Scholar] [CrossRef]
- Sun, W.; Zuo, Y.; Wang, S.; Wu, Z.; Liu, H.; Zheng, L.; Lou, Y. Pore structures of shale cores in different tectonic locations in the complex tectonic region: A case study of the Niutitang Formation in Northern Guizhou, Southwest China. J. Nat. Gas Sci. Eng. 2020, 80, 103398. [Google Scholar] [CrossRef]
- Zhang, G.; Guo, A.; Wang, Y.; Li, S.; Dong, Y.; Liu, S.; He, D.; Cheng, S.; Lu, R.; Yao, A. Tectonics of South China continent and its implications. Sci. China Earth Sci. 2013, 56, 1804–1828. [Google Scholar] [CrossRef]
- Li, X.; Jiang, Z.; Jiang, S.; Li, Z.; Song, Y.; Jiang, H.; Cao, X.; Qiu, H.; Huang, Y.; Ming, W.; et al. Characteristics of matrix-related pores associated with various lithofacies of marine shales inside of Guizhong Basin, South China. J. Pet. Sci. Eng. 2020, 185, 106671. [Google Scholar] [CrossRef]
- Li, X.; Wang, J.; Li, Z.; Zhang, K.; Feng, X.; Wang, Z. Impact of Brittle Deformation on Pore Structure Evolution in Shale: Samples Collected from Different Fault Positions. Energy Fuels 2022, 36, 1441–1456. [Google Scholar] [CrossRef]
- Liu, R.; Zheng, J.; Hao, F.; Nie, Z.; Heng, D.; Tan, X.; Jiang, D. Variation in pore systems with tectonic stress in the overthrust Wufeng-Longmaxi shale of the southern Sichuan Basin, China. J. Nat. Gas Sci. Eng. 2020, 83, 103617. [Google Scholar] [CrossRef]
- Shang, F.; Zhu, Y.; Hu, Q.; Zhu, Y.; Wang, Y.; Du, M.; Liu, R.; Han, Y. Characterization of methane adsorption on shale of a complex tectonic area in Northeast Guizhou, China: Experimental results and geological significance. J. Nat. Gas Sci. Eng. 2020, 84, 103676. [Google Scholar] [CrossRef]
- Xiao, X.; Zhou, Q.; Cheng, P.; Sun, J.; Liu, D.; Tian, H. Thermal maturation as revealed by micro-Raman spectroscopy of mineral-organic aggregation (MOA) in marine shales with high and over maturities. Sci. China Earth Sci. 2020, 63, 1540–1552. [Google Scholar] [CrossRef]
- Dubinin, M.M.; Stoeckli, H.F. Homogeneous and heterogeneous micropore structures in carbonaceous adsorbents. J. Colloid Interface Sci. 1980, 75, 34–42. [Google Scholar] [CrossRef]
- Jaroniec, M.; Lu, X.; Madey, R.; Choma, J. Evaluation of structural heterogeneities and surface irregularities of microporous solids. Mater. Chem. Phys. 1990, 26, 87–97. [Google Scholar] [CrossRef]
- Stoeckli, H.F.; Ballerini, L.; De Bernardini, S. On the evolution of micropore widths and areas in the course of activation. Carbon 1989, 27, 501–502. [Google Scholar] [CrossRef]
- Xiong, Y.H.; Zhou, S.W.; Jiao, P.F.; Yang, M.W.; Zhou, J.P.; Wei, W.E.I.; Cai, J.C. Fractal Analysis of Micropore Structure in Coal and Shale Based on Low-Temperature CO2 Adsorption. Nat. Gas Geosci. 2020, 31, 1028–1040. [Google Scholar] [CrossRef]
- Wang, P.; Jiang, Z.; Yin, L.; Chen, L.; Li, Z.; Zhang, C.; Li, T.; Huang, P. Lithofacies classification and its effect on pore structure of the Cambrian marine shale in the Upper Yangtze Platform, South China: Evidence from FE-SEM and gas adsorption analysis. J. Pet. Sci. Eng. 2017, 156, 307–321. [Google Scholar] [CrossRef]
- Wang, X.; Liu, L.; Wang, Y.; Sheng, Y.; Zheng, S.; Wu, W.; Luo, Z. Comparison of the pore structures of Lower Silurian Longmaxi Formation shales with different lithofacies in the southern Sichuan Basin, China. J. Nat. Gas Sci. Eng. 2020, 81, 103419. [Google Scholar] [CrossRef]
- Zeng, L.; Lyu, W.; Li, J.; Zhu, L.; Weng, J.; Yue, F.; Zu, K. Natural fractures and their influence on shale gas enrichment in Sichuan Basin, China. J. Nat. Gas Sci. Eng. 2016, 30, 1–9. [Google Scholar] [CrossRef]
- Brunauer, S.; Deming, L.S.; Deming, W.E.; Teller, E. On a Theory of the van der Waals Adsorption of Gases. J. Am. Chem. Soc. 1940, 62, 1723–1732. [Google Scholar] [CrossRef]
- Sing, K.S.W. Reporting physisorption data for gas/solid systems with special reference to the determination of surface area and porosity (Recommendations 1984). Pure Appl. Chem. 1985, 57, 603–619. [Google Scholar] [CrossRef]
- Ji, W.; Song, Y.; Jiang, Z.; Meng, M.; Liu, Q.; Chen, L.; Wang, P.; Gao, F.; Huang, H. Fractal characteristics of nano-pores in the Lower Silurian Longmaxi shales from the Upper Yangtze Platform, south China. Mar. Pet. Geol. 2016, 78, 88–98. [Google Scholar] [CrossRef]
- Loucks, R.G.; Reed, R.M.; Ruppel, S.C.; Hammes, U. Spectrum of pore types and networks in mudrocks and a descriptive classification for matrix-related mudrock pores. AAPG Bull. 2012, 96, 1071–1098. [Google Scholar] [CrossRef]
- Ma, Y.; Zhong, N.; Li, D.; Pan, Z.; Cheng, L.; Liu, K. Organic matter/clay mineral intergranular pores in the Lower Cambrian Lujiaping Shale in the north-eastern part of the upper Yangtze area, China: A possible microscopic mechanism for gas preservation. Int. J. Coal Geol. 2015, 137, 38–54. [Google Scholar] [CrossRef]
- Dong, T.; He, Q.; He, S.; Zhai, G.; Zhang, Y.; Wei, S.; Wei, C.; Hou, Y.; Guo, X. Quartz types, origins and organic matter-hosted pore systems in the lower cambrian Niutitang Formation, middle yangtze platform, China. Mar. Pet. Geol. 2021, 123, 104739. [Google Scholar] [CrossRef]
- Barrett, E.P.; Joyner, L.G.; Halenda, P.P. The Determination of Pore Volume and Area Distributions in Porous Substances. I. Computations from Nitrogen Isotherms. J. Am. Chem. Soc. 2002, 73, 373–380. [Google Scholar] [CrossRef]
- Morley, C.K.; von Hagke, C.; Hansberry, R.; Collins, A.; Kanitpanyacharoen, W.; King, R. Review of major shale-dominated detachment and thrust characteristics in the diagenetic zone: Part II, rock mechanics and microscopic scale. Earth-Sci. Rev. 2018, 176, 19–50. [Google Scholar] [CrossRef]
- Wu, L.; Hu, D.; Lu, Y.; Liu, R.; Liu, X. Advantageous shale lithofacies of Wufeng Formation-Longmaxi Formation in Fuling gas field of Sichuan Basin, SW China. Pet. Explor. Dev. 2016, 43, 208–217. [Google Scholar] [CrossRef]


Disclaimer/Publisher’s Note: The statements, opinions and data contained in all publications are solely those of the individual author(s) and contributor(s) and not of MDPI and/or the editor(s). MDPI and/or the editor(s) disclaim responsibility for any injury to people or property resulting from any ideas, methods, instructions or products referred to in the content. |
© 2023 by the authors. Licensee MDPI, Basel, Switzerland. This article is an open access article distributed under the terms and conditions of the Creative Commons Attribution (CC BY) license (https://creativecommons.org/licenses/by/4.0/).