

Research on the Calculation Method for the Wellbore Temperature of Hot Nitrogen Gas Circulation Wax Removal and Plug Removal in Offshore Oil Fields
Abstract
:1. Introduction
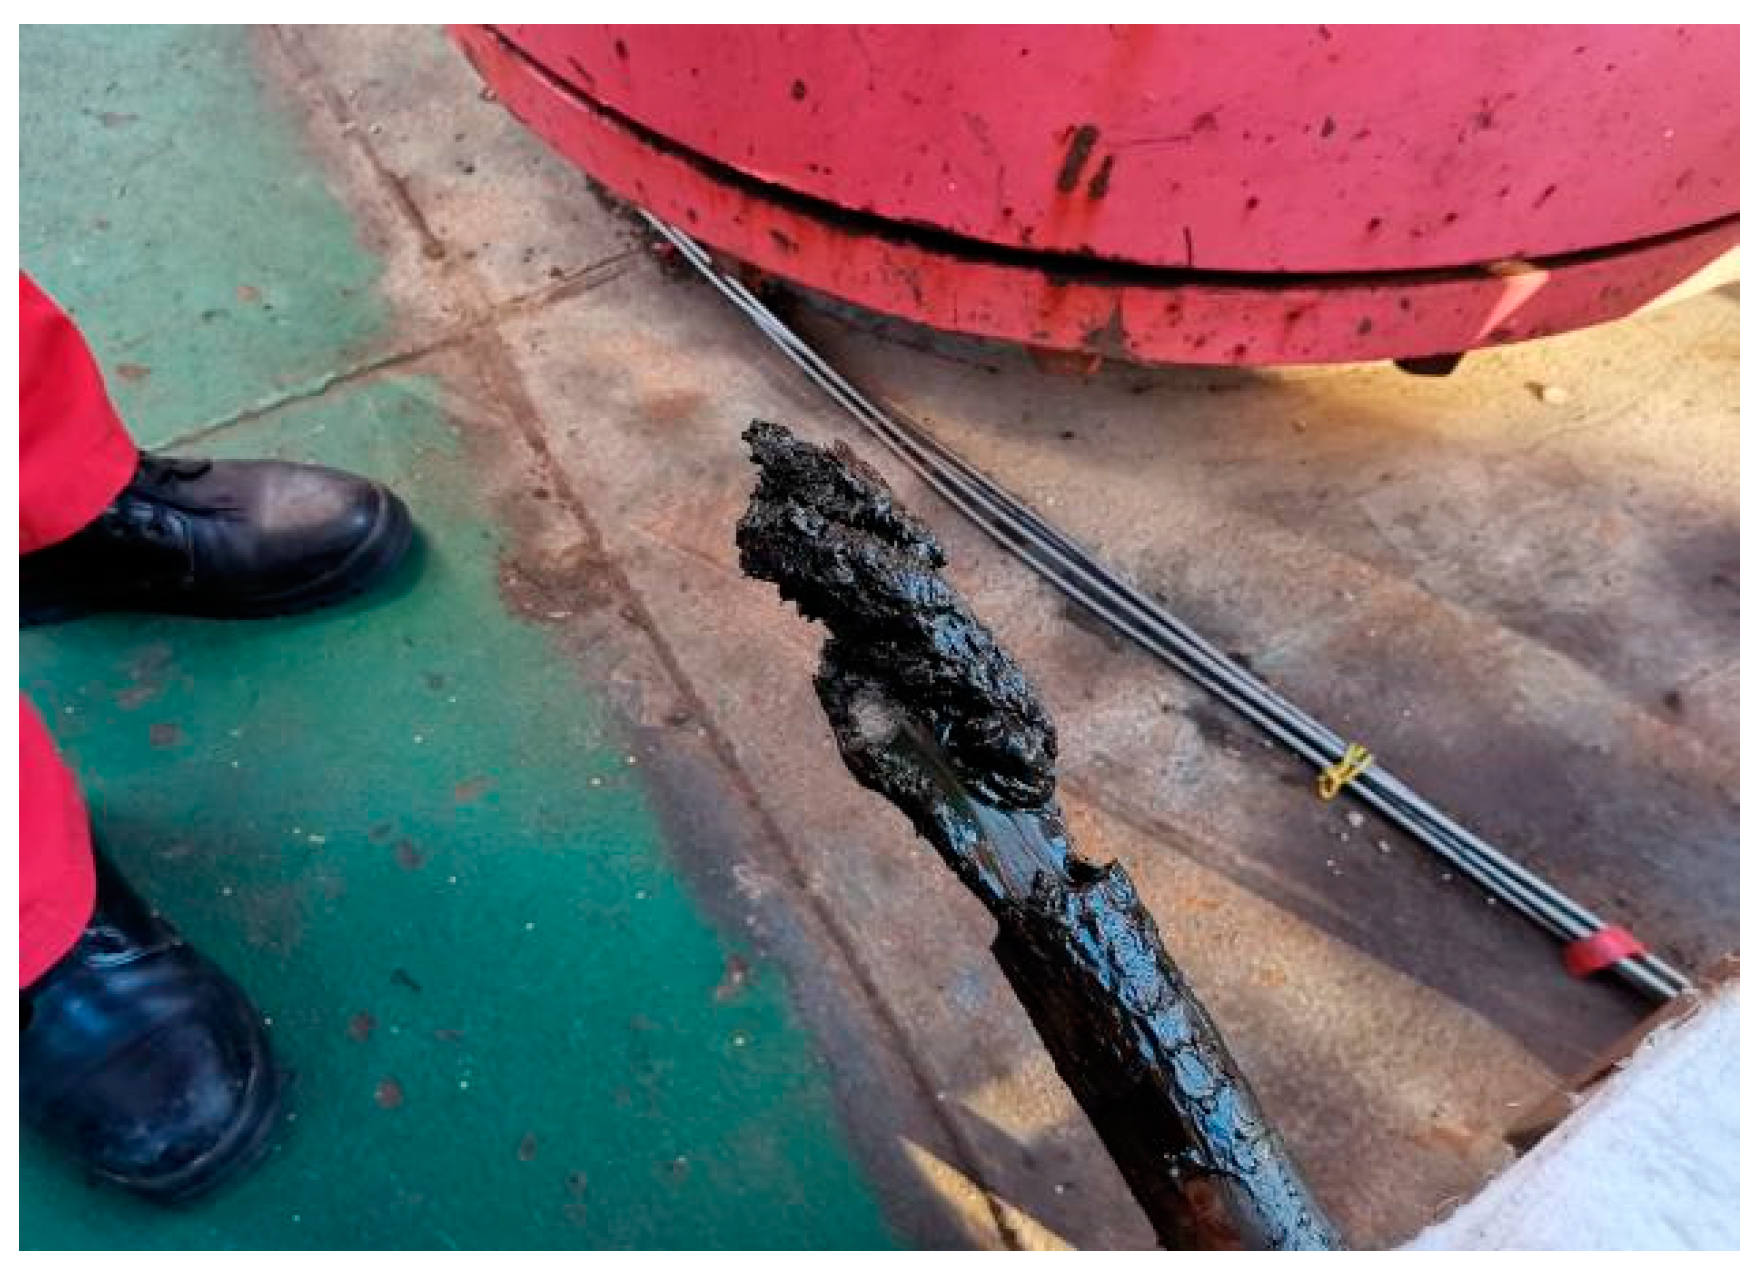
1.1. Waxing of Oil Wells
1.1.1. Molecular Diffusion
1.1.2. Brownian Diffusion
1.1.3. Shear Dispersion
1.1.4. Gravity Settling
1.2. Wax Removal and Plug Removal Method
1.2.1. Thermal Process of Wax Removal and Plug Removal
1.2.2. Physical Process of Wax Removal and Plug Removal
1.2.3. Electromagnetic Process of Wax Removal and Plug Removal
1.2.4. Chemical Process of Wax Removal and Plug Removal
1.2.5. Microbiological Process of Wax Removal and Plug Removal
1.3. Wellbore Temperature Calculation Method
2. Crude Oil Wax Extraction Testing
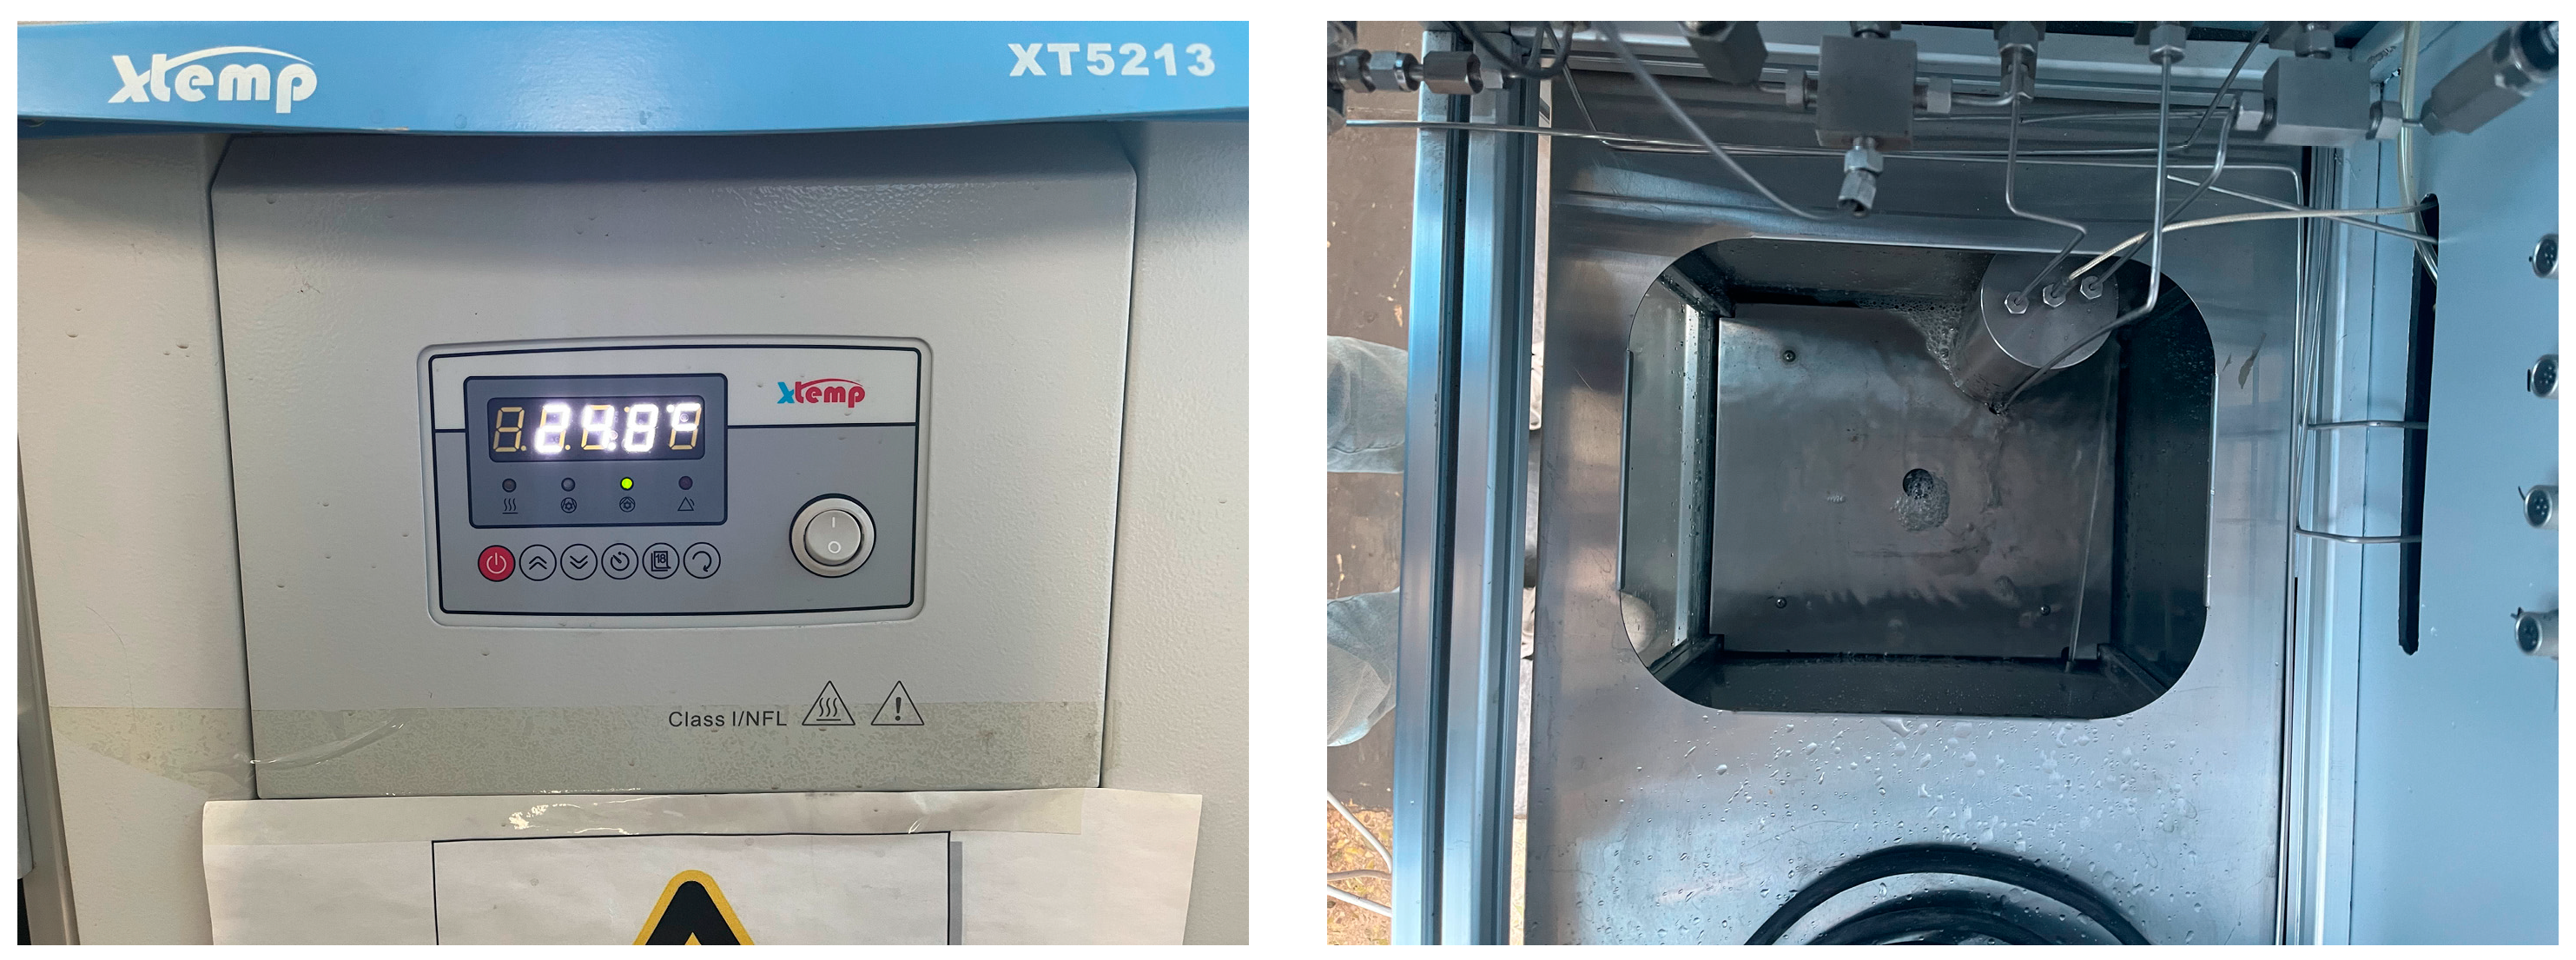
2.1. Experimental Equipment
- (1)
- Temperature control range: −5–90 °C
- (2)
- Temperature fluctuation: ±0.1 °C
- (3)
- Temperature resolution: 0.1 °C
- (4)
- Temperature rising rate: 0.1–20 °C/min
- (5)
- Temperature cooling rate: 0.1–10 °C/min
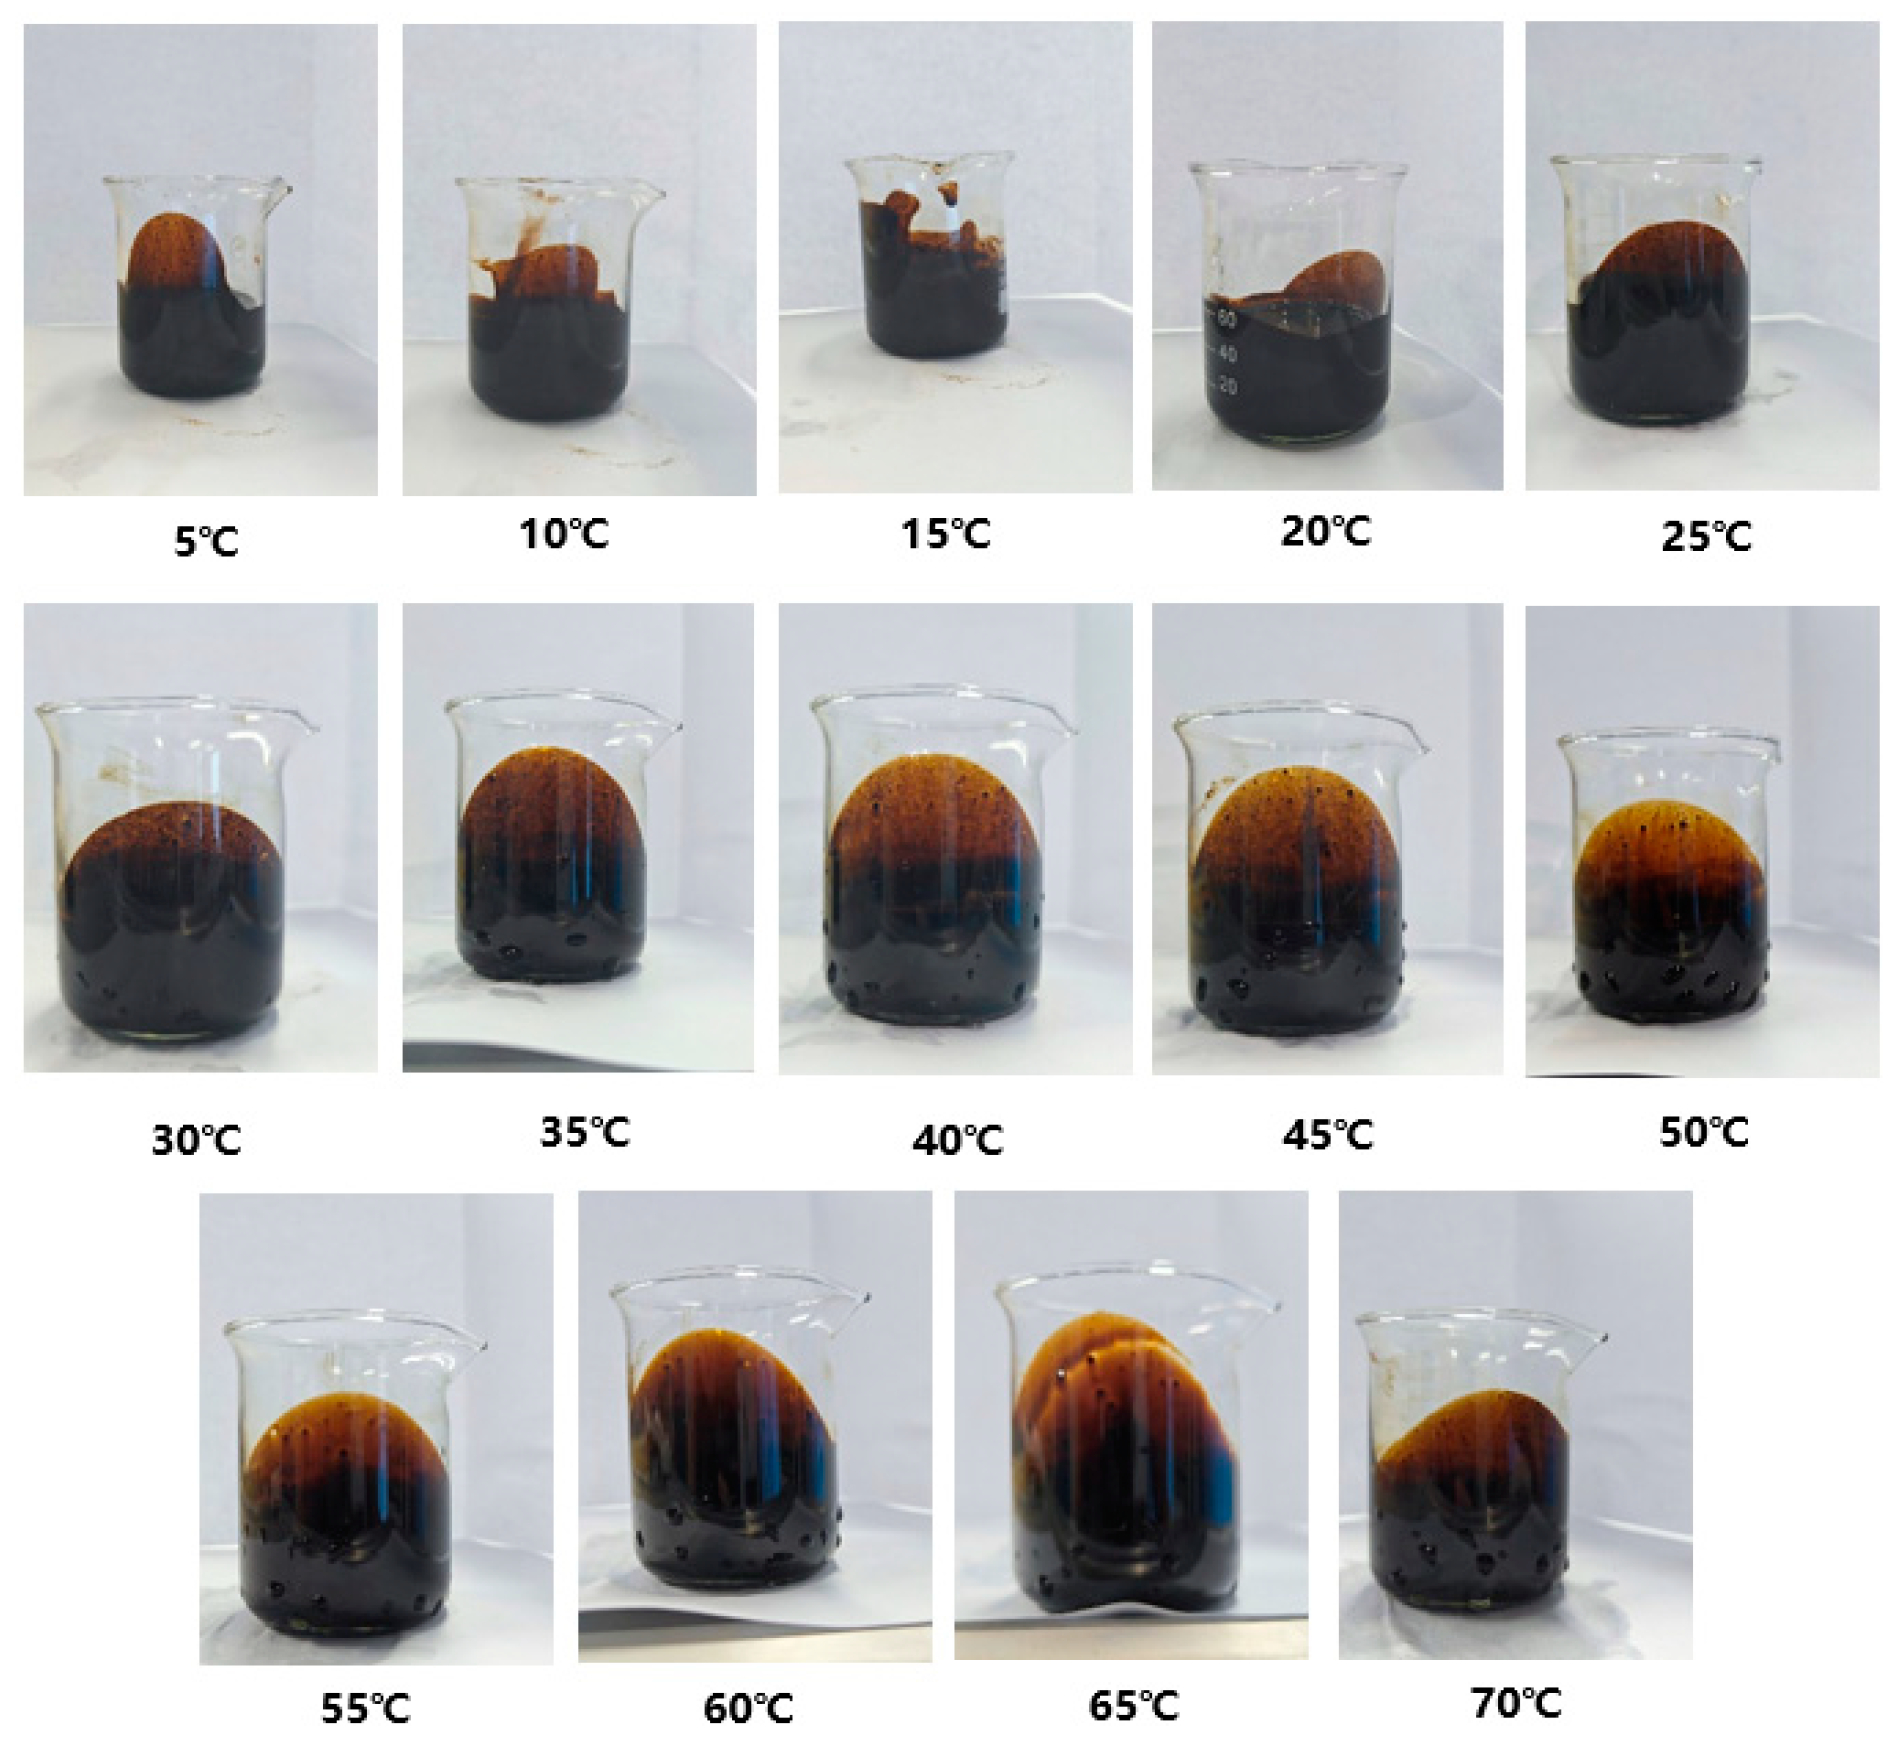
2.2. Experimental Procedure and Experimental Results
- (1)
- Check that the equipment and the power supply to the experimental equipment are normal;
- (2)
- Make a 7:3 ratio of industrial alcohol to pure water and pour it into the water bath box;
- (3)
- Turn on the water bath experimental equipment, set the temperature of the water bath box to −5 °C, and wait for the temperature of the water bath box to drop to the set temperature;
- (4)
- Pour 50 mL of crude oil sample into the beaker and place it smoothly in the water bath box;
- (5)
- Leave the crude oil sample for 10 min and wait for the crude oil temperature to drop to the set temperature;
- (6)
- Set the temperature of the water bath box, so that the water bath box begins to warm up, every 5 °C to record changes in the crude oil samples and shoot a video;
- (7)
- Record the maximum temperature of the water bath box so that the water bath box is able to cool down, with cooling every 5 °C to record the changes in the crude oil samples, and take photos of the changes in the crude oil;
- (8)
- Record the wax precipitation of the crude oil at different temperatures in the water bath.
3. Calculation Model of Wellbore Temperature Field for Hot Nitrogen Cycling
3.1. Heat Transfer Analysis
3.1.1. Heat Convection Model
3.1.2. Heat Conduction Model
3.2. Thermodynamic Calculation Model
3.2.1. Tubing Heat Transfer Model
3.2.2. Annulus Heat Transfer Model
3.3. Hot Nitrogen Cycle Temperature Distribution
3.3.1. Effect of Injection Pressure on Wellbore Temperature
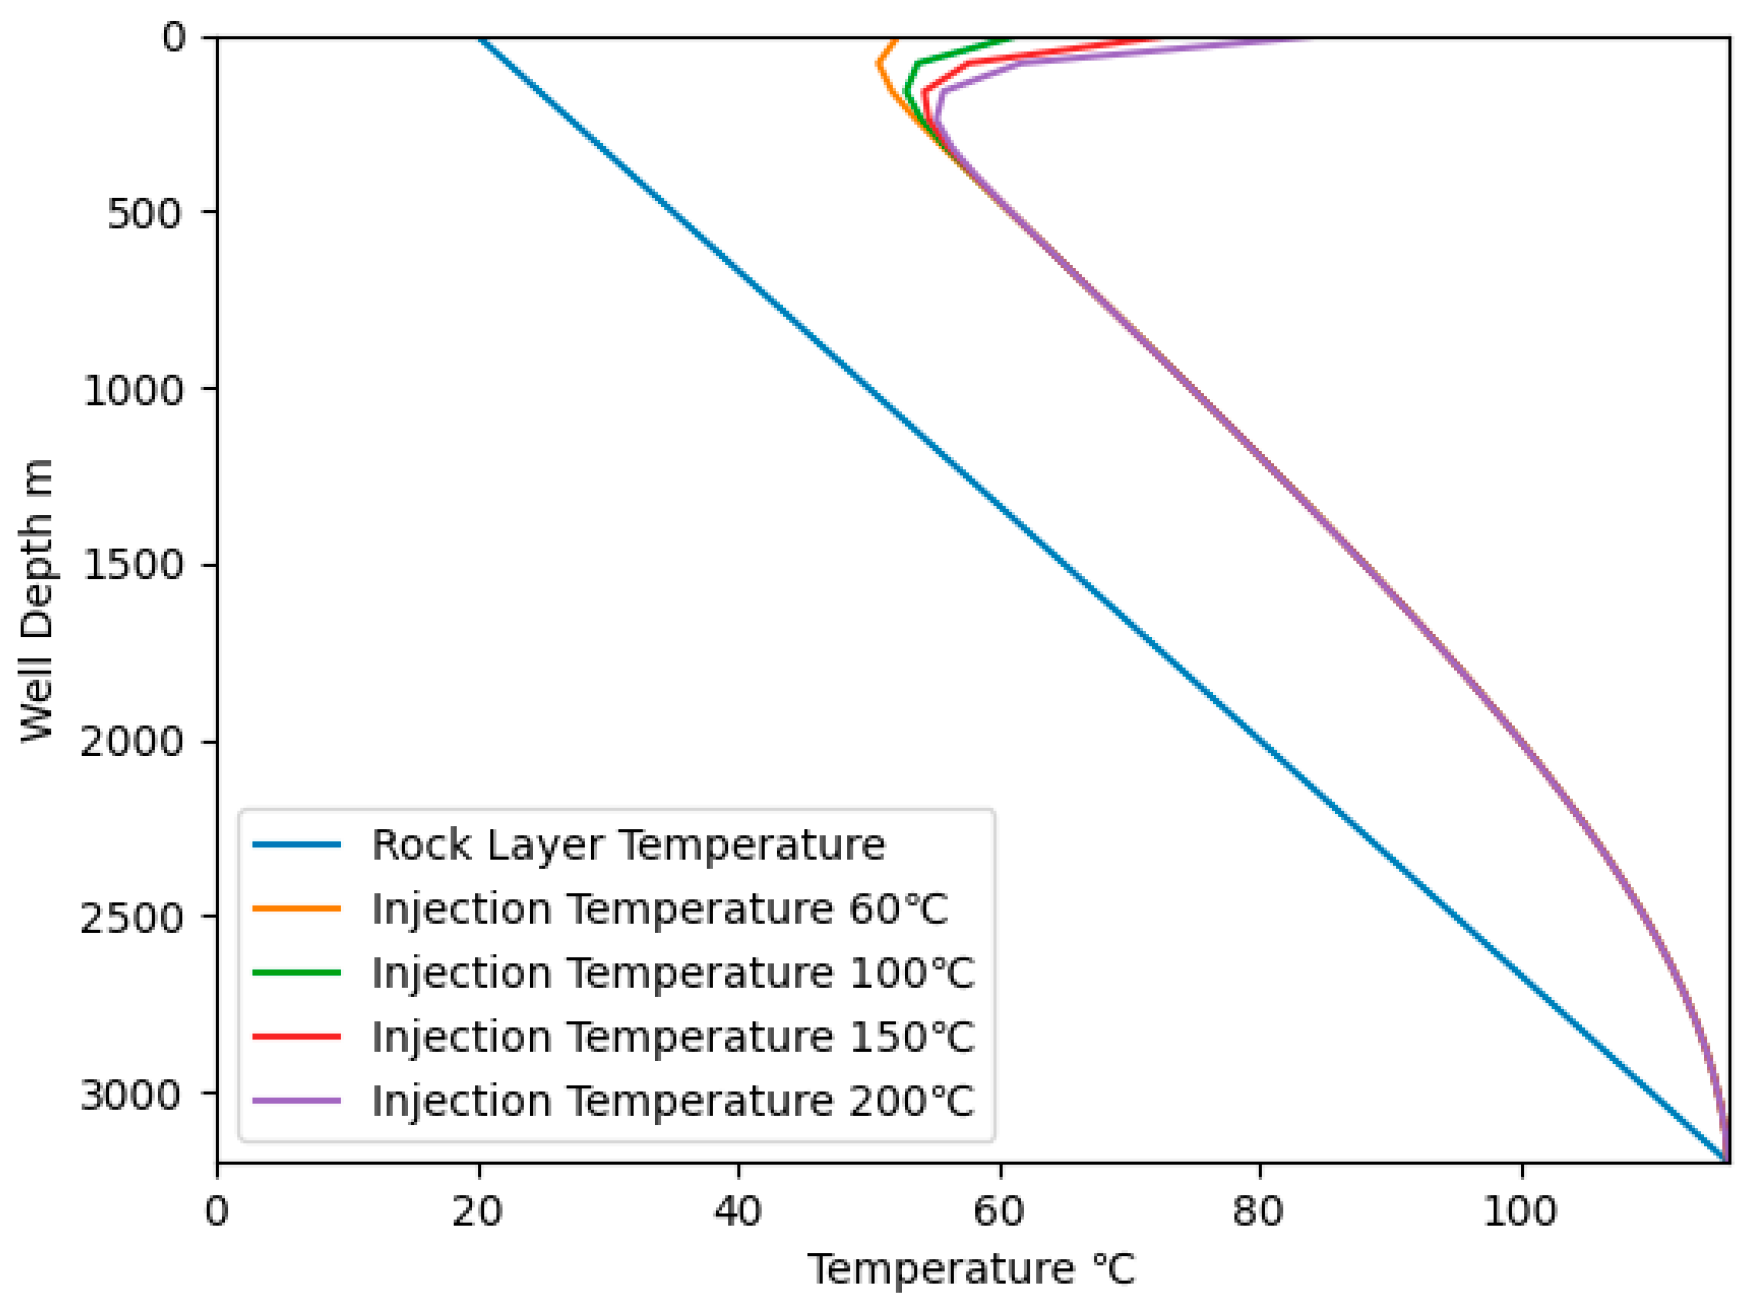
3.3.2. Effect of Injection Temperature on Wellbore Temperature
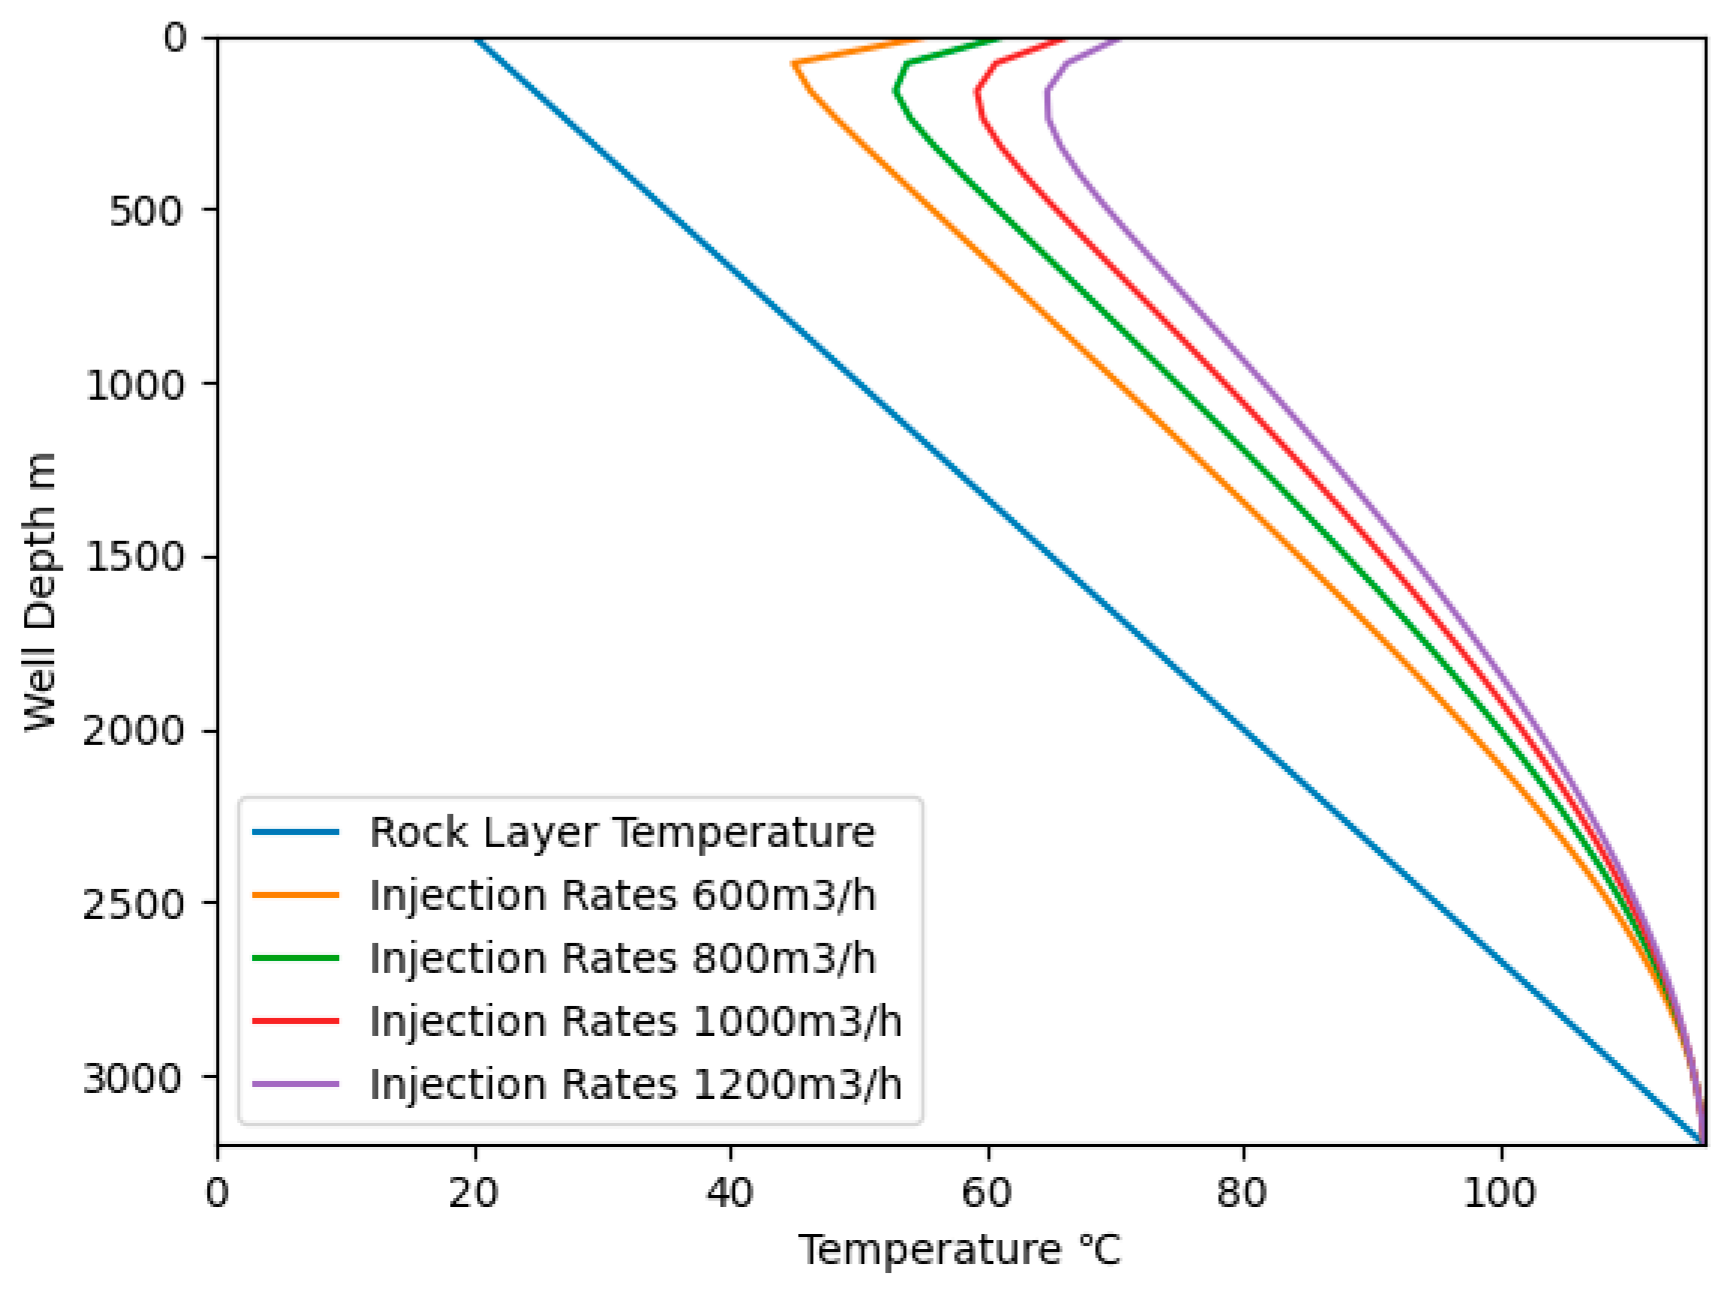
3.3.3. Effect of Injection Volume on Wellbore Temperature
4. Wax Removal and Plug Removal Design
4.1. Wellhead Injection Temperature Optimization
4.2. Equipment Matching Proposal
- (1)
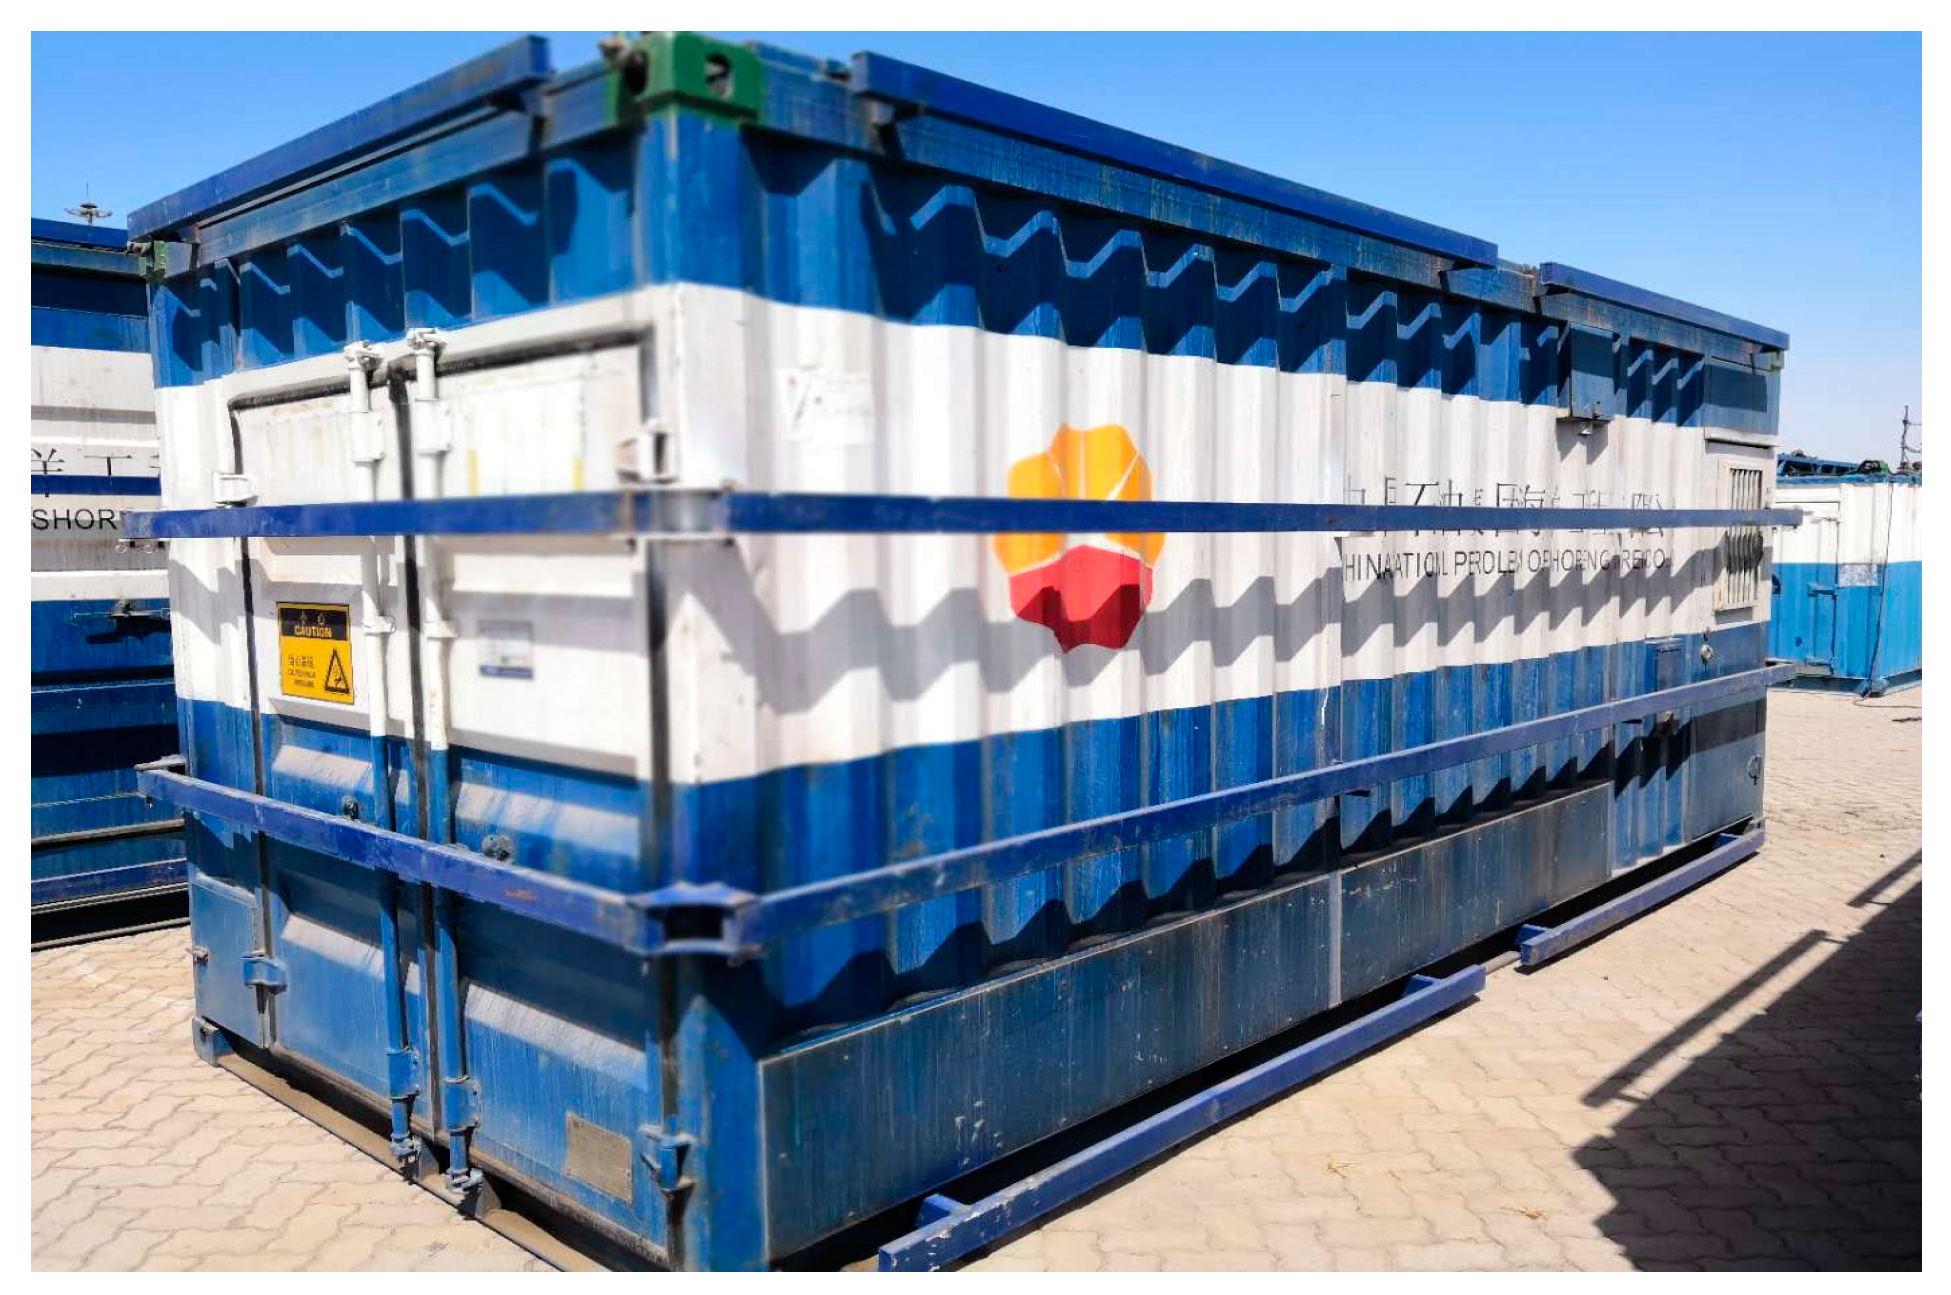
- Nitrogen production equipment
- (2)
- Air compressor equipment
4.3. Construction Process
- (1)
- Open the main valve and wax removal valve of the tree and prepare to pump 60–250 °C nitrogen for circulating washing;
- (2)
- Start the pump slowly, keep the pump pressure at 10 MPa, and observe the return situation;
- (3)
- After determining the normal return, keep the hot nitrogen pumped continuously, keep the pump pressure at 15 MPa, and carry out hot washing;
- (4)
- For hot nitrogen plugging, observe the return situation when the pump enters; when the plugging effect does not reach the effect, increase the pump pressure and squeeze hot nitrogen at the pump pressure of 20 MPa;
- (5)
- During hot nitrogen plugging, observe the change in return and wellhead pressure at any time;
- (6)
- After the wellbore is established, convert it to large displacement hot washing.
5. Conclusions
Author Contributions
Funding
Data Availability Statement
Conflicts of Interest
References
- Sun, D.H. Study and application of injection nitrogen into wells for increasing oil production technology. Fault-Block Oil Gas Field 2003, 10, 5. [Google Scholar]
- Alnaimat, F.; Ziauddin, M. Wax deposition and prediction in petroleum pipelines. J. Pet. Sci. Eng. 2020, 184, 106385. [Google Scholar] [CrossRef]
- Olajire, A.A. Review of wax deposition in subsea oil pipeline systems and mitigation technologies in the petroleum industry. Chem. Eng. J. Adv. 2021, 6, 100104. [Google Scholar] [CrossRef]
- Gooya, R.; Gooya, M.; Dabir, B. Effect of flow and physical parameters on the wax deposition of Middle East crude oil under subsea condition: Heat transfer viewpoint. Heat Mass Transf. 2013, 49, 1205–1216. [Google Scholar] [CrossRef]
- Burger, E.D.; Perkins, T.K.; Striegler, J.H. Studies of wax deposition in the Trans Alaska pipeline. J. Pet. Technol. 1981, 33, 1075–1086. [Google Scholar] [CrossRef]
- Elsharkawy, A.M.; Al-Sahhaf, T.A.; Fahim, M.A.; Al-Zabbai, W. Determination and prediction of wax deposition from Kuwaiti crude oils. In Proceedings of the Latin American and Caribbean Petroleum Engineering Conference, Caracas, Venezuela, 21–23 April 1999. [Google Scholar]
- Li, W.D.; Huang, Q.Y.; Wang, W.D.; Gao, X. Advances and Future Challenges of Wax Removal in Pipeline Pigging Operations on Crude Oil Transportation Systems. Energy Technol. 2020, 8, 1901412. [Google Scholar] [CrossRef]
- Aiyejina, A.; Chakrabarti, D.P.; Pilgrim, A.; Sastry, M. Wax formation in oil pipelines: A critical review. Int. J. Multiph. Flow 2011, 37, 671–694. [Google Scholar] [CrossRef]
- Bell, E.; Lu, Y.D.; Daraboina, N.; Sarica, C. Experimental Investigation of active heating in removal of wax deposits. J. Pet. Sci. Eng. 2021, 200, 108346. [Google Scholar] [CrossRef]
- Zhang, F.; Ouyang, J.; Feng, X.; Zhang, H.; Xu, L. Paraffin deposition mechanism and paraffin inhibition technology for high-carbon paraffin crude oil from the Kazakhstan PK Oilfield. Pet. Sci. Technol. 2014, 32, 488–496. [Google Scholar] [CrossRef]
- Liu, D.; Chen, X.F.; Zhu, Y.K.; Luo, Z.L. Research on anti-waxing process of hot nitrogen cleaning and its application in shallow offshore oil development. Pet. Eng. Constr. 2021, 47 (Suppl. S2), 163–167. [Google Scholar]
- Li, X.S.; Zhou, Y.Z.; Xu, J.; Ren, X.L. Progress in research and application of oil well clearing and anti-waxing technology. Nat. Gas Pet. 2017, 35, 66–70+79. [Google Scholar]
- Zhen, F.L.; Zhao, J.; Huang, T.; Mao, F.; Wang, R.B. Establishment and effect analysis of heat transfer model of hot nitrogen for wax removal and plug removal in oil field. Tech. Res. 2022, 3, 49–50. [Google Scholar]
- Man, X.J.; Liu, J.Y.; Sun, Y. Evaluation of the efectiveness of steam wash and wax cleaning application on oil well boreholes. Petrochemical Industry Application. In Proceedings of the 16th Ningxia Young Scientists Forum on Petrochemicals, Yinchuan, China, 20 August 2020. [Google Scholar]
- Liu, Z.Y.; Huang, H.X.; Wang, A. Application analysis of self-energised thermal cleaning Technology in Pumping Wells. Oil Gas Well Test. 2002, 1, 56–58. [Google Scholar]
- Hu, P.; Lu, X.K. Application of self-energised hot washing and wax cleaning technology in Shuguang Oilfield. Neijiang Sci. Technol. 2012, 33, 110. [Google Scholar]
- Nysveen, A.; Kulbotten, H.; Lervik, J.K.; Børnes, A.; Hoyer-Hansen, M.; Bremnes, J.J. Direct electrical heating of subsea pipelines—Technology development and operating experience. IEEE Trans. Ind. Appl. 2007, 43, 118–129. [Google Scholar] [CrossRef]
- Fan, F.; Llave, F.M. Chemical removal of formation damage from paraffin deposition Part I–Solubility and dissolution rate. In Proceedings of the SPE Formation Damage Control Symposium, Lafayette, LA, USA, 14–15 February 1996. [Google Scholar]
- Sood, N.; Lal, B. Isolation and characterization of a potential paraffin-wax degrading thermophilic bacterial strain Geobacillus kaustophilus TERI NSM for application in oil wells with paraffin deposition problems. Chemosphere 2008, 70, 1445–1451. [Google Scholar] [CrossRef]
- Ramey, H.J.J. Wellbore heat transmission. J. Pet. Technol. 1962, 14, 427–435. [Google Scholar] [CrossRef]
- Satter, A. Heat losses during flow of steam down a wellbore. J. Pet. Technol. 1965, 17, 845–851. [Google Scholar] [CrossRef]
- Willhtteg, P. Over-all heat transfer coefficients in steam and hot water injection wells. J. Pet. Technol. 1967, 19, 607–615. [Google Scholar] [CrossRef]
- Hasan, A.R.; Kabir, C.S.; Ameen, M.M. A mechanistic model for circulating fluid temperature. SPE J. 1996, 1, 133–144. [Google Scholar] [CrossRef]
- Yao, C.J.; Lei, G.L.; Jiang, B.Y.; Liu, H.Q. Calculation of temperature field and analysis of flow transition in high condensate wellbore. Oil Drill. Extr. Technol. 2011, 33, 42–46. [Google Scholar]
- Ding, L.L.; Lian, Z.H.; Chen, S.C.; Yang, B.G.; Wei, C.X. Numerical simulation of wellbore temperature in high-pressure deep well pressure process. Oil Drill. Extr. Technol. 2011, 33, 15–18. [Google Scholar]


| Name | Nitrogen Production Equipment |
|---|---|
| Nitrogen purity | 95–99% |
| Air inlet pressure | ≥2.4 MPa |
| Nitrogen outlet pressure | ≥2.15–2.2 MPa |
| Power supply | 380 V, 50 Hz/440 V, 60 Hz |
| Protection class | P55 |
| Name | Air Compressor Equipment |
|---|---|
| Type | SULLAIR 1350/350 |
| Displacement | 35.4 m3/min |
| Exhaust pressure | 2.4 MPa |
| Exhaust temperature | ≤120 °C |
| Oil content of exhaust gas | 5–8 ppm |
| Full load/no load speed | 1800/1200-rpm |
Disclaimer/Publisher’s Note: The statements, opinions and data contained in all publications are solely those of the individual author(s) and contributor(s) and not of MDPI and/or the editor(s). MDPI and/or the editor(s) disclaim responsibility for any injury to people or property resulting from any ideas, methods, instructions or products referred to in the content. |
© 2023 by the authors. Licensee MDPI, Basel, Switzerland. This article is an open access article distributed under the terms and conditions of the Creative Commons Attribution (CC BY) license (https://creativecommons.org/licenses/by/4.0/).
Share and Cite
Du, W.; An, Y.; Guan, L.; Xiong, C.; Huo, R.; Tang, B. Research on the Calculation Method for the Wellbore Temperature of Hot Nitrogen Gas Circulation Wax Removal and Plug Removal in Offshore Oil Fields. Processes 2023, 11, 3196. https://doi.org/10.3390/pr11113196
Du W, An Y, Guan L, Xiong C, Huo R, Tang B. Research on the Calculation Method for the Wellbore Temperature of Hot Nitrogen Gas Circulation Wax Removal and Plug Removal in Offshore Oil Fields. Processes. 2023; 11(11):3196. https://doi.org/10.3390/pr11113196
Chicago/Turabian StyleDu, Weigang, Yongsheng An, Liyong Guan, Chengchen Xiong, Runshi Huo, and Bing Tang. 2023. "Research on the Calculation Method for the Wellbore Temperature of Hot Nitrogen Gas Circulation Wax Removal and Plug Removal in Offshore Oil Fields" Processes 11, no. 11: 3196. https://doi.org/10.3390/pr11113196