Abstract
During fracturing operations, special situations are often encountered. For example, the insufficient proppant-carrying capacity of fracturing fluid can cause quartz sand or ceramsite to settle near the wellbore and form a sand plug. Alternatively, excessive sand injection intensity can lead to severe accumulation of injected sand near the wellbore and also form a sand plug. These special situations are reflected in the fracturing operation curve as an abnormal increase in oil pressure over a short period of time. If not handled promptly, they can have unimaginable consequences. Sand plugs in fracturing operations, characterized by their speed and unpredictability, often form rapidly, within about 20 s. Conventional methods for on-site sand-plug warnings during fracturing include the oil pressure–time double logarithmic slope method and the net pressure–time double logarithmic slope method. Although these methods respond quickly, their warning results are unstable and vary significantly during actual operations. This is mainly because the fluctuations in the actual fracturing operation curve are often large, and there can be sudden pressure rises and drops even during stable periods, albeit less pronounced. To address the identification of anomalies in conventional fracturing operation monitoring and warning methods, a sand-plug warning index method has been proposed for sand-plug identification. This method combines the oil pressure–time double logarithmic slope with the oil pressure increment within 5 s, the rate of change in the oil pressure–time double logarithmic slope, and the fitted oil pressure intercept as indicators. The method has been validated using Well A in Fuling as an example. The validation results show that the dynamic analysis method can predict sand plugs while reducing warning fluctuations without affecting sensitivity. Compared to conventional methods, the warning time can be advanced by about 10 s.
1. Introduction
Due to the complexity of subsurface formations, various risks are encountered during hydraulic fracturing operations, with sand plugging being the most common [1,2,3]. This can lead to economic losses, environmental pollution, disruption of reservoir flow, and the abandonment of construction wells. Accurate data analysis is crucial for developing a sound mathematical model [4,5]. Various sensors installed in the field can collect data, forming an Internet-of-Things environment [6,7]. The purpose of analyzing the data collected in the field is to extract critical information using data mining techniques [8]. This technology can identify data trends and facilitate risk prediction. Therefore, applying data mining techniques to hydraulic fracturing construction early is of significant importance in preventing sand-plugging incidents during the fracturing process [9,10]. Relevant researchers have conducted a lot of research on fracturing and achieved certain results [11,12].
The fracturing real-time monitoring and interpretation software developed by Southwest Petroleum University is based on the research of new fracturing real-time monitoring and analysis models and new methods of pressure history inversion. The software applies the pressure history inversion method and comprehensively utilizes techniques such as the stepwise linear least-squares method and the constrained scaling method to directly fit wellhead pressure to explain key parameters of the formation and the three-dimensional expansion and extension of fractures. This system is also equipped with a portable fracturing monitor, which effectively realizes real-time monitoring of fracturing construction. The fracturing construction remote monitoring system developed by Beijing Yadan Company comprehensively applies computer network technology and audio and video technology to realize multiple functions such as the real-time collection of fracturing construction data and the real-time audio and video monitoring of on-site construction [13].
Yu et al. [12] developed a real-time fracturing monitoring and early-warning system based on the slope of the oil pressure–time and casing pressure–time logarithmic curves. Based on the investigation of fracturing data from multiple wells, three modes of pressure-time logarithmic curves were analyzed, and risks that may occur in this mode were predicted by judging in real time which model the current fracturing construction status was in. At the same time, the crack length and average crack width can be calculated based on the mature two-dimensional crack PKN, KGD, and Penny radial models, and used to determine whether the crack direction is consistent with the design; if deviations occur, it should be considered whether to reduce the dynamic parameters to change the crack direction. Field application results show that the system integrates real-time monitoring data and early warning and has good application value.
Hu and Dong et al. [11,14] proposed an early-warning method for fracturing-sand plugging based on LSTM deep learning to predict sand-plugging incidents during shale gas fracturing construction and to reduce fracturing construction costs.
Dai [15] proposed the importance of the fracturing-sand-plugging early-warning method based on data mining. By studying the sand-plugging mechanism and the changing rules of related parameters, a logarithmic curve for a fracturing-sand-plugging-risk early-warning model was established, and a time series analysis algorithm was used to make a prediction. In order to improve the accuracy of early warnings, the author also used the generalized regression neural network (GRNN) algorithm and the improved affinity propagation (AP) clustering algorithm, developed a supporting real-time monitoring and early-warning system for fracturing-sand plugging, and implemented it at Port 19. The effectiveness and stability of the system have been verified in the application of the well. The system is based on the actual needs of on-site construction, has complete functions and high accuracy, and can meet the needs of real-time monitoring of fracturing-sand plugging.
Zhang’s [16] Bayesian network is the theoretical basis of the early-warning risk model and proposes an underground-accident-safety early-warning method that integrates risk representation parameters to extract its trend characteristics as real-time risk information, and introduces a membership function for quantifying its state probability distribution and correcting the probability value of underground accidents in real time.
Liang et al. [3] introduced a fracturing-sand-plugging early-warning method based on data mining, focusing on applications in the petroleum industry. By establishing a logarithmic-curve early-warning model for fracturing-sand plugging and combining it with a time-series-analysis algorithm to predict oil pressure and casing pressure, the accuracy of early warning is improved. The authors also use the generalized regression neural network (GRNN) algorithm to optimize the prediction results of time-domain analysis, and the improved affinity propagation (AP) clustering algorithm to cluster the monitoring data, improving the coincidence rate of fracturing and sand-plugging risks. Finally, the risk-warning model was successfully embedded into a remote monitoring system, allowing city office workers to realize online, remote, intelligent monitoring of risks.
In addition, Ivan Lim Chen Ning et al. [17] utilized a neural network-based image recognition algorithm (CNN) to detect low-frequency signals in distributed acoustic sensing (DAS) data, aiming to identify precursor events of sand blockage and make predictions.
In summary, it can be seen that the main methods for early warning of fracturing-sand plugs are the oil pressure–time double logarithm slope method, the net pressure–time double logarithm slope method, and artificial intelligence methods such as deep learning for prediction. Among them are the oil pressure–time double logarithm slope method and the net pressure–time double logarithm slope method; although these methods respond quickly, in actual early warning, the warning results are unstable and there are certain differences in the warning results. This is mainly because the actual fracturing construction curve fluctuations are often relatively large, and there will be steep rises and falls in pressure during stable periods, but they are not too obvious. The originally fluctuating data will be too smooth due to denoising by taking logarithms, so some early sand-plug-curve fluctuations cannot be found in time; while artificial intelligence algorithms such as deep learning require learning a large number of curve shapes when sand plugs occur during prediction, and cannot completely provide accurate warnings. Once a misjudgment is made and not found, it can easily cause some major on-site accidents. Therefore, in order to identify sand plugs earlier without affecting the accuracy and sensitivity of fracturing-sand-plug warnings, a dynamic analysis method for fracturing-sand-plug warnings is proposed to provide a more accurate warning method for ensuring fracturing safety.
2. Fracturing Construction Curve and Characteristic Analysis
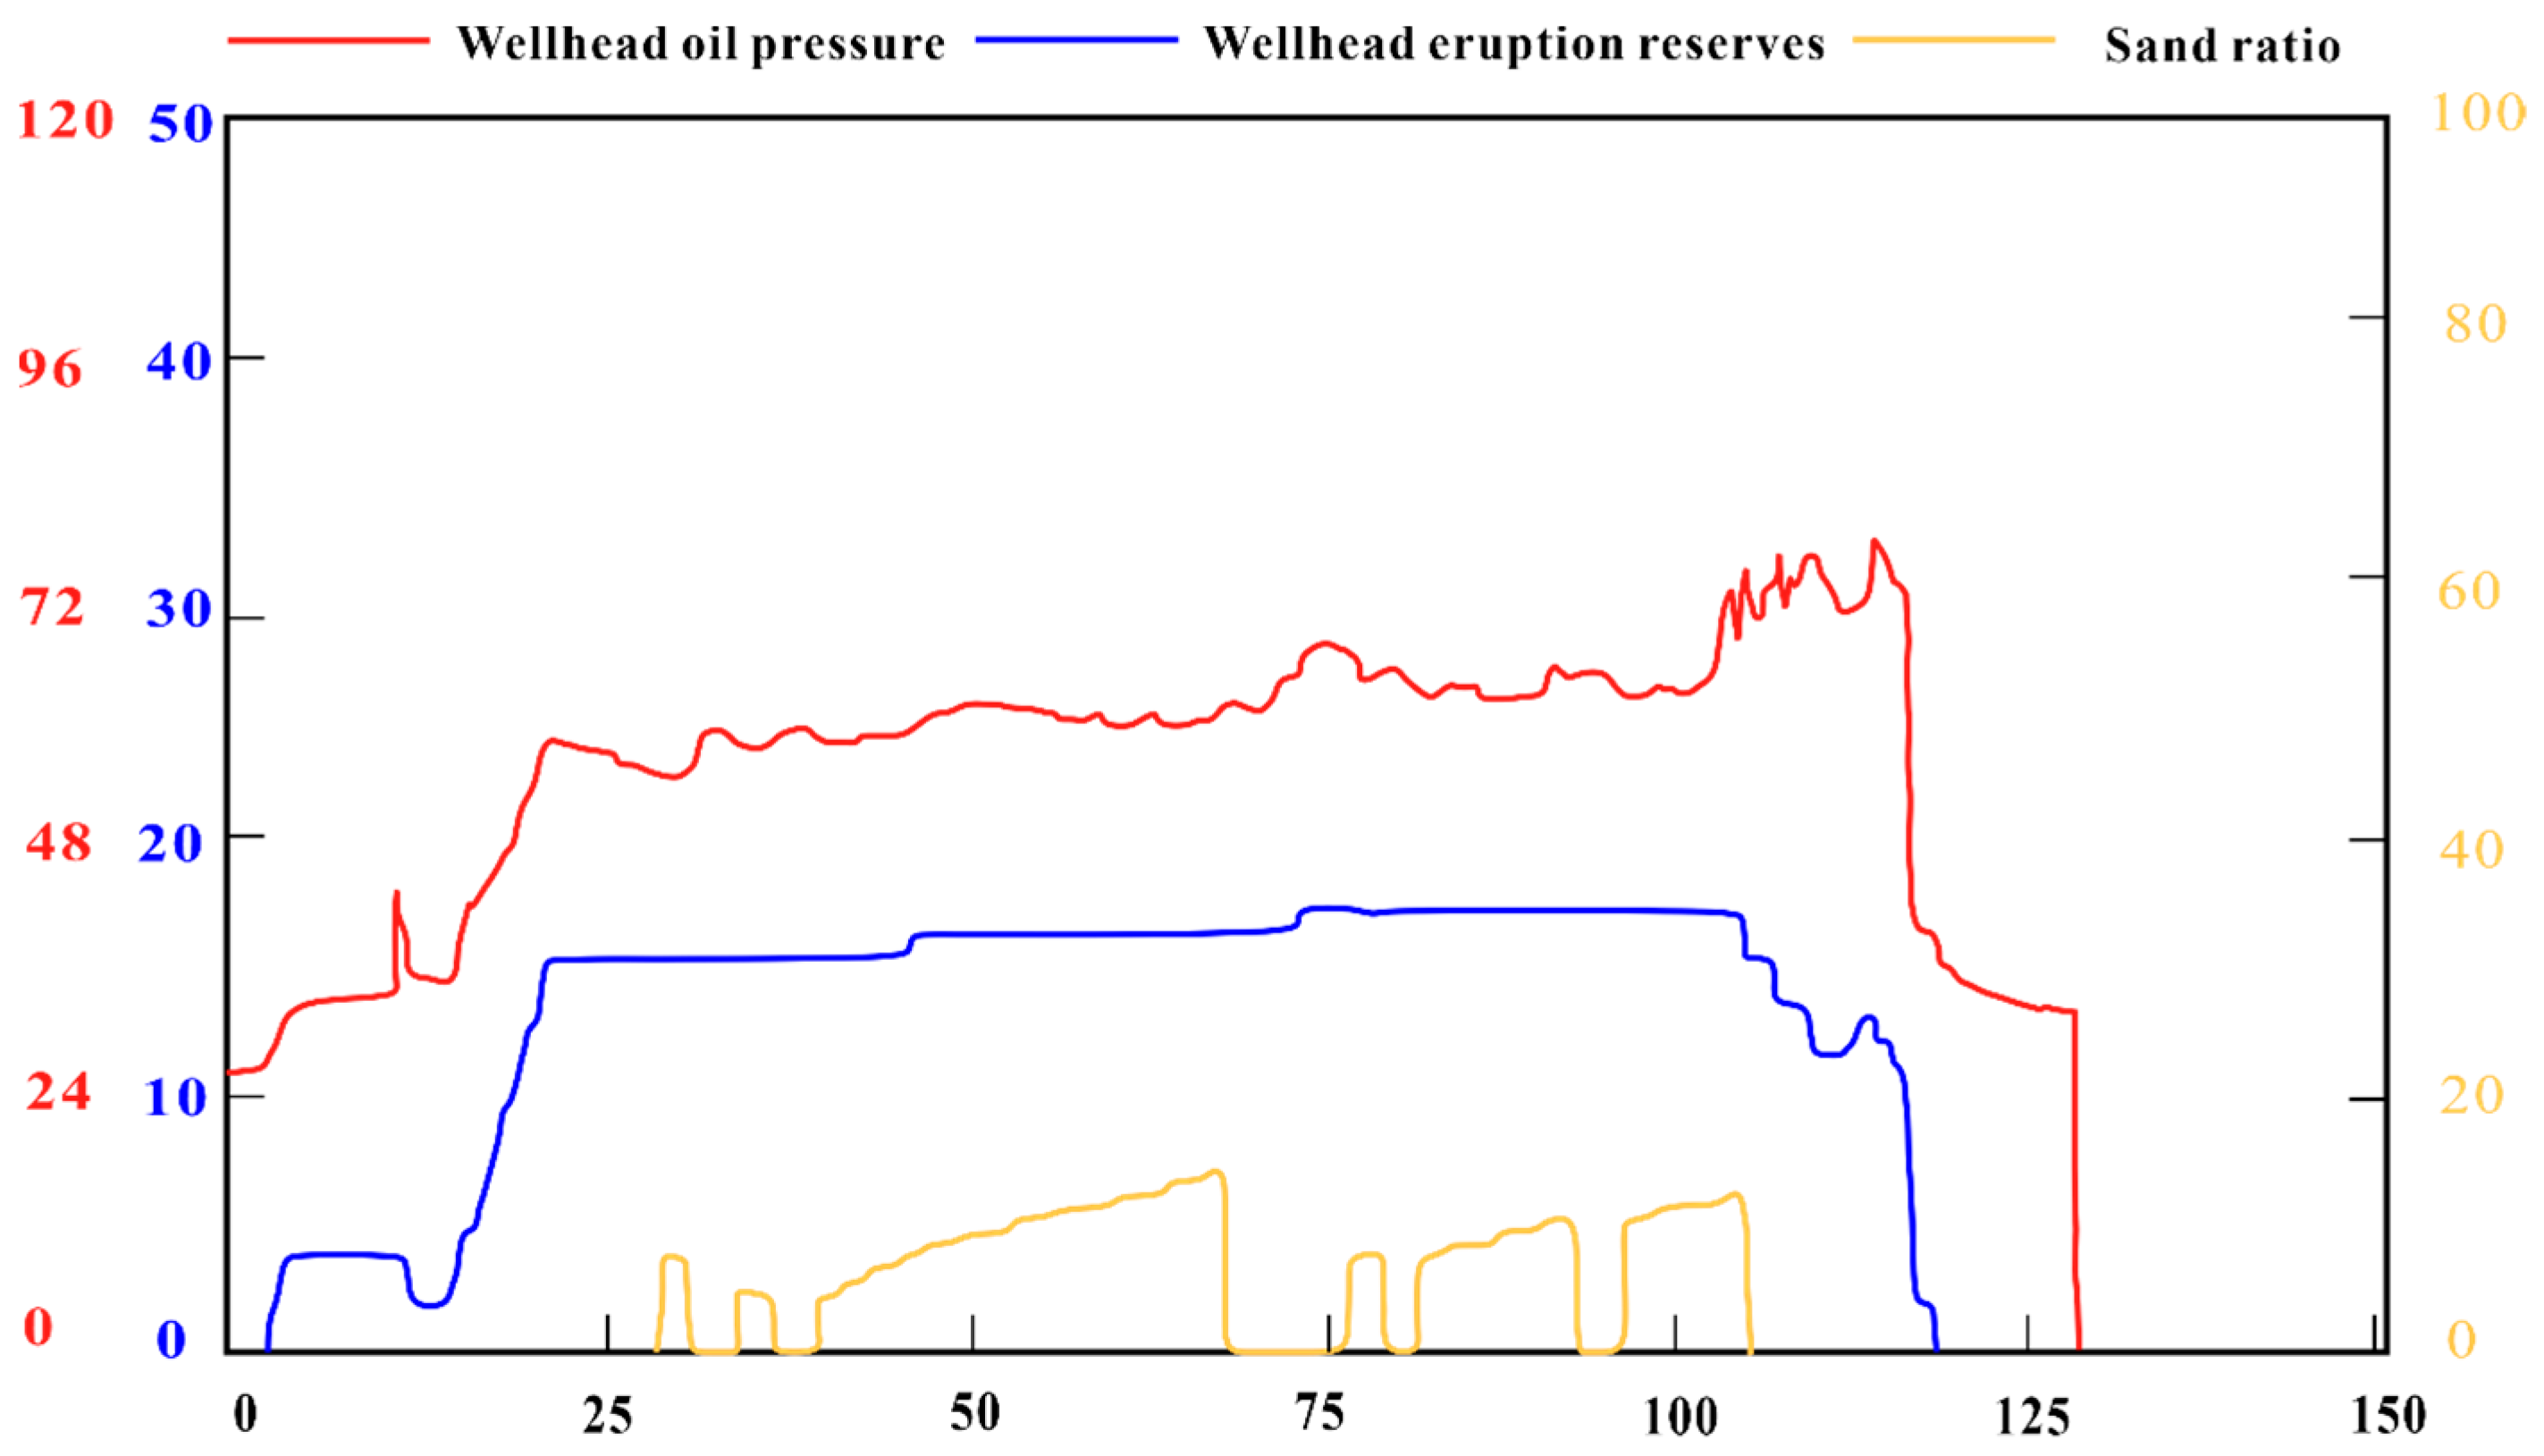
The fracturing construction curve is depicted in Figure 1. This figure represents a time-series plot with time on the x-axis and pressure on the y-axis, measured in seconds. However, on-site observations are primarily conducted using minutes as the time unit. In the figure, the red line represents wellhead oil pressure, the blue line indicates construction displacement, and the orange line represents the sand ratio. The time unit is in minutes (min), while pressure is measured in megapascals (MPa), and displacement is in cubic meters per minute (m3/min). The wellhead oil pressure curve reflects the pressure change of the fracturing fluid at the wellhead, the construction displacement curve shows the injection rate of the fracturing fluid, and the sand ratio curve shows the sand content in the fracturing fluid. The comprehensive analysis of these three curves can help fracturing commanders comprehensively understand the dynamic response of the formation during the construction process and help them make real-time decisions. During on-site operations, by monitoring and interpreting these curves, the fracturing commander can quickly judge the condition of the formation to ensure the smooth progress of the construction and make timely adjustments as needed. Therefore, these three curves play an indispensable key role in actual fracturing construction.
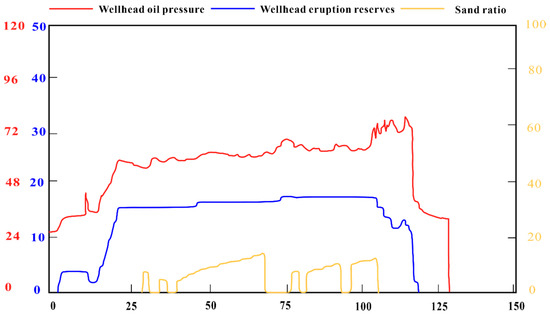
Figure 1.
Schematic diagram of the fracturing construction curve.
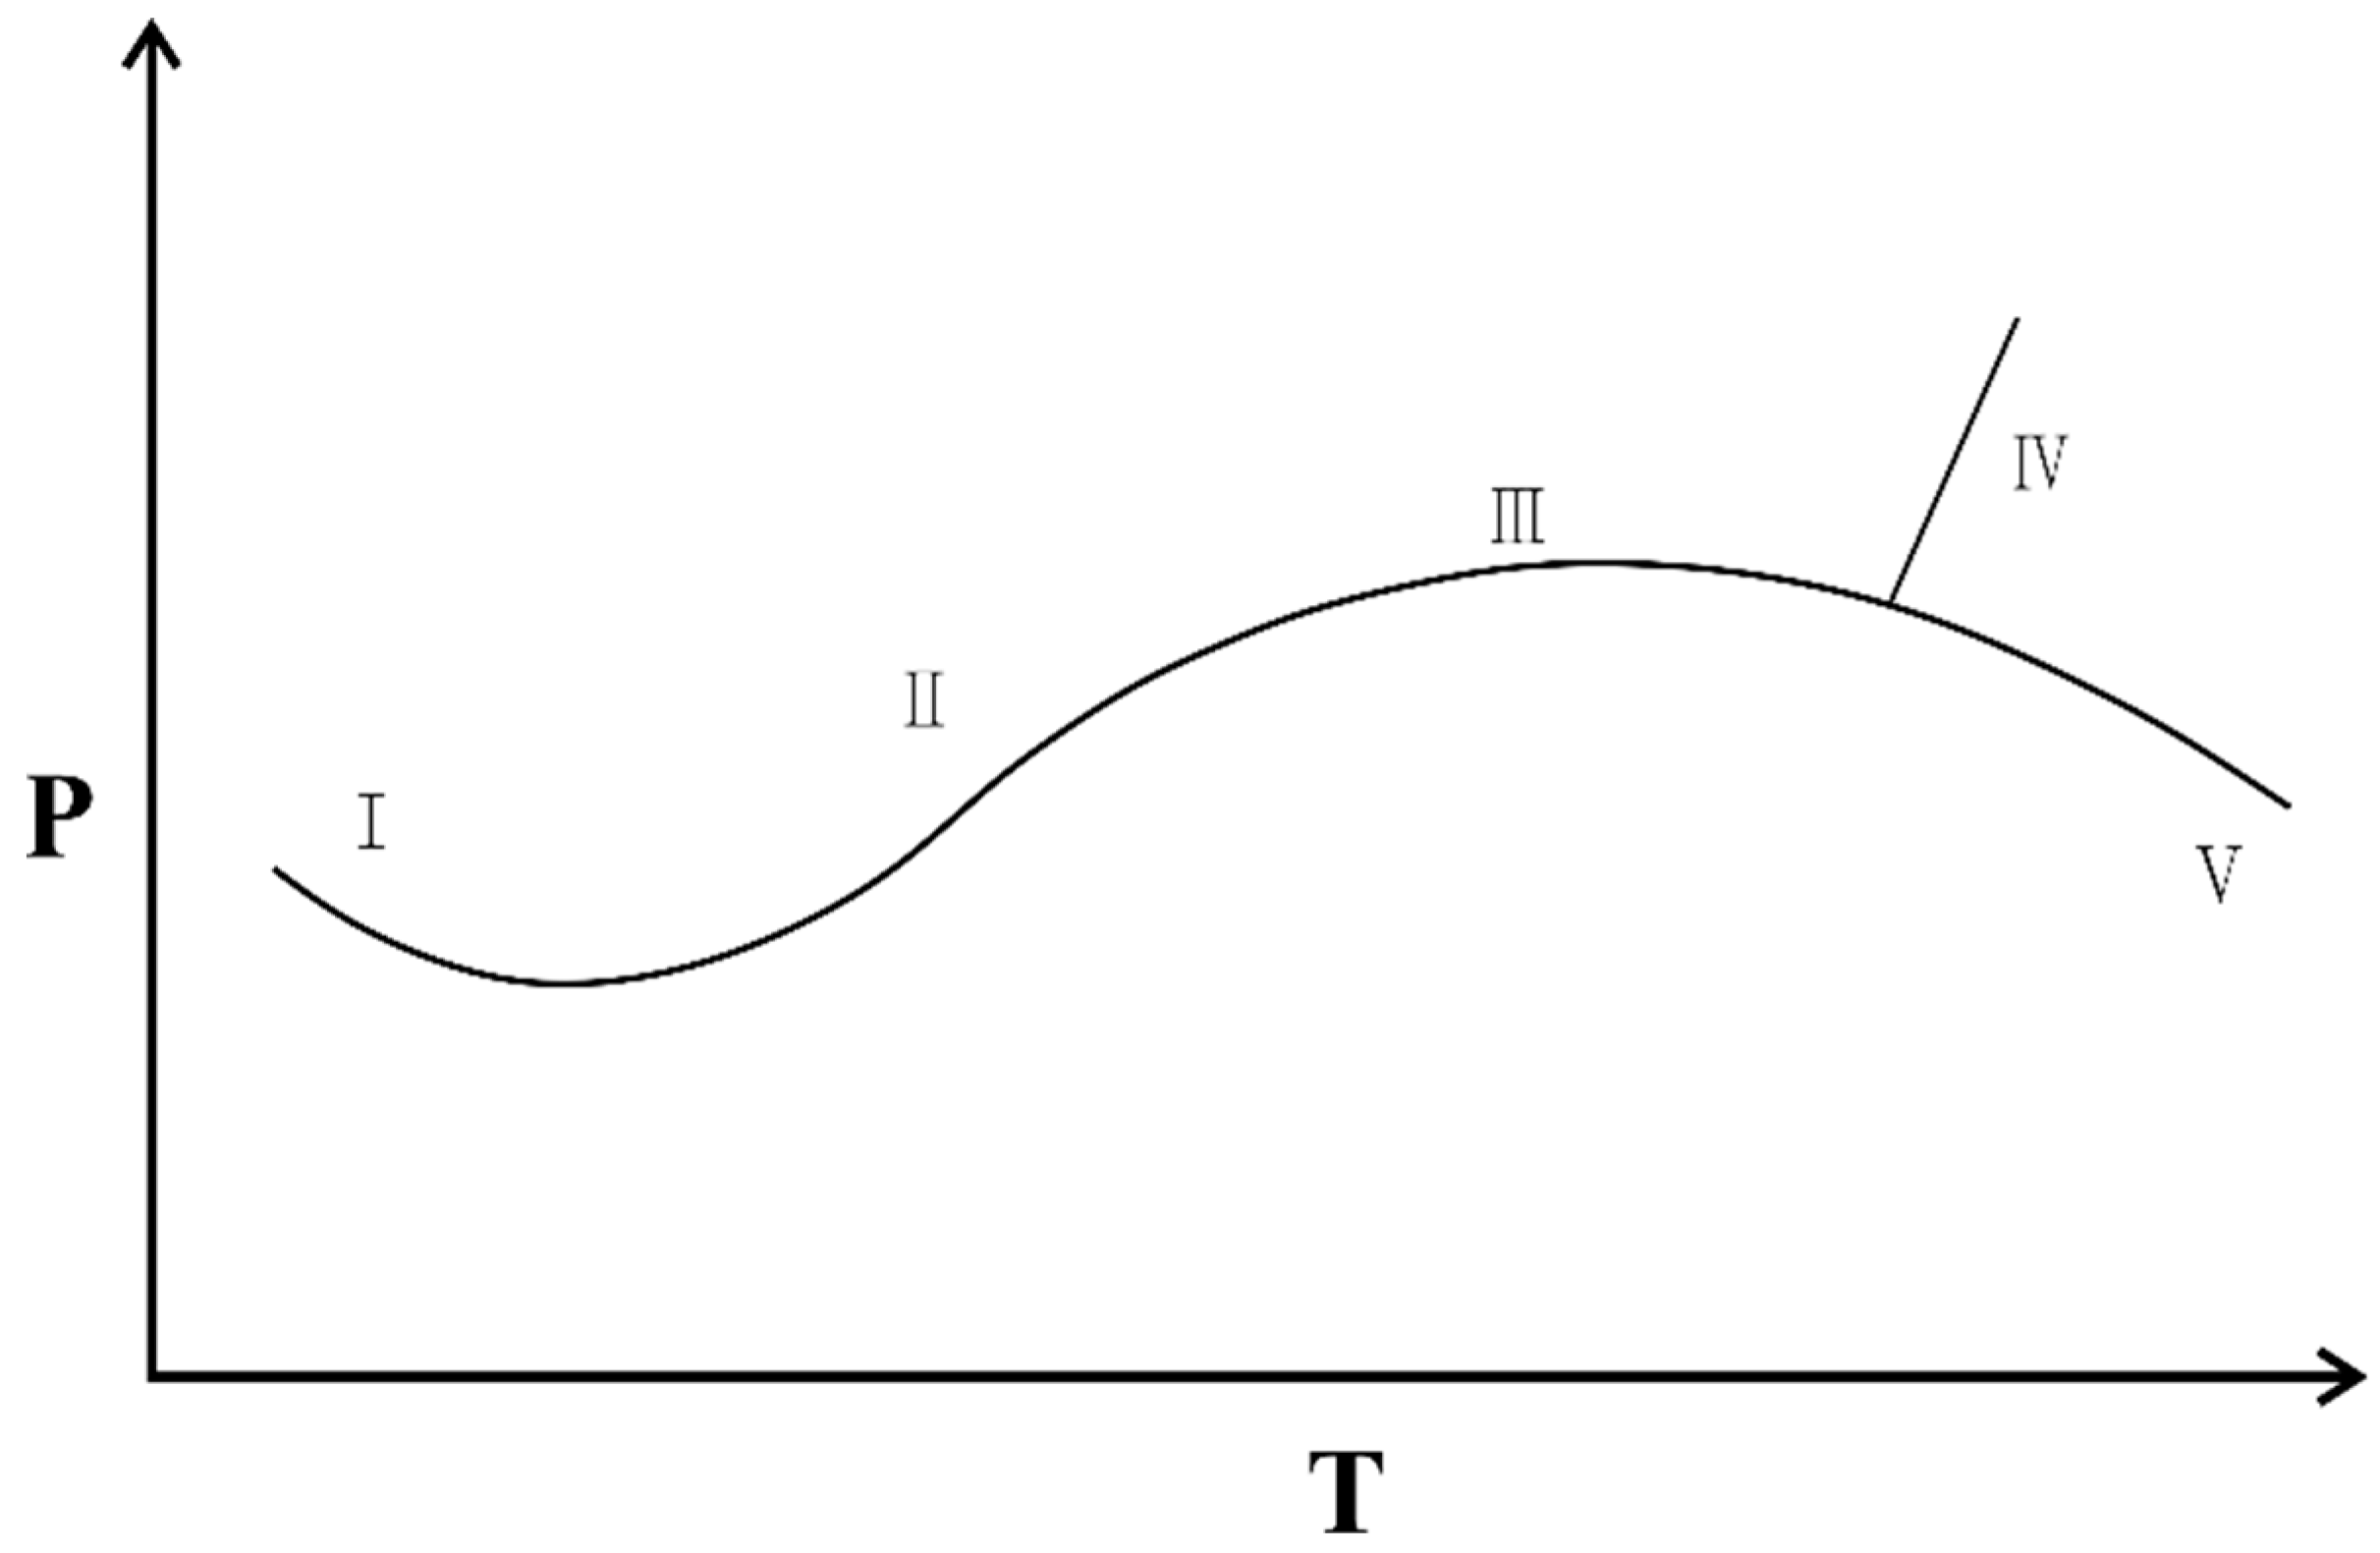
The oil pressure–time characteristics during fracturing site construction can be divided into the following three types, as shown in Figure 2.
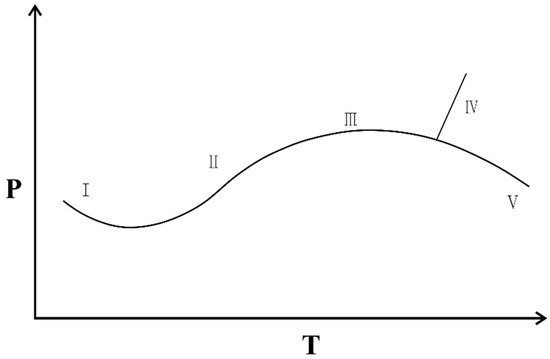
Figure 2.
Schematic diagram of pressure–time characteristics.
2.1. Rising Type
The rising type can be categorized into two situations. The first, represented by the II form in Figure 2, shows a normal oil pressure increase. This form indicates that there is resistance in the fractures during the fracturing process, but considers a normal fracturing construction scenario. The second situation is a significant oil pressure rise, as seen in the IV form in Figure 2. In this case, it suggests that the pumping pressure exceeds the absorption capacity of the injected fracturing fluid in the formation, resulting in blocked fracture propagation and a rapid, steep increase in oil pressure. This form is a strong indicator of potential sand plugging.
2.2. Stable Type
The stable type, illustrated as the III form in Figure 2, shows a steady oil pressure. It occurs when the pumping of fracturing fluid into the formation reaches equilibrium, with the fluid entering the formation due to filtration loss and normal fracture propagation. This situation is considered a normal fracturing process. However, it should raise concerns because it may signal excessive formation filtration loss, suggesting that sand carried by the fluid has not been properly removed and could potentially deposit near the well or in preferential pathways, leading to sand plugging.
2.3. Descending Type
The descending type, as represented by the I and V forms in Figure 2, exhibits a continuous decrease in oil pressure. This decline could be due to the fracturing fluid injected into the formation connecting with large natural fractures as the fractures extend, resulting in a significant increase in filtration loss. This situation leads to the injection pressure of the fracturing fluid being lower than the filtration loss volume. A continuous decrease in pressure in this manner should be closely monitored, as excessive filtration loss indicates fluid outflow and potential sand deposition, making sand plugging highly likely.
2.4. Propose a New Fracturing Construction Monitoring Method
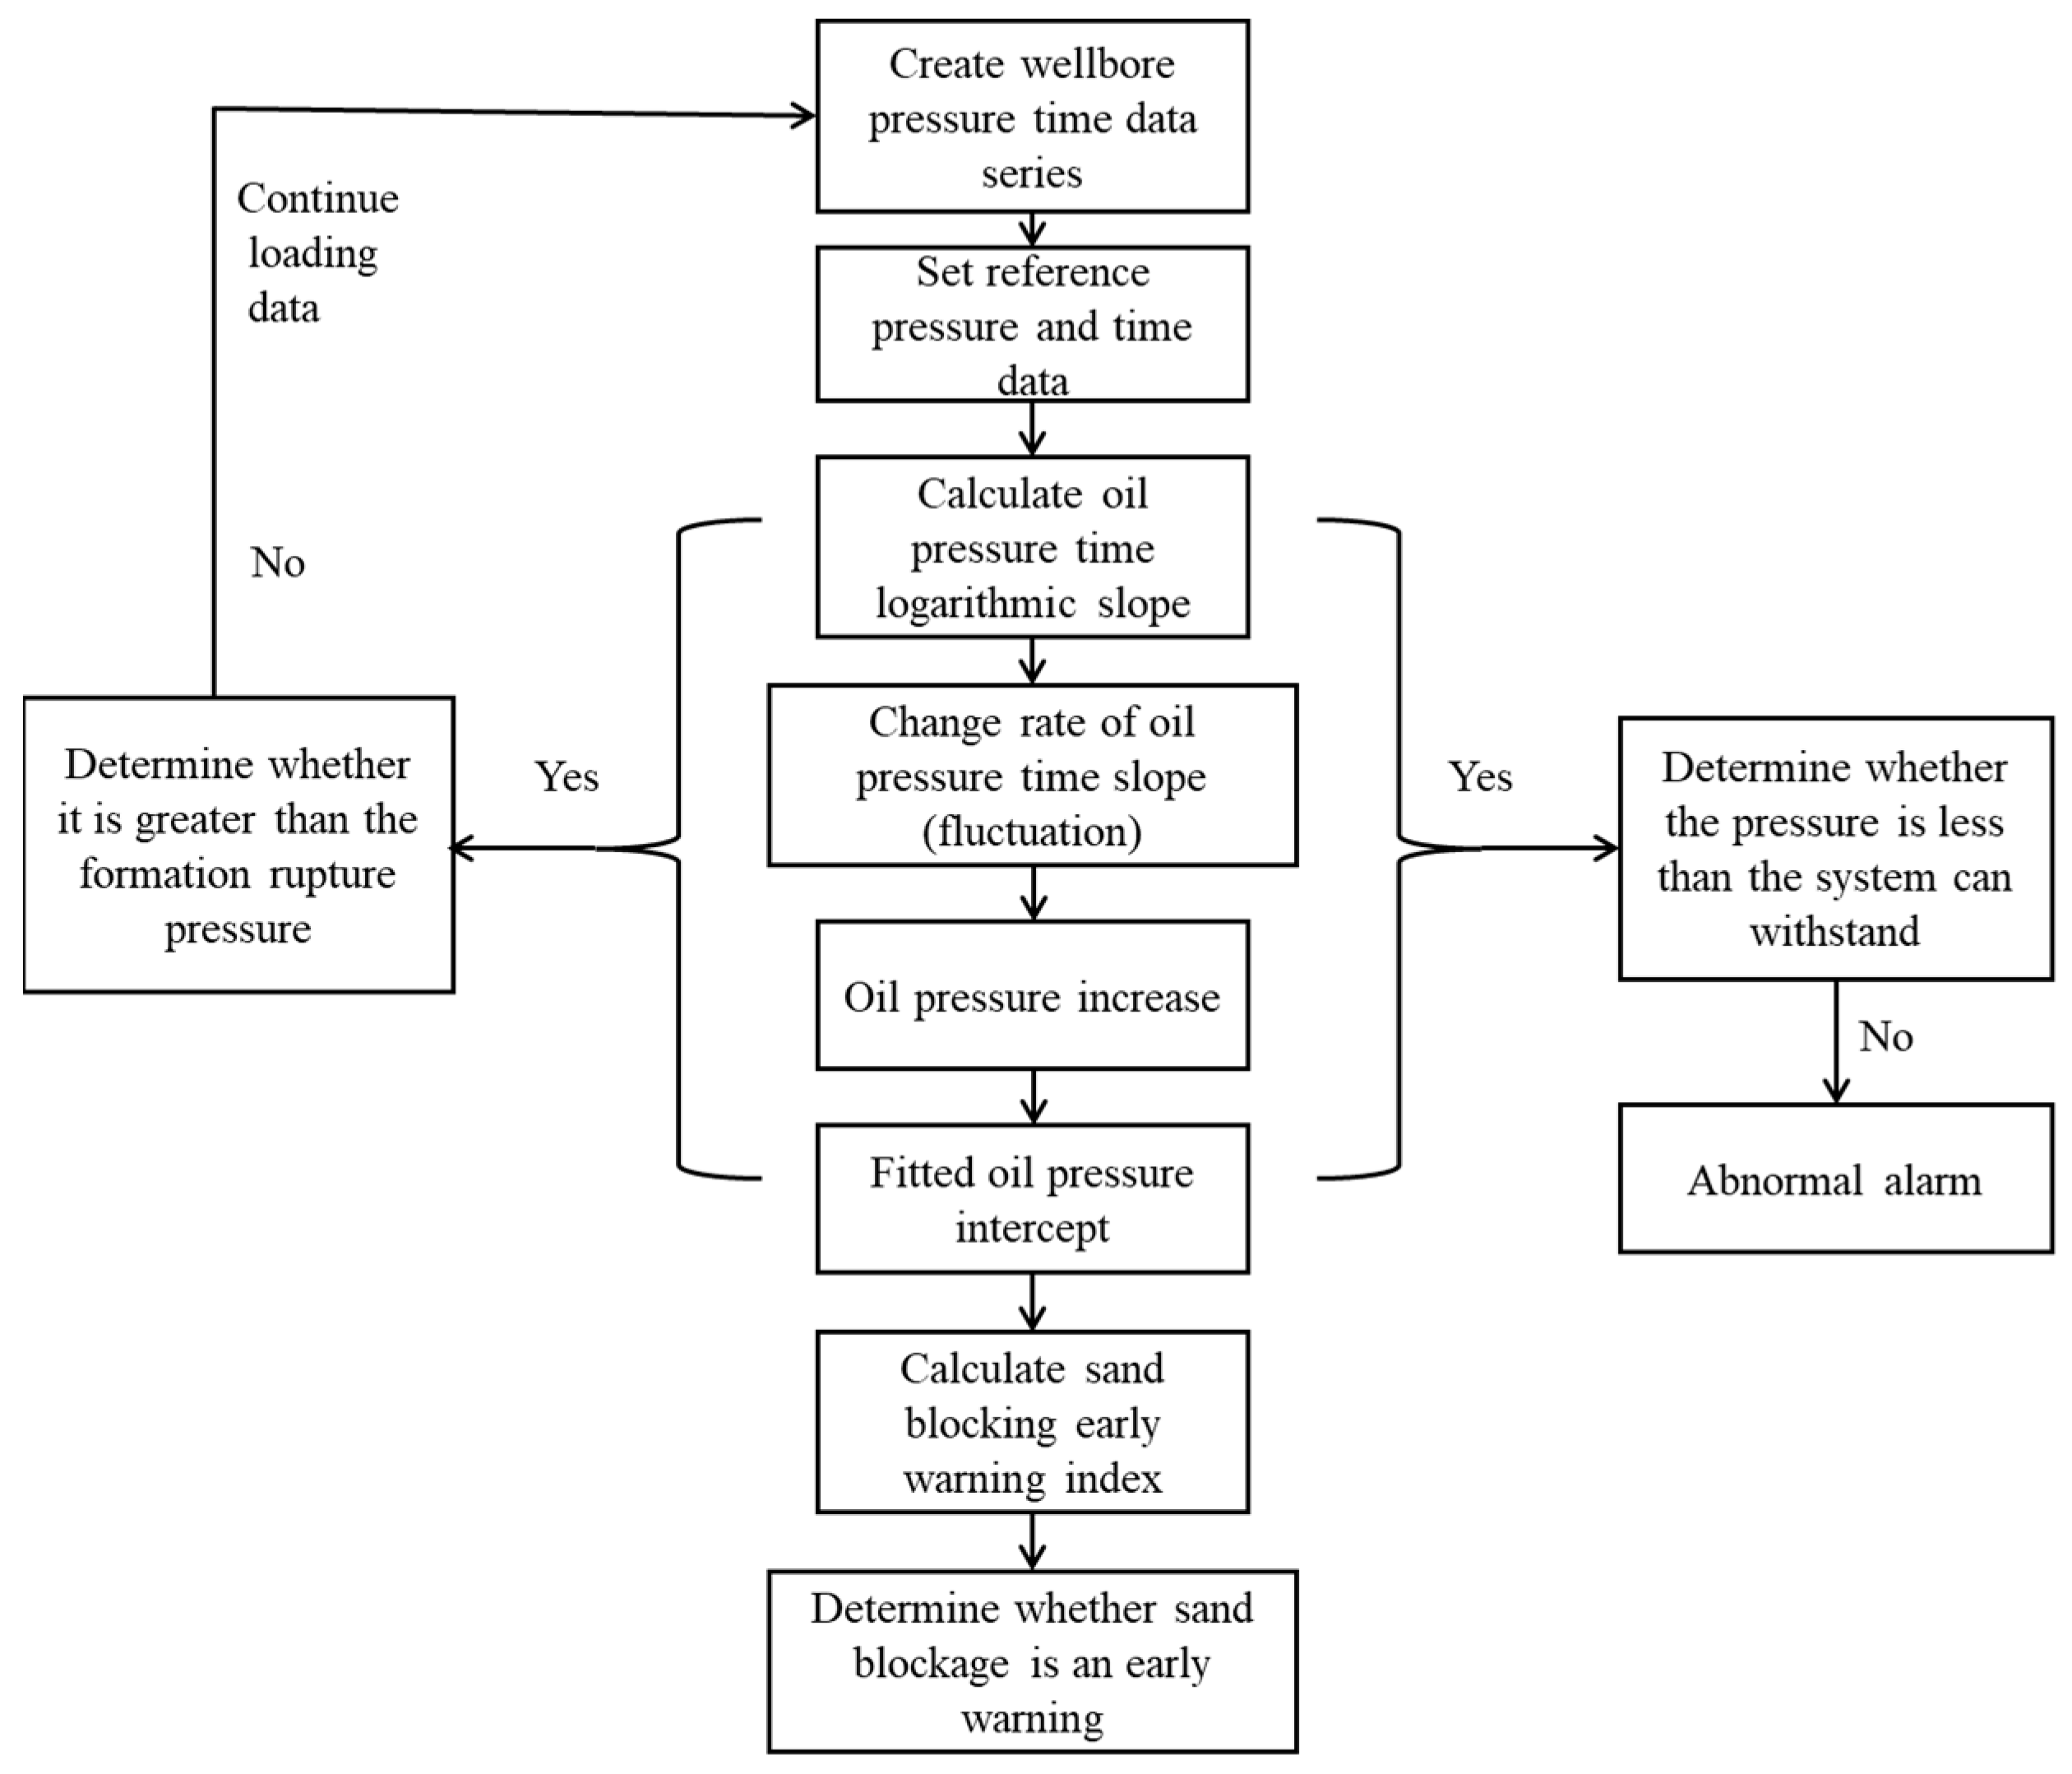
The fracturing construction curve is paramount in on-site operations, providing a direct window into subsurface conditions and fracture extension. The methods outlined in the preceding sections represent some of the most direct and straightforward approaches currently employed in the Chinese field. However, fracturing activities are marked by rapid and substantial fluctuations, both upwards and downwards. Relying solely on logarithmic slopes to evaluate sand-plugging situations often leads to inconsistent and unpredictable early warnings, occasionally resulting in false alerts and erratic behavior. Conventional noise-reduction methods, such as moving averages and means, can significantly diminish the responsiveness of logarithmic slopes. Therefore, this chapter introduces an oil pressure–time dynamic analysis method for sand-plugging early warnings. This method remains primarily anchored in the double logarithmic slope of oil pressure–time. In tandem, it introduces the change rate of the double logarithmic slope of oil pressure–time, oil pressure increments, and the fitted oil pressure intercept to collectively assess sand-plugging conditions. This approach effectively reduces false alarms in early warnings while preserving precision in detecting sand blockages. The specific implementation of this method is illustrated in Figure 3.

Figure 3.
Schematic diagram of the dynamic analysis method.
The specific steps are as follows:
1. Extract oil pressure data , Pn and corresponding time data
2. Determine whether the oil pressure is greater than the formation fracture pressure
3. Take the oil pressure and time data as the current data, and record the serial number as
4. Calculate the logarithmic slope of oil pressure–time
5. Calculate the oil pressure–time logarithmic slope change rate
6. Calculate the oil pressure increment in the stage
7. Calculate the fitted oil pressure intercept
8. Calculate the sand-blocking early-warning index
9. Divide the sand-blockage early-warning judgment range
10. Determine the sand-blocking situation
In summary, the dynamic analysis method is a new approach for comprehensively judging sand-plugging conditions based on the data of the fracturing construction curve, using four evaluation indicators: (1) the oil pressure–time double logarithmic slope, (2) the oil pressure–time double logarithmic slope change rate, (3) the oil pressure increment, and (4) the fitted oil pressure intercept. These four indicators are combined with weights to make a comprehensive assessment. Among them, the oil pressure–time logarithmic slope represents the degree of change in oil pressure over time; the slope change rate of the oil pressure–time double logarithm is the change rate of , providing an intuitive reflection of trends; the oil pressure increment is used to determine the increase (or decrease) in oil pressure over a certain time period; and the fitted oil pressure intercept corresponds to the intercept of the one-variable linear function regressed between data points. The sand-blockage early-warning index is the product of these four standardized indicator values and their respective weights. The following section will introduce the specific calculation formulas involved in the dynamic analysis method.
- Oil pressure–time slope
- is the oil pressure–time slope;
- is the current oil pressure, MPa;
- is the oil pressure in the last second, MPa;
- is the current time, s;
- is the last second, s.
- 2.
- Oil pressure–time slope change rate
- is the oil pressure–time slope change rate;
- is the oil pressure–time slope.
- 3.
- Oil pressure increase
- Maximum oil pressure within 5 s, MPa;
- Minimum oil pressure within 5 s, MPa;
- is the oil pressure increase within 5 s, MPa.
- 4.
- Fitted oil pressure intercept
Fitting the oil pressure intercept first involves using the least-squares method to perform one-variable linear regression analysis on the pressure and time data of five consecutive oil pressure points to create a regression curve. Subsequently, the intercept of the fitted oil pressure is calculated using the linear equation to observe how the fitted oil pressure varies under different regression curves. The principle of the least-squares method is as follows:
Suppose is a function of variables , containing parameters that is
There are currently groups () of data , . Put the data into Equations (4) to get the calculated value . Generally, the calculated value is not equal to the data data , but there is a deviation :
The least-squares method means that the sum of squares of the deviations is the minimum:
Obviously, is a function of the parameters . For this reason, it should be
Solve from the system of Equation (7), and bring them into the functional relationship expression (4). In this way, the curve it best fits the data , , After obtaining the fitting equation, find its intercept to obtain the fitted oil pressure intercept.
- 5.
- Sand-blocking early-warning index
Record the standardized value of the oil pressure–time slope as index , the standardized value of the oil pressure–time slope change rate as index , the standardized value of the oil pressure increment as index , the standardized value of the fitted oil pressure intercept as index , and then the sand-plug early-warning index (Formulas (8) and (9)) is
are the importance levels of each indicator, respectively.
Among the four indicators, are positive indicators, and the standardization process is as shown in Equation (10):
is a negative indicator, and its normalization process is as shown in Equation (11):
A reasonable early-warning index range was obtained by consulting the on-site engineer: 0~0.5 indicates normal fracturing of the formation; 0.5~0.62 indicates a low-risk fracturing warning; 0.62~1 indicates a sand-plugging early warning.
3. Application Effect Analysis
3.1. Actual Fracturing Situation of Well A1 in Fuling
We used the newly proposed method to conduct practical application research on sand-plugging wells in the Fuling area and determine the early-warning effect of fracturing-sand plugging through practical analysis in order to provide on-site fracturing construction experts with a comprehensive grasp of construction site information, understand the sand-plugging situation, and prepare for the next step of construction. Excluding the guiding opinions, this is of great significance to assist decision-making in fracturing construction.
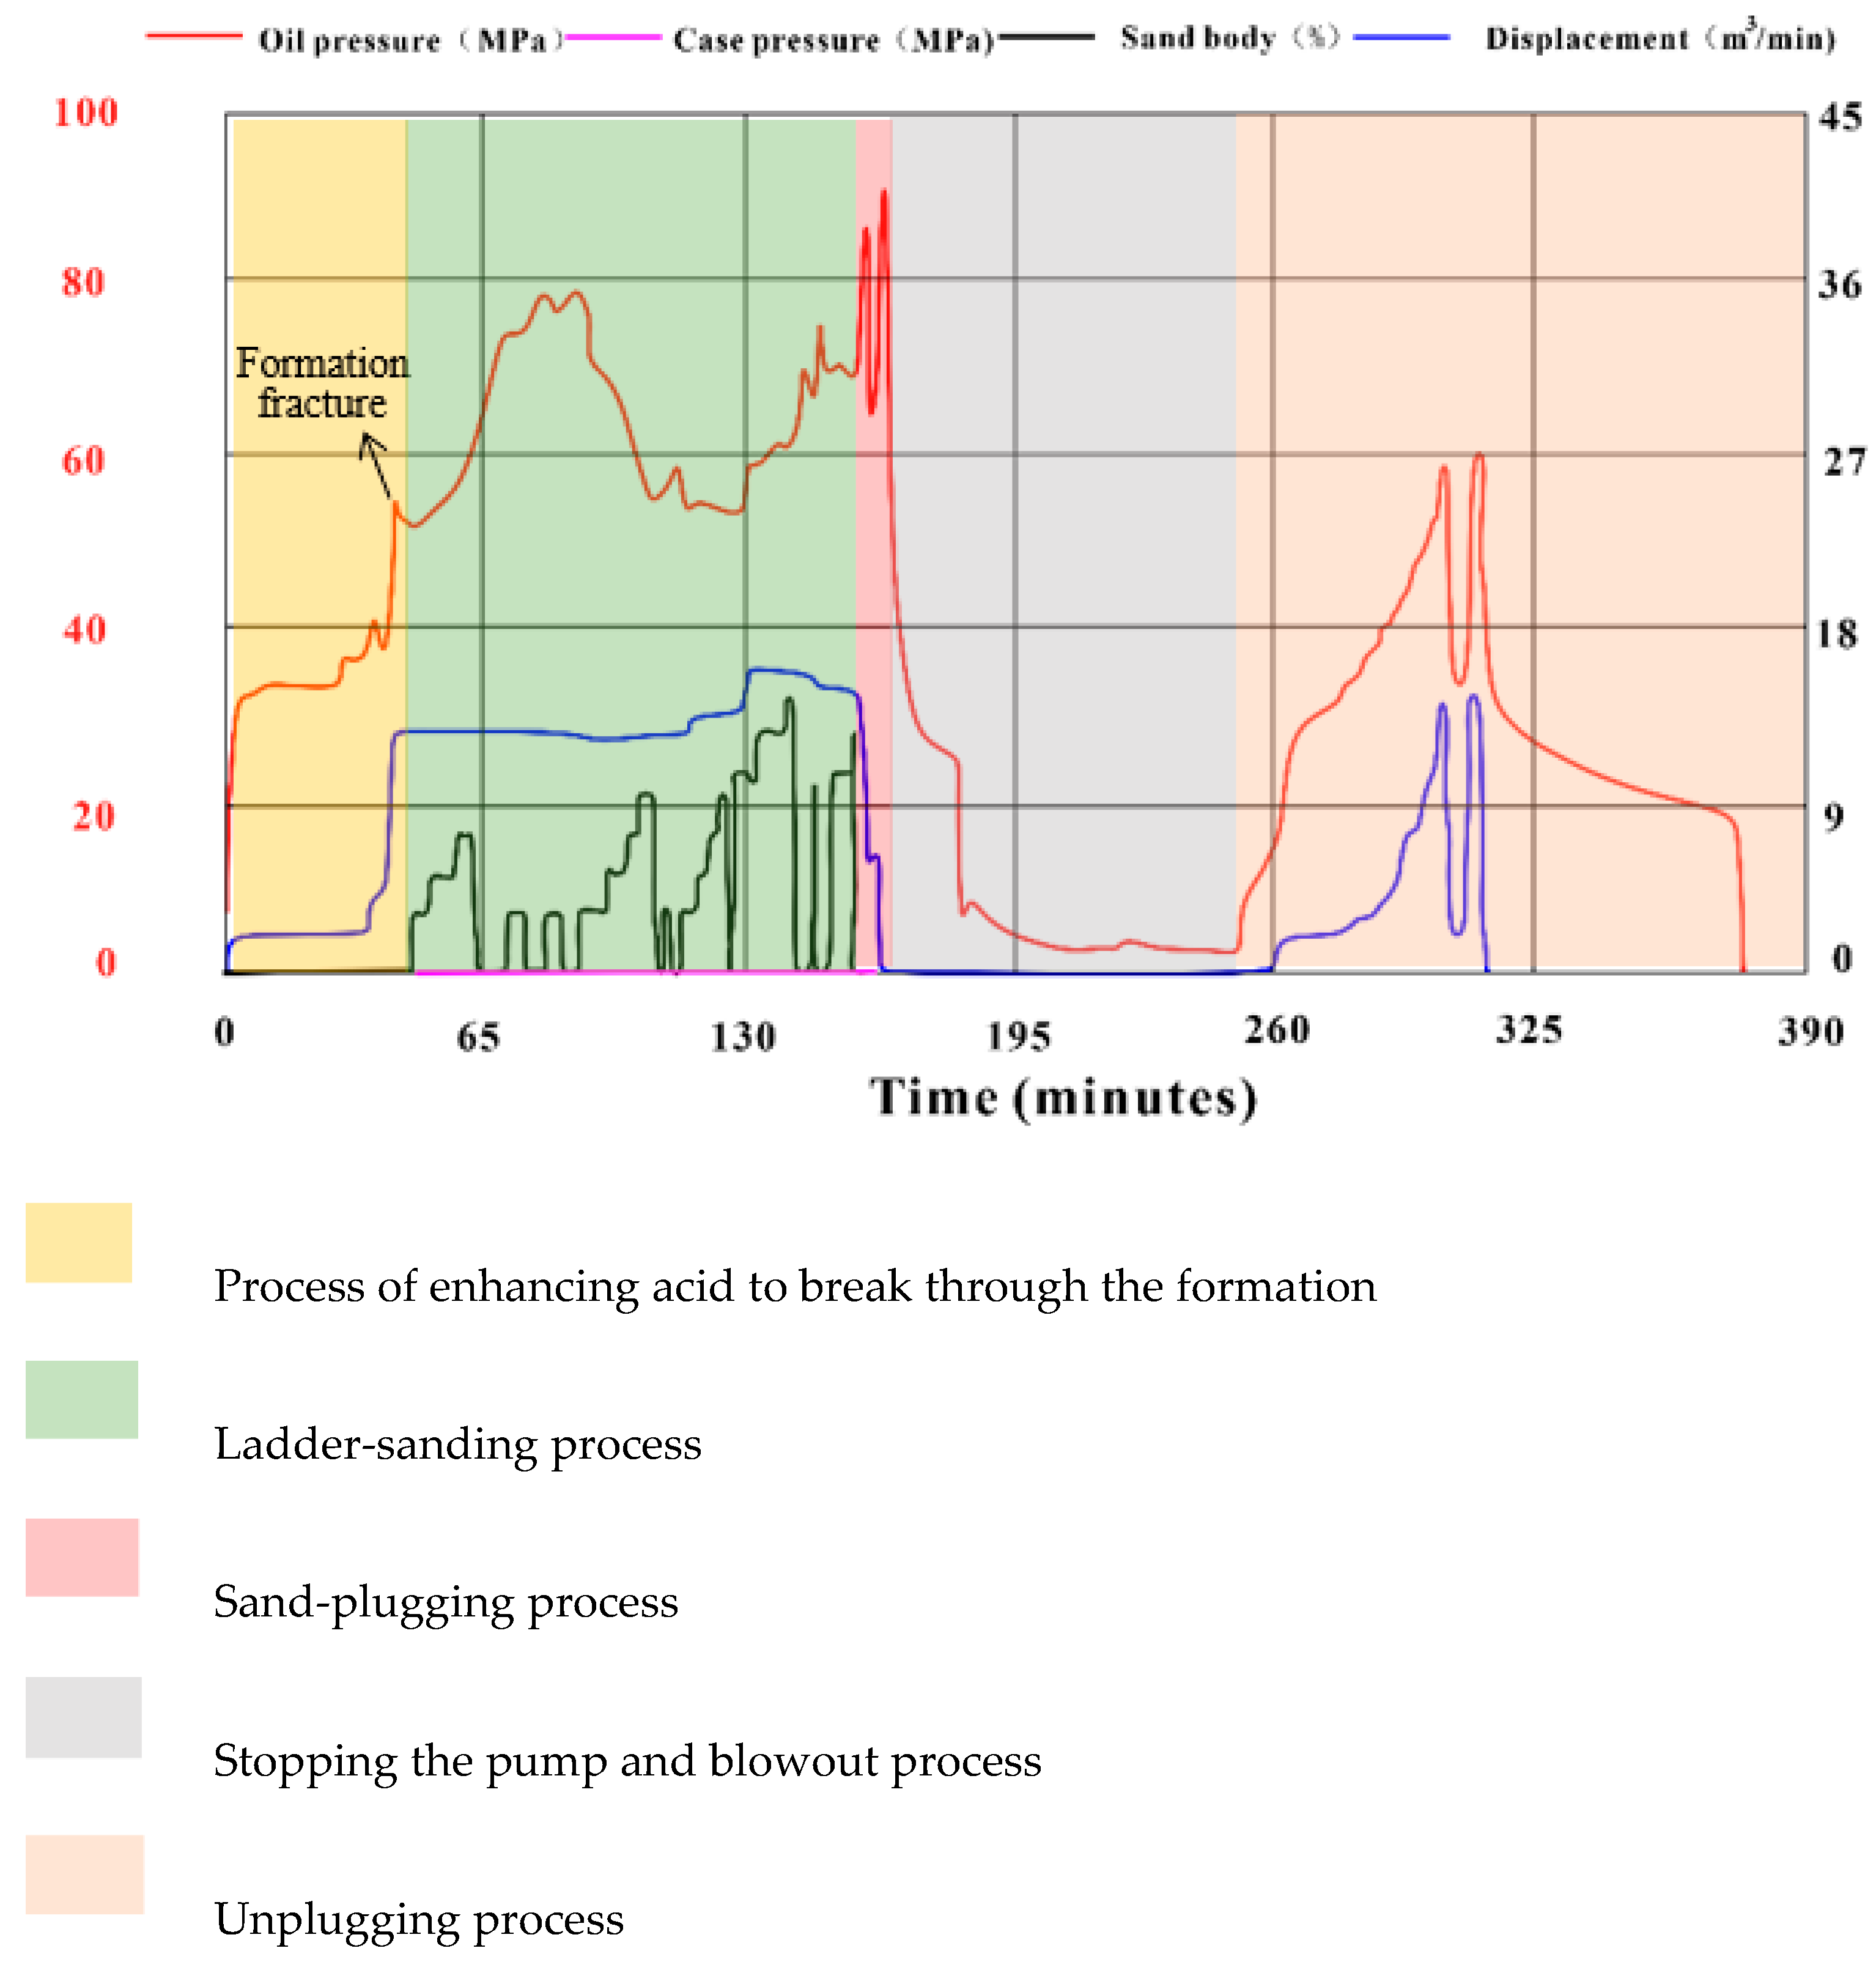
Taking the 4th section of Well A1 in Fuling as an example, Figure 4 shows the fracturing construction curve of the 4th section.
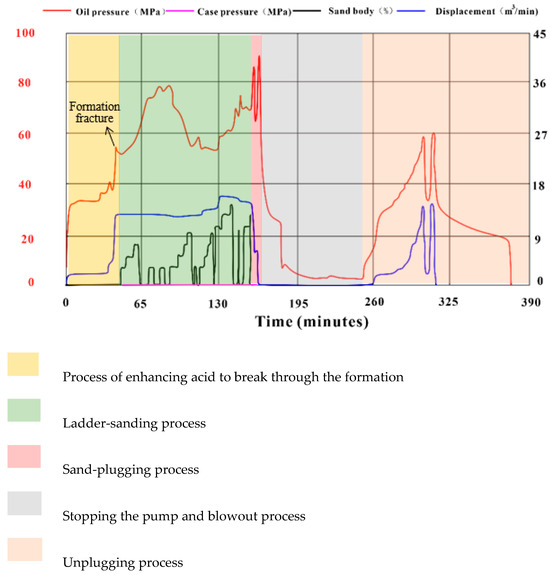
Figure 4.
The fourth stage of fracturing in Well A1 goes through the following stages.
- (1)
- Acid replacement stage
In the early stage of Well A1, 9.79 m3 of isolation fluid was injected, followed by the injection of 10.00 m3 of hydrochloric acid. The hydrochloric acid construction pump pressure ranged from 32.37 to 33.75 MPa, with a displacement of 1.8~1.9 m3/min. After the hydrochloric acid injection, drag-reducing water was injected to facilitate acid reduction. After the acid reduction, the displacement was rapidly increased to break through the formation, with a fracture pressure of 55.43 MPa. The acid reduction pressure decreased from 41.51 MPa to 37.21 MPa. This stage mainly uses strong corrosive acid as the prepad fluid to break through the formation.
- (2)
- Sand-plugging stage
After the pressure stabilized, 70/140 mesh quartz sand was gradually introduced with sand ratios of 3%, 5%, and 7%. After injecting 9.84 m3, the pressure increased significantly, rising from 61.99 MPa to 74.47 MPa. The sand injection was stopped, and pressure stability was awaited before injecting fine sand for polishing. Subsequently, a stepwise addition of sand ratios of 3%, 5%, 7%, and 9% was carried out in conjunction with drag-reducing water, resulting in a continuous decrease in oil pressure from 79.52 MPa to 54.42 MPa. Sand injection was stopped, and coarse-grained coated quartz sand with a sand ratio of 3% was added in conjunction with drag-reducing water. After injecting 8.89 m3, sand injection was stopped to observe pressure changes. As the pressure remained stable, medium sand with sand ratios of 10%, 12%, and 14% was injected, totaling 26.44 m3. The pressure increased significantly, and after stabilization, medium sand with sand ratios of 13%, 10%, and 12% was injected in conjunction with drag-reducing water. After injecting 10.10 m3 of medium sand, the pressure rose steeply and the sand injection was stopped. Subsequent to sand plugging, there was an increase in pressure followed by a decrease in discharge volume. After injecting 46.15 m3 of drag-reducing water to replace potassium chloride, the pressure rose sharply to 95.99 MPa, causing the pump to shut down due to overpressure. During this stage, fracturing is mainly carried out using stepped sand injection for 45–155 min. At 155–160 min, the pressure becomes abnormal, and at around 160 min, the pressure suddenly rises and the pump is stopped due to overpressure.
- (3)
- Blockage relief stage
Following the sand blockage, on-site jetting was performed as a remedial measure. After the jetting was completed, the pump was operated at a rate of 0.2 m3/min to conduct a test squeeze. The initial pressure during jetting was 25.32 MPa, which later dropped to 2.71 MPa. After closing the jetting outlet, the oil pressure increased to 12.50 MPa, and the jetting process concluded.
Upon completing the jetting, a test squeeze was initiated with a focus on monitoring pressure variations while increasing the displacement. After injecting 191.27 m3 of drag-reducing water, the reagent was successfully tested. To reduce surface tension and promote reverse discharge, potassium chloride was injected to replace 3.08 m3 of the lowered displacement. Subsequently, drag-reducing water isolation fluid was injected, totaling 60.29 m3, before the pump was stopped to complete the fracturing operation.
From the construction process perspective, sand plugging began around the 155th min into the operation and ceased at the 160th min, lasting for 5 min. It is evident that sand plugging occurs rapidly, underscoring the need for experienced on-site engineers to diagnose and manage the situation; otherwise, the consequences could be catastrophic.
3.2. Application of New Methods
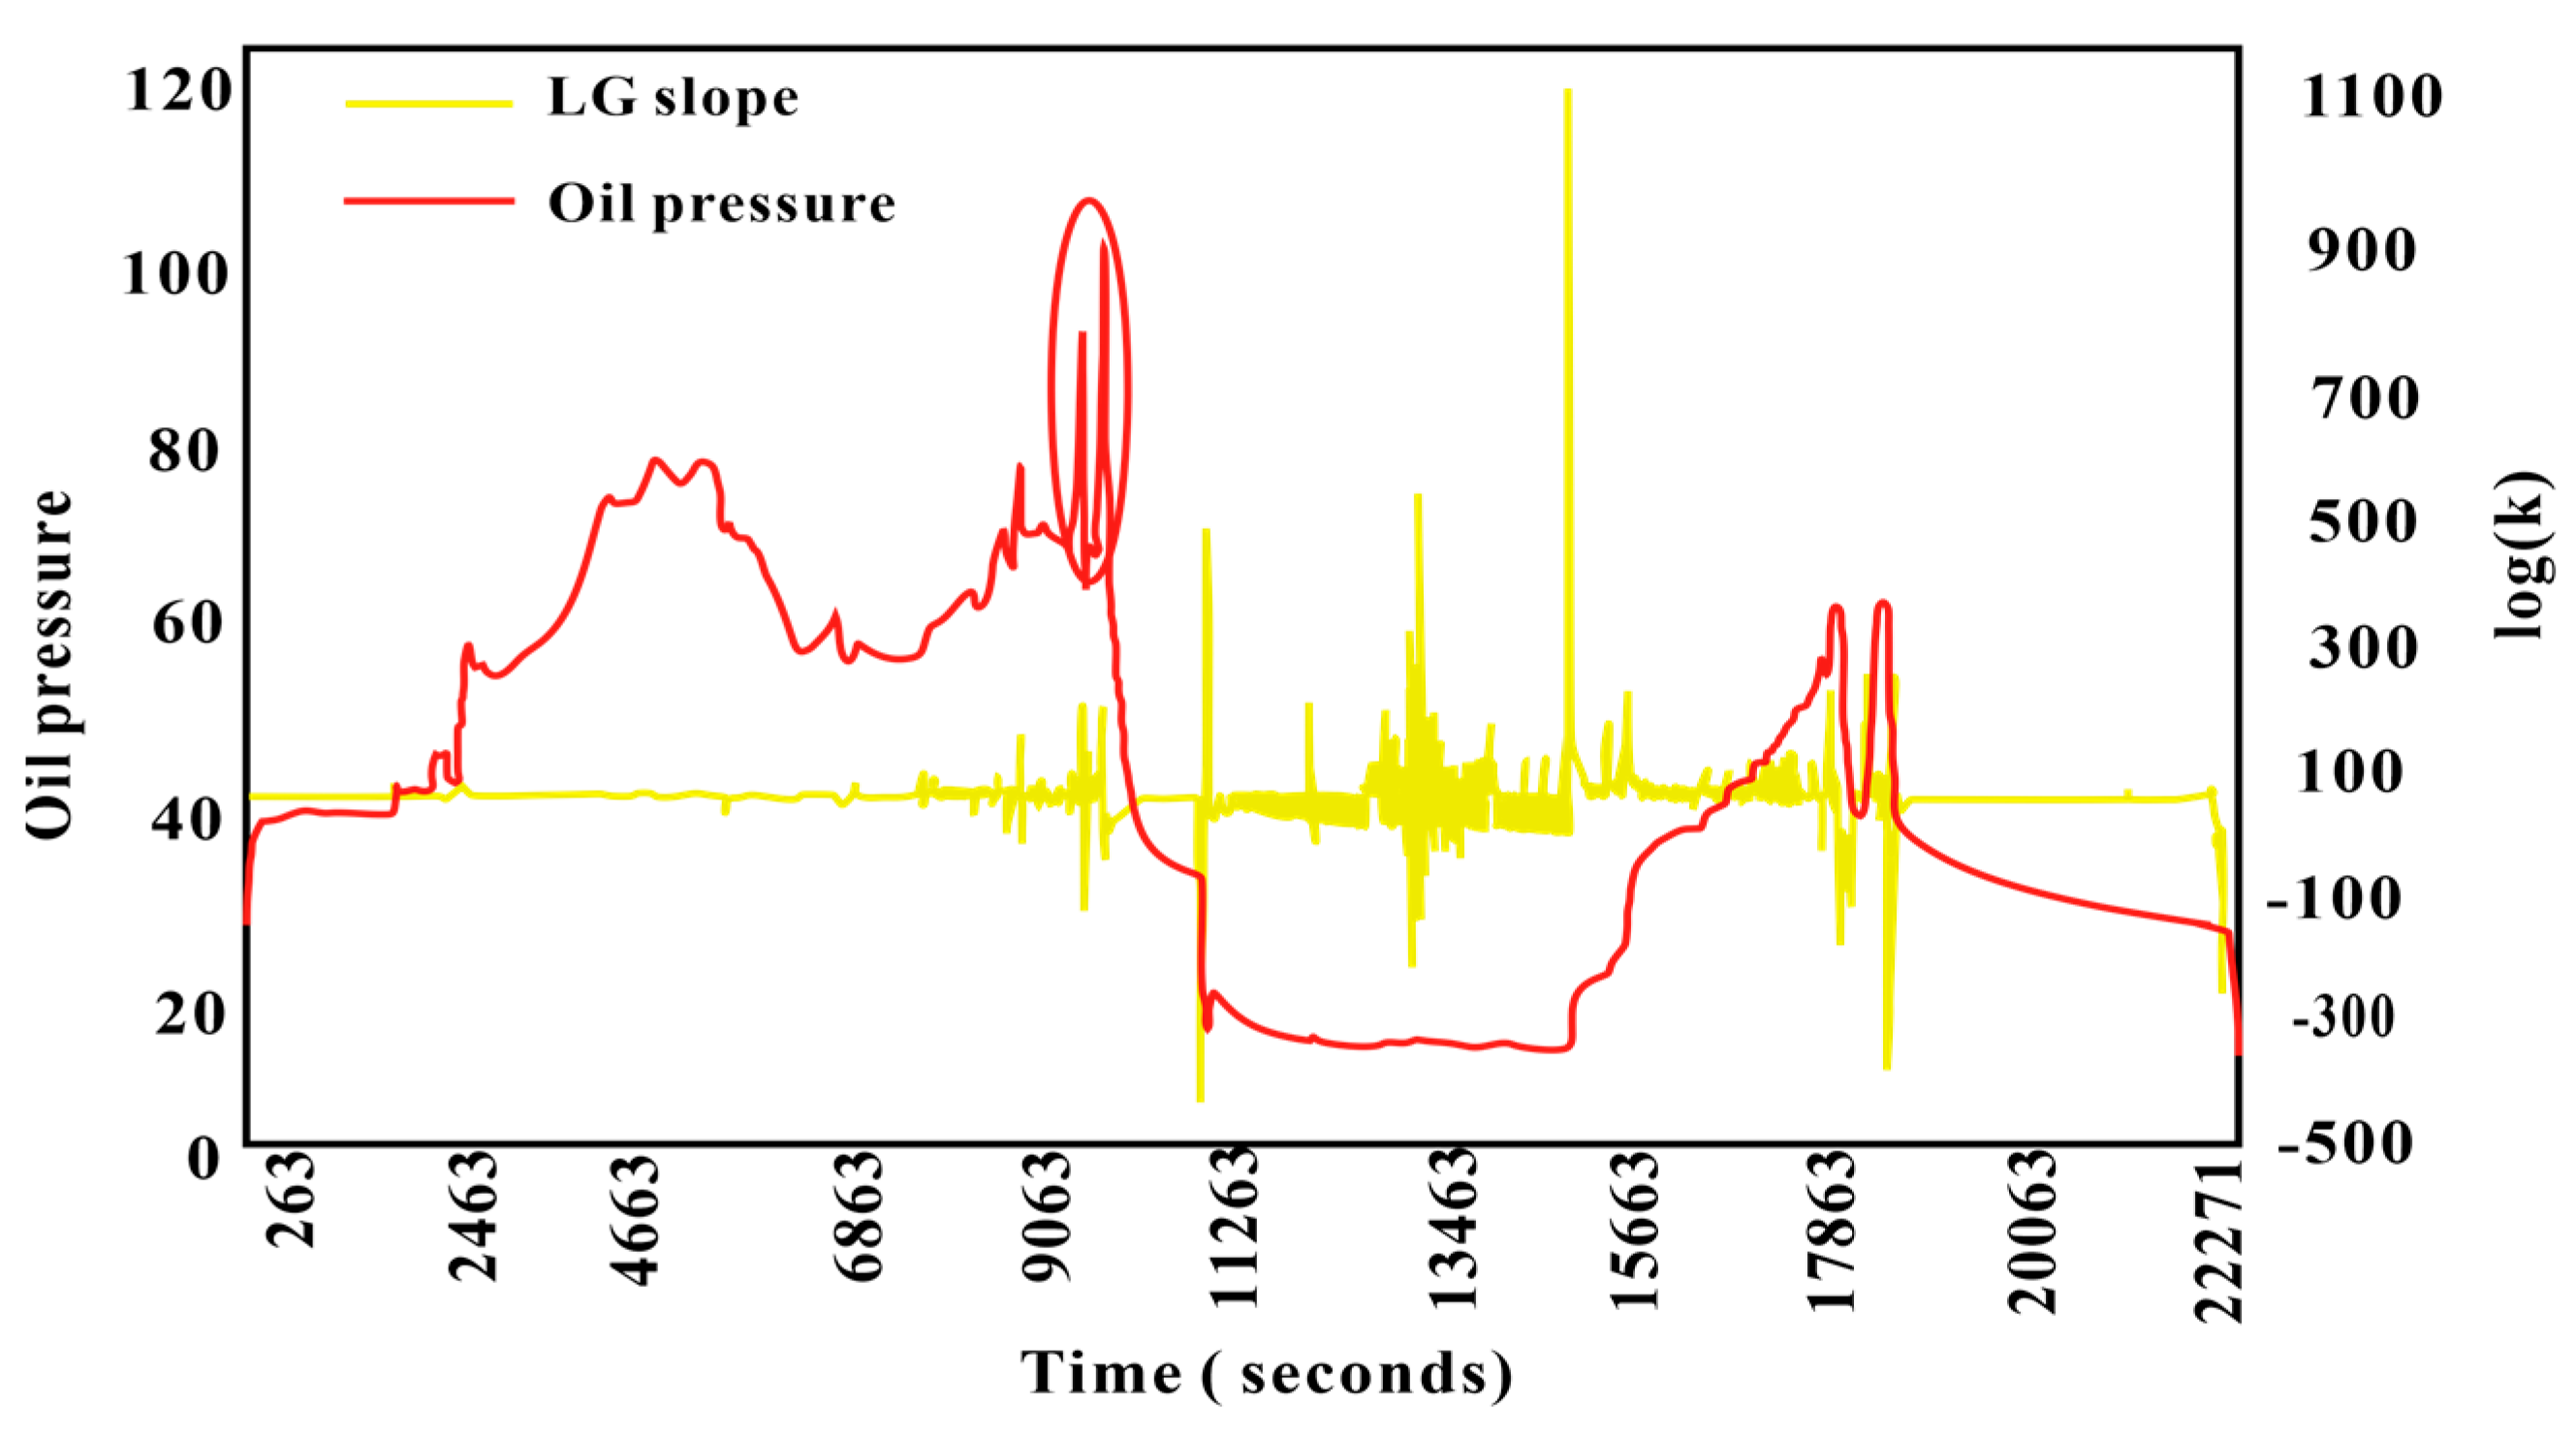
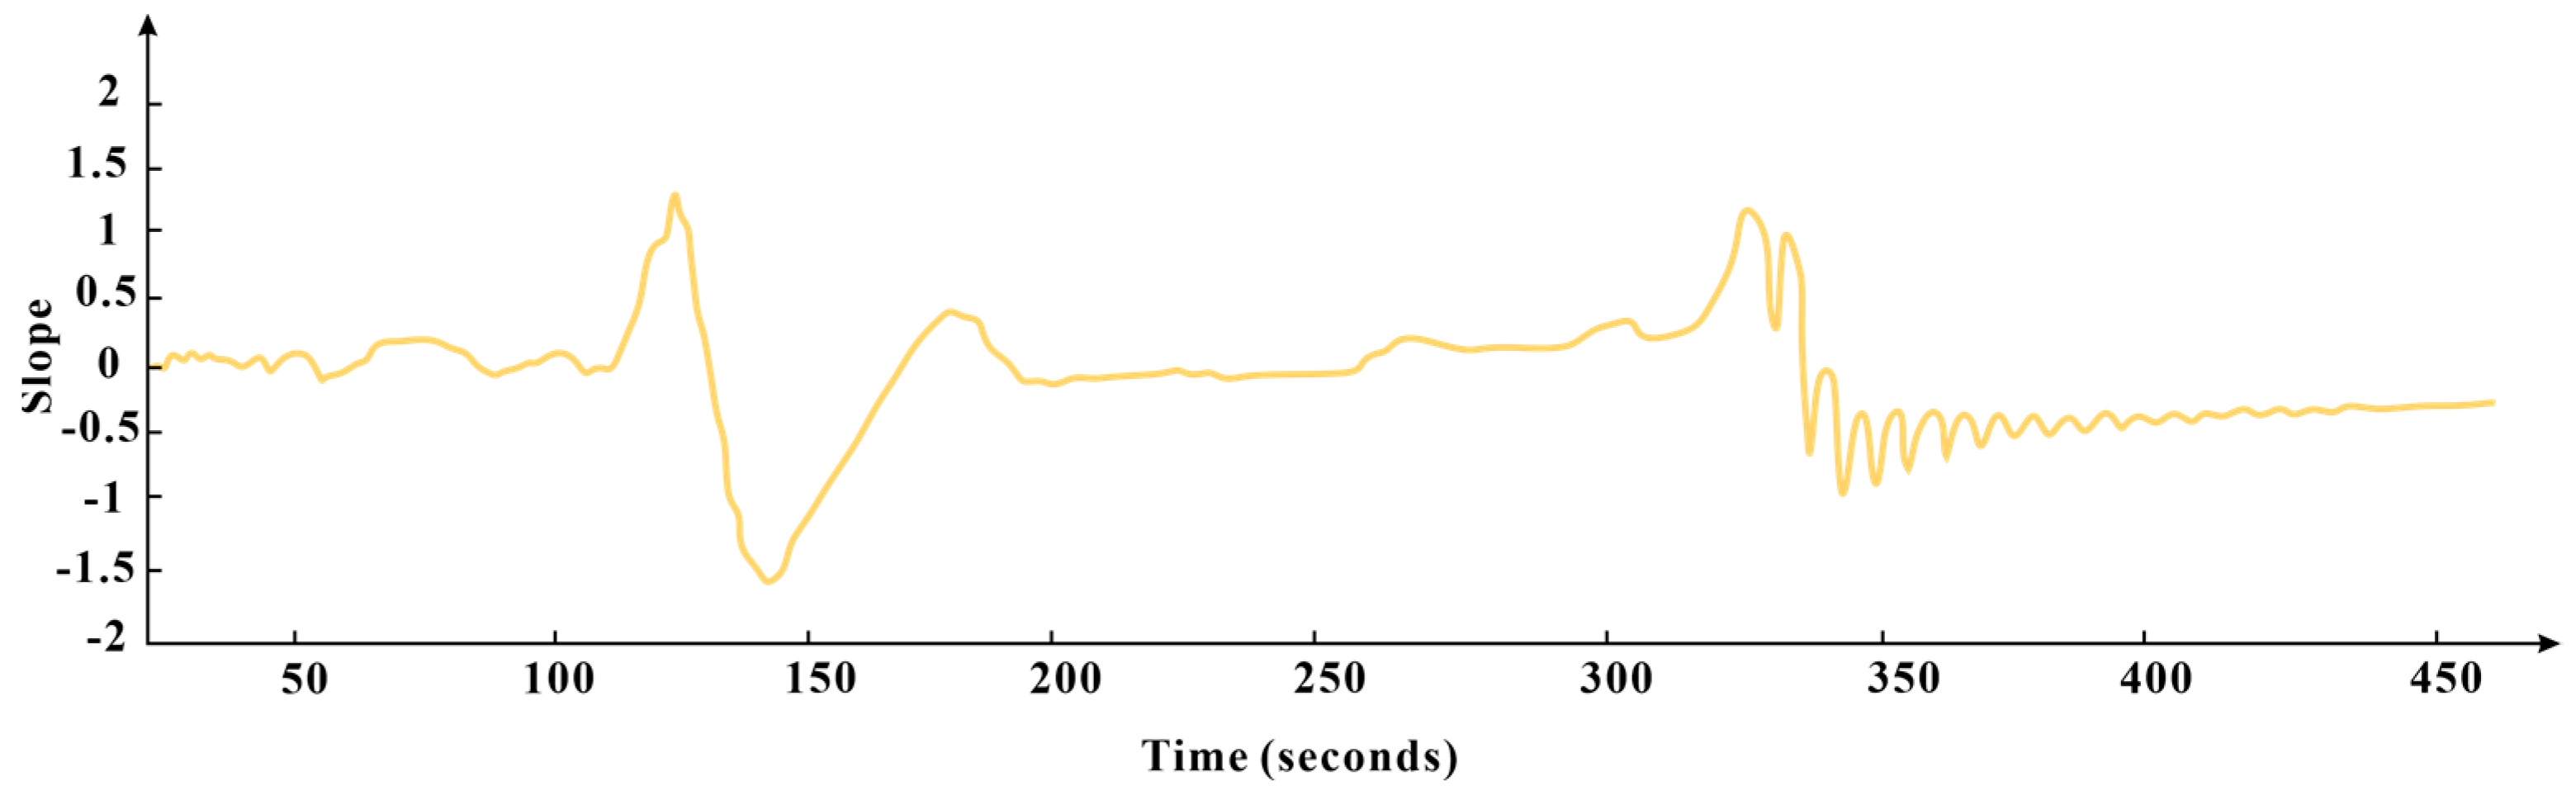
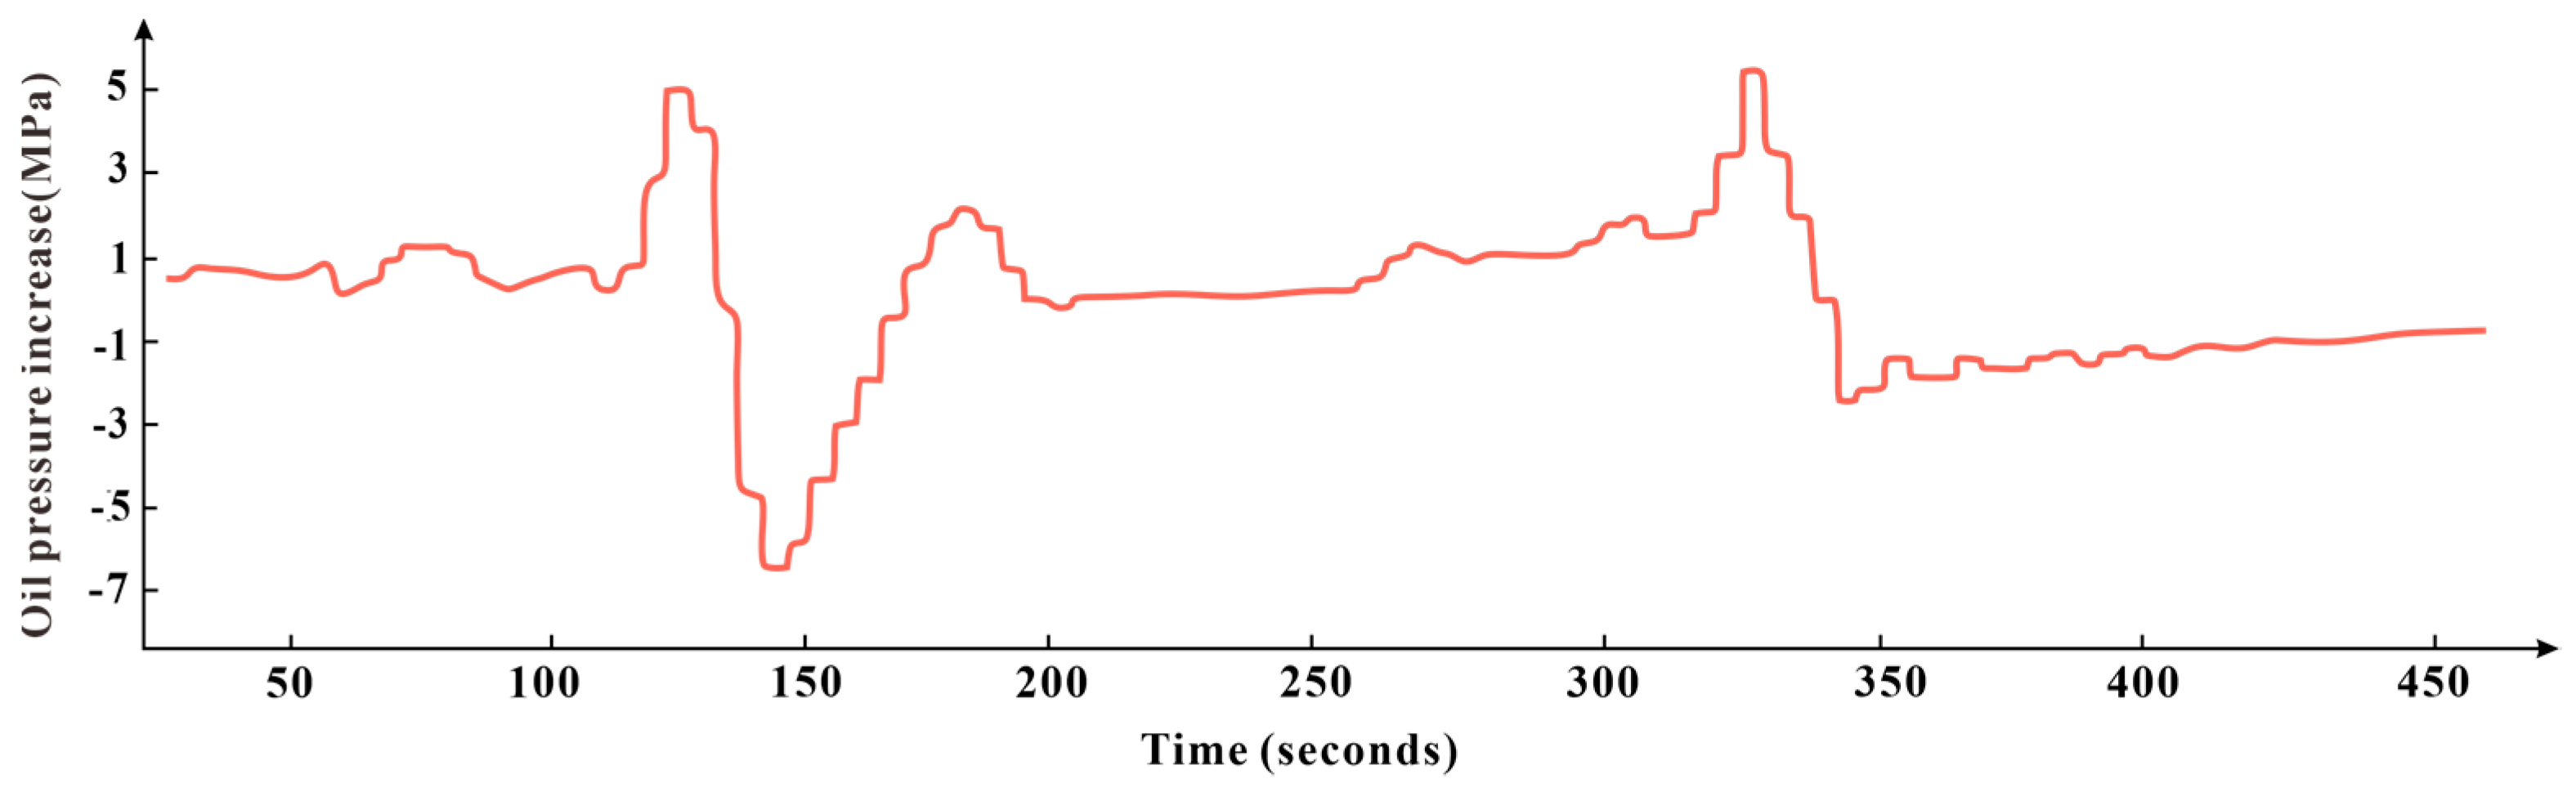
The oil pressure–time double logarithmic slope graph is drawn according to the method introduced in Section 2, as shown in Figure 5. To more clearly illustrate the trend near the sand plug, the circled sand plug section in Figure 5 is enlarged. See Figure 6 for the enlarged trend graph of the oil pressure–time double logarithmic slope. The oil pressure–time double logarithmic slope can play a very good scaling role in fracturing operations. In logarithmic functions, the smaller the X value, the larger the Y value, and vice versa. Therefore, after taking the logarithm, the slope of oil pressure–time in the fracturing construction data can be scaled. When its change is large, noise can be reduced, and when its change is small, it can be enlarged. As can be seen from Figure 6, there are two changes in the oil pressure–time double logarithmic slope within 7–8 min before and after the sand plug. Figure 7 shows the increment of oil pressure within 5 s, which can clarify the oil pressure increment and filter out small oil pressure fluctuations, highlighting the main possible sand plugs. As shown in Figure 7, when the oil pressure rises after 100 s, the oil pressure increment also rises significantly, and many small fluctuations are filtered out compared with Figure 6 within 200–250 s, especially after 350 s. Figure 8 shows the change rate of the oil pressure–time double logarithmic slope, which mainly enhances the large fluctuations of the double logarithmic slope in Figure 6, such as within 100–150 s and 300–400 s, while also enhancing the warning range. Figure 9 fits the oil pressure intercept mainly to reduce small fluctuations without affecting the main fluctuations, maximizing the main contradiction, such as the smoothing process before 100 s, the amplification process within 100–200 s, and the amplification process after 300 s in the figure.

Figure 5.
Fracturing-sand plugging completion double logarithm slope of oil pressure over time.

Figure 6.
Sand-blocked section of the double logarithm slope of oil pressure over time.
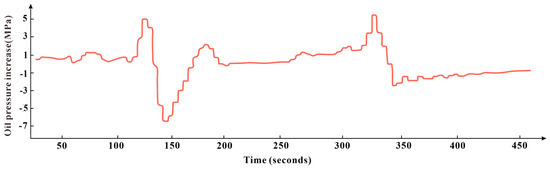
Figure 7.
Oil pressure increase chart within 5 s.
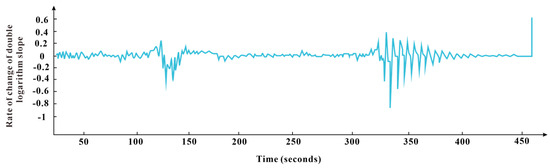
Figure 8.
Rate of change of the double logarithm slope of oil pressure over time.
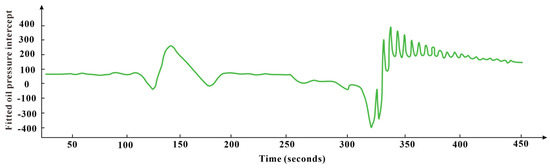
Figure 9.
Fitted oil pressure intercept.
The first three indicators among the oil pressure–time double logarithmic slope, oil pressure increment within 5 s, oil pressure–time double logarithmic slope change rate, and fitted oil pressure intercept are standardized using Formula (10), while the last one, which is a negative indicator, is standardized using Formula (11). These standardized values are then substituted into Formula (9) to calculate the sand plug warning index. The calculation results are shown in Figure 10. By combining these four indicators, a sand-plug warning index that amplifies the sensitivity of the sand-plug segment while reducing abnormal warnings can be obtained. As can be seen in Figure 10, the red line represents the oil pressure, and the blue line represents the sand-plug warning-index line. At 91 s, the warning index exceeds 0.5, triggering a low-risk warning. As the warning index suddenly increases, its value quickly exceeds 0.62, reaching the sand-plug warning standard. However, if judged manually at this time, with an oil pressure of 75 MPa, it is difficult to determine whether there is a warning threshold. As time progresses, when the oil pressure reaches 85 MPa, a manual judgment can be made that a sand plug has occurred, with a delay of approximately 20 s. As time progresses to 289 s, the warning index exceeds 0.5 again, triggering another low-risk warning for a sand plug. As time progresses to 319 s, the warning index exceeds 0.62, reaching the sand-plug warning threshold. However, at this time, with an oil pressure of around 72 MPa, it is difficult to manually determine whether a sand plug is possible. As time progresses and the oil pressure reaches around 85 MPa, a manual judgment can be made that a sand plug has occurred, but this is already 39 s slower than the warning index judgment. Therefore, during the eight-minute sand plug period at the site, the manual identification time for a sand plug is approximately 10–15 s, while the dynamic analysis method can improve this time to 24–48 s. It can be seen that the improvement of the new method is very significant.
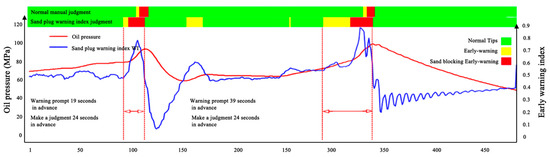
Figure 10.
Sand-blocking early-warning index chart.
Sand plugging often occurs on site in about 20 s. If adjustments are not made in time, high pressure may build up and cause a blowout, resulting in a major on-site accident. If it is possible to predict 24–48 s in advance, it is crucial to propose adjustment measures on site.
4. Conclusions
In the field of monitoring and early warning, the commonly employed method is the double logarithmic slope analysis of oil pressure and net pressure over time. However, this method often yields highly fluctuating early-warning results, which do not consistently yield effective outcomes. To address this issue and enhance sand-plugging prediction, a dynamic analysis approach has been proposed. This approach combines the double logarithmic slope of oil pressure over time with additional metrics, including the oil pressure increment within a 5 s interval, the rate of change of the double logarithmic slope of oil pressure over time, and the fitted oil pressure intercept. Using a well, denoted as Well A in Fuling, as a validation case, the results indicate that this dynamic analysis method can predict sand plugging with reduced warning signal fluctuations without compromising sensitivity. Moreover, when compared to conventional methods, it provides approximately a 10 s lead time in early warnings.
This method has good guarantees in terms of accuracy and dynamic response, but there is still a lack of predictive lead time. With the increase in sand-plugging conditions, deep learning can be used for extensive training in subsequent improvements to identify what features are precursors to sand plugging. Using this as an early-warning index can better predict the warning time in advance. It is also a good way to improve this method.
Author Contributions
J.H. and M.F. designed and performed a series of experiments; J.H. and M.L. collated the experimental data; and Y.Y. and M.L. were responsible for supervision. All authors have read and agreed to the published version of the manuscript.
Funding
This research received no external funding.
Data Availability Statement
The data presented in this study are available in the insert article.
Conflicts of Interest
Author Yang Yu was employed by the company Sinopec Zhongyuan Petroleum Engineering Co., Ltd. Downhole Special Operations Company; Author Minxuan Li was employed by the company CNOOC China Limited Hainan Branch. The remaining authors declare that the research was conducted in the absence of any commercial or financial relationships that could be construed as a potential conflict of interest.
References
- Ishida, T. Acoustic emission monitoring of hydraulic fracturing in laboratory and field. Constr. Build. Mater. 2001, 15, 283–295. [Google Scholar] [CrossRef]
- Liang, H.; Xian, A.; Mao, M.; Ni, P.; Wu, H. A research on remote fracturing monitoring and decision-making method supporting smart city. Sustain. Cities Soc. 2020, 62, 102414. [Google Scholar] [CrossRef]
- Liang, H.; Zou, J.; Khan, M.J.; Jinxuan, H. An sand plug of fracturing intelligent early warning model embedded in remote monitoring system. IEEE Access 2019, 7, 47944–47954. [Google Scholar] [CrossRef]
- Lu, C.; Ma, L.; Li, Z.; Huang, F.; Huang, C.; Yuan, H.; Guo, J. A novel hydraulic fracturing method based on the coupled CFD-DEM numerical simulation study. Appl. Sci. 2020, 10, 3027. [Google Scholar] [CrossRef]
- Zhang, X.; Zhang, L.; Hu, J. Real-time diagnosis and alarm of down-hole incidents in the shale-gas well fracturing process. Process Saf. Environ. Prot. 2018, 116, 243–253. [Google Scholar] [CrossRef]
- Montori, F.; Bedogni, L.; Bononi, L. A collaborative internet of things architecture for smart cities and environmental monitoring. IEEE Internet Things J. 2017, 5, 592–605. [Google Scholar] [CrossRef]
- Ahmed, E.; Yaqoob, I.; Gani, A.; Imran, M.; Guizani, M. Internet-of-things-based smart environments: State of the art, taxonomy, and open research challenges. IEEE Wirel. Commun. 2016, 23, 10–16. [Google Scholar] [CrossRef]
- Gholami, R.; Moradzadeh, A.; Maleki, S.; Amiri, S.; Hanachi, J. Applications of artificial intelligence methods in prediction of permeability in hydrocarbon reservoirs. J. Pet. Sci. Eng. 2014, 122, 643–656. [Google Scholar] [CrossRef]
- Liang, H.; Zou, J.; Zuo, K.; Khan, M.J. An improved genetic algorithm optimization fuzzy controller applied to the wellhead back pressure control system. Mech. Syst. Signal Process. 2020, 142, 106708. [Google Scholar] [CrossRef]
- Liang, H.; Liu, G.; Gao, J.; Khan, M.J. Overflow remote warning using improved fuzzy c-means clustering in IoT monitoring system based on multi-access edge computing. Neural Comput. Appl. 2020, 32, 15399–15410. [Google Scholar] [CrossRef]
- Hu, J.; Zhang, S.; Zeng, R.; Liu, Z. Early warning method for sand plugging accidents in shale gas fracturing based on deep learning. China Saf. Sci. J. 2020, 3, 108–114. [Google Scholar]
- Yu, D.; Liang, H.; Yu, X.; Luo, J.; Che, H.; Liu, G. Real-time warning system for hydraulic fracturing in Huabei Oilfield. Oil Drill. Technol. 2015, 37, 85–87. [Google Scholar]
- Tan, C.; Zhai, Q.; Wu, Y. Application of remote command and decision-making system for fracturing and acidizing construction. China Pet. Chem. Ind. Eng. 2013, 2, 53–55. [Google Scholar]
- Dong, S.; Yuan, S.; Zhang, L.; Hu, J.; Chen, Y. Research on the development strategy of safety and integrity management technology of long-distance oil and gas pipelines. Bull. Pet. Sci. 2022, 7, 435–446. [Google Scholar]
- Haiyang, D. Research and Application of Real-Time Monitoring and Early Warning System for Fracturing Sand Plugging; Southwest Petroleum University: Chengdu, China, 2017. [Google Scholar]
- Xin, Z. Research on Real-Time Risk Assessment Methods for Shale Gas Fracturing Operations and Key Equipment Based on Bayesian Network; China University of Petroleum: Beijing, China, 2019. [Google Scholar]
- Ning, I.L.C.; Nemeth, T.; Zhang, Z.; Tan, Y.; Bevc, D.; Bartel, D.; Hughes, K.; Stefani, J.; DiSiena, J. Image-based fracture hit warning system with distributed acoustic sensing. In Proceedings of the First International Meeting for Applied Geoscience & Energy, Denver, CO, USA, 26 September–1 October 2021; Society of Exploration Geophysicists: Houston, TX, USA, 2021; pp. 397–401. [Google Scholar]


Disclaimer/Publisher’s Note: The statements, opinions and data contained in all publications are solely those of the individual author(s) and contributor(s) and not of MDPI and/or the editor(s). MDPI and/or the editor(s) disclaim responsibility for any injury to people or property resulting from any ideas, methods, instructions or products referred to in the content. |
© 2024 by the authors. Licensee MDPI, Basel, Switzerland. This article is an open access article distributed under the terms and conditions of the Creative Commons Attribution (CC BY) license (https://creativecommons.org/licenses/by/4.0/).