Article

The Study of Fluid Dynamics Simulation of the Internal Flow Field in a Novel Airlift Oscillation Loop Bioreactor

1
Jinan Key Laboratory of High Performance Industrial Software, Jinan Institute of Supercomputing Technology, Jinan 250103, China
2
Department of Chemical Engineering, Tsinghua University, Beijing 100084, China
*
Authors to whom correspondence should be addressed.
Processes 2023, 11(12), 3391; https://doi.org/10.3390/pr11123391
Submission received: 30 October 2023 / Revised: 5 December 2023 / Accepted: 6 December 2023 / Published: 8 December 2023
(This article belongs to the Section Biological Processes and Systems)

Abstract

:
The three-dimensional flow and mass transfer conditions in 5 L and 40 L airlift oscillation loop reactors were studied and compared with existing two-dimensional simulation and experimental data to verify the accuracy of the method. Then, the fluid dynamics behavior of the 2500 L reactor was simulated via supercomputing and provided guidance for production data. The results indicate that the application of oscillation operation in the 40 L multi-guide tube reactor can effectively improve the gas holdup and mass transfer coefficient in the reactor, with a maximum increase of 38% and 29%. For the 2500 L multi guide tube reactor, oscillation operation oscillation operation can significantly improve gas holdup and mass transfer coefficient increase gas holdup by 46% under 0.5 vvm operating conditions; the mass transfer coefficient increased by 54%. Therefore, oscillation operation can greatly improve the mass transfer coefficient for actual production reactors. After digging a hole in the middle sleeve, the circulating liquid speed has no effect. Although the gas holdup and mass transfer coefficient decreased by 1.3%, the gas holdup inside the entire reactor was more uniform, effectively reducing the average bubble aggregation.

1. Introduction

The Airlift Loop Reactor (ALR) [1] is an important production equipment in the fermentation industry. Huang et al. [2,3,4], dedicated to the design of loop reactors, proposed for the first time a pilot-scale external airlift loop reactor that integrates mixing and separation. The establishment of pilot-scale equipment has broad application prospects in the gas–liquid–solid catalytic industry. Liu et al. [5] cultivated in the biological fermentation industry for 30 years and have tried to use a loop reactor for fermentation. However, due to the high oxygen consumption in the aerobic fermentation process of 1–3 propylene glycol, the use of foreign stirring equipment for production has greatly increased production costs. Therefore, Liu et al. [5] did not interrupt the improvement in the loop reactor and developed a pilot plant for oscillation period operation and multi-sleeve loop reactors. They compared it with expensive imported stirring equipment and found that the yield improved (Figure 1). The use of a multi-sleeve loop reactor can reduce the aspect ratio of the loop reactor, reduce input air pressure, and save energy consumption. The oscillation period operation, also known as the periodic oscillation operation of a loop reactor, can improve the transfer of dissolved oxygen and increase glycerol yield when used in glycerol fermentation. In order to theoretically determine the optimal oscillation period, analyze the mechanism of enhanced mass transfer via oscillation, and provide a reference for the design and amplification of oscillation-operated reactors, numerical simulations were conducted on the flow process of the loop reactor. The current qualitative numerical simulation of the alternating upper and lower liquid regions in a loop reactor can increase fluid and gas mixing, but it cannot quantitatively explain the problem.
With the description of mathematical methods, increasing attention is being paid to the deformation, coalescence, and fragmentation behavior of bubbles in reactors [6]. The population equilibrium model method is widely used in industry [7,8]. The Population Balance Model (PBM) is a universal method for describing the size distribution of dispersed phases in multiphase flow systems, originally used by Hulburt and Katz in chemical processes in 1964. The Population Balance Model (PBM) is used to describe the bubble size distribution in gas–liquid systems, taking into account the different mechanisms of bubble coalescence and fragmentation and establishing a comprehensive bubble coalescence and fragmentation model. The bubble size distribution in the gas–liquid system calculated by numerically solving PBM can be predicted theoretically for convective transition, and good prediction results have been obtained for both uniform and non-uniform bubble size distributions [9,10]. Cheng et al. [11] and Huang et al. [12] used the PBM method to simulate fluid flow in a loop reactor and achieved good demonstration results. Although the PBM method is becoming increasingly widely used in industrial simulations, it is difficult to develop the specific hydrodynamic behavior of each bubble in a loop reactor. Therefore, new simulation methods are needed to describe the fluid flow details in the reactor. Zhang et al. [13] built a turbulent mass diffusivity model for the simulation of the biodegradation of toluene in an internal loop airlift reactor. Guadarrama-Pérez et al. [14] numerically and experimentally characterized the gas holdup, liquid velocity, shear rate, flow pattern, and volumetric oxygen transfer coefficient (KLa) evaluated as a function of the air velocity and medium rheology in an internal loop airlift reactor. Choi [15] built correlations derived for the prediction of available gas holdup data in air–water systems, using the operational and geometric parameters of airlift reactors as a model.
The improvement in airlift loop reactors based on numerical algorithms is currently a research hotspot. Li et al. [16] reviewed the hydrodynamics and mass transfer of concentric-tube internal loop airlift reactors. The internal components of the airlift loop reactor can improve the transfer performance. Shi et al. [17] studied hydrodynamics in a two-stage internal loop airlift reactor with contraction–expansion guide vane. The two-stage had better performance improvement. Then, Wang et al. [18] studied the hydrodynamic characteristics, mass transfer, and mixing performance of three different reactors, a bubble column reactor, a single-stage internal loop airlift reactor, and a four-stage internal loop airlift reactor. The transfer performance of the four-stage is better than the other two. The gas separator was equipped with an adjustable deflector placed above the riser by Šulc et al. [19]. The overall volumetric mass transfer coefficient slightly increased by 10–17%. Qiao et al. [20] also designed a gas distributor capable of multiple injection directions to improve the gas–liquid dispersion performance in the airlift loop reactor. And Shi et al. [21] analyzed a novel swirling demulsified airlift loop reactor for the treatment of refined soybean oil wastewater. Li et al. [22] simulated a conceptual air-lift reactor design for large-scale animal cell cultivation in the context of in vitro meat production.
Based on the previous improvement ideas of the airlift loop reactor, we designed a three-stage simulation design approach from small-scale, middle-scale, and production-scale. So, this work analyzes 5 L, 40 L, and 2500 L airlift loop reactors via numerical simulations. By calculating the gas holdup and mass transfer coefficient of the loop reactors under different operating conditions, the performance of the loop reactors is analyzed and the common laws of the airlift loop reactors are summarized.

2. Simulation Methods and Reactors Models

2.1. Simulation Methods

The Euler–Euler dual fluid basic model has been widely studied and applied [23,24,25,26,27,28]. The unified control equation is shown in Equation (1):
t ( ρ α ϕ ) k + ( ρ α ϕ   u ) k = ( Γ ϕ α ϕ ) k + S ϕ , k
For the basic gas–liquid two-phase flow, only the transfer of mass and momentum is considered. The above equation can be written as follows:
ρ k α k t + ( ρ k α k u k ) = 0
ρ k α k u k t + ( ρ k α k u k u k ) = α k P + ( α k μ e f f , k ( u k + u k T ) ) + F g , l + ρ k α k g
where φ is a certain physical quantity (for general simulation calculations, it mainly includes momentum, mass, and heat); Sφ,k represents the source term; k is gas or liquid; α is the phase content; ρ is the density; u is the velocity; P′ is the corrected pressure; μ is the viscosity; g is the gravitational acceleration. F g , l is the interphase force between gas and liquid phases. The P′ can be calculated using the following formula:
P = P + 2 3 μ e f f , l u l + 2 3 ρ l k l
Among them, μeff,l are the effective viscosity coefficients. The basic control equation set is a universal model. The turbulence model adopts the standard k-ε model. The key to dual fluid simulation lies in the treatment of interphase forces. Both drag and lift are modeled using Tomiyama’s model [29]. The mass transfer rate is calculated using the following formula [5]:
K L a = 4 5 ε 1 / 6 ε G d b π D ( ( v 3 / ε ) 1 / 12 r H 1 / 3 )

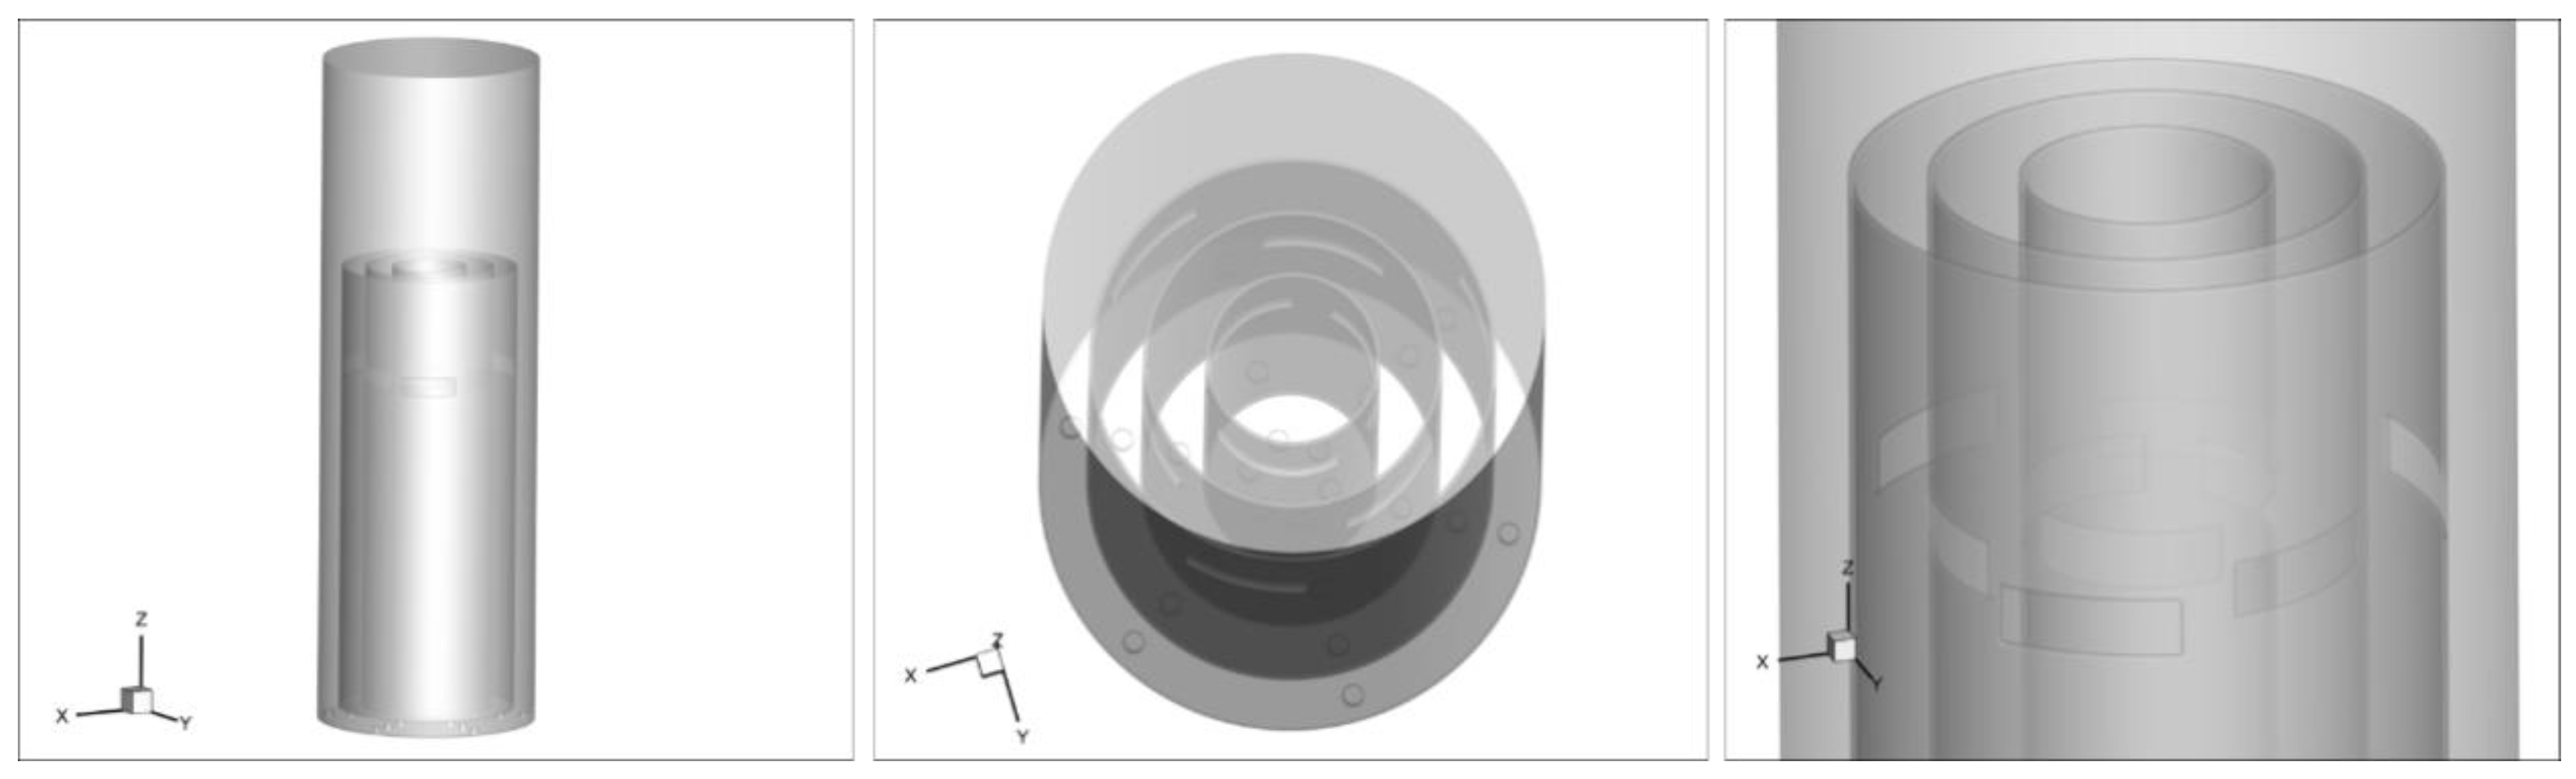
2.2. Reactor Structures and Grid Division

This work simulated three sizes of loop reactors, namely 5 L, 40 L, and 2500 L.
As shown in Figure 2, the height of the 5 L reactor is 800 mm, the inner diameter is 90 mm, the height of the guide tube is 500 mm, and the inner and outer diameters of the guide tube are 50 mm and 60 mm, respectively. At the bottom of the reactor, there are 12 gas injection nozzles, each with an inner diameter of 1 mm. Six nozzles are evenly distributed on a circumference with a chassis diameter of 30 mm for central air intake, while the remaining six nozzles are evenly distributed on a circumference with a diameter of 75 mm for annular gap air intake.
As shown in Figure 3, the height of the 40 L loop reactor is 750 mm, the inner diameter is 242 mm, and the height of the guide tube is 500 mm. The inner and outer diameters of the three-layer guide tubes are 80 mm, 140 mm, and 192 mm, respectively. At the bottom of the reactor, there are 24 gas injection nozzles, each with an inner diameter of 1 mm. Among them, 12 nozzles are evenly distributed on a circumference with chassis diameters of 40 mm and 166 mm for central air intake, while the remaining 12 nozzles are evenly distributed on a circumference with diameters of 110 mm and 217 mm for annular gap air intake.
As shown in Figure 4, the height of the 2500 L loop reactor is 2440 mm, the inner diameter is 1100 mm, and the height of the guide tube is 1450 mm. The inner and outer diameters of the three-layer guide tubes are 364 mm, 636 mm, and 872 mm, respectively. At the bottom of the reactor, there are 144 gas injection nozzles, each with an inner diameter of 2.5 mm. Among them, 72 nozzles are evenly distributed on a circumference with chassis diameters of 250 mm and 759 mm for central air intake, while the remaining 12 nozzles are evenly distributed on a circumference with diameters of 504 mm and 910 mm for annular gap air intake.
The central nozzle shares one air chamber designed inside the chassis, while the annular gap nozzle shares another air chamber designed inside the chassis. The two are independent and supplied by air pumps, respectively.
The reactor adopts a mixed grid type that combines hexahedral structured grids and tetrahedral unstructured grids. The bottom of the reactor only uses tetrahedral unstructured grids, while other areas use structural grids.

2.3. Boundary Conditions

The gas inlet is converted into a velocity inlet via the intake volume and inlet area. The top of the reactor adopts a pressure outlet. The wall and inner sleeve use standard wall boundary conditions. The initial setting of water inside all reactors is 10 cm higher than the sleeve. The simulation adopts an unsteady state simulation. The time step is 0.001 s for the first 1000 steps and 0.01 s for the next 1000 steps. The standard for each parameter residual is less than 10−5. The remaining calculations are set to software default. Air and water use a standard atmospheric pressure and a physical property parameter with a temperature of 25 degrees Celsius. The bubble diameter was uniformly set to 2 mm.

3. Results and Discussion

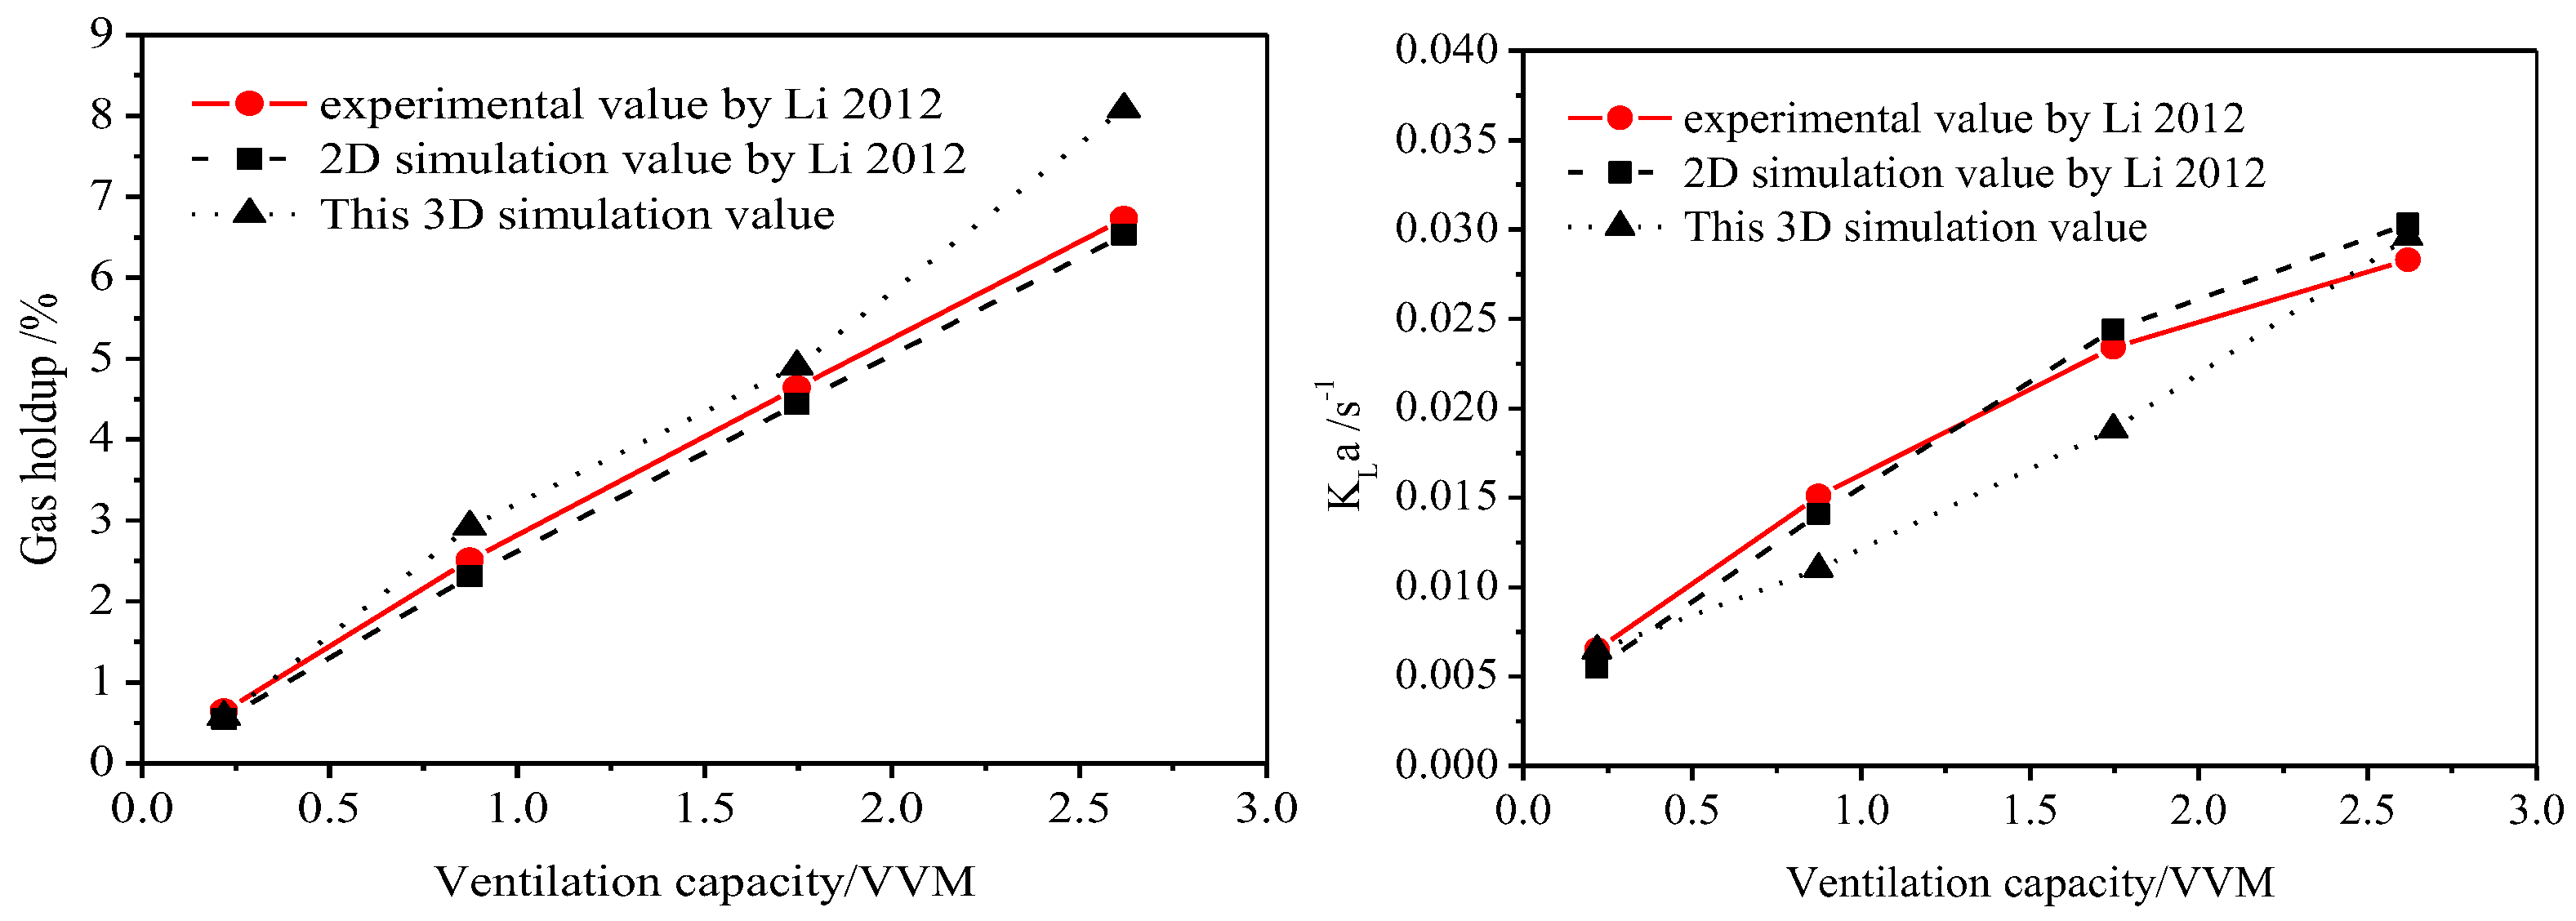
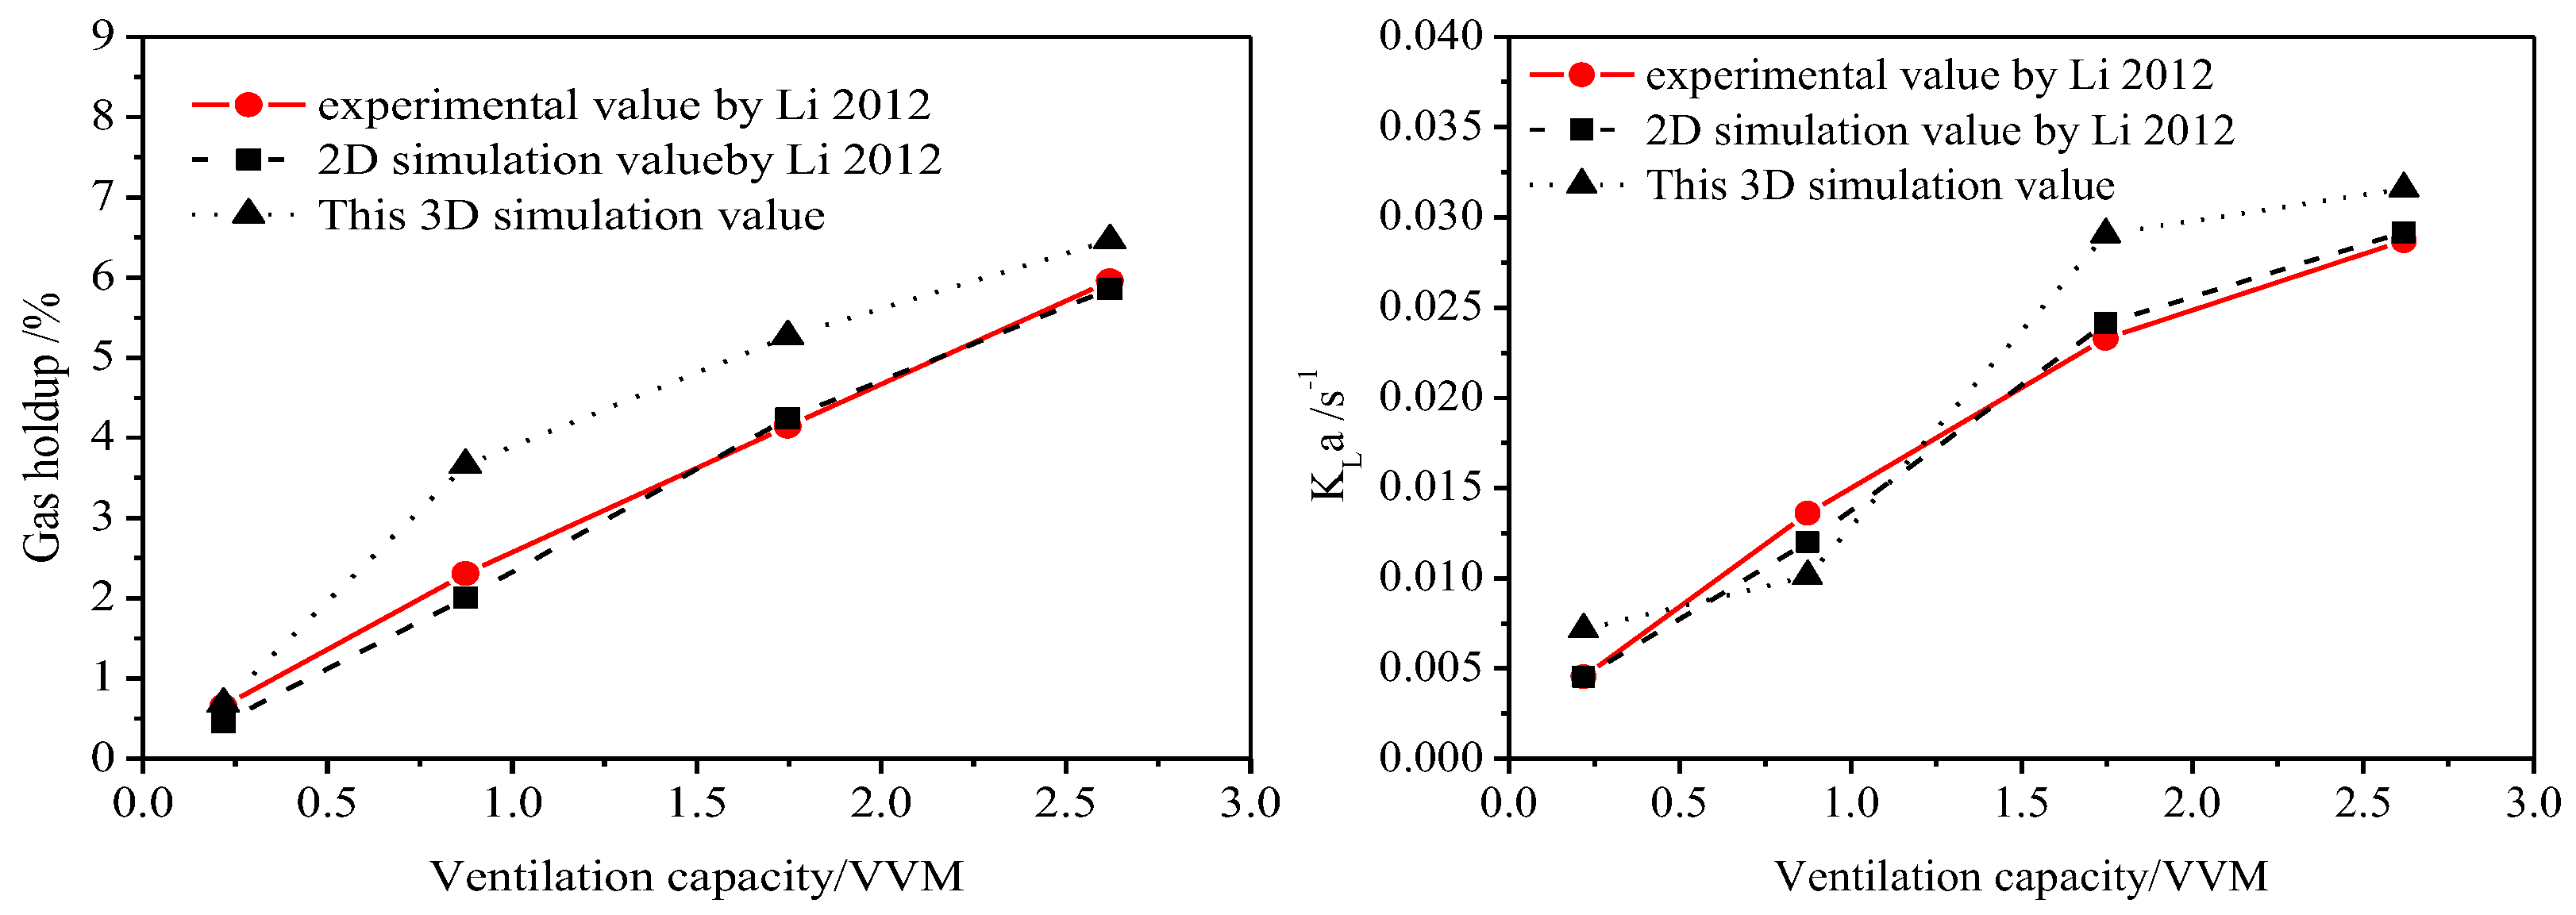
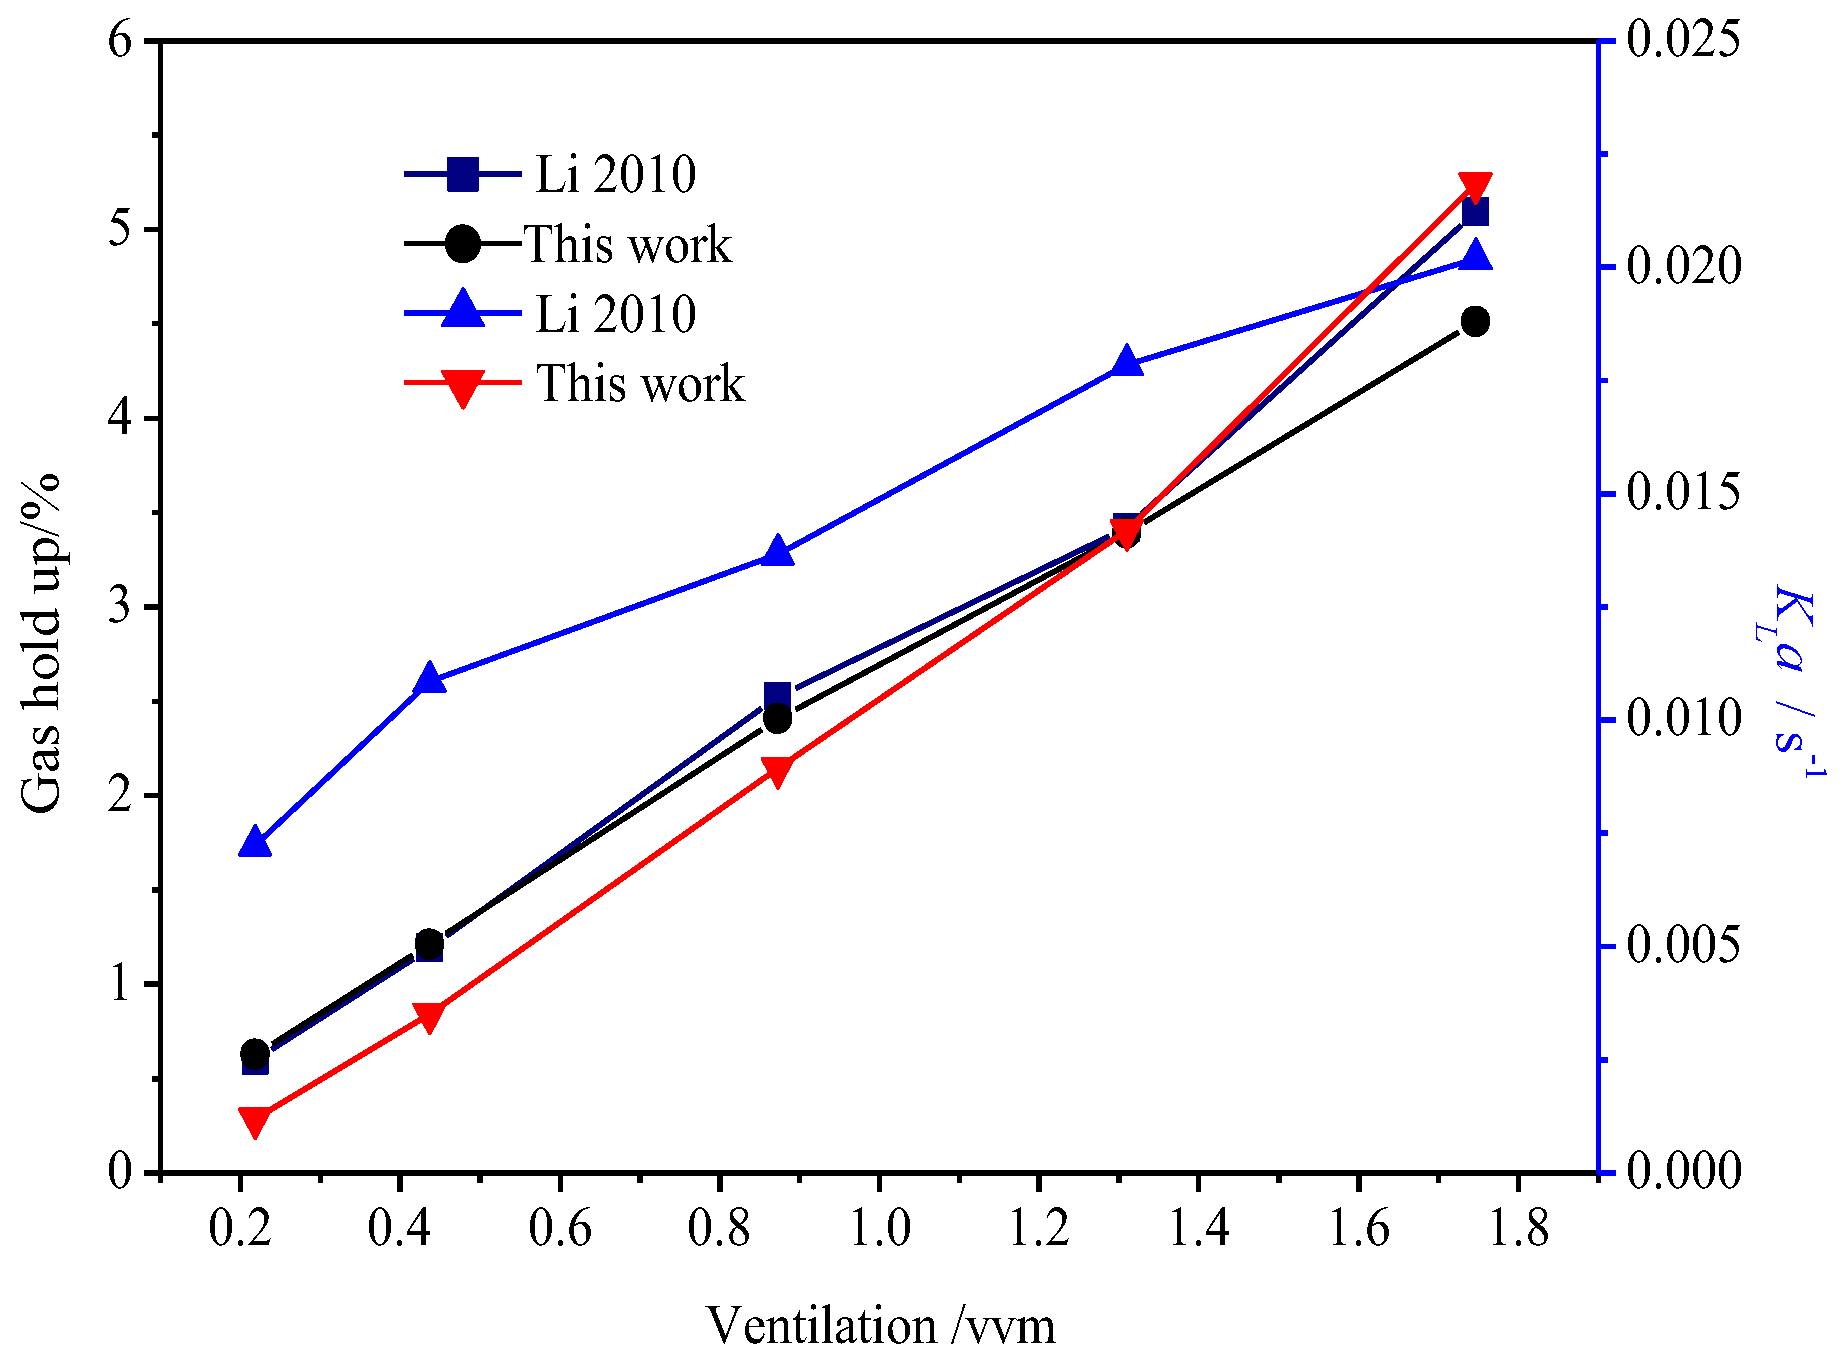
3.1. Simulation Setting and Validating via 5 L Airlift Loop Reactor

There are two types of intake methods for loop reactors, one is a central air lift, and the other is an annular gap air lift, as shown in Figure 5. Two alternative intake methods generate oscillations called reversible loop reactors.
Initial setting for calculation: First, fill the interior of the loop reactor with water 100 mm higher than the sleeve, and then inject a certain mass flow rate of gas into the inlet for calculation. The red area in the phase cloud map represents water, the blue area represents air, and the underwater pressure field in the pressure cloud map meets the underwater pressure formula: P = ρgh (Figure 6).
The central air lift ventilation (vvm) and annular gap air lift ventilation are set to 0.21832 vvm, 0.87328 vvm, 1.30992 vvm, and 2.61983 vvm, respectively, for a total of eight operating conditions. Via numerical calculation, the gas holdup and mass transfer coefficient KLa of the central and annular gap air lift were obtained, and the numerical results were compared and analyzed with the experimental data and two-dimensional calculation data in study [5]. Whether it is the central air lift or the annular gap air lift, the simulation results of gas holdup and mass transfer coefficient obtained with different ventilation ratios are basically consistent with the experimental values, and the error is within the range of 10% (Figure 7 and Figure 8). Therefore, this numerical method is accurate and reliable.
The current work uses three-dimensional data for calculation. With the development of supercomputing, three-dimensional data can effectively display the internal situation of the reactor. The three-dimensional simulation data shows that both operation methods will result in bubble dead zones at the highest point of the inner sleeve of the 5 L reactor, as shown in Figure 9.

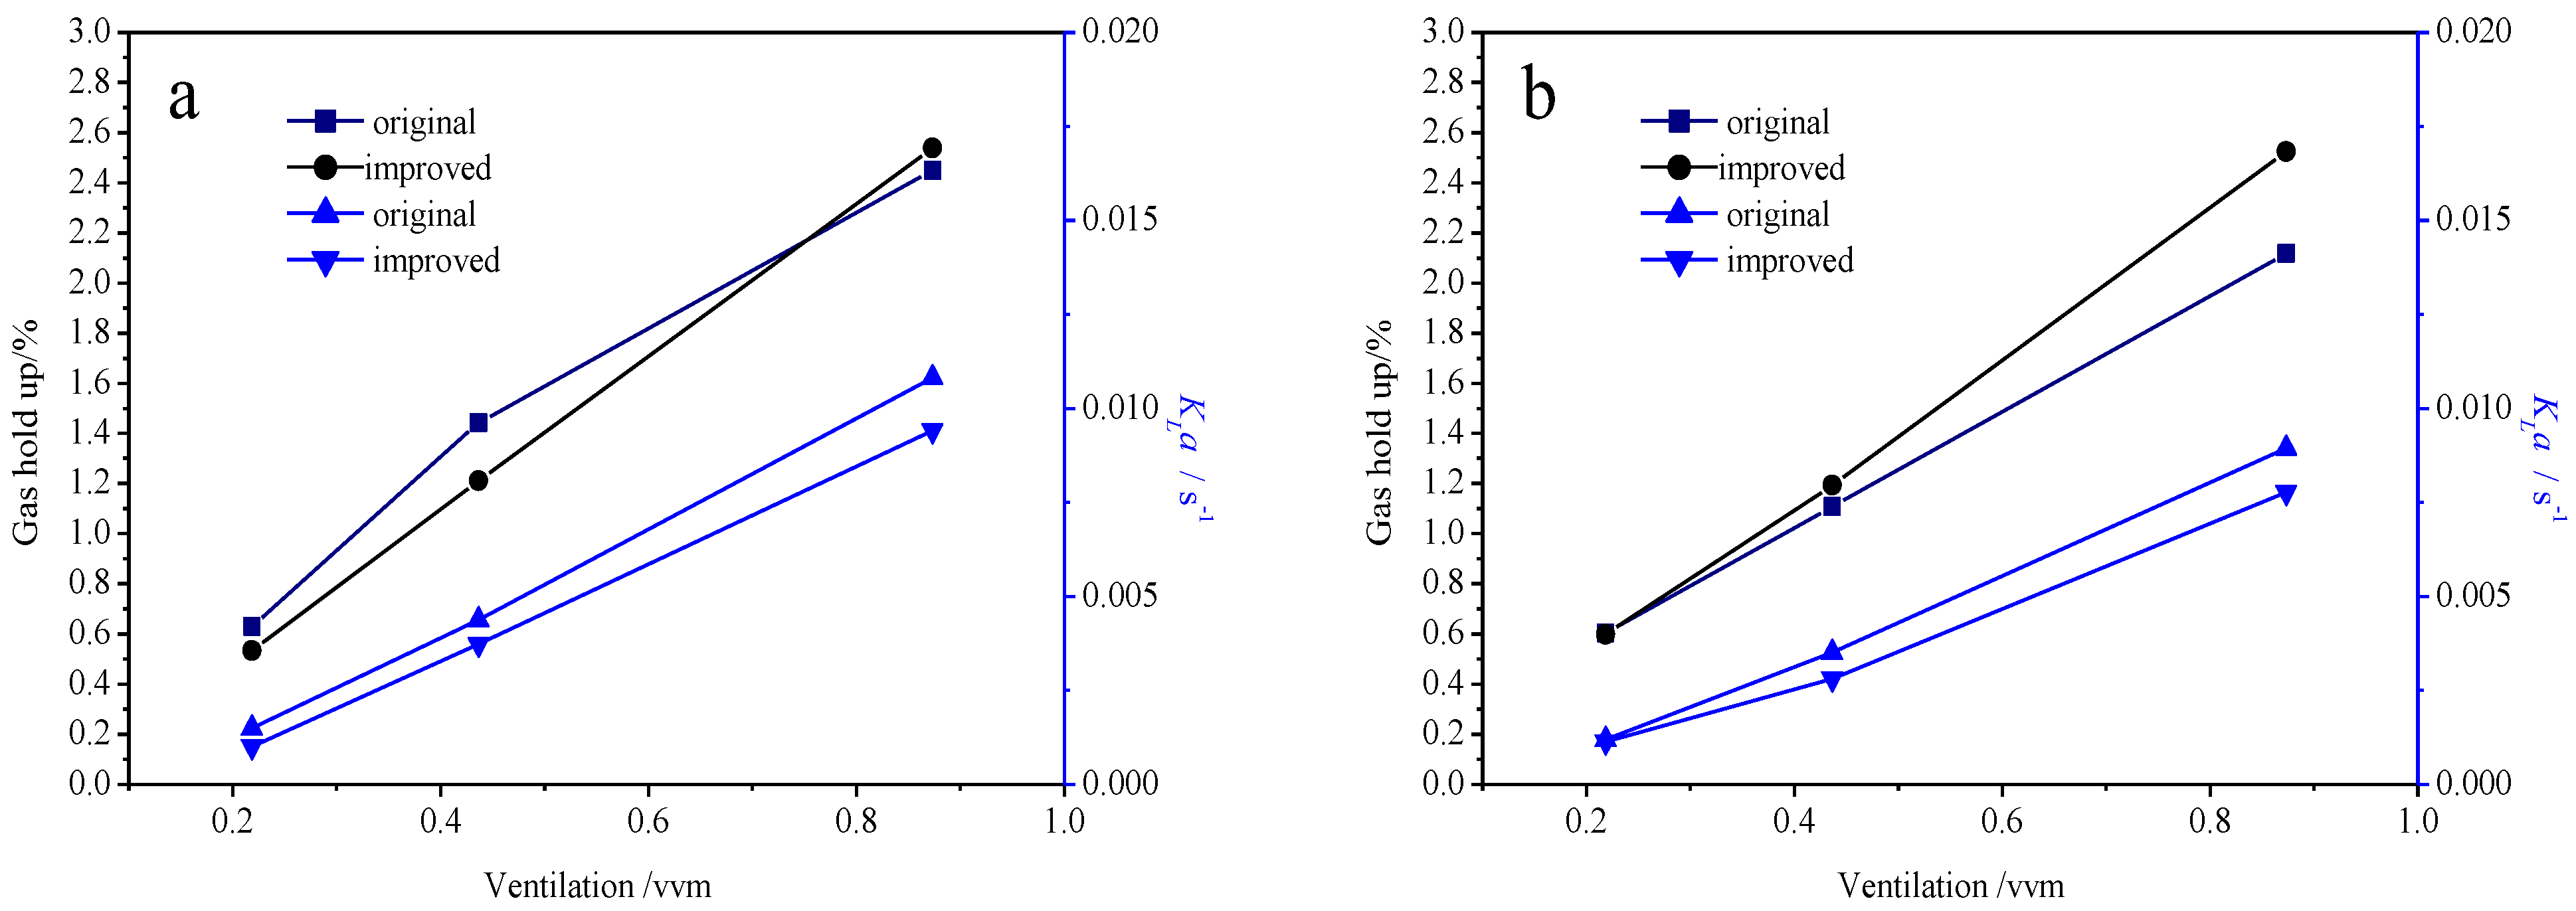
3.2. The 40 L Airlift Loop Reactor Simulation

Structural design and optimization of a 40 L airlift loop reactor with a ventilation rate of 0 vvm–1.0 vvm. This section mainly focuses on the internal flow situation (gas holdup) of a 40 L loop airlift reactor under three ventilation rates of 0.21832 vvm, 0.43664 vvm, and 0.87328 vvm.
Figure 10 shows the changes in gas holdup and mass transfer coefficient over time with a ventilation volume of 0.43664 vvm. The gas holdup and mass transfer coefficient inside the loop reactor reach a stable value of around 10 s, regardless of whether it is the central air lift or the annular gap air lift. Therefore, it is recommended to have a cycle of 20 s: the central air lift intake is 10 s, and the annular gap air lift intake is another 10 s as a cycle.
Figure 11 and Figure 12 show the central lift phase cloud map and annular gap lift phase cloud map with 0.43664 vvm, respectively. It can be seen that the internal flow situation of the 40 L loop reactor is relatively uniform, as the intake ratio is 0.43664 vvm and the intake volume is small, so there are no large bubbles gathering inside, which indicates a good flow situation.
The gas holdup and mass transfer coefficient of the central and annular gap air lift were obtained via numerical calculations, and the numerical results were compared and analyzed with the 2D simulation results of Li [1]. By observing Figure 13 and Figure 14, it can be seen that the simulation results of gas holdup and KLa obtained from a different ventilation, whether in the center air lift or annular gap air lift, are basically consistent with the 2D simulation results of Li [1], and the variation trend is consistent, and the error is within a controllable range. Therefore, this numerical method is accurate and reliable.
In order to find a more suitable reactor structure, we proposed a plan to change the size of the original guide tube and open holes in the guide tube. Using numerical calculations, we observed whether the gas holdup and mass transfer coefficient were improved.
The optimization plan in Dr. Li Qiang’s paper [1] was found to be the optimal result via 2D simulation, adjusting the inner diameter of the three guide tubes in the reactor and increasing the height of the guide tubes. The improved structure is shown in Table 1.
In order to address the problem of bubble death in the upper part of the guide tube under a high ventilation ratio, three guide tubes inside the 40 L loop reactor were excavated for treatment. The hole is 2 cm high, 6 cm wide, and 11 cm away from the upper edge of the guide tube. The holes are evenly distributed on the guide tube, with three holes on each guide tube. The holes on adjacent guide tubes are staggered internally, and the angle of adjacent holes is 120 degrees. The geometric model diagram of the 40 L loop reactor after digging a hole is shown in Figure 15.
The optimized structure in Li [1] and the loop reactor with holes in the original guide tube were calculated via numerical simulation, and the calculation results are as follows.
Figure 16a shows the comparison of gas holdup and mass transfer coefficient for different flux ratios of central air lift before and after optimization. From the comparison of the gas holdup and mass transfer coefficient under simulated operating conditions with different flux ratios of central air lift, it can be seen that the optimized model only increases the gas holdup at low flux ratios (0.21832 vvm; 0.43664 vvm) and decreases the gas holdup at high flux ratios (0.87328 vvm); The optimized model has reduced mass transfer coefficients. Figure 16b shows the comparison of gas holdup and mass transfer coefficient for different flux ratios of annular gap air lift before and after optimization. From the comparison of the gas holdup and mass transfer coefficient under simulated operating conditions with different flux ratios of annular gap air lift, it can be seen that the optimized model only increases gas holdup at low flux ratios (0.21832 vvm) and decreases gas holdup at high flux ratios (0.43664 vvm, 0.87328 vvm); The optimized model has reduced mass transfer coefficients.
Figure 17a shows a comparison of gas holdup and mass transfer coefficient for different flux ratios of central air lift before and after digging a hole. From the comparison of the gas holdup and mass transfer coefficient under simulated operating conditions with different flux ratios of central air lift, it can be seen that the model after digging the hole has almost no change in the gas holdup and mass transfer coefficient under low flux ratios (0.4 vvm; 0.8 vvm); at high throughput ratios (1.3 vvm; 1.7 vvm), both gas holdup and mass transfer coefficient decrease. Figure 17b shows a comparison of gas holdup and mass transfer coefficient for different flux ratios of annular gap air lift before and after optimization. From the comparison of the gas holdup and mass transfer coefficient under simulated conditions with different flux ratios of annular gap air lift, it can be seen that the model, after digging the hole, has almost no change in the gas holdup and mass transfer coefficient under low flux ratios (0.4 vvm); At high throughput ratios (0.8 vvm, 1.3 vvm, and 1.7 vvm), both gas holdup and mass transfer coefficient decrease.
As shown in Figure 18, by observing the internal flow situation of the 40 L loop reactor before and after digging a hole, it can be seen that under a flux ratio of 1.7 vvm, whether it is the central air lift or the annular gap air lift, during the operation of the 40 L loop reactor before and after digging a hole, there will be a large amount of gas accumulation on the spoiler of the original model, while only a small amount of gas accumulation is on the guide plate of the model after digging a hole, and the distribution of air in the water medium is more uniform. In summary, it can be concluded that the gas holdup and mass transfer coefficient of the model decrease after excavation, and both do not exceed 10%.

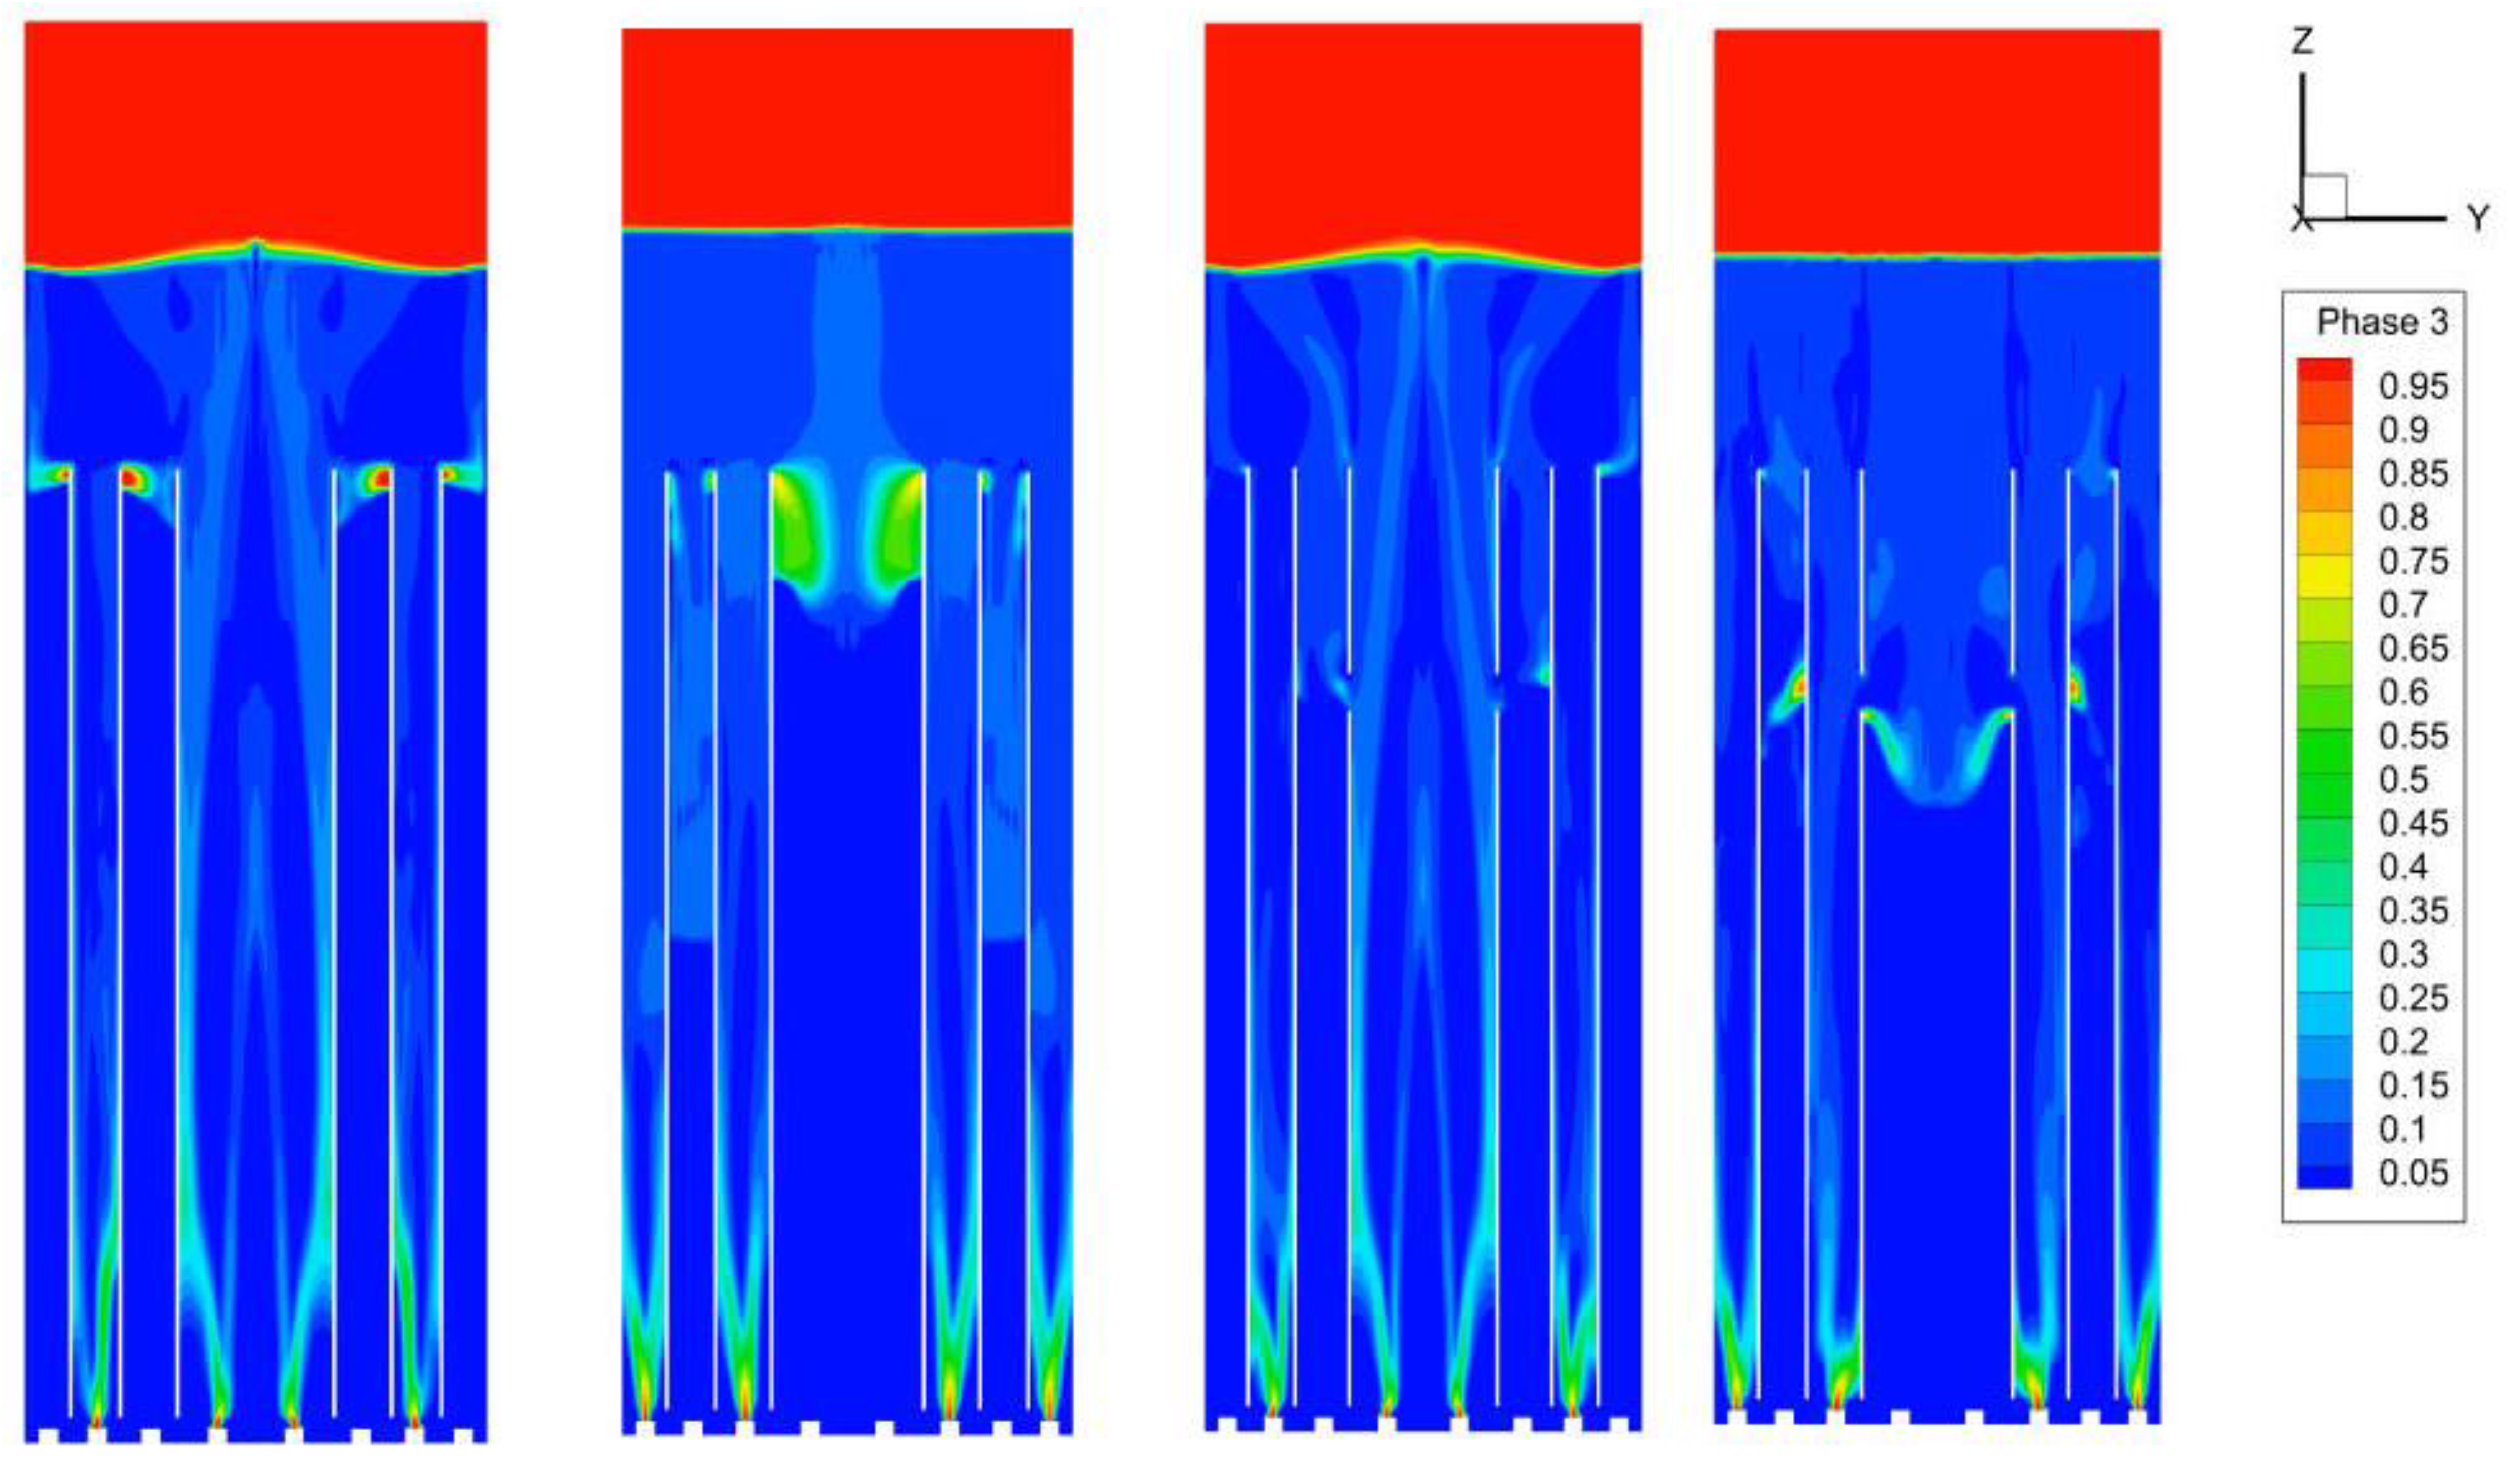
3.3. The 2500 L Airlift Oscillation Loop Reactor Simulation

In order to obtain high-precision flow field information, the calculation amount of gas–liquid two-phase flow in a 2500 L loop reactor is enormous. The single operating condition calculation uses 560 nuclear calculations for 30 days, which requires about 400,000 core hours, and the calculation cost is 30 times that of calculating a 40 L loop reactor. Therefore, this work only calculates the center, annular gap, and oscillation conditions (center air lift for 15 s; annular gap air lift for 15 s) under a single ventilation rate of 0.5 vvm. In order to address the uniformity inside the reactor during the production process, the three guide tubes inside the 2500 L loop reactor were excavated and treated. The hole is 10 cm high, 20 cm wide, and 580 cm away from the upper edge of the guide tube. The holes are evenly distributed on the guide tube, with four holes on each guide tube. The holes on adjacent guide tubes are staggered internally, and the angle of adjacent holes is 90 degrees. The geometric model diagram of the 2500 L loop reactor after digging a hole is shown in Figure 19.
The application of oscillation operation in the 40 L multi-guide tube reactor in the literature can effectively improve the gas holdup and mass transfer coefficient in the reactor, with a maximum increase of 38% and 29%, respectively [1]. For the 2500 L multi guide tube reactor, the current work also conducted oscillation operation calculations and found that oscillation operation can significantly improve gas holdup and mass transfer coefficient. Increase gas holdup by 46% under 0.5 vvm operating conditions; The mass transfer coefficient increased by 54%. Therefore, oscillation operation can greatly improve the mass transfer coefficient for actual production reactors. After digging a hole in the middle sleeve, the circulating liquid speed has no effect. Although the gas holdup and mass transfer coefficient decreased by 1.3%, the cloud image shows that the gas holdup inside the entire reactor is more uniform, effectively reducing the average diameter of bubbles (Table 2).
The cloud map of the 2500 L reactor (Figure 20) is displayed, which clearly shows the evolution process of gas inside the reactor. As time increases, the gas content in the reactor increases. As the central air lift changes to an annular air lift after 15 s, the liquid level continues to rise, and the gas holdup further increases.

4. Conclusions

The current work obtains the flow field of the loop reactor in small scale (5 L single guide tube), pilot scale (40 L 3 guide tube), and actual production (2500 cubic 3 guide tube) via numerical simulation calculation and calculates the gas holdup and mass transfer coefficient. Via data comparison, it was found that although the computational complexity of 3D simulation increased and the accuracy of the calculation results did not increase, it was able to demonstrate the real process of the reactor. The increase in gas holdup/mass transfer coefficient using oscillation operation in the 2500 L reactor is more significant than that using oscillation operation in the 40 L reactor, demonstrating the possibility of using oscillation operation in large loop reactors. Optimizing the structure of the inner sleeve of the reactor can improve the overall gas holdup, but the improvement in the mass transfer coefficient is not significant enough. Digging out the inner sleeve of the reactor has little effect on gas holdup and mass transfer coefficient, but it can effectively eliminate the dead zone of reflux bubbles in the upper part of the sleeve.
The existing numerical simulation calculations use relatively rough calculation methods, which cannot display the details of gas–liquid two-phase flow and can only perform some qualitative analysis. In order to simulate gas–liquid two-phase flow more clearly, efficient numerical calculation methods need to be developed to study the motion and transfer mechanisms and laws of gas–liquid two-phase flow at the particle group scale.

Author Contributions

Formal analysis, X.S.; Investigation, A.L.; Writing—original draft, A.L.; Supervision, D.L.; Funding acquisition, D.L. All authors have read and agreed to the published version of the manuscript.

Funding

This work was supported by the Shandong Provincial Key Research and Development Program (No. 2022CXGC020106), Pilot Project for Integrated Innovation of Science, Education and Industry of Qilu University of Technology (Shandong Academy of Sciences) (No. 2022JBZ01-01), Project from Ministry of Science and Technology (G2022024003L).

Data Availability Statement

Data are contained within the article.

Conflicts of Interest

The authors declare no conflict of interest.

References

  1. Li, Q. Numerical Simulation and Optimization of a Novel Airlift Loop Reactor. Ph.D. Thesis, Tsinghua University, Beijing, China, 2010. [Google Scholar]
  2. Liu, H.; Li, Z.; Geng, S.; Gao, F.; He, T.; Huang, Q. Influences of top clearance and liquid throughput on the performances of an external loop airlift slurry reactor integrated mixing and separation. Chin. J. Chem. Eng. 2020, 28, 1514–1521. [Google Scholar] [CrossRef]
  3. Geng, S.; Li, Z.; Liu, H.; Yang, C.; Gao, F.; He, T.; Huang, Q. Hydrodynamics and mass transfer in a slurry external airlift loop reactor integrating mixing and separation. Chem. Eng. Sci. 2019, 211, 115294. [Google Scholar] [CrossRef]
  4. Yang, T.; Geng, S.; Yang, C.; Huang, Q. Hydrodynamics and mass transfer in an internal airlift slurry reactor for process intensification. Chem. Eng. Sci. 2018, 184, 126–133. [Google Scholar] [CrossRef]
  5. Li, Q.; Zhao, X.; Du, W.; Liu, D. Numerical simulation and structural optimization of an airlift oscillating loop reactor. Chem. Ind. Eng. Progress 2012, 31, 1690–1699. [Google Scholar]
  6. Sokolichin, A.; Eigenberger, G.; Lapin, A. Simulation of buoyancy driven bubbly flow: Established simplifications and open questions. AIChE J. 2004, 50, 24–45. [Google Scholar] [CrossRef]
  7. Kumar, J.; Peglow, M.; Warnecke, G.; Heinrich, S. An efficient numerical technique for solving population balance equation involving aggregation, breakage, growth and nucleation. Powder Technol. 2008, 182, 81–104. [Google Scholar] [CrossRef]
  8. Kumar, J.; Peglow, M.; Warnecke, G.; Heinrich, S. The cell average technique for solving multi-dimensional aggregation population balance equations. Comput. Chem. Eng. 2008, 32, 1810–1830. [Google Scholar] [CrossRef]
  9. Liao, Y.X.; Lucas, D. A literature review of theoretical models for drop and bubble breakup in turbulent dispersions. Chem. Eng. Sci. 2009, 64, 3389–3406. [Google Scholar] [CrossRef]
  10. Liao, Y.; Lucas, D. A literature review on mechanisms and models for the coalescence process of fluid particles. Chem. Eng. Sci. 2010, 65, 2851–2864. [Google Scholar] [CrossRef]
  11. Cheng, J.; Li, Q.; Yang, C.; Zhang, Y.; Mao, Z. CFD-PBE simulation of a bubble column in OpenFOAM. Chin. J. Chem. Eng. 2018, 26, 1773–1784. [Google Scholar] [CrossRef]
  12. Huang, Q.; Zhang, W.; Yang, C. Modeling transport phenomena and reactions in a pilot slurry airlift loop reactor for direct coal liquefaction. Chem. Eng. Sci. 2015, 135, 441–451. [Google Scholar] [CrossRef]
  13. Zhang, C.; Liu, Y.; Jiao, W.; Qi, G.; Guo, J. A turbulent mass diffusivity model for the simulation of the biodegradation of toluene in an internal loop airlift reactor. Process Saf. Environ. Prot. 2022, 165, 646–657. [Google Scholar] [CrossRef]
  14. Guadarrama-Pérez, R.; Metropolitana, U.A.; Márquez-Baños, V.; Valencia-López, J.; Sánchez-Vázquez, V.; Jesús, G.M.-D.; Ramírez-Muñoz, J.; Gutiérrez-Rojas, M. Hydrodynamics evaluation of an internal-loop airlift reactor with Newtonian and shear-thinning fluids: Experimentation vs CFD simulation. Rev. Mex. Ing. Quim. 2022, 21, Bio 2694. [Google Scholar] [CrossRef]
  15. Choi, K.H. Prediction of gas holdup in various types of airlift reactors. Korean J. Chem. Eng. 2021, 38, 1781–1790. [Google Scholar] [CrossRef]
  16. Li, L.; Xu, X.; Wang, W.; Lau, R.; Wang, C.-H. Hydrodynamics and mass transfer of concentric-tube internal loop airlift reactors: A review. Bioresour. Technol. 2022, 359, 127451. [Google Scholar] [CrossRef] [PubMed]
  17. Shi, J.; Guo, K.; Wang, Z.; Zheng, L.; Liu, H.; Xiang, W.; Liu, C.; Li, X. Computational fluid dynamics simulation of hydrodynamics in a two-stage internal loop airlift reactor with contraction-expansion guide vane. ACS Omega 2021, 6, 6981–6995. [Google Scholar] [CrossRef]
  18. Wang, Z.; Cheng, Z.; Yuan, P.; Huang, Z. The influence of draft tubes on the mass transfer and mixing performance of a pilot-pcale internal-loop airlift reactor. Processes 2023, 11, 2886. [Google Scholar]
  19. Qiao, N.; Yue, S.; Cheng, J.; Wang, C.; Wang, X.; Shi, Y.; Guo, J.; Yu, D. A gas distributor capable of multiple injection directions to improve the gas-liquid dispersion performance in the airlift loop reactor. Biochem. Eng. J. 2023, 190, 108770. [Google Scholar] [CrossRef]
  20. Sulc, R.; Dymak, J. Hydrodynamics and mass transfer in a concentric internal jet-loop airlift bioreactor equipped with a deflector. Energies 2021, 14, 4329. [Google Scholar] [CrossRef]
  21. Shi, Y.; Wu, S.; Ren, H.; Jin, M.; Wang, L.; Qiao, N.; Yu, D. Computational fluid dynamics and factor analysis of a novel swirling demulsified airlift loop reactor for the treatment of refined soybean oil wastewater. Bioresour. Technol. 2020, 296, 122316. [Google Scholar] [CrossRef]
  22. Li, X.; Zhang, G.; Zhao, X.; Zhou, J.; Du, G.; Chen, J. A conceptual air-lift reactor design for large scale animal cell cultivation in the context of in vitro meat production. Chem. Eng. Sci. 2020, 211, 115269. [Google Scholar] [CrossRef]
  23. Sokolichin, A.; Eigenberger, G.; Lapin, A.; Lübert, A. Dynamic numerical simulation of gas-liquid two-phase flows Euler/Euler versus Euler/Lagrange. Chem. Eng. Sci. 1997, 52, 611–626. [Google Scholar] [CrossRef]
  24. Ishii, M. Thermo-Fluid Dynamic Theory of Two-Phase Flow; Eyrolles: Paris, France, 1975. [Google Scholar]
  25. Lahey, R.T.; Drew, D.A. On the Development of multidimensional two-fluid models for vapor/liquid two-phase flows. Chem. Eng. Commun. 1992, 118, 125–139. [Google Scholar] [CrossRef]
  26. Krishna, R.; Urseanu, M.; van Baten, J.; Ellenberger, J. Influence of scale on the hydrodynamics of bubble columns operating in the churn-turbulent regime: Experiments vs. Eulerian simulations. Chem. Eng. Sci. 1999, 54, 4903–4911. [Google Scholar] [CrossRef]
  27. Hua, J.; Wang, C. Numerical simulation of bubble-driven liquid flows. Chem. Eng. Sci. 2000, 55, 4159–4173. [Google Scholar] [CrossRef]
  28. Wang, T.; Wang, J.; Jin, Y. Experimental study and CFD simulation of hydrodynamic behaviours in an external loop airlift slurry reactor. Can. J. Chem. Eng. 2004, 82, 1183–1190. [Google Scholar] [CrossRef]
  29. Tomiyama, A. Struggle with computational bubble dynamics. Multiph. Sci. Technol. 1998, 4, 369–405. [Google Scholar]
Figure 1. Loop reactor designed by Lius’s research group [5].
Processes 11 03391 g001
Figure 2. Schematic diagram of the 5 L airlift reversible loop reactor structure.
Processes 11 03391 g002
Figure 3. Schematic diagram of the 40 L airlift reversible loop reactor structure.
Processes 11 03391 g003
Figure 4. Schematic diagram of the 2500 L airlift reversible loop reactor structure.
Processes 11 03391 g004
Figure 5. Schematic diagram of center air lift and annular gap air lift.
Processes 11 03391 g005
Figure 6. Initial phase cloud map and initial pressure cloud map.
Processes 11 03391 g006
Figure 7. Comparison between the simulation results of gas holdup and KLa of center air lift and existing values [5].
Processes 11 03391 g007
Figure 8. Comparison between the simulation results of gas holdup and KLa of annular gap air lift and existing values [5].
Processes 11 03391 g008
Figure 9. Stable cloud map under central and annular gap air lift operations.
Processes 11 03391 g009
Figure 10. The variation in gas holdup and mass transfer coefficient with time under a ventilation of 0.43664 vvm.
Processes 11 03391 g010
Figure 11. Cloud diagram of central lift phase with 0.43664 vvm.
Processes 11 03391 g011
Figure 12. Cloud diagram of annular gap air lift phase with an intake ratio of 0.43664 vvm.
Processes 11 03391 g012
Figure 13. Comparison between the simulation results of gas holdup and KLa of the central air lift and the simulation results of Li [1].
Processes 11 03391 g013
Figure 14. Comparison between the simulation results of gas holdup and KLa of the annular gap air lift and the simulation results of Li [1].
Processes 11 03391 g014
Figure 15. Schematic diagram of the geometric model of a 40 L loop reactor after digging a hole.
Processes 11 03391 g015
Figure 16. Comparison of gas holdup and KLa for different flux ratios of the center (a) and annular gap air lift (b) before and after optimizing the guide tube.
Processes 11 03391 g016
Figure 17. Comparison of gas holdup and KLa for different flux ratios of the center (a) and annular gap air lift (b) before and after the digging hole of the guide tube.
Processes 11 03391 g017
Figure 18. Comparison of internal flow in a loop reactor after ventilation for 10 s with a central air lift and annular gap air lift of 1.7 vvm before and after digging a hole.
Processes 11 03391 g018
Figure 19. Schematic diagram of the geometric model of a 2500 L loop reactor after digging a hole.
Processes 11 03391 g019
Figure 20. Cloud map of gas phase changes over time in an airlift loop reactor after digging hole (3 s, 6 s, 9 s, 12 s, 15 s, 18 s, 21 s, 24 s, 27 s, and 30 s).
Processes 11 03391 g020
Table 1. Reactor structural parameters (original and improved one).
Guide TubeInner Diameter 1/mmInner Diameter 2/mmInner Diameter 3/mmDiameter/mm
Original100161211503
Improved80140192500
Table 2. Simulated operating conditions of 2500 L reactor.
Operating ModeGas Holdup (%)KLa (s-1)Average Speed in Y Direction (m/s)
Before Digging HoleAfter Digging HoleBefore Digging HoleAfter Digging HoleBefore Digging HoleAfter Digging Hole
Center15.1114.710.05440.055330.014310.01430
Annular gap14.0713.600.056350.052360.014410.01443
Oscillation22.0121.720.086190.083690.014340.01428
Disclaimer/Publisher’s Note: The statements, opinions and data contained in all publications are solely those of the individual author(s) and contributor(s) and not of MDPI and/or the editor(s). MDPI and/or the editor(s) disclaim responsibility for any injury to people or property resulting from any ideas, methods, instructions or products referred to in the content.

