
Sustainable Decision Model for Circular Economy towards Net Zero Emissions under Industry 4.0

Abstract
:1. Introduction
2. Literature Review
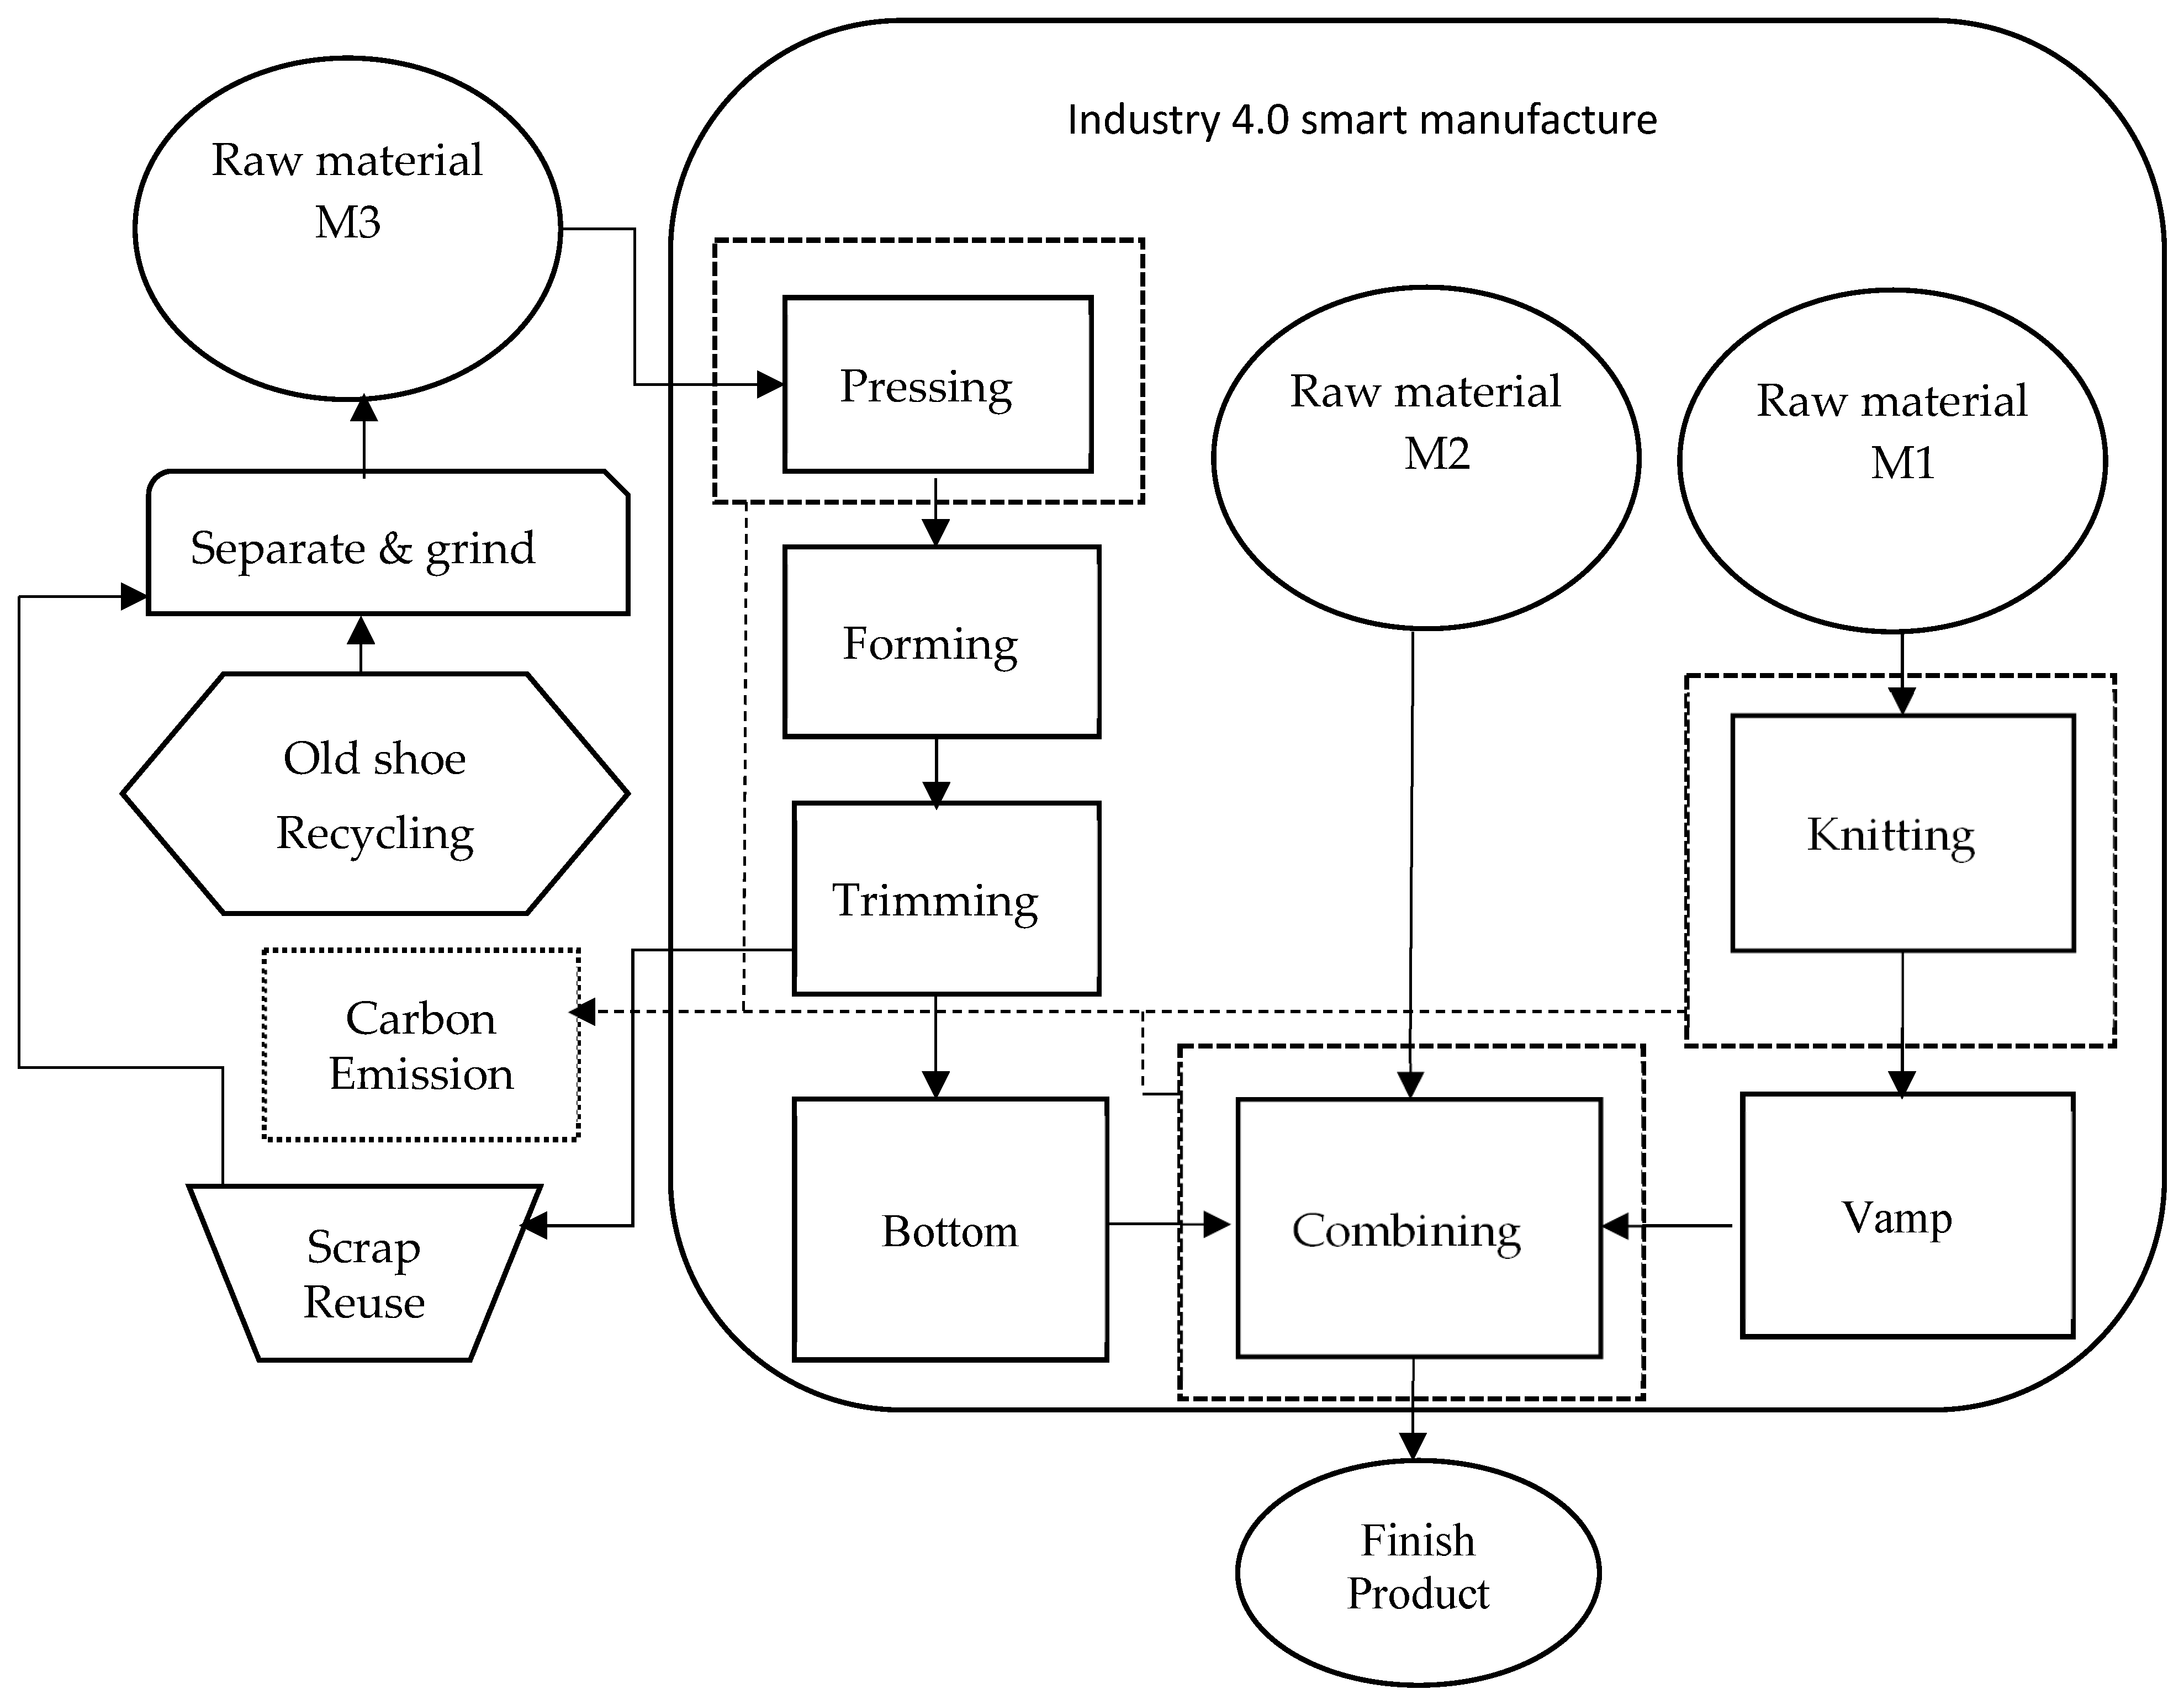
2.1. Circular Economy and Net-Zero Transformation of the Shoe Industry
2.2. Industry 4.0 Smart Manufacturing
2.3. Carbon Emission Cost Calculation and Allocation Basis
3. Research Methods
3.1. Objective Function
- (1)
- Carbon tax cost function of continuous incremental tax rate with tax exemption (no carbon rights trading)—Model 1
- (2)
- Carbon tax cost function of continuous incremental tax rate with tax exemption (with carbon rights trading)-Model 2
- (3)
- Carbon tax cost function of discontinuous full progressive tax rate with tax exemption (no carbon rights trading)—Model 3
- (4)
- Carbon tax cost function of discontinuous full progressive tax rate with tax exemption (with carbon rights trading)—Model 4
3.2. Carbon Emission Cost
3.2.1. Carbon Emission Function
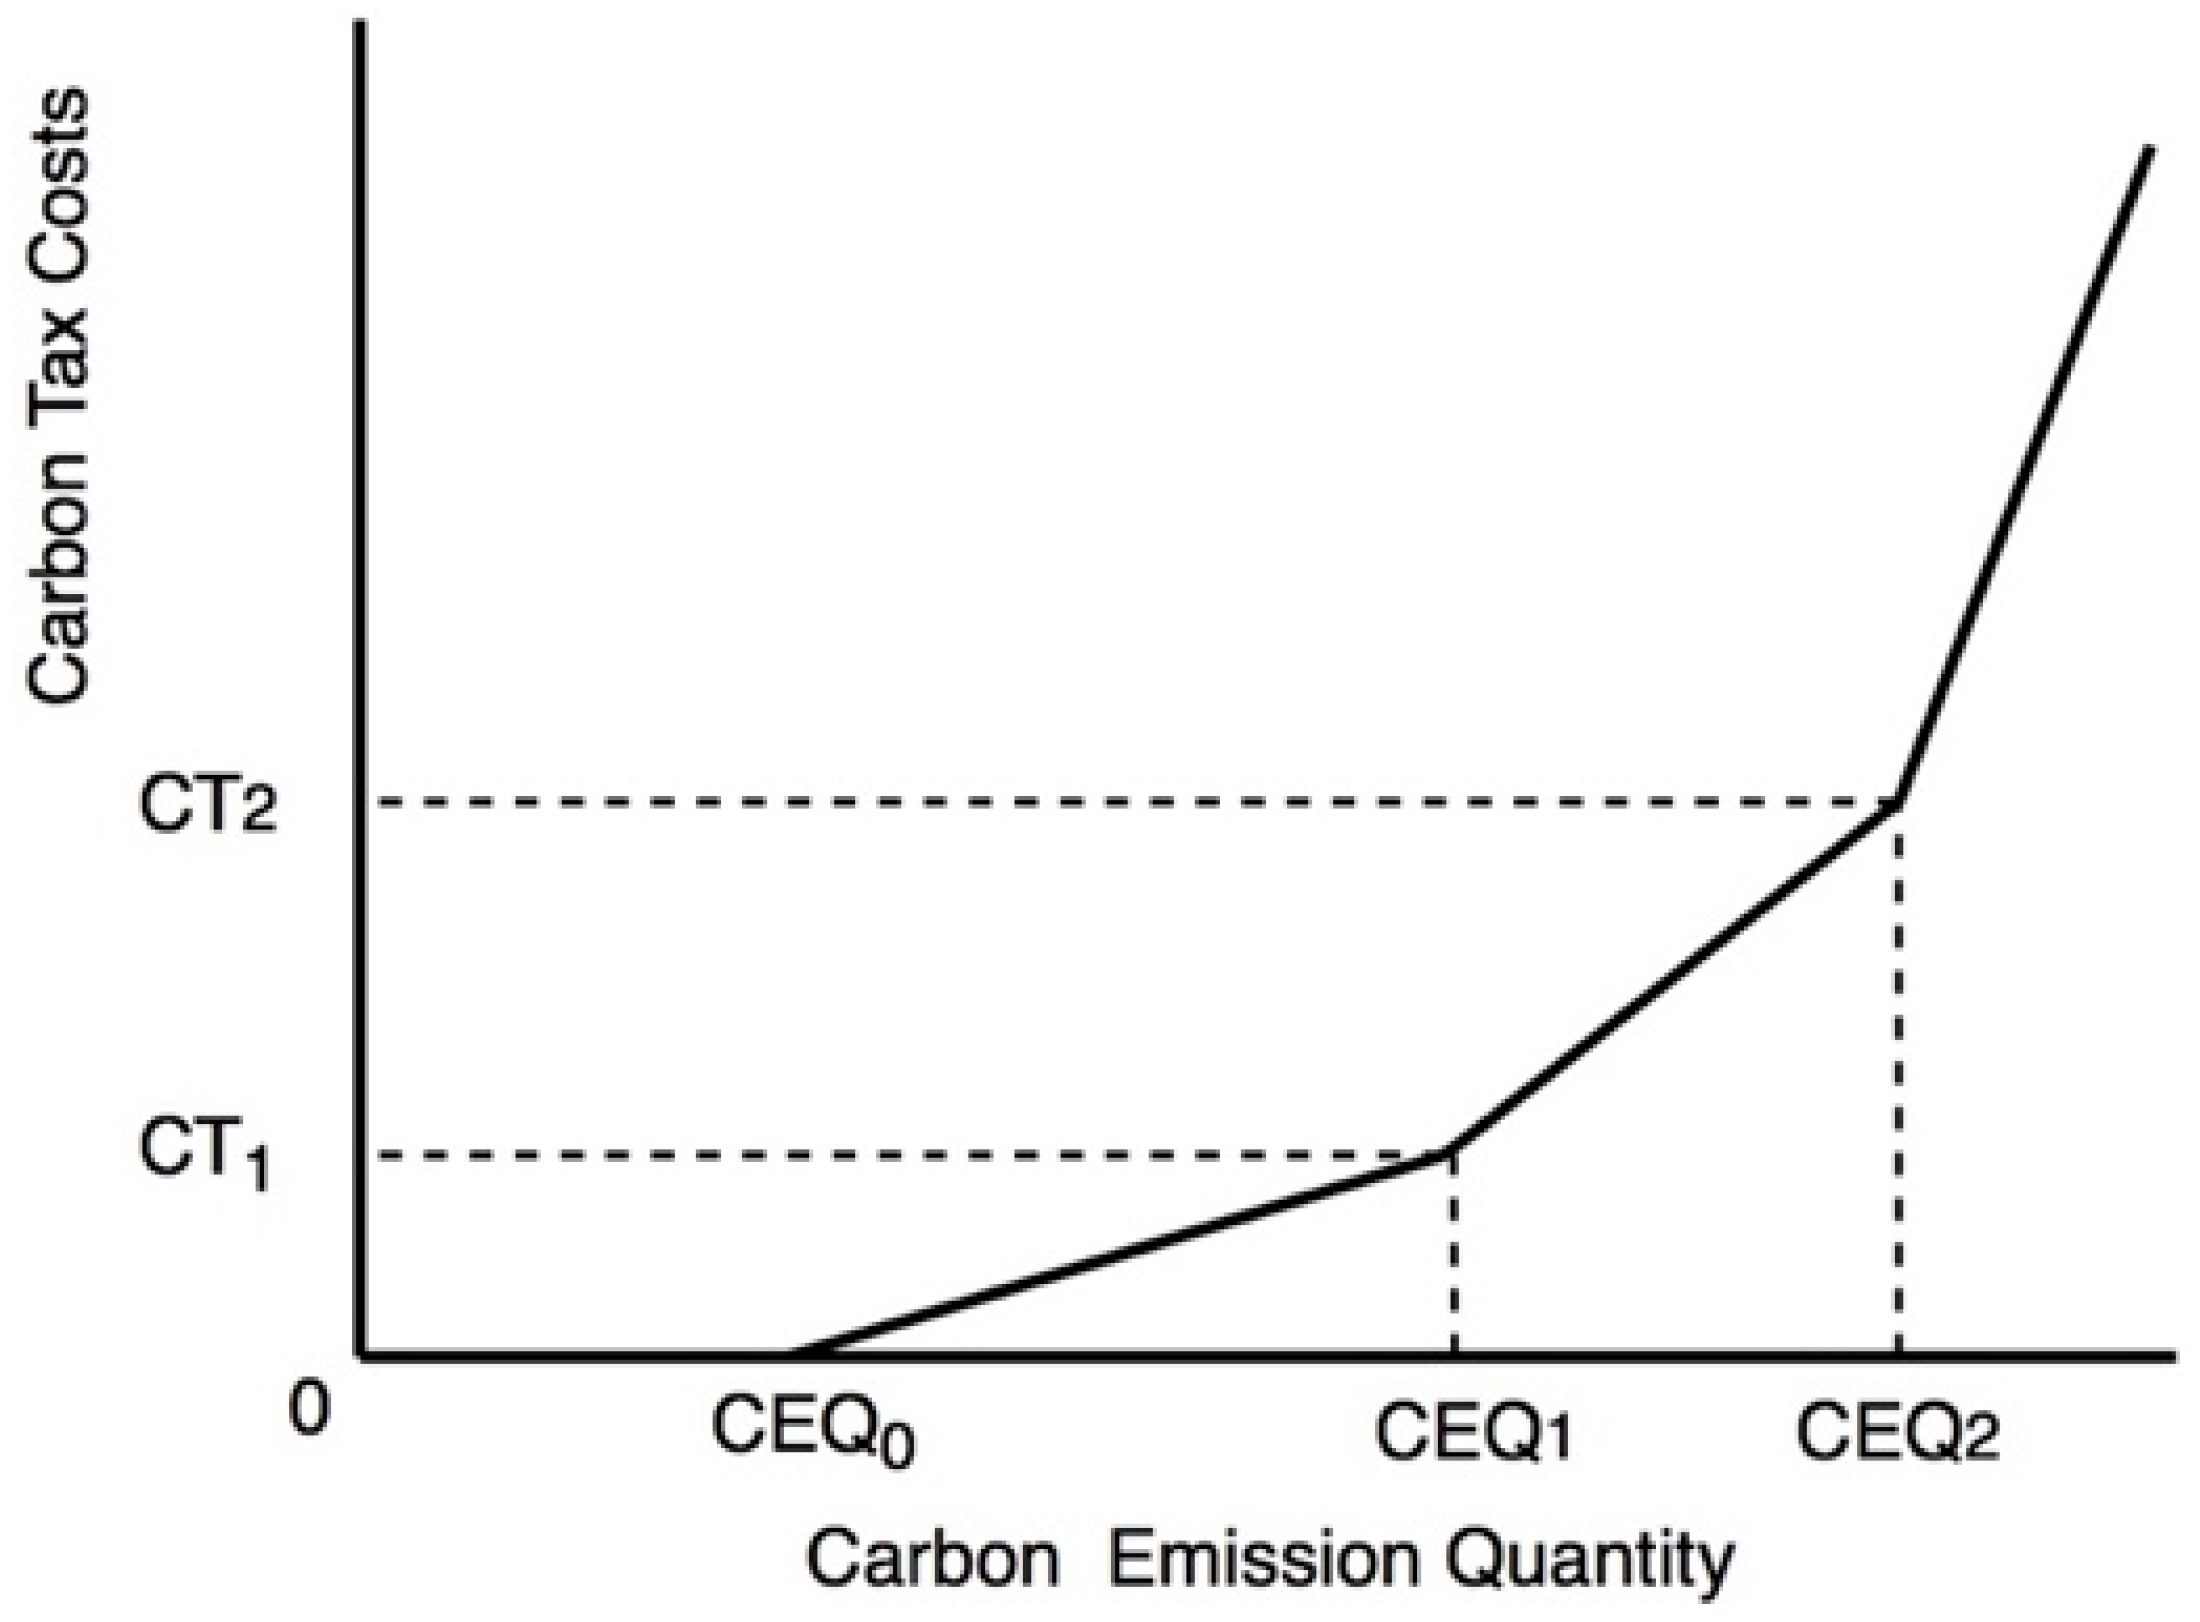
3.2.2. Carbon Tax Function
- (1)
- Carbon tax cost function of continuous incremental tax rate with tax exemption
| CEim | is the carbon emission per unit of the m process for the i-th product (m = 1, 2, 5). |
| CT | is the corporate carbon tax costs. |
| CEQ0 | is the total amount of tax-free carbon emissions granted by the government. |
| CEQ3 | Since the third carbon tax system set by the government has no upper limit, a large amount of carbon emissions, if CEQ3 is not defined, in the mathematical programming model cannot be implemented. |
| CT3 | is the cost of a carbon tax at this point in CEQ3 |
| TRi | is carbon tax rate that the carbon emission falls on the i-segment. |
| are dummy variables (0,1), and only one of the three can be 1. | |
| are a non-negative variable, and at most, two adjacent variables are not 0. |
- (2)
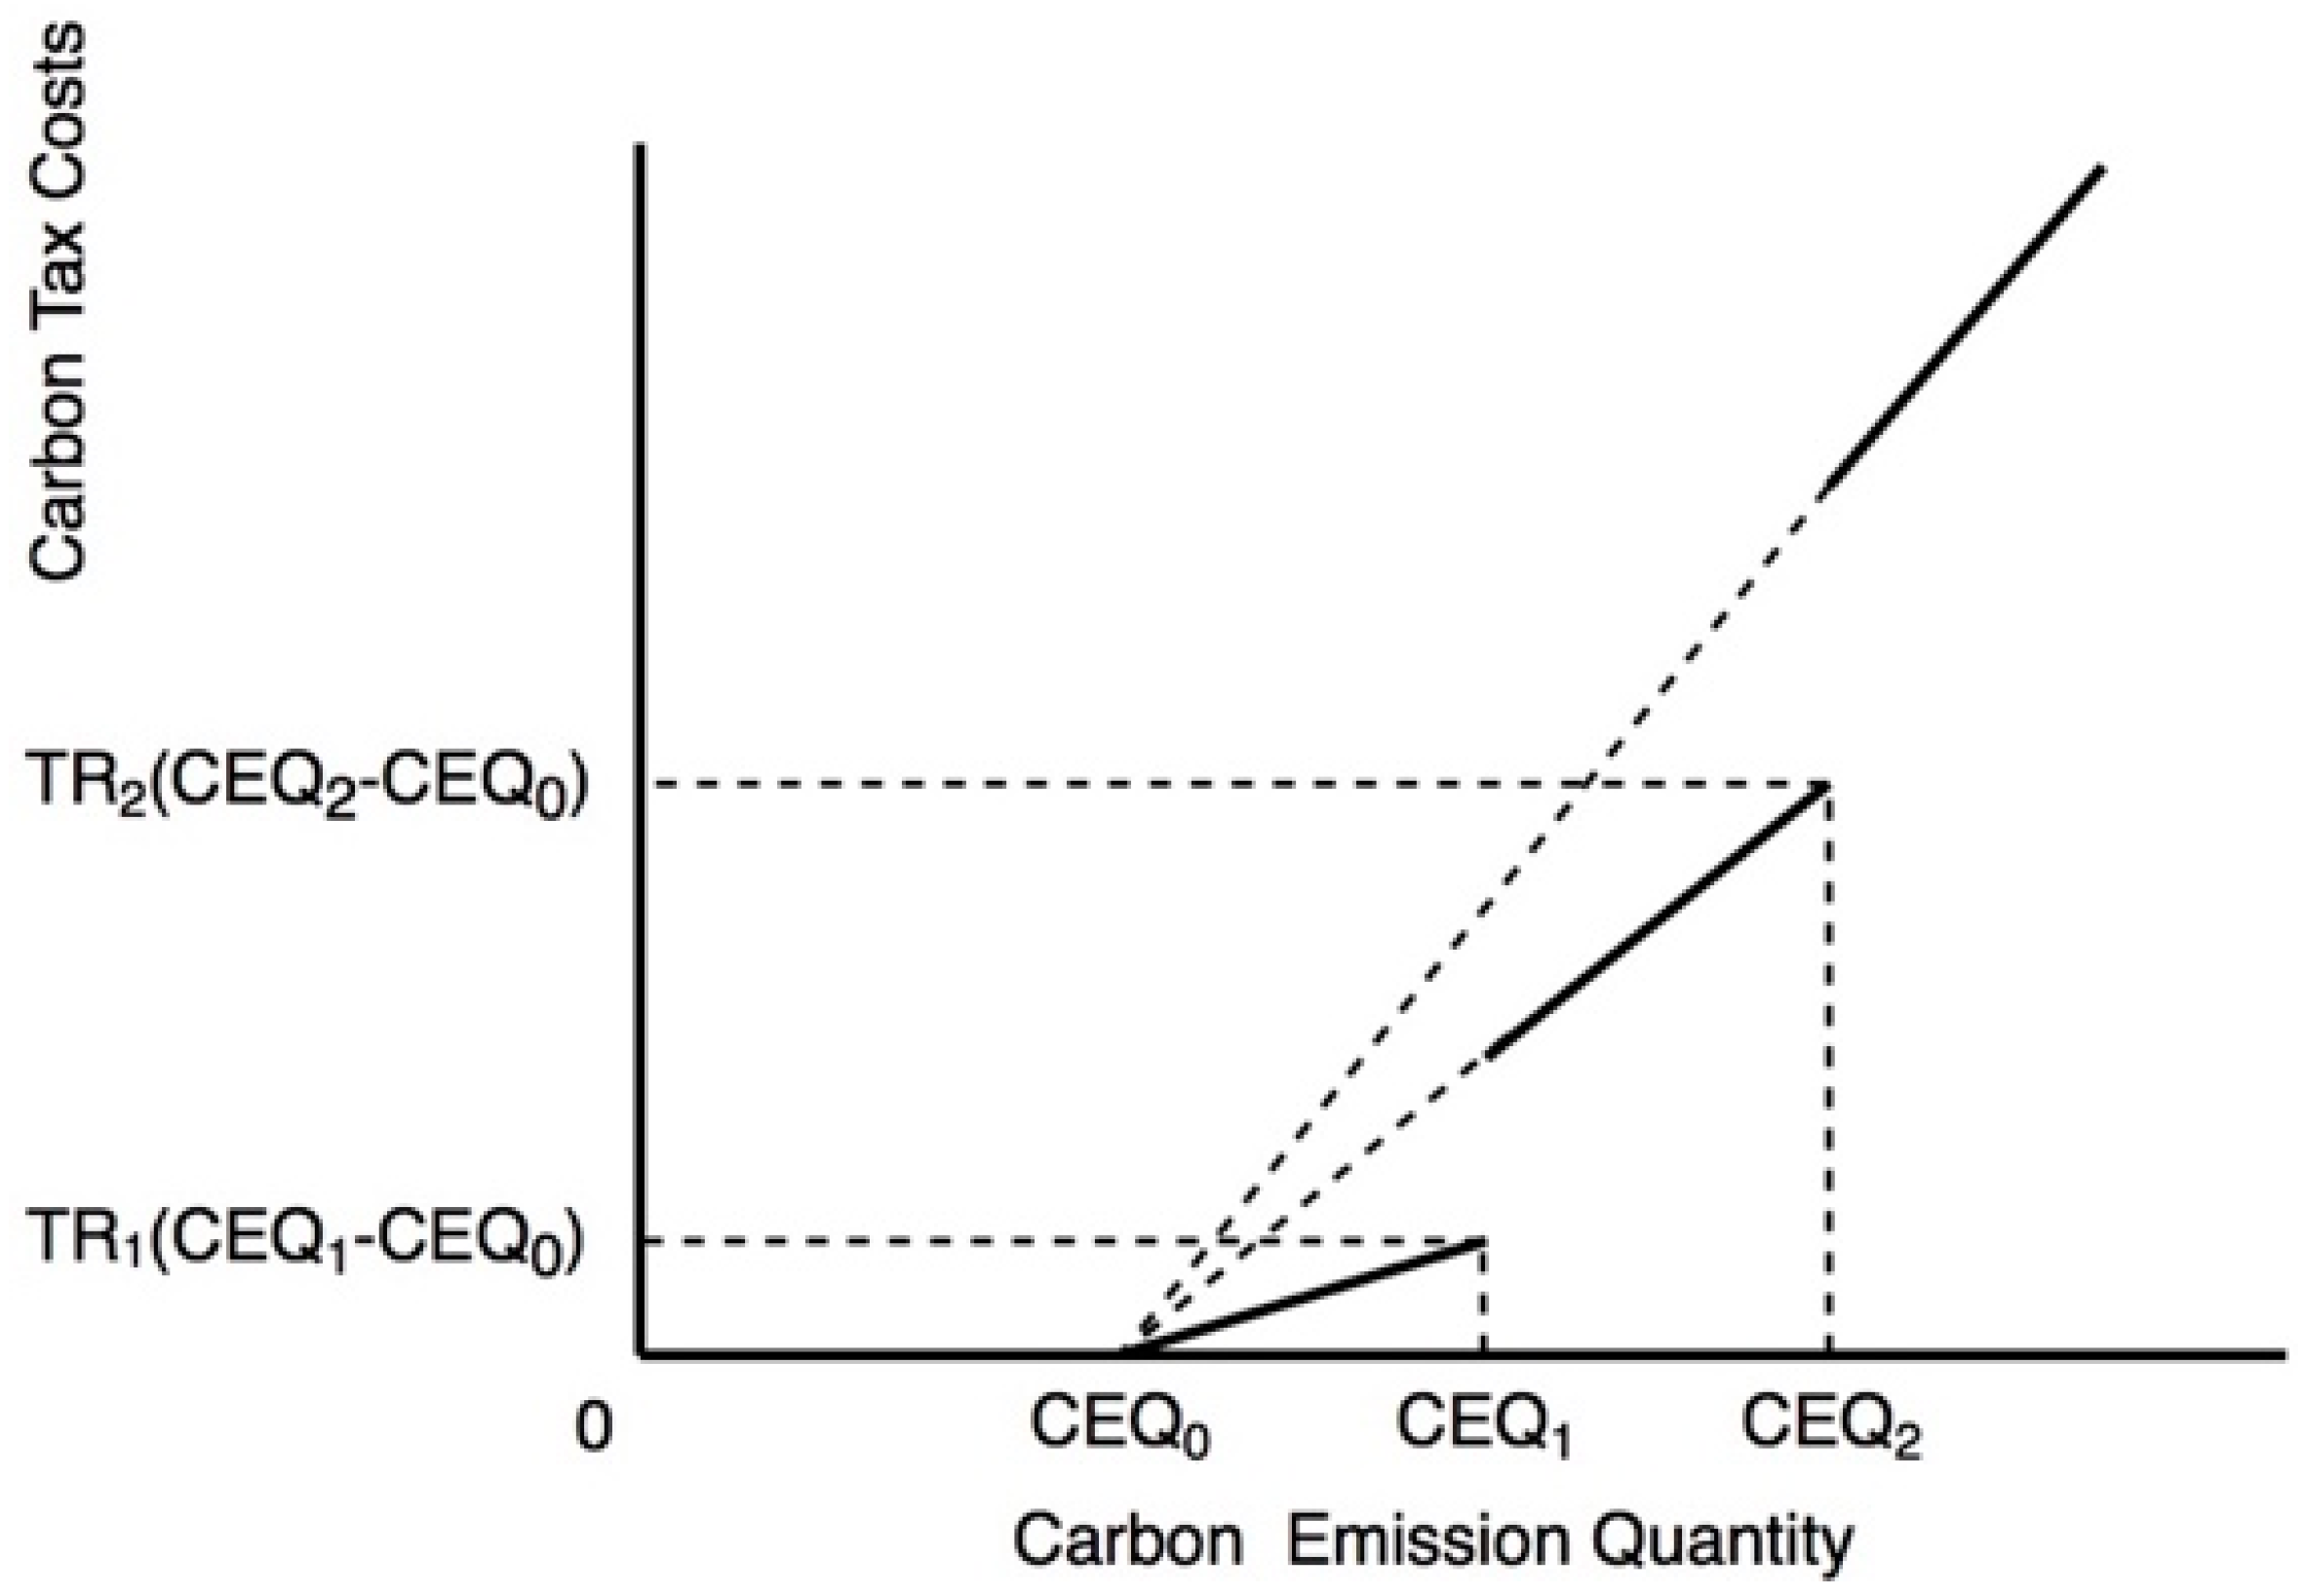
- Carbon tax cost function of discontinuous full progressive tax rate with tax exemption
| is the total amount of tax-free carbon emissions granted by the government. | |
| is the total carbon emissions falling in the i-th paragraph carbon emissions (i = 0, 1, 2, 3). | |
| CEim | is the unit carbon emissions of the i-th product in one of the m processes (m = 1, 2, 5). |
| TRi | is the carbon tax rate based on the carbon emissions falling on the i-th segment. |
| are dummy variables (0,1), and only one of the four can be 1. |
3.2.3. Carbon Rights Trading Function
- (1)
- Carbon tax cost function of continuous incremental tax rate with tax exemption (no carbon rights trading)-Model 1;
- (2)
- Carbon tax cost function of continuous incremental tax rate with tax exemption (with carbon rights trading)-Model 2;
- (3)
- Carbon tax cost function of discontinuous full progressive tax rate with tax exemption (no carbon rights trading)—Model 3;
- (4)
- Carbon tax cost function of discontinuous full progressive tax rate with tax exemption (with carbon rights trading)-Model 4.
| is the quantity of the i-th product (i = 1, 2, 3). | |
| CEim | is the carbon emissions per unit of the m process for the i-th product (m = 1, 2, 5). |
| is the allowable upper limit of carbon emissions stipulated by the government. |
- Model 2—Carbon tax cost function of continuous incremental tax rate with tax exemption (with carbon rights trading)
- Model 4—Carbon tax cost function of discontinuous full progressive tax rate with tax exemption (with carbon rights trading)
3.3. Direct Labor Cost Function
| is the quantity of the i-th product (i = 1, 2, 3). | |
| are non-negative variable, and at most two adjacent variables are not 0. | |
| are dummy variables (0,1), and only one of them can be 1. | |
| is the number of man-hours required to complete a unit of i-th product in the pruning (m = 4) activity. | |
| is the highest number of man-hours falling in the first period of overtime, as shown in Figure 5. | |
| is the highest number of man-hours falling in the second period of overtime, as shown in Figure 5. |
3.4. Capacity Per Machine Hour
| Xi | is the quantity of the i-th product (i = 1, 2, 3). |
| is I machine hours required for the knitting machine to complete one unit of the i-th product. |
3.5. Setting and Material Handling Cost Function
3.6. Product Level Activity–Product Design Cost Function
| is the quantity of the i-th product (i = 1, 2, 3). | |
| is the market demand for the i-th product. | |
| is a dummy variable (0,1), which determines whether the i-th product is produced. If is 1, the product is produced. If 0, it means there is no production. | |
| is the resources consumed by the product-level operations of the i-th product (i = 1, 2, 3). | |
| is the upper limit of available resources for product-level operations. |
3.7. Material Cost Function
| is the quantity of the i-th product (i = 1, 2, 3). | |
| is one unit of raw material cost (j = 1, 2, 3). | |
| is the number of raw materials consumed to complete a unit of product i (i = 1, 2, 3, j = 1, 2, 3). | |
| is the upper limit of the number of available raw materials for the j-th type. |
4. Research Results and Analysis
4.1. Assumption of Model Parameter Data
4.2. Model Analysis
4.2.1. Model Description
- (1)
- Carbon tax cost function of continuous incremental tax rate with tax-exempt quota (without carbon trading)—Model 1
- (2)
- Carbon tax cost function of continuous incremental tax rate with tax-exempt quota (with carbon rights trading)—Model 2
- (3)
- Carbon tax cost function of discontinuous full progressive tax rate with tax-exempt quota (without carbon rights trading)—Model 3
- (4)
- Carbon tax cost function of discontinuous full progressive tax rate with tax-exempt quota (with carbon rights trading)—Model 4
4.2.2. Model Comparison
4.3. Sensitivity Analysis
5. Discussion
6. Conclusions and Recommendations
Author Contributions
Funding
Data Availability Statement
Conflicts of Interest
References
- Bonsu, N.O. Towards a circular and low-carbon economy: Insights from the transitioning to electric vehicles and net zero economy. J. Clean. Prod. 2020, 256, 120659. [Google Scholar] [CrossRef]
- Hailemariam, A.; Erdiaw Kwasie, M.O. Towards a circular economy: Implications for emission reduction and environmental sustainability. Bus. Strategy Environ. 2023, 32, 1951–1965. [Google Scholar] [CrossRef]
- Hansen, D.R.; Mowen, M.M.; Heitger, D.L. Cost management. Cengage Learning, 5th ed.; Cengage: Boston, MA, USA, 2021. [Google Scholar]
- Patras, V. Sustainability in the Shoe Market: Adidas on a Move to Sustainability. 2021. Available online: https://www.theseus.fi/bitstream/handle/10024/511091/Patras_Veena.pdf?sequence=3&isAllowed=y (accessed on 5 November 2023).
- Jimeno-Morenilla, A.; Azariadis, P.; Molina-Carmona, R.; Kyratzi, S.; Moulianitis, V. Technology enablers for the implementation of Industry 4.0 to traditional manufacturing sectors: A review. Comput. Ind. 2021, 125, 103390. [Google Scholar] [CrossRef]
- Cheah, L.; Ciceri, N.D.; Olivetti, E.; Matsumura, S.; Forterre, D.; Roth, R.; Kirchain, R. Manufacturing-focused emissions reductions in footwear production. J. Clean. Prod. 2013, 44, 18–29. [Google Scholar] [CrossRef]
- Bai, C.; Dallasega, P.; Orzes, G.; Sarkis, J. Industry 4.0 technologies assessment: A sustainability perspective. Int. J. Prod. Econ. 2020, 229, 107776. [Google Scholar] [CrossRef]
- Dwivedi, A.; Moktadir, M.A.; Jabbour, C.J.C.; de Carvalho, D.E. Integrating the circular economy and industry 4.0 for sustainable development: Implications for responsible footwear production in a big data-driven world. Technol. Forecast. Soc. Chang. 2021, 175, 121335. [Google Scholar] [CrossRef]
- Spahiu, T.; Almeida, H.; Manavis, A.; Kyratsis, P.; Jimeno-Morenilla, A. Industry 4.0 for Sustainable Production in Footwear Industry, International Conference on Water Energy Food and Sustainability; Springer: Berlin/Heidelberg, Germany, 2021; pp. 699–707. [Google Scholar]
- Tsai, W.-H.; Lai, S.Y. Green production planning and control model with ABC under industry 4.0 for the paper industry. Sustainability 2018, 10, 2932. [Google Scholar] [CrossRef]
- Al-Dhubaibi, A. Optimizing the value of activity based costing system: The role of successful implementation. Manag. Sci. Lett. 2021, 11, 179–186. [Google Scholar] [CrossRef]
- Alsayegh, M.F. Activity Based Costing around the World: Adoption, Implementation, Outcomes and Criticism. J. Account. Financ. Emerg. Econ. 2020, 6, 251–262. [Google Scholar]
- Mahal, I.; Hossain, A. Activity-based costing (ABC)–an effective tool for better management. Res. J. Financ. Account. 2015, 6, 66–74. [Google Scholar]
- Tsai, W.-H.; Jhong, S.-Y. Production decision model with carbon tax for the knitted footwear industry under activity-based costing. J. Clean. Prod. 2019, 207, 1150–1162. [Google Scholar] [CrossRef]
- Tsai, W.-H.; Chen, H.C.; Leu, J.D.; Chang, Y.C.; Lin, T.W. A product-mix decision model using green manufacturing technologies under activity-based costing. J. Clean. Prod. 2013, 57, 178–187. [Google Scholar] [CrossRef]
- Jian, T.; Jiang, G.; Zuogong, W. Decision making of product quality and carbon emission reduction in footwear supply chain under production capacity constraint. Rev. Piel. Incaltaminte 2019, 19, 203. [Google Scholar]
- Eklund, F.J. Resource Constraints in Health Care-Case Studies on Technical, Allocative and Economic Efficiency. 2008. Available online: https://aaltodoc.aalto.fi/items/ab7ca857-2544-410f-805b-055865625400 (accessed on 5 November 2023).
- Arruda, E.H.; Melatto, R.A.P.; Levy, W.; Conti, D.M. Circular economy: A brief literature review (2015–2020). Sustain. Oper. Comput. 2021, 2, 79–86. [Google Scholar] [CrossRef]
- Fang, Y.; Chen, M.; Liang, W.; Zhou, Z.; Liu, X. Knowledge Graph Learning for Vehicle Additive Manufacturing of Recycled Metal Powder. World Electr. Veh. J. 2023, 14, 239. [Google Scholar] [CrossRef]
- Geissdoerfer, M.; Pieroni, M.P.; Pigosso, D.C.; Soufani, K. Circular business models: A review. J. Clean. Prod. 2020, 277, 123741. [Google Scholar] [CrossRef]
- Mahmud, Y.; Rashed-Ul-Islam, M.; Islam, M.; Moin, T.S.; Rahman, K.T. Assessment of the Carbon Footprint and VOCs Emissions Caused by the Manufacturing Process of the Footwear Industry in Bangladesh. Text. Leather Rev. 2021, 4, 23–29. [Google Scholar] [CrossRef]
- Ainalis, D.; Bardhan, R.; Bell, K.; Cebon, D.; Czerniak, M.; Farmer, J.D.; Fitzgerland, S.; Galkowski, K.; Grimshaw, S.; Harper, G. Net-Zero Solutions and Research Priorities in the 2020s. 2021. Available online: https://uucn.ac.uk/wp-content/uploads/2022/09/NetZero-Solutions-and-Research-Priorities-in-the-2020s.pdf (accessed on 5 November 2023).
- Arán-Ais, F.; Ruzafa-Silvestre, C.; Carbonell-Blasco, M.; Pérez-Limiñana, M.; Orgilés-Calpena, E. Sustainable adhesives and adhesion processes for the footwear industry. Proc. Inst. Mech. Eng. Part C J. Mech. Eng. Sci. 2021, 235, 585–596. [Google Scholar] [CrossRef]
- Majeed, A.A.; Rupasinghe, T.D. Internet of things (IoT) embedded future supply chains for industry 4.0: An assessment from an ERP-based fashion apparel and footwear industry. Int. J. Supply Chain Manag. 2017, 6, 25–40. [Google Scholar]
- Román-Ibáñez, V.; Jimeno-Morenilla, A.; Pujol-Lopez, F.A. Distributed monitoring of heterogeneous robotic cells. A proposal for the footwear industry 4.0. Int. J. Comput. Integr. Manuf. 2018, 31, 1205–1219. [Google Scholar] [CrossRef]
- Stock, T.; Seliger, G. Opportunities of Sustainable Manufacturing in Industry 4.0. In Procedia CIRP, Proceedings of the 13th Global Conference on Sustainable Manufacturing—Decoupling Growth from Resource Use, Binh Duong, Vietnam, 16–18 September 2016; Seliger, G., Malon, J., Kohl, H., Eds.; Elsevier B.V.: Amsterdam, The Netherlands, 2016; Volume 40, pp. 536–541. [Google Scholar]
- Kamble, S.S.; Gunasekaran, A.; Gawankar, S.A. Sustainable Industry 4.0 Framework: A Systematic Literature Review Identifying the Current Trends and Future Perspectives. Process. Saf. Environ. Prot. 2018, 117, 408–425. [Google Scholar] [CrossRef]
- Bag, S.; Pretorius, J.H.C. Relationships between Industry 4.0, Sustainable Manufacturing and Circular Economy: Proposal of a Research Framework. Int. J. Organ. Anal. 2022, 30, 864–898. Available online: https://www.emerald.com/insight/content/doi/10.1108/IJOA-04-2020-2120/full/html (accessed on 5 November 2023). [CrossRef]
- Machado, C.G.; Winroth, M.P.; Ribeiro da Silva, E.H.D. Sustainable Manufacturing in Industry 4.0: An Emerging Research Agenda. Int. J. Prod. Res. 2020, 58, 1462–1484. [Google Scholar] [CrossRef]
- Duez, B. Towards a Substantially Lower Fuel Consumption Freight Transport by the Development of an Innovative Low Rolling Resistance Truck Tyre Concept. Trans. Res. Procedia 2016, 14, 1051–1060. [Google Scholar] [CrossRef]
- Lin, B.; Li, X. The effect of carbon tax on per capita CO2 emission. Energy Policy 2011, 39, 5137–5146. [Google Scholar] [CrossRef]
- Conegrey, T.; Gerald, J.D.F.; Valeri, L.M.; Tol, R.S.J. The impact of a carbon tax on economic growth and carbon dioxide emissions in Ireland. J. Environ. Plan. Manag. 2013, 56, 934–952. [Google Scholar] [CrossRef]
- Metcalf, G.E.; Weisbach, D. The design of a carbon tax. Harv. Environ. Law Rev. 2009, 33, 499. [Google Scholar] [CrossRef]
- Staikos, T.; Rahimifard, S. A decision-making model for waste management in the footwear industry. Int. J. Prod. Res. 2007, 45, 4403–4422. [Google Scholar] [CrossRef]
- Kaplan, R.S. In defense of activity-based cost management. Strateg. Financ. 1992, 74, 58. [Google Scholar]
- Tsai, W.-H.; Lu, Y.-H.; Hsieh, C.-L. Comparison of Production Decision-making Models under Carbon Tax and Carbon Rights Trading. J. Clean. Prod. 2022, 379, 34462. [Google Scholar] [CrossRef]
- Turney, P.B. Activity Based Costing, Management Accounting Handbook; Butterworth-Heinemann: Oxford, UK; CIMA: London, UK, 1992. [Google Scholar]
- Ghani, N.; Zaini, S.; Abu, M. Assessment the unused capacity using time driven activity based costing in automotive manufacturing industry. J. Mod. Manuf. Syst. Technol. 2020, 4, 82–94. [Google Scholar] [CrossRef]
- Kee, R. The sufficiency of product and variable costs for production-related decisions when economies of scope are present. Int. J. Prod. Econ. 2008, 114, 682–696. [Google Scholar] [CrossRef]
- Gong, Z.; Hu, S. An economic evaluation model of product mix flexibility. Omega-Int. J. Manag. Sci. 2008, 36, 852–864. [Google Scholar] [CrossRef]
- Tsai, W.-H.; Lai, S.-Y.; Hsieh, C.-L. Exploring the impact of different carbon emission cost models on corporate profitability. Ann. Oper. Res. 2023, 322, 41–74. [Google Scholar] [CrossRef]
- Tsai, W.-H.; Kuo, L. Operating costs and capacity in the airline industry. J. Air Transp. Manag. 2004, 10, 269–275. [Google Scholar] [CrossRef] [PubMed]
- Goldratt, E.M. The Haystack Syndrome: Sifting Information from the Data Ocean? North River Press: Croton-on-Hudson, NY, USA, 1990. [Google Scholar]
- Fu, J.; Liu, S.; Chen, X.; Bai, X.; Guo, R.; Wang, W. Petrogenesis of taxitic dioritic–tonalitic gneisses and Neoarchean crustal growth in Eastern Hebei, North China Craton. Precambrian Res. 2016, 284, 64–87. [Google Scholar] [CrossRef]
- Liu, Z.; Zheng, X.-X.; Gong, B.-G.; Gui, Y.-M. Joint decision-making and the coordination of a sustainable supply chain in the context of carbon tax regulation and fairness concerns. Int. J. Environ. Res. Public Health 2017, 14, 1464. [Google Scholar] [CrossRef]
- Borchardt, M.; Wendt, M.H.; Pereira, G.M.; Sellitto, M.A. Redesign of a component based on ecodesign practices: Environmental impact and cost reduction achievements. J. Clean. Prod. 2011, 19, 49–57. [Google Scholar] [CrossRef]


| Product 1 (i = 1) | Product 2 (i = 2) | Product 3 (i = 3) | Maximum Available Resources | |||||
|---|---|---|---|---|---|---|---|---|
| Product Price | m | Pi | TWD 1705 | TWD 1974 | TWD 2178 | |||
| Raw materials (unit level) | j = 1 (String) | M1 = TWD 58/unit | RMi1 | 1 | 1.5 | 2 | LMQ1 = 265,938 | |
| j = 2 (PU) | M2 = TWD 116/unit | RMi2 | 2 | 2 | 2 | LMQ2 = 364,000 | ||
| j = 3 (Glue) | M3 = TWD 39/unit | RMi3 | 0.5 | 1 | 1.2 | LMQ3 = 156,000 | ||
| Unit level work | ||||||||
| labor hours | m = 4 (Trimming) | 4 | RLHi4 | 0.20 | 0.30 | 0.40 | ||
| m = 5 (Combination) | 5 | RLHi5 | 0.80 | 1.50 | 1.60 | |||
| Machine hours | m = 1 (Knitting) | 1 | RMHi1 | 1 | 4 | 8 | LMH1 = 401,500 | |
| m = 2 (Pressing) | 2 | RMHi2 | 0.1 | 0.14 | 0.2 | LMH2 = 24,024 | ||
| m = 5 (Combination) | 5 | RMHi5 | 0.2 | 0.4 | 0.5 | LMH5 = 64,064 | ||
| Batch level job | Job element | |||||||
| Forming | Forming hours | C3 = TWD 100/h | 3 | i3 | 2 | 2 | 2 | R3 = 120,900 |
| i3 | 4 | 3 | 2 | |||||
| Setting | Setting hours | C6 = TWD 40/h | 6 | i6 | 6 | 3 | 2 | R6 = 713,284 |
| i6 | 6 | 3 | 2 | |||||
| Material handling | Handling hours | C7 = TWD 15/h | 7 | i7 | 6 | 4 | 3 | R7 = 436,800 |
| i7 | 6 | 4 | 3 | |||||
| Product level work | Product design | d8 = TWD 150/h | 8 | i8 | 3000 | 1500 | 5000 | C8 = 10,000 |
| Direct labor cost limit | DLC0 = TWD 15,960,000 | DLC1 = TWD 22,910,790 | DLC2 = TWD 31,589,640 |
| Direct labor hours | DLH0 = 120,000 | DLH1 = 39,270 | DLH2 = 78,540 |
| pay rate | WR0 = TWD 133/hour | WR1 = TWD 177/h | WR2 = TWD 221/h |
| Product 1 (i = 1) | Product 2 (i = 2) | Product 3 (i = 3) | Maximum Available Resources | |||||
|---|---|---|---|---|---|---|---|---|
| 1. Carbon emission cost | ||||||||
| 2. Process carbon emissions | m = 1 (Knitting) | CEi1 | 0.53 | 0.98 | 1.43 | MCEQ = 250,000 kg | ||
| m = 2 (Pressing) | CEi2 | 0.35 | 0.65 | 0.95 | SMCEQ = 677,500 kg | |||
| m = 5 (Combination) | CEi5 | 0.89 | 1.64 | 2.39 | ||||
| 3. Carbon tax cost | CT1 = TWD 135,000 | CT2 = TWD 425,000 | T3 = TWD 313,667,020 | |||||
| 4. Carbon emission caps for each level | CEQ1 = 150,000 kg | CEQ2 = 400,000 kg | CEQ3 = 221,460,000 kg | |||||
| 5. Carbon tax rates for each level | TR1 = TWD 0.9/kg | TR2 = TWD 1.16/kg | TR3 = TWD 1.417/kg | |||||
| 6. Carbon right cost | LPCRC = TWD 36,500 | LPCEQ = 50,000 kg | = TWD 0.73/kg | MPCEQ = 300,000 kg | ||||
| SLPCRC = TWD 98,91 | LPCEQ = 135,500 kg | SMPCEQ = 813,000 kg | ||||||
| Model 1 | Model2 | |||||||||||
| π | TWD 45,730,174 | X1 | 34,818 | X2 | 14,454 | π | TWD 49,923,842 | X1 | 26,700 | X2 | 25,000 | |
| X3 | 29,582 | η0 | 1 | η1 | 0 | X3 | 30,000 | η0 | 0.7 | η1 | 0.3 | |
| η2 | 0 | Ω1 | 1 | Ω2 | 0 | η2 | 0 | Ω1 | 1 | Ω2 | 0 | |
| ρ13 | 17,409 | ρ16 | 5803 | ρ17 | 5803 | ρ13 | 13,350 | ρ16 | 4450 | ρ17 | 4450 | |
| ρ23 | 7227 | ρ26 | 4818 | ρ37 | 3614 | ρ23 | 12,500 | ρ26 | 8334 | ρ37 | 6250 | |
| ρ33 | 14,791 | ρ36 | 14,791 | ρ37 | 9861 | ρ33 | 15,000 | ρ36 | 15,000 | ρ37 | 10,000 | |
| Γ1 | 1 | Γ2 | 1 | Γ3 | 1 | Γ1 | 1 | Γ2 | 1 | Γ3 | 1 | |
| ϵ0 | 0 | ϵ1 | 1 | ϵ2 | 0 | ϵ0 | 0 | ϵ1 | 0.51 | ϵ2 | 0.49 | |
| ϵ3 | 0 | θ1 | 1 | θ2 | 0 | ϵ3 | 0 | θ1 | 0 | θ2 | 1 | |
| θ3 | 0 | θ3 | 0 | Λ1 | 0 | Λ2 | 272,109 | |||||
| σ1 | 0 | σ2 | 1 | |||||||||
| Model 3 | Model 4 | |||||||||||
| π | TWD 45,730,174 | X1 | 34,818 | X2 | 14,454 | π | TWD 49,884,842 | X1 | 26,700 | X2 | 25,000 | |
| X3 | 29,582 | η0 | 1 | η1 | 0 | X3 | 30,000 | η0 | 0.7 | η1 | 0.3 | |
| η2 | 0 | Ω1 | 1 | Ω2 | 0 | η2 | 0 | Ω1 | 1 | Ω2 | 0 | |
| ρ13 | 17,409 | ρ16 | 5803 | ρ17 | 5803 | ρ13 | 13,350 | ρ16 | 4450 | ρ17 | 4450 | |
| ρ23 | 7227 | ρ26 | 4818 | ρ37 | 3614 | ρ23 | 12,500 | ρ26 | 8334 | ρ37 | 6250 | |
| ρ33 | 14,791 | ρ36 | 14,791 | ρ37 | 9861 | ρ33 | 15,000 | ρ36 | 15,000 | ρ37 | 10,000 | |
| Γ1 | 1 | Γ2 | 1 | Γ3 | 1 | Γ1 | 1 | Γ2 | 1 | Γ3 | 1 | |
| φ0 | 0 | φ1 | 249,999 | φ2 | 0 | φ0 | 0 | φ1 | 0 | φ2 | 272,109 | |
| φ3 | 0 | ρ0 | 0 | ρ1 | 1 | φ3 | 0 | ρ0 | 0 | ρ1 | 0 | |
| ρ2 | 0 | ρ3 | 0 | ρ2 | 1 | ρ3 | 0 | Λ1 | 0 | |||
| Λ2 | 272,109 | σ1 | 0 | σ2 | 1 | |||||||
| Carbon Tax Rate | Model1 | Model2 | ||||||
| TR1 | TR2 | TR3 | Tax Rate Increase | Profit | Change in Profit (%) | Tax Rate Increase | Profit | Change in Yield (%) |
| 0.9 | 1.16 | 1.617 | 1 | TWD 45,730,189 | 0 | 1 | TWD 49,923,842 | 0 |
| 0.945 | 1.218 | 1.698 | 1.05 | TWD 45,723,424 | −0.0148% | 1.05 | TWD 49,915,809 | −0.016% |
| 0.99 | 1.276 | 1.779 | 1.1 | TWD 45,716,674 | −0.0148% | 1.1 | TWD 49,907,777 | −0.016% |
| 1.035 | 1.334 | 1.86 | 1.15 | TWD 45,709,924 | −0.0148% | 1.15 | TWD 49,899,745 | −0.016% |
| 1.08 | 1.392 | 1.94 | 1.2 | TWD 45,703,175 | −0.0148% | 1.2 | TWD 49,891,712 | −0.016% |
| 1.125 | 1.45 | 2.021 | 1.25 | TWD 45,696,425 | −0.0148% | 1.25 | TWD 49,883,680 | −0.016% |
| Carbon Tax Rate | Model3 | Model4 | ||||||
| TR1 | TR2 | TR3 | Tax Rate Increase | Profit | Change in Profit (%) | Tax Rate Increase | Profit | Change in Profit (%) |
| 0.9 | 1.16 | 1.617 | 1 | TWD 45,730,174 | −0.0148% | 1 | TWD 49,884,842 | −0.02% |
| 0.945 | 1.218 | 1.698 | 1.05 | TWD 45,723,424 | −0.0148% | 1.05 | TWD 49,874,859 | −0.02% |
| 0.99 | 1.276 | 1.779 | 1.1 | TWD 45,716,674 | −0.0148% | 1.1 | TWD 49,864,877 | −0.02% |
| 1.035 | 1.334 | 1.86 | 1.15 | TWD 45,709,924 | −0.0148% | 1.15 | TWD 49,854,895 | −0.02% |
| 1.08 | 1.392 | 1.94 | 1.2 | TWD 45,703,175 | −0.0148% | 1.2 | TWD 49,844,912 | −0.02% |
| 1.125 | 1.45 | 2.021 | 1.25 | TWD 45,696,425 | −0.0148% | 1.25 | TWD 49,834,930 | −0.02% |
| Model 1 | Model 3 | |||||
| Carbon Emission Cap | Carbon Emission Cap Reduction Times | Profit | Change in Profit (%) | Carbon Emission Cap Reduction Times | Profit | Change in Profit (%) |
| 250,000 | 1 | TWD 45,730,189 | 0 | 1 | TWD 45,614,175 | 0 |
| 237,500 | 0.95 | TWD 42,621,610 | −6.80% | 0.95 | TWD 42,621,580 | −6.56% |
| 225,000 | 0.9 | TWD 39,228,440 | −7.96% | 0.9 | TWD 39,228,430 | −7.96% |
| 212,500 | 0.85 | TWD 35,836,300 | −8.65% | 0.85 | TWD 35,836,300 | −8.65% |
| 200,000 | 0.8 | TWD 32,443,250 | −9.47% | 0.8 | TWD 32,443,240 | −9.47% |
| 187,500 | 0.75 | TWD 29,050,490 | −10.46% | 0.75 | TWD 29,050,460 | −10.46% |
| Model2 | Model4 | |||||
| Carbon Emission Cap | Carbon Emission Cap Reduction Times | Profit | Change in Profit (%) | Carbon Emission Cap Reduction Times | Profit | Change in Profit (%) |
| 300,000 | 1 | TWD 49,923,842 | 0 | 1 | TWD 49,884,842 | 0 |
| 285,000 | 0.95 | TWD 49,914,720 | −0.02% | 0.95 | TWD 49,875,720 | −0.0183% |
| 270,000 | 0.9 | TWD 49,506,980 | −0.82% | 0.9 | TWD 49,467,980 | −0.8175% |
| 255,000 | 0.85 | TWD 46,668,520 | −5.73% | 0.85 | TWD 46,629,520 | −5.7380% |
| 240,000 | 0.8 | TWD 43,271,380 | −7.28% | 0.8 | TWD 43,271,210 | −7.2021% |
| 225,000 | 0.75 | TWD 39,201,060 | −9.41% | 0.75 | TWD 39,201,060 | −9.4061% |
Disclaimer/Publisher’s Note: The statements, opinions and data contained in all publications are solely those of the individual author(s) and contributor(s) and not of MDPI and/or the editor(s). MDPI and/or the editor(s) disclaim responsibility for any injury to people or property resulting from any ideas, methods, instructions or products referred to in the content. |
© 2023 by the authors. Licensee MDPI, Basel, Switzerland. This article is an open access article distributed under the terms and conditions of the Creative Commons Attribution (CC BY) license (https://creativecommons.org/licenses/by/4.0/).
Share and Cite
Hsieh, C.-L.; Tsai, W.-H. Sustainable Decision Model for Circular Economy towards Net Zero Emissions under Industry 4.0. Processes 2023, 11, 3412. https://doi.org/10.3390/pr11123412
Hsieh C-L, Tsai W-H. Sustainable Decision Model for Circular Economy towards Net Zero Emissions under Industry 4.0. Processes. 2023; 11(12):3412. https://doi.org/10.3390/pr11123412
Chicago/Turabian StyleHsieh, Chu-Lun, and Wen-Hsien Tsai. 2023. "Sustainable Decision Model for Circular Economy towards Net Zero Emissions under Industry 4.0" Processes 11, no. 12: 3412. https://doi.org/10.3390/pr11123412