Article

Investigation of Formation Process and Intensity of Coal and Gas Outburst Shockwave

1
State Key Laboratory of the Gas Disaster Detecting, Preventing and Emergency Controlling, Chongqing 400037, China
2
China Coal Technology and Engineering Group, Chongqing Research Institute, Chongqing 400037, China
*
Author to whom correspondence should be addressed.
Processes 2023, 11(3), 659; https://doi.org/10.3390/pr11030659
Submission received: 9 February 2023 / Revised: 21 February 2023 / Accepted: 21 February 2023 / Published: 22 February 2023
(This article belongs to the Special Issue Process Safety in Coal Mining)

Abstract

:
The shock wave of a coal and gas outburst is a high-pressure and high-speed impact airflow formed rapidly after the outburst. The propagation destroys the ventilation facilities and causes the destruction of the ventilation system. The theoretical research on the outburst shock wave is of great significance. In order to deeply understand the formation mechanism of the outburst shock wave, this paper draws on the shock wave theory to theoretically analyze the microscopic formation process of the outburst shock wave. The main difference between the formation process of a coal and gas outburst shock wave and the formation process of a general shock wave is that the outburst shock wave has a solid–gas flow zone in the high-pressure zone. The calculation formulas of pressure, density, temperature and other parameters before and after the outburst shock wave are derived. After the outburst shock wave passes through, the pressure, temperature and density of the roadway air will change suddenly. The relationship expression between outburst gas pressure and outburst shock wave intensity is derived, which can reflect the role of pulverized coal in the formation process of a shock wave. In order to facilitate the understanding and calculation, the concept of equivalent sound velocity of coal-gas flow is proposed, and the direct calculation of the impact strength of a coal and gas outburst is attempted. This paper is helpful to improve the understanding of the essence of a coal and gas outburst shock wave. It is also of great significance to outburst disaster relief.

1. Introduction

In the process of coal and gas outbursts, the direct damage to underground personnel and equipment in coal mines is the impact of airflow and pulverized coal that rushes with high-speed movement into the working space [1,2,3]. The damage of the impact airflow can be divided into high-pressure airflow shock wave overpressure damage and suffocation damage, among which the shock wave damage is the most direct and fastest [4,5,6]. The former Soviet Union scientist Savonko [7] studied the influence of roadway section reduction and expansion on the pressure of outburst shock waves and obtained the attenuation coefficient of air shock waves during movement. Zhang [8] pointed out that the outburst shock wave belongs to the weak shock wave and constructed the relationship between the propagation attenuation of the outburst shock wave and the initial energy, propagation distance and friction resistance of the roadway. Sun et al. [9] studied the phenomenon of gas accumulation in the roadway after the outburst airflow by using the outburst test device. According to the theory of aerodynamics, Cheng et al. [10,11] established the mathematical model of motion and dynamics of outburst shock wave propagation, and established the relationship between shock wave overpressure, impact airflow velocity and propagation distance, coal seam gas pressure, etc. Based on theoretical analysis and numerical simulation, Tang [12] studied the influence of gas pressure on outburst energy, outburst intensity and gas emission. Miao [13] studied the expansion characteristics of the outburst impact airflow and established the relationship between the expansion characteristics and the expansion failure strength. Hu [14] conducted a numerical study on the impact dynamic effect of the impact airflow on the road header and the outburst prevention door. Zhou et al. [15,16,17] studied the formation and propagation process of outburst shock waves and gas flow in different types of roadways. They analyzed the best roadway form to prevent the spread of outburst shock, studied the influence of gas outburst shock waves on airflow disturbance in mine roadways, and pointed out that the airflow disturbance caused by outburst shock waves was mainly controlled by shock wave overpressure and main fan wind pressure.
Although there have been many studies on the formation and development of outburst shock waves, most of them rely on physical experiments or numerical simulations. Unfortunately, the theoretical analysis of the underlying mechanism is not as comprehensive. Many of the expressions used in these studies are based on aerodynamic theory alone and do not take into account the effects of outburst pulverized coal on a shock wave’s formation. It is difficult to reveal the theoretical mechanism in the formation and development of outburst shock waves.

2. The Relationship between Outburst Shock Wave and General Shock Wave

2.1. The Formation of General Shock Waves

In gases, liquids or solids, if the pressure, density and temperature change (nonlinear change) on a cross section, there is a shock wave inside the material [18,19,20,21]. The reason is generally that there is a wave source in the object whose moving speed exceeds the wave velocity. Shock waves are very common in nature and human society and may be called differently in different situations. For example, the shock wave formed during an explosion can be an explosive wave. The shock wave generated by a flying object when the propagation speed in the air exceeds the speed of sound is generally called sonic explosion. The water hammer effect formed by the sudden closure of water flow in a hard water pipe is also a shock wave. In aerodynamics, a strong shock wave is generally called a shock wave.
The formation process of the shock wave is shown in Figure 1. There is an ideal gas with pressure p1, density ρ1 and temperature T1 in a straight round tube. There is a piston on the left side of the ideal gas, and the piston and gas are static at the initial time, as shown in Figure 1a. In the parameter curve, only the change of pressure p is shown to represent the change of the gas state, so as to avoid repeating. In a very short period of time Δt′, the piston starts moving to the right at speed Δt′ and squeezing the gas in the tube, as shown in Figure 1b. A weak compression wave is formed at the intersection of the gas and the tube, and the compression wave head A1-A1 pushes to the right at the sound velocity c1. The sound velocity c1 is the local sound velocity of stationary gas in the round tube. With the wave head as the boundary, the air parameters on the right side are the initial state in the tube, and the air parameters on the left side are pressure p1 + Δp′, density ρ1 + Δρ′ and temperature T1 + ΔT′. In addition, the velocity increases from 0 to Δv′, and the increments of the four parameters are all positive. The piston continues to move forward, and the piston speed reaches Δt″ after time Δv″. The gas behind the wave head formed in the previous stage is further compressed, and a new compression wave will be formed behind it. The compressed wave head A2-A2 pushes the gas to the right at the sound velocity c1′ relative to wave A1-A1, as shown in Figure 1c. The sound velocity c2 is the local sound velocity of the gas behind A2-A2 in the round roadway. The absolute velocity of A2-A2 is c1′ + Δv′. With the wave head A2-A2 as the boundary, the air parameters on the right side are pressure p1 + Δp′, density ρ1 + Δρ′ and temperature T1 + ΔT′. The air parameters on the left side are pressure p1 + Δp″, density ρ1 + Δρ″ and temperature T1 + ΔT″. The velocity is increased from Δv′ to Δv″. At this time, there are two wave heads, A1-A1 and A2-A2, in the round roadway. As time goes on, the piston will form a series of wave heads in turn as it moves to the right.
The formula of sound velocity in gas is:
a = k R T
In the formula, k is the specific heat ratio of air, T is the thermodynamic temperature, R is the universal gas constant of air and the universal gas constant is R = 8.31 J/(K·mol). The air-specific heat ratio is also constant k = 1.4 in non-extreme cases. It is easy to see that the sound velocity is only related to the gas temperature. The sound velocity is different at different temperatures in the flow field.
The moving speed of A1-A1 is:
v 1 = c 1 = k R T 1
The moving speed of A2-A2 is:
v 2 = c 2 + Δ v = k R ( T 1 + Δ T ) + Δ v
Obviously, the wave head A2-A2 will eventually catch up with the wave head A1-A1 and merge with it after a certain period of time. By analogy, A3-A3 and A4-A4 after the wave head A2-A2 will catch up and merge with the initial wave head A1-A1. Since the air compression wave is also a mechanical wave, the strength of the compression wave obeys the superposition principle, and the strength of the wave at the compression wave is strengthened. Due to the continuous advancement of the piston, new wave heads are continuously generated, and the compression wave is continuously strengthened. Finally, a compression wave with great intensity is formed, which is generally called a shock wave. The continuously strengthened wave head is called the wave front. After the shock wave front passes through, the gas parameters change from the initial p1, ρ1 and T1 to p2, ρ2 and T2 (the values are calculated in the later chapters), and the gas velocity behind it changes from 0 to vf, which is called the accompanying velocity. It should be emphasized that the adjoint velocity is the velocity of the gas after the wave, and the velocity of the shock wave front is the propagation velocity of the mechanical wave. The two are completely independent concepts. The shock wave front velocity is greater than the accompanying velocity.
In summary, the shock wave is a strong disturbance wave. Its propagation velocity and wave front velocity are greater than the sound velocity. The gas state parameters of the shock wave change abruptly (pressure, temperature and density are all increased). The so-called mutation is because the gas state parameters have a large parameter gradient at the wave front and are macroscopically discontinuous. The greater the parameter gradient is, the more obvious the viscous dissipation effect of the gas is at the time of sudden change. The result is that the gas inertial force and viscous dissipation reach equilibrium, as shown in Figure 2a. The spatial thickness involved in this equilibrium stage is several molecular average free paths. The calculation formula of the average free path λ of gas molecules:
λ = k T 2 π d 0 2 p
In the formula, k is the Boltzmann constant, k = 1.38 × 10⁻²³ J/K; T is the absolute temperature, K, in the standard state, T = 273.15 K; d0 is the molecular effective diameter, m; the effective average diameter of air molecules is 3.7 × 10⁻¹⁰ m; p is gas pressure, Pa; the atmospheric pressure is 1 × 10⁵ Pa; and the average free path of air molecules in the standard state is 5.9 × 10⁻⁸ m. This length can be ignored on the macro scale. Therefore, the shock wave front can be completely described as a vertical plane, as shown in Figure 2b.
The shock wave front discussed above is perpendicular to the propagation direction of the wave front, which is called a normal shock wave. Because the axis direction of the roadway is perpendicular to the shock wave of a coal and gas outburst in the roadway, which is similar to the normal shock wave, the shock waves described in this paper are all normal shock waves.

2.2. Coal and Gas Outburst Formation Characteristics

After the formation of underground production and ventilation systems in a coal mine, although there are factors such as altitude and ventilation system, compared with the gas pressure in the coal seam (several atmospheric pressures), a strong gas pressure gradient is formed between the air pressure in the roadway and the gas pressure in the coal seam. Under certain combination conditions of gas pressure, ground stress and physical and mechanical properties of coal, a coal and gas outburst will occur.
The simplified coal and gas outburst scene is shown in Figure 3. Under the action of ground stress and gas pressure, the outburst is excited, and a large number of broken pulverized coal and gas migrate from the coal seam to the roadway at a high speed. From left to right, it can be divided into the stable coal seam area, coal-gas flow area, air compression area and roadway unaffected area. The location of these areas will change with the change of the outburst influence stage, and the interior of each area is also uneven (except for the temporarily unaffected area of the roadway).
After the failure of the weak layer at the outburst mouth disappears, the pulverized coal-gas in the high-pressure space of the coal seam are released and freely migrate to the roadway space. The coal-gas flow will first form in the coal seam. The initial coal-gas flow first compresses the roadway air at the outburst port, and as the coal-gas flow moves, its interface with the air continues to move forward (right side). The compressed roadway air moves forward and compresses the more forward roadway air. The front of the compressed roadway air is called the outburst wave front. The range between the wave front and the coal-gas flow is the air compression zone. The roadway in front of the wave front has not been disturbed by the outburst, which is called the temporarily unaffected area. The air parameters in the area are stable and maintain initial parameters. The moving speed of the wave front is the development speed of the influence range of a coal and gas outburst. From the above discussion, it can be known that the forefront of the impact of a coal and gas outburst is the air compression zone, not coal-gas flow.

3. Coal and Gas Outburst Shock Wave Theory

3.1. Overview of Shock Tube

Shock wave is an important research topic in many fields of nature and laboratory. Its shock wave theory plays an important role in aerospace, aviation, explosion engineering and other fields. A shock tube can form stable and controllable shock waves in laboratory research, which is an important instrument for shock wave-related research. The shock wave process formed in coal and gas outbursts is highly similar to the shock wave process formed by a shock tube. Therefore, this section takes shock wave theory as the starting point to study the shock waves of coal and gas outbursts.
The world’s first shock tube was born in France in 1861. The chemist P. Vieille used it to obtain a moving shock wave with a velocity of 600 m/s in the process of studying the detonation problem in combustion. With the development of shock tube technology and the increase in social development needs, a shock tube is of great significance in many fields. In addition to the basic theories of physics and chemistry, it has been widely used in the fields of electromagnetic fluid mechanics, pneumatic lasers, anti-explosion processes and combustion [22,23,24,25,26]. The shock tube is widely used. The main reason is that the shock tube itself has many advantages, such as a simple structure and strong controllability of shock wave parameters.
The shock tube in the laboratory can be in a variety of forms, but its core basic forms are consistent. The basic shock tube form is called the shock tube later. The shape of this shock tube is a straight tube with an equal cross-section, which is divided into two parts: a high-pressure section and low-pressure section, which are isolated by a bursting disc, as shown in Figure 4. When a shock wave is needed, the bursting disc breaks and the high-pressure gas in the high-pressure section suddenly rushes into the low-pressure section to form a shock wave. By changing the gas species in the high- and low-pressure sections of the shock tube and the gas pressure in the high- and low-pressure sections, the shock tube can form different shock waves [27,28,29,30].
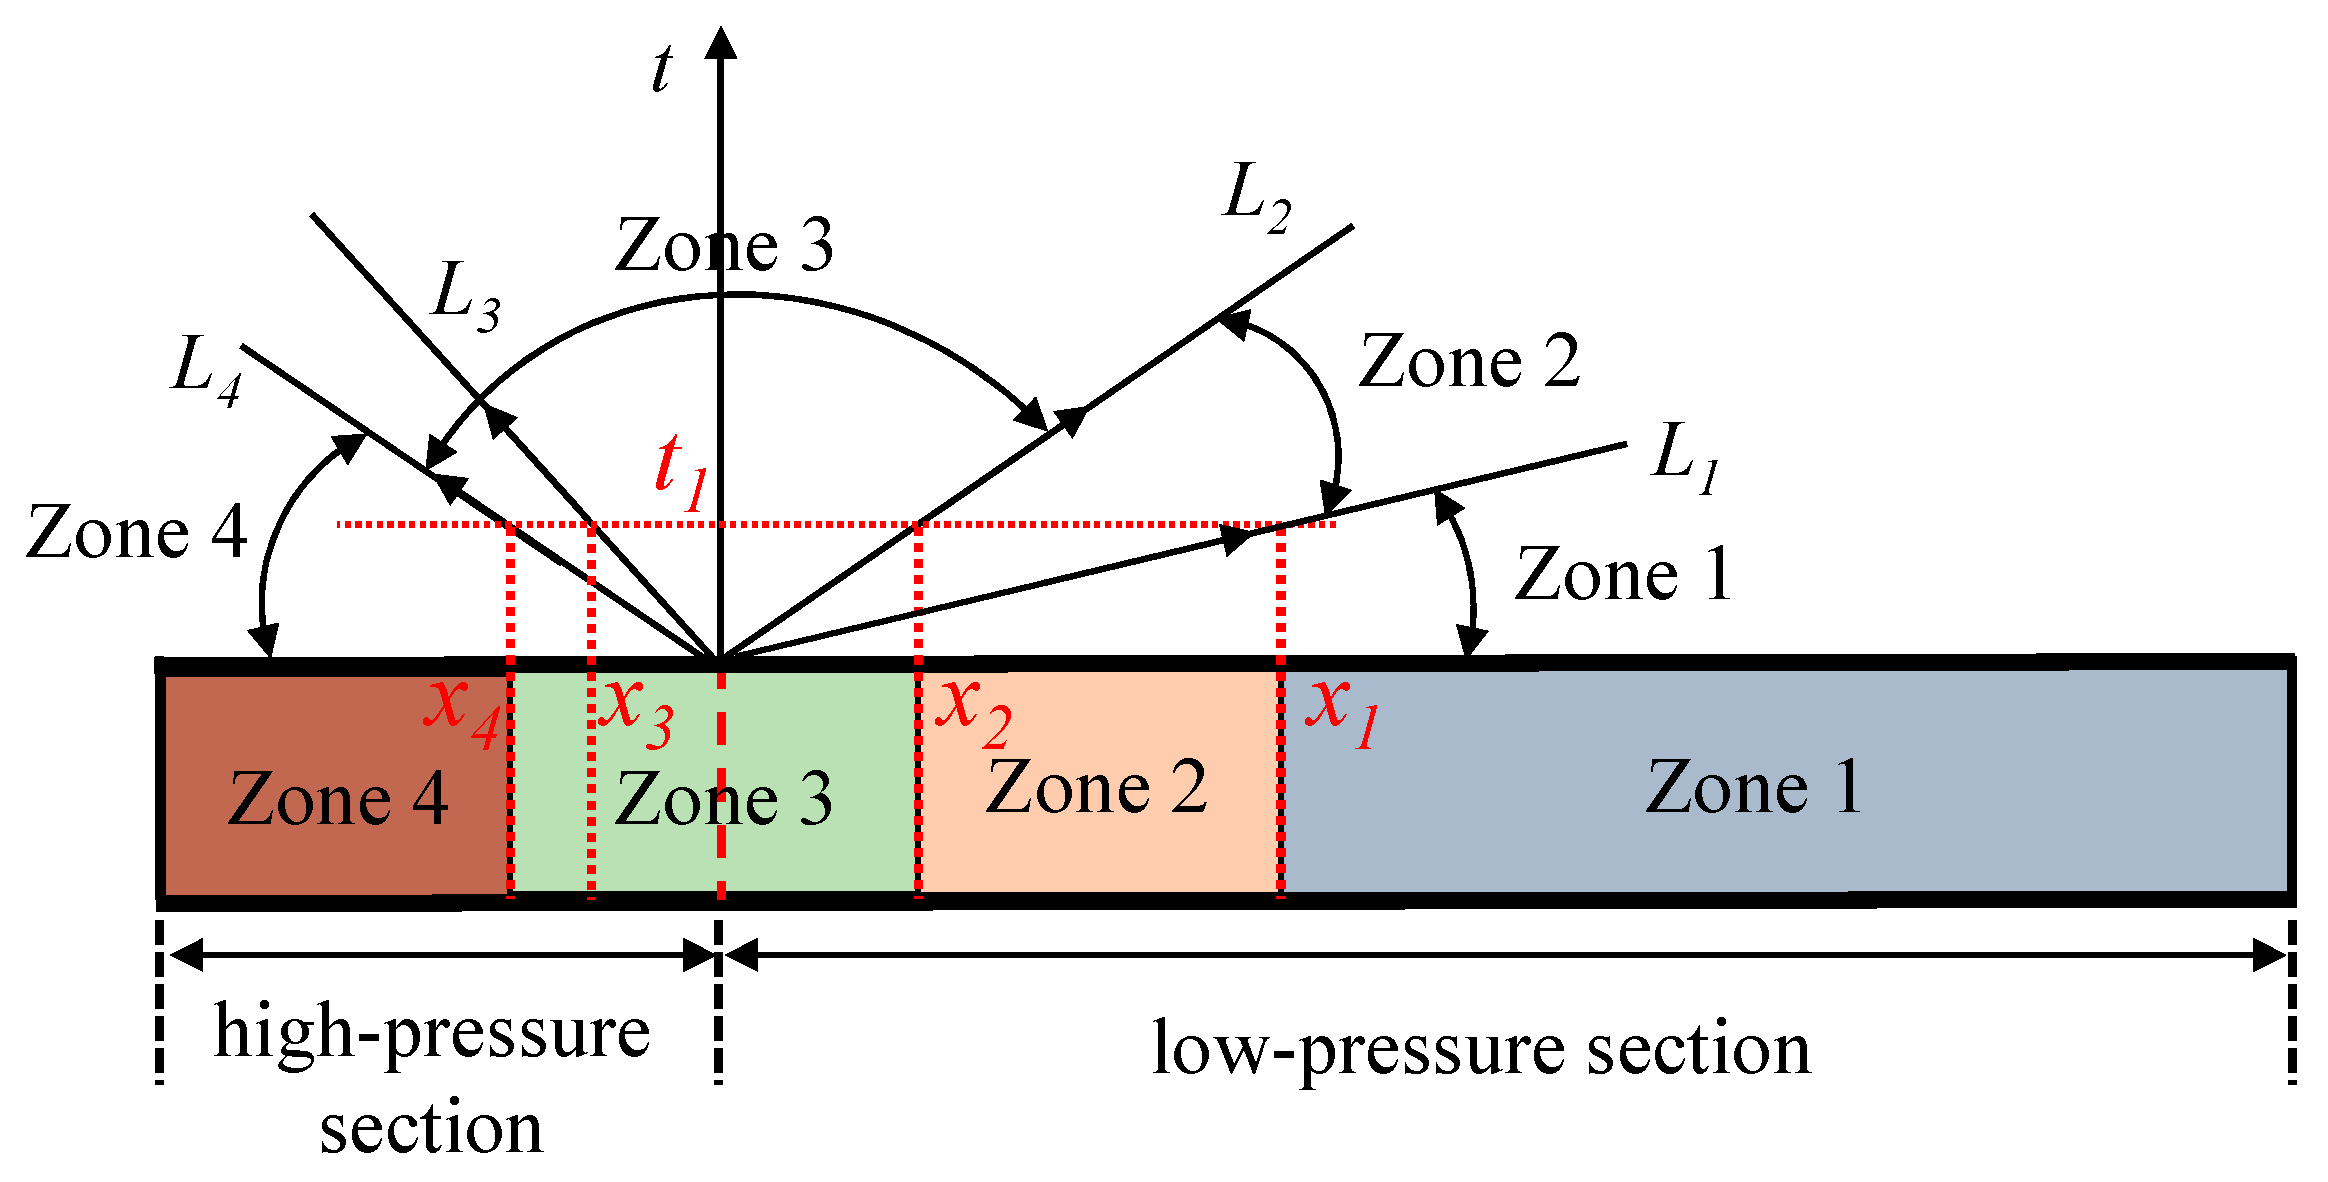
In the shock tube experiment, when the pressure difference on both sides of the bursting disc exceeds its critical value, the bursting disc ruptures. Due to the huge pressure difference on the two sides of the bursting disc, an incident shock wave is generated from the bursting disc position to the right side, and a sparse wave is generated to the left side, as shown in Figure 5. In order to facilitate the later description, the original high-pressure section of the shock tube is called zone 4, and the low-pressure section is called zone 1. When the incident shock wave is formed, its power is the high-pressure gas on the left side, but after the incident shock wave begins to move, it begins to cause a sudden change in the parameters of the low-pressure section at the junction with it. The shock wave front is transferred to the original low-pressure section gas, and the gas parameters (including pressure) of the low-pressure section of this part are surged to form zone 2. With the passage of time, zone 2 gradually moves to zone 1, and the moving speed is the shock wave front speed. The influence range of the sparse wave moving to the left is called zone 3, and the gas parameters (including pressure) in zone 3 become smaller. One difference between rarefaction waves and shock waves is that rarefaction waves do not cause sudden changes in gas parameters, so rarefaction waves are generally not ignored as a line in the vertical direction in space. However, the spatial length of the sparse wave is very short compared with zone 3, and they are all formed by the original high-pressure gas, so this zone is merged into zone 3 and its parameters are regarded as zone 3. Therefore, after the rupture of the bursting disc, the shock tube is divided into zone 4, zone 3, zone 2 and zone 1 from left to right. The pressure in zone 4 is the largest, the pressure in zone 1 is the smallest, zone 3 and zone 2 are equal and between zone 4 and zone 1. Before the incident shock wave or rarefaction wave reaches the two ends of the shock tube, the range of zone 2 and zone 3 gradually increases, and the range of zone 1 and zone 4 gradually decreases. It is easy to see that the gas in zone 1 and zone 2 is the original low-pressure gas, and the gas in zone 3 and zone 4 is the original high-pressure gas. Zone 3’s position spans both sides of the original bursting disc position.
The upper part of Figure 5 shows the shock tube wave diagram. In the figure, the ordinate represents the time, and the abscissa represents the spatial position of the shock tube axis. L1, L2, L3 and L4 represent the shock wave front, the original high-pressure and low-pressure gas interface, the sparse wave right end and the sparse wave left end, respectively. At time t1, these three sections move to x1, x2, x3 and x4, respectively.
In Figure 6, the two figures are the pressure curves in the shock tube at the initial time and t = t1 time, respectively.
When the shock wave theory is applied to the theoretical analysis of a coal and gas outburst, zone 1 is the area where the roadway has not been affected, zone 2 is the roadway air affected by the shock wave, zone 3 is the coal-gas flow area and zone 4 is the outburst area in the coal seam.

3.2. Derivation of Outburst Shock Wave Parameters

Although most of the roadways in coal mines are curved, most of the roadways are also straight in a small range, and most of the coal and gas outbursts occur in the tunneling roadways; these roadways are also straight, which is similar to the geometry of the shock tube. Additionally, the space of the coal mine roadway is much larger than that of the ordinary shock tube. From this aspect, the coal mine roadway is more in line with the assumption of the ideal shock tube.
Some idealized assumptions are needed in the theoretical derivation of coal and gas outburst flow and fluid in shock tubes. Based on these assumptions, complex practical phenomena, in reality, can be transformed into strict formulas. Facts have proved that these assumptions are reasonable, and the calculated results only slightly deviate from the actual gas flow. The main assumption is that the gas in the shock tube is an ideal gas without viscosity. The shock tube wall is rigid. There is no heat exchange between the gas and the shock tube wall. The gas flow in the shock tube is a one-dimensional flow. The rupture of the bursting disc ends instantaneously and completely. In sparse waves, the gas is isentropic. The shock tube that satisfies the above assumptions is also called an ideal shock tube.
As shown in Figure 7a, the incident shock wave front passes through the gas in zone 1 with vs, and then the gas in this zone suddenly changes to the gas in zone 2. The gas changes from the stationary state to vb, and vb is the adjoint velocity. In order to facilitate the analysis, the coordinate transformation is carried out. The coordinate system is established on the shock wave front, and the incident shock wave is transformed into a stationary state to become a stationary shock wave. At this time, the gas in zone 1 enters the wave front at the speed of v1 = vs (facilitate the calculation of the retention value size and ignore the speed direction, the same below). The gas after the parameter mutation moves to the left at the speed v2 = vsvb, as shown in Figure 7b. Gas thermodynamic static parameters such as pressure, density and temperature are independent of coordinate transformation.
In fluid mechanics, Mach number M is an important parameter to describe the flow state. It is defined as the ratio of the velocity v of a point in the flow field to the local sound velocity c of the point:
M = v c
Similar to the concept of local sound speed, the Mach number describes the local properties in the flow field. If the local sound speed of two points in the flow field is different, even if the two points have the same fluid velocity, the Mach number is also different.
The gas Mach number M before and after the wave front after the coordinate transformation:
M 1 = v 1 c 1 = v s c 1
M 2 = v 2 c 2 = v s v b c 2
In the formula, the subscript of 1 is the gas parameter on the right side of the shock wave, and the subscript of 2 is the gas parameter on the left side of the shock wave.
In Figure 7b, the gas in the imaginary frame is used as the control body, because the standing shock wave is a parameter-stable structure and obeys the mass conservation equation:
S ρ V d S = 0
Only the front and back sides of the control body boundary S have fluid in and out. A1 is the area of the inlet surface of the standing shock wave, and A2 is the area of the outlet surface of the standing shock wave. The two values are equivalent and the direction is opposite, so S = A1A2, the above formula can be changed into:
A 1 ρ 1 v s A 2 ρ 2 [ ( v s v b ) ] = 0
The formula can be simplified to:
ρ 1 v 1 = ρ 2 v 2
The momentum conservation is obeyed in the control body, and the impulse of the pressure resultant force is equal to the difference between the momentum of the outflow fluid and the momentum of the inflow fluid.
S ( ρ V d S ) V = S p d S
The above formula can be changed to:
p 1 A 1 p 2 A 2 = m v 2 m v 1
In the formula, m denotes the mass flow rate of gas in and out of the control body, m = ρ v A . The above formula can be transformed into:
p 1 + ρ 1 v 1 2 = p 2 + ρ 2 v 2 2
Similarly, the energy equation is expressed as:
s ρ ( e + V 2 2 ) V d s = S p V d S
The above formula can be transformed into:
h 1 + v 1 2 2 = h 2 + v 2 2 2
In the formula, v 1 2 2 represents the kinetic energy of the airflow, which is a macroscopic parameter. Enthalpy h represents the sum of gas internal energy and pressure potential energy, which is a microscopic parameter.
The momentum Equation (13) is divided by the continuity Equation (10) to obtain:
v 1 2 v 2 2 = ( p 2 p 1 ) ( 1 ρ 1 + 1 ρ 2 )
According to:
h = k k 1 p ρ
The energy Equation (15) can be transformed into:
v 1 2 v 2 2 = 2 k k 1 ( p 2 ρ 2 p 1 ρ 1 )
Combining Equation (16) with Equation (18):
ρ 2 ρ 1 = 1 + k + 1 k 1 p 2 p 1 k + 1 k 1 + p 2 p 1
This function represents the relationship between the density ratio and the pressure ratio before and after the normal shock wave, also known as the shock adiabatic relation. In the experiment, the pressure before and after the shock wave can be directly measured by the pressure sensor, and the density cannot be directly measured, so this formula can be used for density calculation.
The isentropic change of gas is a reversible adiabatic process. The relationship between pressure change and density change is:
ρ 2 ρ 1 = ( p 2 p 1 ) 1 / k
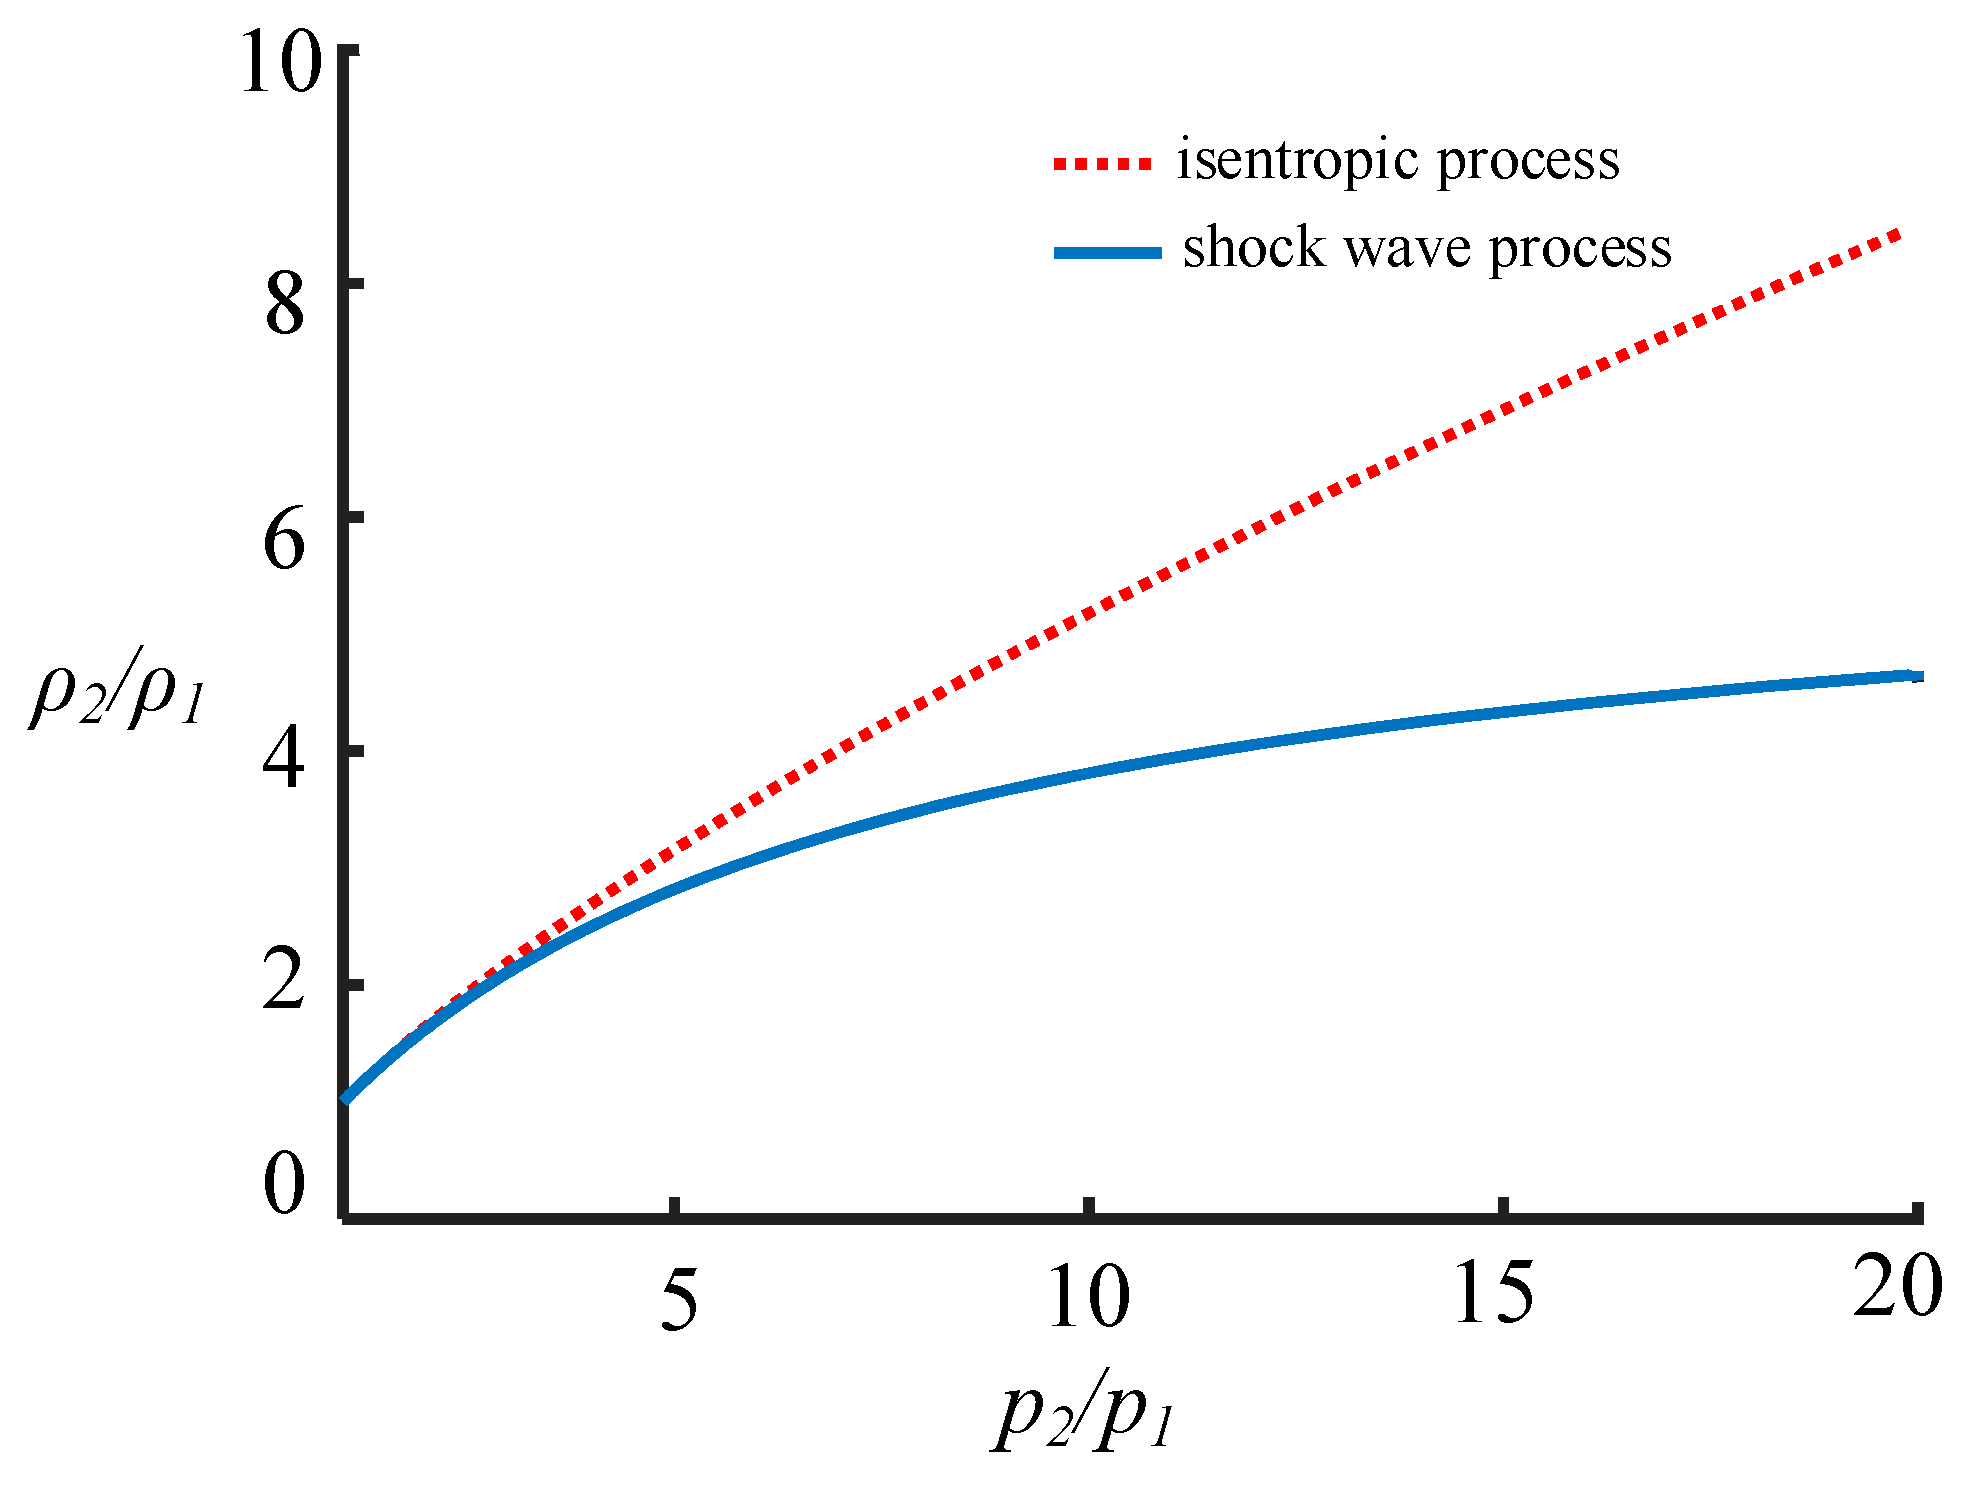
The density changes in the isentropic process and the shock process are compared with k = 1.4, as shown in Figure 8. It can be seen from the diagram that when the pressure is relatively small, the density ratio of the isentropic process and the shock wave process is not much different. As the pressure ratio increases, the density ratio in the shock wave mutation process becomes significantly smaller. The difference between the shock wave process [31] and the isentropic process curve shows that the shock wave process is entropy-increasing, that is, an irreversible process. In addition, as the pressure ratio further increases, the density ratio of the shock wave process has a limit, and the limit value is:
ρ 2 ρ 1 = k + 1 k 1
The calculated limit density ratio is 6. This shows that no matter how strong the shock wave is, the maximum pressure behind the shock wave can reach 6 times the pressure before the shock wave.
Equations (9) and (13) are combined to obtain:
v s = ρ 2 ρ 1 · p 2 p 1 ρ 2 ρ 1
Combined with the shock adiabatic relationship (19) and the sound velocity relationship, we can get:
v s = ρ 2 ρ 1 · p 2 p 1 ρ 2 ρ 1 = c 1 1 + k + 1 2 k ( p 2 p 1 1 )
In the formula, c1 is the sound speed of the gas before the disturbance (before the shock wave). Since the shock wave pressure p2 is always greater than the front atmospheric pressure p1, p 2 p 1 > 1 , according to the above formula, it is easy to see that vs is greater than c1. That is, the velocity of the shock wave front relative to the front gas is theoretically calculated to be supersonic. The greater the shock wave strength, the greater the shock wave propagation speed. When the shock wave strength is very weak p 2 p 1     1 , the shock wave velocity vs is infinitely equal to the unperturbed gas sound velocity.
Defined by the shock wave front Mach number:
M 1 = v s c 1
Derived from Equations (23) and (24):
M 1 = 1 + k + 1 2 k ( p 2 p 1 1 )
The shock wave front Mach number can be obtained from the pressure difference before and after the shock wave. The shock Mach number can be obtained by Equation (24) and Equation (25). However, in Equation (24), the velocity of the wave front needs to be measured, while in Equation (25), the pressure before and after the wave front needs to be measured. The difficulty and accuracy of pressure measurement are higher than that of velocity measurement, so the shock Mach number is generally calculated directly by Equation (24).
In the calculation of shock wave-related parameters, Mach number M1 can be considered an earlier determined parameter. Taking the Mach number as the known number, other parameters can be calculated and deduced.
The inverse operation of Equation (25) is obtained:
p 2 p 1 = 2 k k + 1 M 1 2 k 1 k + 1
Using this formula, the pressure behind the shock wave can be calculated by the shock wave Mach number.
The local thermodynamic parameters of a point in the flowing gas in fluid mechanics are called static parameters. If the isentropic velocity of the fluid at this point is reduced to zero, it is called the stagnation state, and then the parameter value corresponding to the static parameter becomes the stagnation parameter. Static parameters are real state parameters, and stagnation parameters are parameters based on theoretical assumptions. The sign of the stagnation parameter is generally 0. The stagnation parameters include stagnation enthalpy h0, stagnation temperature T0, stagnation pressure p0, stagnation sound speed c0 and stagnation density ρ0. These parameters are also called total enthalpy, total temperature, total pressure and total density.
According to the Bernoulli equation, any two points on a streamline satisfy the formula:
h 1 + v 1 2 2 = h 2 + v 2 2 2 = c o n s t
According to the definition of stagnation state, v2 = 0, then:
h 0 = h + 1 2 v 2
It can be seen from the Equation (28) that the total enthalpy is the sum of the enthalpy related to the temperature of each point and the enthalpy related to the dynamic pressure of the point. It essentially represents the total energy per unit mass of gas. The Equation (27) also shows that the total temperature (total enthalpy) of the gas remains unchanged during the adiabatic process.
In addition, from the gas state equation:
h = c p T ; c p = k R k 1
The total temperature formula is obtained:
T 0 = T ( 1 + k 1 2 v 2 c 2 )
Combined with the definition of the Mach number, the above formula can be written as:
T 0 = T ( 1 + k 1 2 M 2 )
In the formula, T and M can be subscripted at any position.
The parameters p and ρ in the momentum Equation (13) and the energy Equation (15) are eliminated, and only the parameters temperature T and velocity are retained. It can be transformed into:
R T 1 v 1 R T 2 v 2 + ( v 1 v 2 ) = 0
k R k 1 T 1 + v 1 2 2 = k R k 1 T 2 + v 2 2 2 = k R k 1 T 0
From the Equations (32) and (33), we can obtain:
k R T 0 ( v 2 v 1 ) v 1 v 2 + k + 1 2 ( v 1 v 2 ) = 0
By solving the above equation, the sound velocity relationship before and after the shock wave is obtained:
v 1 v 2 = 2 k R T 0 k + 1
By the critical speed of sound equation:
c c r = 2 k R T 0 k + 1
So, there is:
v 1 v 2 = c c r 2
λ 1 = v 1 c c r , λ 2 = v 2 c c r , λ 1 λ 2 = 1
By the definition of Equation (35) and the Mach number, it can be concluded that:
M 1 M 2 T 1 T 2 = 2 k + 1 T 0
Substituting the total temperature Equation (31) into the above formula, we can get:
M 2 = M 1 2 + 2 k 1 2 k k 1 M 1 2 1
The Mach number M2 represents the ratio of the airflow velocity to the local sound velocity in the standing shock wave, that is, the Mach number after the coordinate transformation.
From the above theory of total temperature, the shock wave process is an adiabatic process, so the total temperature before and after the wave front remains unchanged, so:
T 1 ( 1 + k 1 2 M 1 2 ) = T 2 ( 1 + k 1 2 M 2 2 )
Combining Equation (40) with Equation (41), we can obtain:
T 2 T 1 = ( 1 + k 1 2 M 1 2 ) ( 2 k k 1 M 1 2 1 ) ( k + 1 ) 2 2 ( k 1 ) M 1 2
From the general gas state equation and Equations (26) and (42), it is concluded that:
ρ 2 ρ 1 = p 2 p 1 T 1 T 2 = k + 1 2 ( M 1 2 1 + k 1 2 M 1 2 )
By the continuity Equation (10):
v 1 v 2 = ρ 2 ρ 1 = 2 + ( k 1 ) M 2 ( k + 1 ) M 2
In the continuity equation, v2 is expressed as v2 = (vsvb). Combining Equation (43) and the sound velocity formula, the expression of the accompanying velocity can be obtained:
v b = c 1 2 k + 1 M 1 M
According to the second law of thermodynamics and the definition of entropy:
d s = δ q T = d e + p · d ( 1 ρ ) T = c V · d T T + R d ( 1 ρ ) ( 1 ρ )
Integral on both sides:
s 2 s 1 = c V ln ( T 2 T 1 ) + R ln ( ρ 1 ρ 2 ) = c V ln [ ( T 2 T 1 ) ( ρ 2 ρ 1 ) k 1 ]
Substituting the shock temperature ratio Equation (42) and the density ratio Equation (43), we obtain:
s 2 s 1 = R ln [ 2 + ( k 1 ) M 1 2 ( k + 1 ) M 1 2 ] k k 1 + R ln [ 2 k M 1 2 ( k 1 ) ( k + 1 ) ] 1 k 1
M1 > 1 in the process of shock wave is substituted into the above formula:
s 2 s 1 0
Therefore, the entropy value increases after the shock wave of a coal and gas outburst, which is an irreversible process.

3.3. The Attenuation of Outburst Shock Wave Intensity

According to the ideal shock wave theory, when the shock wave source does not attenuate, the ideal gas shock wave front will not weaken with the increase of propagation distance in the process of propagation in the roadway. Even if the shock wave source can only maintain a short time, the propagation of the shock wave in the tunnel may not be affected in a short time, and the specific principle is no longer described. However, the non-attenuation of shock wave is not consistent with the traditional understanding and does not conform to the fact. In the process of real shock wave propagation, due to the influence of viscosity in the moving gas and heat conduction between the roadway, the intensity (or propagation speed) of the shock wave gradually decays, but the attenuation speed is slow [32,33]. In summary, the attenuation of shock waves in an underground ventilation system mainly depends on the bending of facilities such as anti-burst doors or the roadway itself. Some other studies say that there is a linear relationship between the attenuation of the prominent shock wave and the propagation distance of the shock wave, which is not consistent with the facts.

4. Relationship between Gas Pressure and Outburst Shock Wave Intensity

The above part is the analysis of the shock wave propagation process after the occurrence of a coal and gas outburst and does not involve the analysis of the influence of the initial gas pressure of the coal seam on the shock wave intensity. The following will be combined with the above theory for further analysis to discuss the relationship between gas pressure and shock wave formation strength.
As shown in Figure 9, the region division and pressure magnitude diagram of the shock tube at a certain time are shown. There is a left-lateral sparse wave between zone 3 and zone 4. The high-pressure coal-gas flow in zone 4 accelerates to zone 3 through expansion, and its flow is an isentropic flow. The gas flow in zone 3 and zone 4 on the same streamline conforms to the formula:
u 3 + 2 k 3 1 c 3 = u 4 + 2 k 4 1 c 4
In the formula, u3 and u4 represent the fluid flow velocity in zone 3 and zone 4, respectively, and zone 4 is the static region, so u4 = 0. k3 and k4 represent the specific heat ratio of fluid in zone 3 and zone 4, respectively. Zone 3 and zone 4 are essentially the same substance, so k3 = k4. Therefore, the above formula can be rewritten as:
u 3 + 2 k 4 1 c 3 = 2 k 4 1 c 4
The isentropic flow satisfies the following equation:
p 4 p 3 = ( c 4 c 3 ) 2 k 4 k 4 1
The contact surface of zone 2 and zone 3 meets the compatibility relationship:
u 2 = u 3 , p 2 = p 3
The pressure relationship between zone 4 and zone 1 satisfies:
p 4 p 1 = p 4 p 3 p 3 p 1 = p 4 p 3 p 2 p 1
Using the above formula can be obtained:
p 4 p 1 = 2 k 1 M 2 ( k 1 1 ) k 1 + 1 { 1 ( k 4 1 k 1 + 1 ) ( c 1 c 4 ) ( M 1 M ) } ( 2 k 4 k 4 1 )
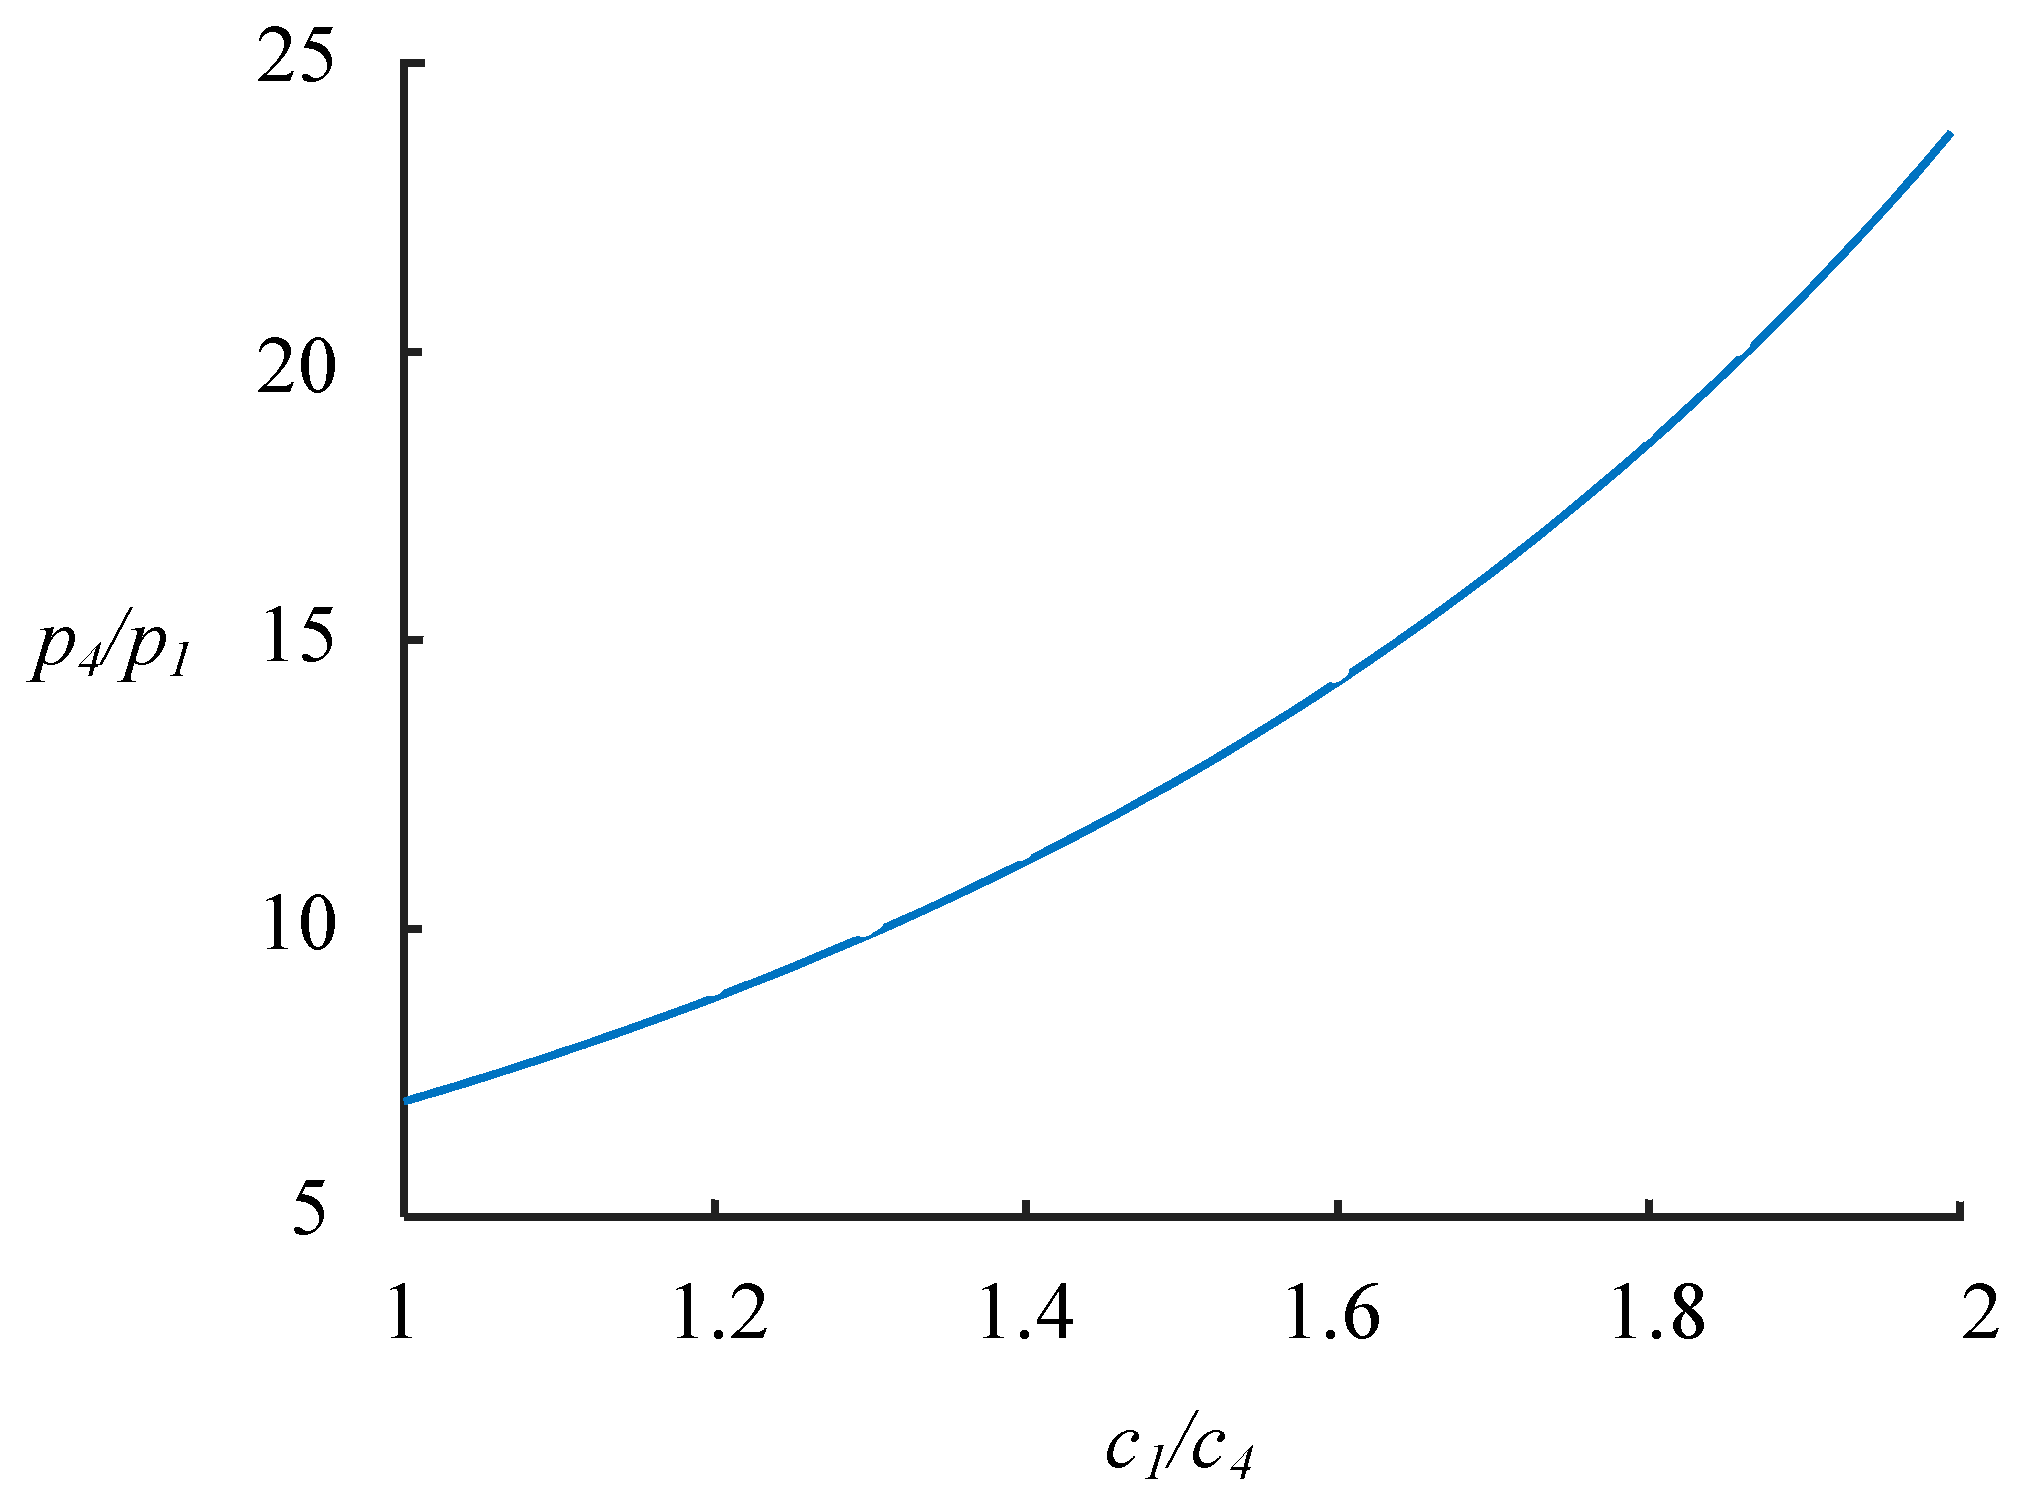
This formula represents the relationship between the pressure ratio p 4 / p 1 and the shock Mach number M (shock wave intensity). The parameters k1 and c1 in the formula are roadway air parameters, which are easy to obtain. k4 and c4 represent the equivalent specific heat ratio and equivalent sound velocity of coal-gas flow. They have no known fixed values and can only be obtained through experiments. Because there are many distribution positions of parameter k4 in Equation (55), it is difficult to unify it. Therefore, this paper sets the parameter as 1.4. The relationship between the theoretical pressure ratio p 4 / p 1 and the experimental results is calculated by changing the equivalent sound velocity. Figure 10 shows the ratio of initial gas pressure to atmospheric pressure p 4 / p 1 when the ratio of standard atmospheric sound velocity to the equivalent sound velocity of coal-gas flow c 1 / c 4 takes different values at Mach number M = 1.5. The inverse calculation of Equation (55) can directly calculate the outburst shock wave M from the initial gas pressure of the coal seam. If the initial gas pressure p4 of the coal seam and the intensity of the outburst shock wave are known, the equivalent sound velocity of the coal-gas flow under this condition can be calculated.
It can be seen from Figure 10 that the pressure ratio is very sensitive to the equivalent sound velocity of the coal-gas flow. The pressure ratio is 7 when c 1 / c 4 is the same sound velocity in zone 4 and zone 1. When c 1 / c 4 = 1 . 5 , the pressure ratio is 12.6. When c 1 / c 4 = 2 , the pressure ratio is 24.

5. Conclusions

(1)
When outburst occurs, a large amount of broken coal and gas migrates from the coal seam to the roadway under the action of ground stress and gas pressure. It can be divided into stable coal seam area, coal-gas flow area, air compression area and roadway unaffected area. The location of these zones will change with the development of the outburst, and the internal of each region is uneven. The outburst energy accumulates continuously at the interface between the air compression zone and the unaffected zone of the roadway, forming an outburst wave front, and its formation and propagation satisfies the aerodynamic theory;
(2)
Based on the shock wave theory, the shock wave of a coal and gas outburst is studied, and the theoretical model of the shock wave of a coal and gas outburst is established. The propagation velocity of an outburst shock wave is greater than the speed of sound, and much larger than the velocity of airflow. After the outburst shock wave passes through, the pressure, temperature and density of the roadway air will change suddenly. Due to the viscosity of the moving gas and the heat conduction between the roadway and other factors, the strength of the shock wave gradually decays, and the attenuation speed is slow in the straight roadway. The attenuation of a shock wave in an underground ventilation system mainly depends on the bending of facilities such as anti-burst doors or the roadway itself;
(3)
According to the shock wave theory, the expressions of outburst gas pressure and outburst shock wave intensity are derived. In order to facilitate understanding and calculation, the concept of the equivalent sound velocity of coal-gas flow is proposed. Under the condition of determined outburst intensity, the initial gas pressure is very sensitive to the equivalent sound velocity. According to the initial gas pressure and the intensity of the outburst shock wave, the equivalent sound velocity can be calculated. Or, under the condition of the known equivalent sound velocity, the intensity of the outburst shock wave can be directly calculated according to the initial gas pressure.

Author Contributions

Investigation, D.S., J.C., L.D., R.L. and Y.L.; Methodology, D.S., J.C. and L.D.; Supervision, R.L. and Y.L.; Writing—original draft, D.S., J.C. and L.D.; Writing—review and editing, D.S., J.C., L.D. and R.L; funding acquisition, D.S., J.C., and L.D. All authors have read and agreed to the published version of the manuscript.

Funding

This research was funded by the National Natural Science Foundation of China (No. 51974358, No. 52104239, No. 51774319), Natural Science Foundation of Chongqing (No. CSTB2022NSCQ-MSX1080, No. CSTB2022NSCQ-MSX0379, No. cstc2021jcyj-msxmX0564).

Data Availability Statement

The data are available from the corresponding author on reasonable request.

Acknowledgments

We also would like to thank the anonymous reviewers for their valuable comments and suggestions that lead to a substantially improved manuscript.

Conflicts of Interest

The authors declare no conflict of interest.

References

  1. Yuan, L. Deep coal and gas mining strategic thinking in China. J. China Coal Soc. 2016, 41, 1–6. [Google Scholar]
  2. Wang, K.; Du, F. Coal-gas compound dynamic disasters in China: A review. Process Saf. Environ. Prot. 2020, 133, 1–17. [Google Scholar] [CrossRef]
  3. Du, F.; Wang, K.; Zhang, X.; Xin, C.P.; Shu, L.Y.; Wang, G.D. Experimental Study of Coal-gas Outburst: Insights from Coal–Rock Structure, Gas Pressure and Adsorptivity. Nat. Resour. Res. 2020, 29, 1–13. [Google Scholar] [CrossRef]
  4. Ding, Y.; Yue, Z.Q. Outburst characteristics of CO2 gas-coal mixture with tunnel outburst simulator in deep mining. Geomech. Geophys. Geo-Energy Geo-Resour. 2022, 8, 1–23. [Google Scholar] [CrossRef]
  5. Zhang, C.L.; Wang, Y.B.; Wang, E.Y.; Zhou, X.F.; Wang, P.Z.; Zeng, W. Influence of coal seam gas pressure on the propagation mechanism of outburst two-phase flow in visual roadway. Fuel 2022, 322, 124296. [Google Scholar] [CrossRef]
  6. Zhao, X.S.; Cao, J.; Wang, B.; Yang, X.L. Experiment Study of Outburst Pulverized Coal-Gas Two-Phase Flow and Characteristic Analysis of Outburst Wave. Geofluids 2021, 2021, 8186230. [Google Scholar] [CrossRef]
  7. Savonko, C.K.; Jilin, A.A., II. Underground Air Shock Wave; Metallurgical Industry Press: Beijing, China, 1979. [Google Scholar]
  8. Zhang, J.F.; Wang, K.; Wei, C.P. Formation and Propagation of Shock Waves During Coal and Gas Outburst. J. Min. Saf. Eng. 2010, 27, 67–71. [Google Scholar]
  9. Sun, D.L.; Cao, J.; Miao, F.T.; Sun, H.T.; Zhao, X.S.; Dai, L.C.; Wang, B. Migration law of outburst coal and gas in roadway. J. China Coal Soc. 2018, 43, 2773–2779. [Google Scholar] [CrossRef]
  10. Cheng, W.Y.; Liu, X.Y.; Wang, K.J.; Li, X. Study on regulation about shock-wave-front propagating for coal and gas outburst. J. China Coal Soc. 2004, 29, 57–60. [Google Scholar]
  11. Zhang, S.Z.; Zhang, R.L. Research on Injuries Due to Shock Wave and Gas Flow from Coal and Gas Outburst. China Saf. Sci. J. 2012, 22, 62–66. [Google Scholar] [CrossRef]
  12. Tang, J.P.; Yu, N.; Chen, S. Impact of the gas pressure on the jet outburst energy of coal and gas. J. Saf. Environ. 2017, 17, 943–948. [Google Scholar] [CrossRef]
  13. Miao, F.T.; Sun, D.L.; Hu, Q.T. The formation mechanism of shock waves in the coal and gas outburst process. J. China Coal Soc. 2013, 38, 367–372. [Google Scholar] [CrossRef]
  14. Hu, W.J. Theoretical and Experimental Research for Gas-Pulverized Coal Impactive Dynamic Effect after Outburst; University of Mining and Technology: Beijing, China, 2013. [Google Scholar]
  15. Zhou, A.T.; Wang, K.; Wu, Z.Q. Propagation law of shock waves and gas flow in cross roadway caused by coal and gas outburst. Int. J. Min. Sci. Technol. 2014, 24, 23–29. [Google Scholar] [CrossRef]
  16. Zhou, A.T.; Wang, K. Airflow stabilization in airways induced by gas flows following an outburst. J. Nat. Gas Sci. Eng. 2016, 35, 720–725. [Google Scholar] [CrossRef]
  17. Zhou, A.T.; Zhang, M.; Wang, K.; Elsworth, D.; Wang, J.W.; Fan, L.P. Airflow disturbance induced by coal mine outburst shock waves: A case study of a gas outburst disaster in China. Int. J. Rock Mech. Min. Sci. 2020, 128, 104262. [Google Scholar] [CrossRef]
  18. Li, W.X. One-Dimensional Unsteady Flow and Shock Wave; National Defense Industry Press: Beijing, China, 2003. [Google Scholar]
  19. Tan, H. Physical Guidance of Experimental Shock Wave; National Defense Industry Press: Beijing, China, 2007. [Google Scholar]
  20. Cheng, B.Q. Gas Dynamics; National Defense Industry Press: Beijing, China, 2009. [Google Scholar]
  21. John, D.; Anderson, J. Fundamentals of Aerodynamics; University of Maryland: College Park, MD, USA, 2009. [Google Scholar]
  22. Wang, G.F. A Shock Tube Study of Methane Combustion Chemical Kinetics Mechanism; University of Science and Technology of China: Hefei, China, 2008. [Google Scholar]
  23. Cui, H.T.; Liu, Q.M. Dynamic calibration of shock wave pressure measurement system. Exp. Meas. Fluid Mech. 2004, 18, 92–96. [Google Scholar]
  24. Zhang, D.Y. The Application of Shock tube in Testing and Calibrating the Performance of Pressure Sensor. J. Astronaut. Metrol. Meas. 2004, 24, 24–27. [Google Scholar]
  25. Xu, L.; Sun, J.S. SPH Simulation of One-dimensional Shock Tube Problems. Chin. J. Comput. Phys. 2003, 20, 153–156. [Google Scholar] [CrossRef]
  26. Li, J.P.; Feng, H.; Jiang, Z.L.; Yu, H.R. Numerical computation on the tailored shock Mach numbers for a hydrogen-oxygen detonation shock tube. Acta Aerodyn. Sin. 2008, 112, 291–296. [Google Scholar]
  27. Davidson, D.; Hanson, R. Interpreting shock tube ignition data. Int. J. Chem. Kinet. 2004, 36, 510–523. [Google Scholar] [CrossRef]
  28. Gauthier, B.; Davidson, D.F.; Hanson, R.K. Shock tube determination of ignition delay times in full-blend and surrogate fuel mixtures. Combust. Flame 2004, 139, 300–311. [Google Scholar] [CrossRef]
  29. Duff, R.E. Shock-tube performance at low initial pressure. Phys. Fluids 1959, 2, 207–216. [Google Scholar] [CrossRef]
  30. Chen, Q. Theory and Experimental Technique of Shock Tube Flow; China University of Science and Technology Press: Hefei, China, 1979. [Google Scholar]
  31. Chen, F.; Quan, X.B.; Song, Y.P. Aerodynamic Basis; Harbin Institute of Technology Press: Harbin, China, 2015. [Google Scholar]
  32. Mirels, H. Attenuation in a Shock Tube due to Unsteady-Boundary-Layer Action; National Advisory Committee for Aeronautics Collection: Washington, DC, USA, 1957. [Google Scholar]
  33. Kitagawa, K.; Yasuhara, M.; Takayama, K. Attenuation of shock waves propagating in polyurethane foams. Shock Waves 2006, 15, 437–445. [Google Scholar] [CrossRef]
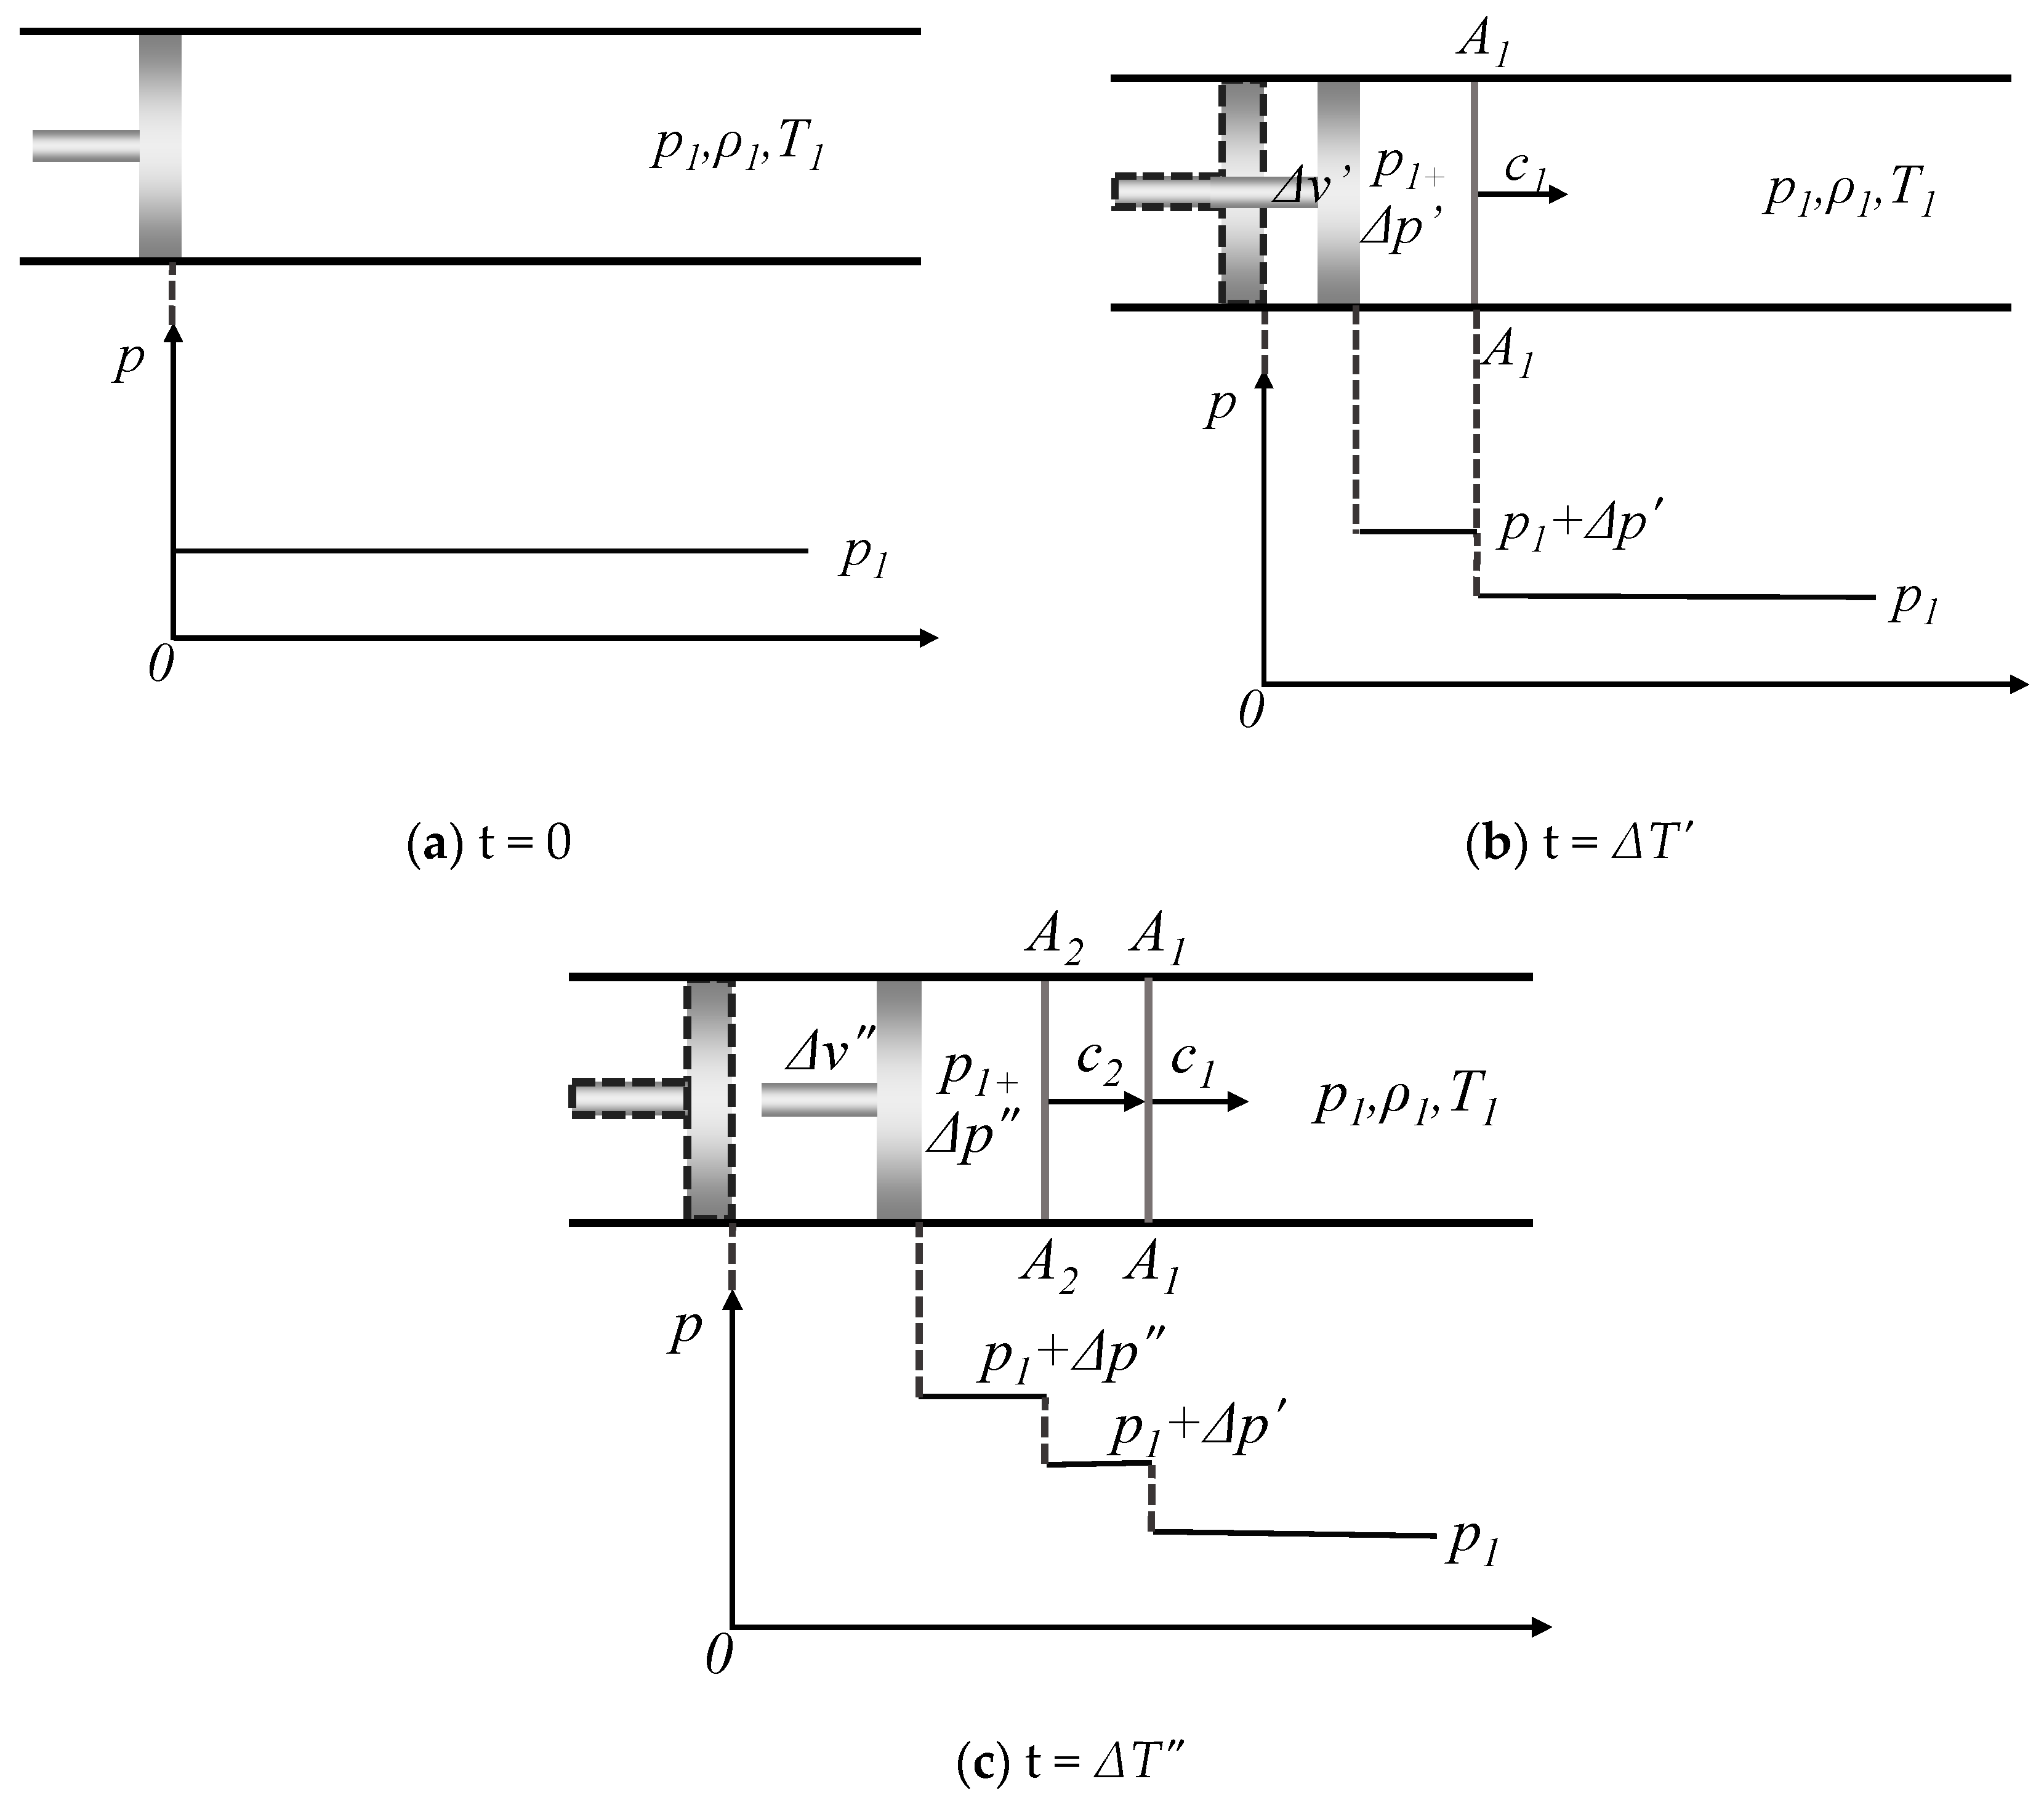
Figure 1. Schematic diagram of shock wave formation.
Processes 11 00659 g001
Figure 2. Wave front of a shockwave.
Processes 11 00659 g002
Figure 3. Schematic diagram of a coal-gas outburst.
Processes 11 00659 g003
Figure 4. Initial state of the shock tube.
Processes 11 00659 g004
Figure 5. Region division and wave system diagram in shock tube.
Processes 11 00659 g005
Figure 6. Pressure curve in shock tube.
Processes 11 00659 g006
Figure 7. Transformation of coordinate system of wave front.
Processes 11 00659 g007
Figure 8. Comparison of density changes in isentropic and shock processes.
Processes 11 00659 g008
Figure 9. Pressure distribution in shock tube.
Processes 11 00659 g009
Figure 10. The relationship between equivalent sound ratio and pressure ratio.
Processes 11 00659 g010
Disclaimer/Publisher’s Note: The statements, opinions and data contained in all publications are solely those of the individual author(s) and contributor(s) and not of MDPI and/or the editor(s). MDPI and/or the editor(s) disclaim responsibility for any injury to people or property resulting from any ideas, methods, instructions or products referred to in the content.