Article

Dynamic Parameter Simulations for a Novel Small-Scale Power-to-Ammonia Concept

1
Technical University of Darmstadt, Institute for Energy Systems and Technology, 64287 Darmstadt, Germany
2
University of Genova, Thermochemical Power Group, 16145 Genova, Italy
3
CIRCE—Research Center for Energy Resources and Consumption, 50018 Zaragoza, Spain
4
Proton Ventures B.V., 3115 Rotterdam, The Netherlands
*
Author to whom correspondence should be addressed.
Processes 2023, 11(3), 680; https://doi.org/10.3390/pr11030680
Submission received: 20 January 2023 / Revised: 11 February 2023 / Accepted: 17 February 2023 / Published: 23 February 2023
(This article belongs to the Section Energy Systems)

Abstract

:
Ammonia is a promising carbon-free energy vector, hydrogen carrier, and efficient means for long-time hydrogen storage. Power-to-ammonia-to-power concepts, powered exclusively by electricity from renewable sources, will leave the carbon economy behind and enter a truly renewable era. However, the fluctuating nature of renewables requires a good dynamic behavior of such concepts. Employing the software Aspen Plus Dynamics®, this paper investigates the dynamic behavior of a novel containerized power-to-ammonia solution to be tested at the University of Genova in 2023. Implementing a novel kinetic reaction model, the impacts of several deviations from the optimal values of the cycle parameters are investigated. The simulations provide practical guidance on how to best and safely operate the cycle. A total of ten scenarios were simulated, of which six are acceptable, two are desirable, and two should be avoided. However, all scenarios can be safely controlled by the control infrastructure.

1. Introduction

Renewable power-to-X solutions, where X represents a synthetic fuel, e.g., hydrogen, ammonia, or methanol, are a promising way to store a surplus of renewable energy chemically [1]. In times of a shortage of renewables, these fuels can be converted into electricity via thermal engines, gas turbines, and fuel cells [2,3,4,5,6,7,8,9]. Such chemical storage has the potential to offset the drawback of renewables and their fluctuation in space and time [10] and ensure the European Union’s goal of climate neutrality by 2050 [11].
Besides its use as an energy vector, ammonia is the precursor of synthetic fertilizers. A total of 70% of the CO2 emissions can be saved by 2030 in the EU if the ammonia produced for the fertilizer industry is produced from renewable energy only [12].
Power-to-ammonia (P2A) on a small scale has been suggested and tested in the past years [13,14,15,16]. However, only for large-scale traditional ammonia plants has the dynamic behavior been simulated [17,18,19], while the simulation of small P2A concepts has been less frequently [20].
The EU FLEXnCONFU project has developed a novel small-scale P2A concept that will be tested at the University of Genova, Italy, in 2023. The novel design is geared towards both flexibility and low investment cost.
Flexibility will allow the cycle to harvest the fluctuating renewables when there is a surplus of renewable energy. The system is not designed for continuous operation. Flexibility and a fast start-up are ensured by the electrical preheater and the electrical heating of the reactor. On the contrary, conventional P2A concepts employ an internal gas-gas heat exchanger [14,17,18,20,21,22,23,24,25,26,27,28,29,30,31,32,33,34,35] instead of an electrical preheater.
The low investment cost of the cycle shall first ensure a rather low market entry barrier. Second, since the process is not designed for continuous operation, economic profitability dictates that the cycle be low in investment cost, as high investment correlates with longer intervals of operation and vice versa. The low investment cost of the cycle is ensured by the use of a recycle valve instead of a second recycle compressor found in most conventional designs [17,18,20,21,22,23,24,25,26,27,28,29,36]. The main differences between the novel and the more conventional P2A systems are summarized in Table 1.
The novel cycle’s start-up, load-change, and shut-down behavior have been simulated in previous work by Koschwitz et al., 2022 [38]. Extending and building on this previous publication, this work focuses on the simulation of different dynamic scenarios deviating from a steady state point of operation determined in [39], i.e., failure events and changes in the point of operation. Similar to the previous work, the simulated cases in this work also act as preparation for the test campaigns in 2023. For safe experimentation, the simulations help to determine what to expect and how best to react when the simulated scenarios occur. In addition, the simulations also show if the implemented control structure is able to safely control all scenarios.
The simulations are conducted with the software Aspen Plus Dynamics® [40]. In total, ten dynamic scenarios were simulated: two deviations from the optimal cycle inlet molar ratio (RH2N2) of hydrogen (H2) to nitrogen (N2); a failure of both the N2 and H2 supply to the cycle; an increase and decrease, both for the pressure in the high-pressure part of the cycle and in the condenser temperature; and lastly an increase and decrease in the reactor temperature leading to two different isothermal profiles.

2. Materials and Method—System Description and Simulation Set-Up

The process diagram of the cycle, introduced by Koschwitz et al., 2022 [39], is depicted in Figure 1. The most important cycle parameters are given in Table 2.
The N2 inlet in Figure 1 is flow controlled (FC) by the H2 inlet flow. The optimum RH2N2 with regard to a maximum ammonia (NH3) production at the outlet of the cycle, stream VII, is 2.96. The inlet streams are mixed with the recycle stream XII (s. Figure 1). The pressure of 8 barg of the resulting stream I is increased to 80 barg by the cycle compressor (s. also Figure 1). The outlet pressure is controlled (PC 1). A temperature-controlled (TC 1) electrical preheater raises the temperature of the reactor feed to the required inlet temperature of the reactor.
As mentioned in the introduction, this electrical preheater is a central part of the novel P2A design. Its flexibility is much higher than that of the gas-gas heat exchangers of more conventional P2A designs [35], which use the outlet of the reactor to heat the inlet and thereby create difficult-to-control internal feedback loops.
The reactor in Figure 1 is an iron-based catalyst fixed bed tube reactor with three equally long sections of 60 cm and 10 cm in diameter, each containing 14 kg of catalyst (s. Figure 1), for which the temperature can be controlled separately (TC 2, TC 3, and TC 4). The temperature control in each section is achieved by a combination of electrical heating and air cooling. The electrical heating is for a fast start-up and shifting to higher reactor temperatures. The air cooling by free convection and, if required, aided by air ventilation is for steady-state operation and shifting to lower reactor temperatures. The optimum temperature profile with respect to maximum steady-state NH3 production is 380, 380, 350, and 340 °C for TC 1 to TC 4, as calculated by Koschwitz et al., 2022 [39].
The Haber–Bosch reaction to form ammonia in the reactor is a gaseous equilibrium reaction of H2 and N2 in a ratio of three to one to form two NH3 molecules in the presence of a solid catalyst. The equilibrium equation with negative enthalpy of reaction is shown in Equation (1) at standard conditions (25 °C and 1.01325 bar) [41].
3 H 2 ( g ) + N 2 ( g ) 2 NH 3 ( g ) ;   Δ h ¯ ° = 46.22   kJ / mol NH 3
However, since the equilibrium is only reached at infinite residence time in the reactor or infinite length of the reactor, the kinetics of the reaction has to be considered. The kinetics employed in this work is a kinetics fitted to test data provided by the catalyst supplier and valid in the range of 75–125 barg and 300–450 °C. The catalyst is a novel iron-based catalyst designed to be active at lower temperatures and pressures than conventional iron catalysts. This will enable the P2A cycle to run at lower operating conditions and costs. The kinetics is an adapted form of the Aspen Plus® Langmuir–Hinshelwood–Hougen–Watson (LLHW) kinetics given in Equation (2), where r is the catalyst mass-specific reaction kinetics in kmol/(kg s), T is the reaction temperature in K, and p H 2 , p N 2 and p N H 3 are the partial pressures of H2, N2, and NH3 in bar.
r = 0.016 kmol kg   s ( e 1.604 10488   K T bar 2.5 p H 2 1.5 p N 2 e 29.194 23235   K T bar 0.5 p H 2 1.5 p N H 3 2 ) 1 + 2 bar 1 p N H 3
The choice and development of the reaction kinetics in Equation (2) are described in detail in [39].
The 10 L condenser in Figure 1 separates the reactor products into mainly liquid NH3 in stream VII and gaseous H2, N2, and NH3 in stream VIII. The condenser liquid level is controlled (LC) via outlet stream VII. Stream VII is stored in a 30 L pressurized tank at 20 bar at ambient temperature in the liquid state. The pressurized tank is not included in Figure 1.
Stream VIII is split in an assumed molar ratio of 0.001 to 0.999 into the purge stream IX and the recycle stream XI. This rather small assumed ratio is chosen because the purge stream cannot be set to zero at the beginning of the simulation since all cycle components and streams need to be active at the start of the simulation. The purge valve, aided by the recycle valve in a cascaded control scheme (PC 2 and PC 3), controls the pressure in the condenser, i.e., in the high-pressure part of the cycle. When the purge valve opens, stream IX can exit the cycle as stream X. When the recycle valve opens, it allows stream XI to enter and, reducing the pressure to the 8 barg of the lower pressure part of the cycle, closes the recycle with stream XII exiting the recycle valve. Cascaded control, visualized by the dotted line that connects PC 2 and PC 3 in Figure 1, means that the recycle valve is opened or closed first, and only then, as a last resort, the purge valve is opened or closed to control pressure. In all, the control infrastructure consists of ten controls.
As mentioned in the introduction, the recycle valve is a central part of the novel P2A design. The investment cost of a second recycle compressor instead of the recycle valve would be about the same as the inlet compressor [37]. For the novel design, the share of the compressor in the investment cost is 20% [37]. Thus, the novel design has a significantly lower investment cost.
The dynamic behavior of the cycle is simulated in Aspen Plus Dynamics®. The main simulation parameters are listed in Table 2. HYSPR with modified parameters supplied by a project partner [42] is used as the property method (s. Table 2). For simplicity, a black-box model with a linear 0–15 kWel input, i.e., 0–100% capacity, and 0–3 Nm3 H2/h output with changes of 1 kWel/min, is used for the electrolyzer. The controls are of type PID and tuned successively using the Ziegler–Nichols method. The default settings of the solvers are used, i.e., Mixed Newton for the non-linear solver in each time step and Implicit Euler to reach the next time step.
All ten scenarios, each beginning at minute 7.5, were simulated with the cycle operating at 50% capacity, the assumed cycle point of operation for most of the time. At the start of all scenarios, the purge stream X is set to a continuous value of 0.001 mol% of the gas stream VIII from the condenser. In reality, the purge will be activated from time to time to purge accumulating impurities such as argon. This discontinuous purging, however, cannot be easily implemented in Aspen Plus Dynamics®.
In addition, the presence of impurities such as argon is neglected in the simulations. This is done because the H2 supplied from the electrolyzer has a very high purity of 99.5 ± 0.3 Vol% [43]. In addition, as depicted in Figure 1, the N2 is supplied from research-grade 99.9998 Vol% bottles [44]. Third, testing will not be long term, but short term. Thus, accumulations of impurities are expected to be negligible. However, after the tests have been conducted and the compositions of the gas streams in the cycle are known, a more elaborate simulation, including the neglected impurities, can be set up if necessary.
The initial liquid level in the condenser is set to 50%, i.e., 0.15 m.
The simulated scenarios, numbered (a) to (j), are listed and described below:
(a)
An increase in the N2 inlet, such that the value of RH2N2 is changed from 2.96 to 2, shall emulate a case of a malfunctioning FC, i.e., what happens to the cycle if too much N2 is being fed into it.
(b)
A decrease in the N2 inlet, such that the value of RH2N2 is changed from 2.96 to 4, shall emulate a case of a malfunctioning FC, i.e., what happens to the cycle if too little N2 is being fed into it.
(c)
A failure in the N2 inlet, i.e., a drop from 0.023 to 0 kmol/h within 1 min, shall emulate a sudden failure in the N2 supply or of the FC.
(d)
A failure in the H2 inlet, i.e., a drop from 0.067 to 0 kmol/h within 1 min, shall emulate a sudden failure in the H2 supply, e.g., due to an outage of the electrolyzer.
(e)
A pressure increase from 80 to 85 barg in the high-pressure part of the cycle shall determine if the cycle’s performance can be improved by higher pressure, e.g., via a compressor retrofit.
(f)
A pressure decrease from 80 to 75 barg in the high-pressure part of the cycle shall determine if the cycle’s performance is reduced as a result of the lower pressure in the reactor.
(g)
An increase in the condenser temperature from 15 to 20 °C shall investigate how a malfunctioning cooling of the condenser affects the cycle’s performance.
(h)
A decrease in the condenser temperature from 15 to 10 °C shall investigate if the cycle can be improved by a cooling system that reaches lower temperatures.
(i)
A collective increase in the reactor temperature profile from 380, 380, 350, and 340 to 400 °C shall investigate how the cycle’s performance is affected by a malfunctioning cooling of the reactor resulting in a too-high isothermal profile of the reactor.
(j)
A collective decrease in the reactor temperature profile from 380, 380, 350, and 340 to 300 °C shall investigate how the cycle’s performance is affected by a malfunctioning heating of the reactor resulting in a too-low isothermal profile of the reactor.

3. Results

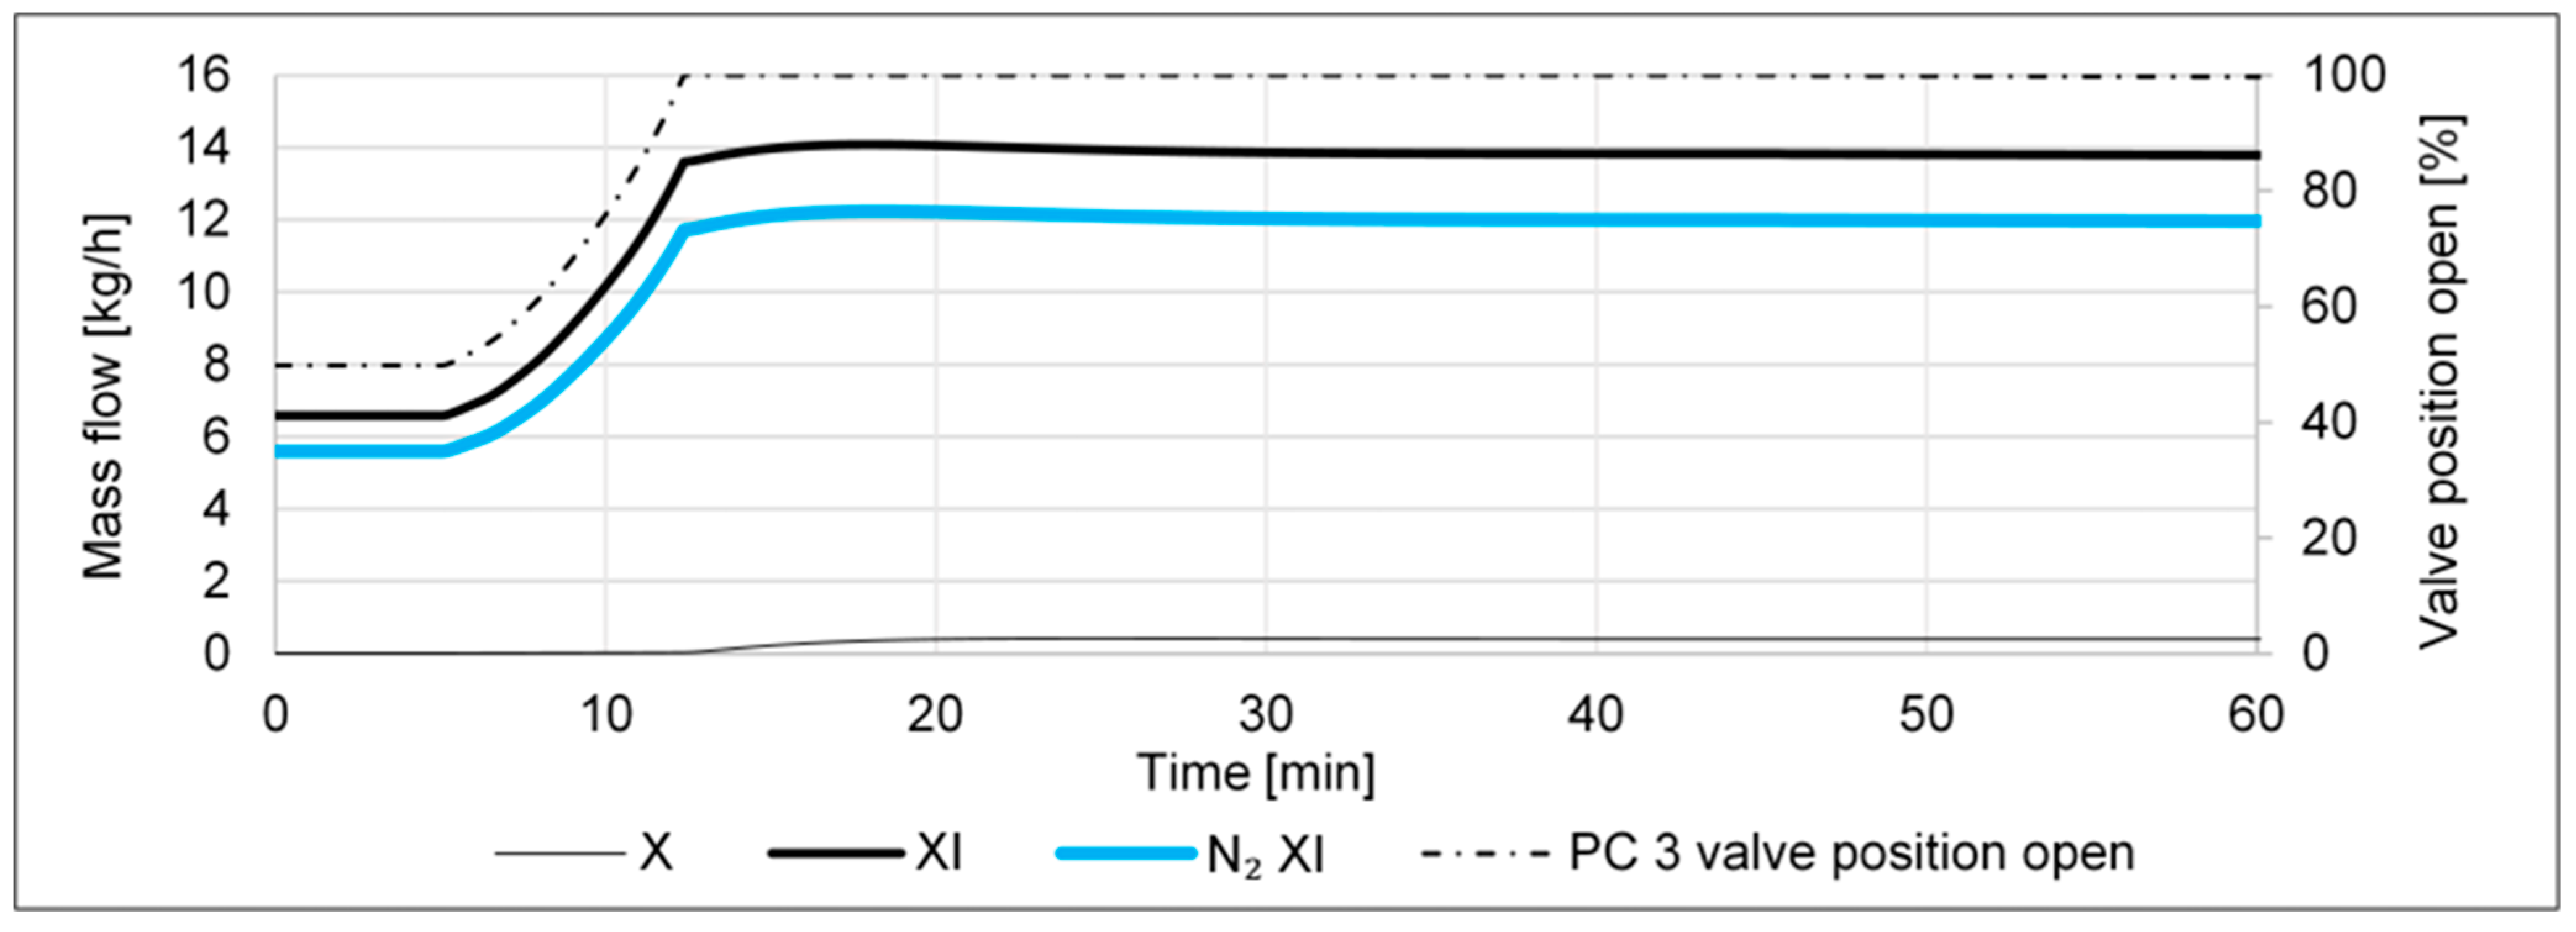
In Figure 2 and Figure 3 the results of scenario (a) are depicted. In Figure 2, the N2 inlet increases from minute 7.5 to minute 10, while the RH2N2 decreases from 2.96 to 2. At first, up to minute 12.5, the amount of NH3 that is produced in the reactor increases from section to section (s. Figure 2 streams III to VI), and the amount of NH3 leaving the cycle (s. Figure 2 stream VII) increases. Meanwhile, the H2 inlet stays constant. It can be seen in Figure 3 that these increases coincide with an increase in the recycle stream, i.e., the total recycle stream XI increases due to an increase in the recycled N2. The cycle is being filled up with N2. In order for the pressure in the high-pressure part to be kept constant, the recycle valve is opened up to 100% (s. Figure 3 right axis). After the recycle valve is at 100%, the only other way to keep the high-pressure constant is for the purge valve to open. This happens at minute 12.5, as can be seen in Figure 3 from the increase in the purge stream X. This shows that the cascaded control works, i.e., the recycle valve controls the pressure such that no material is lost and wasted through the purge at first. Only second, as a last resort to control the pressure, the purge valve opens, and material is lost through it. Once the purge stream is active, the increase in the recycle stream slows down and reaches a steady state at ca. minute 30 (s. Figure 3). At minute 12.5, i.e., when the recycle valve is 100% open and the purge is being activated, the formerly increasing NH3 mass streams in the reactor decrease as well as the NH3 leaving the system (s. Figure 2 streams III to VI and stream VII). Stream VII keeps on decreasing until it levels out to a steady state value that is below its starting value. All the streams in Figure 2 and Figure 3 reach a steady state at ca. minute 30.
To sum up, the control architecture can stabilize scenario (a), but the side effects of (i) losing material through the purge, (ii) a lower liquid NH3 production, and (iii) a doubled mass flow in the recycle, lead to a higher electric power demand of the cycle compressor.
As a consequence, an increase in the N2 inlet should be avoided in the test campaigns, and instead, the RH2N2 value of 2.96 should be maintained.
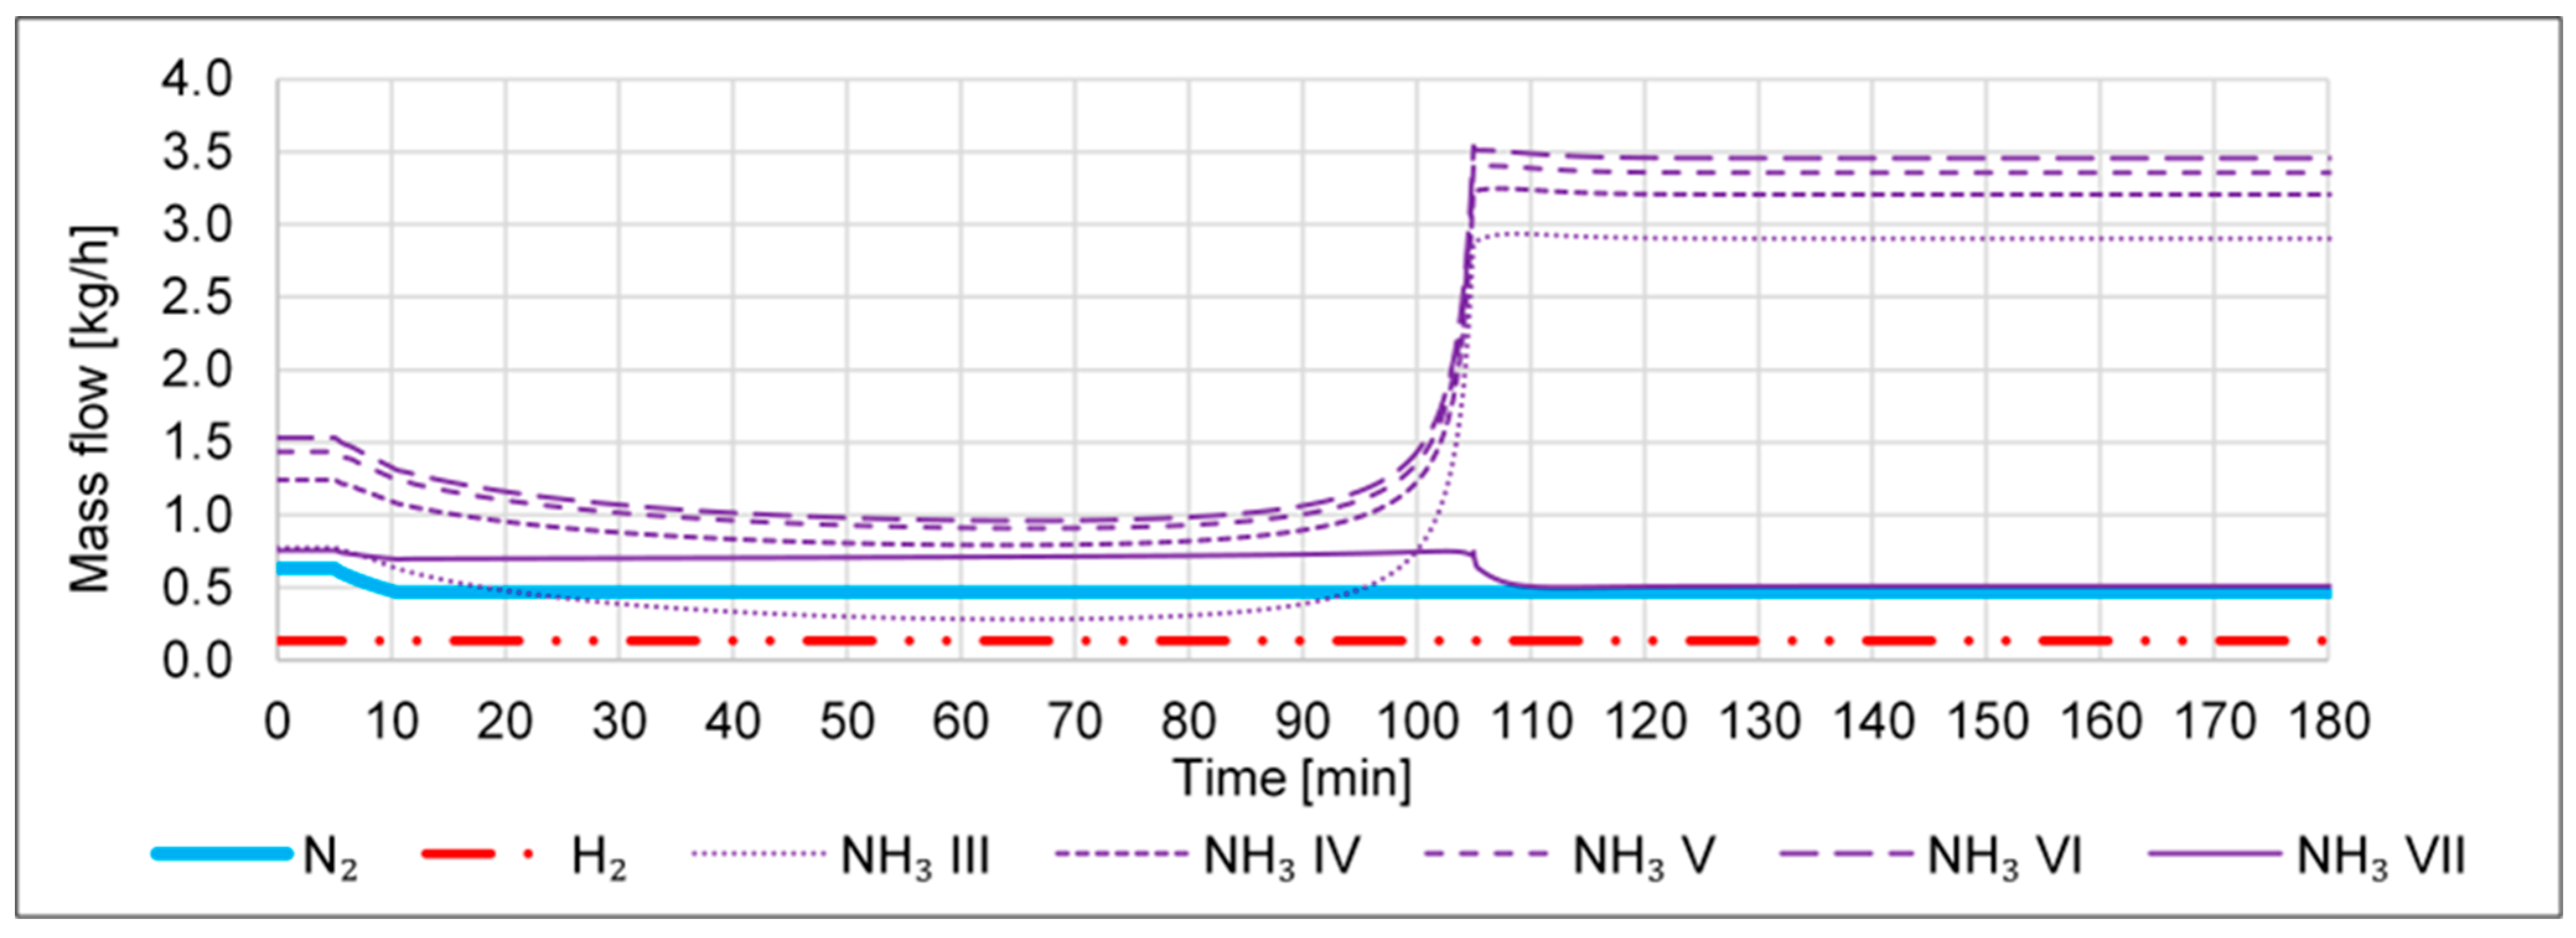
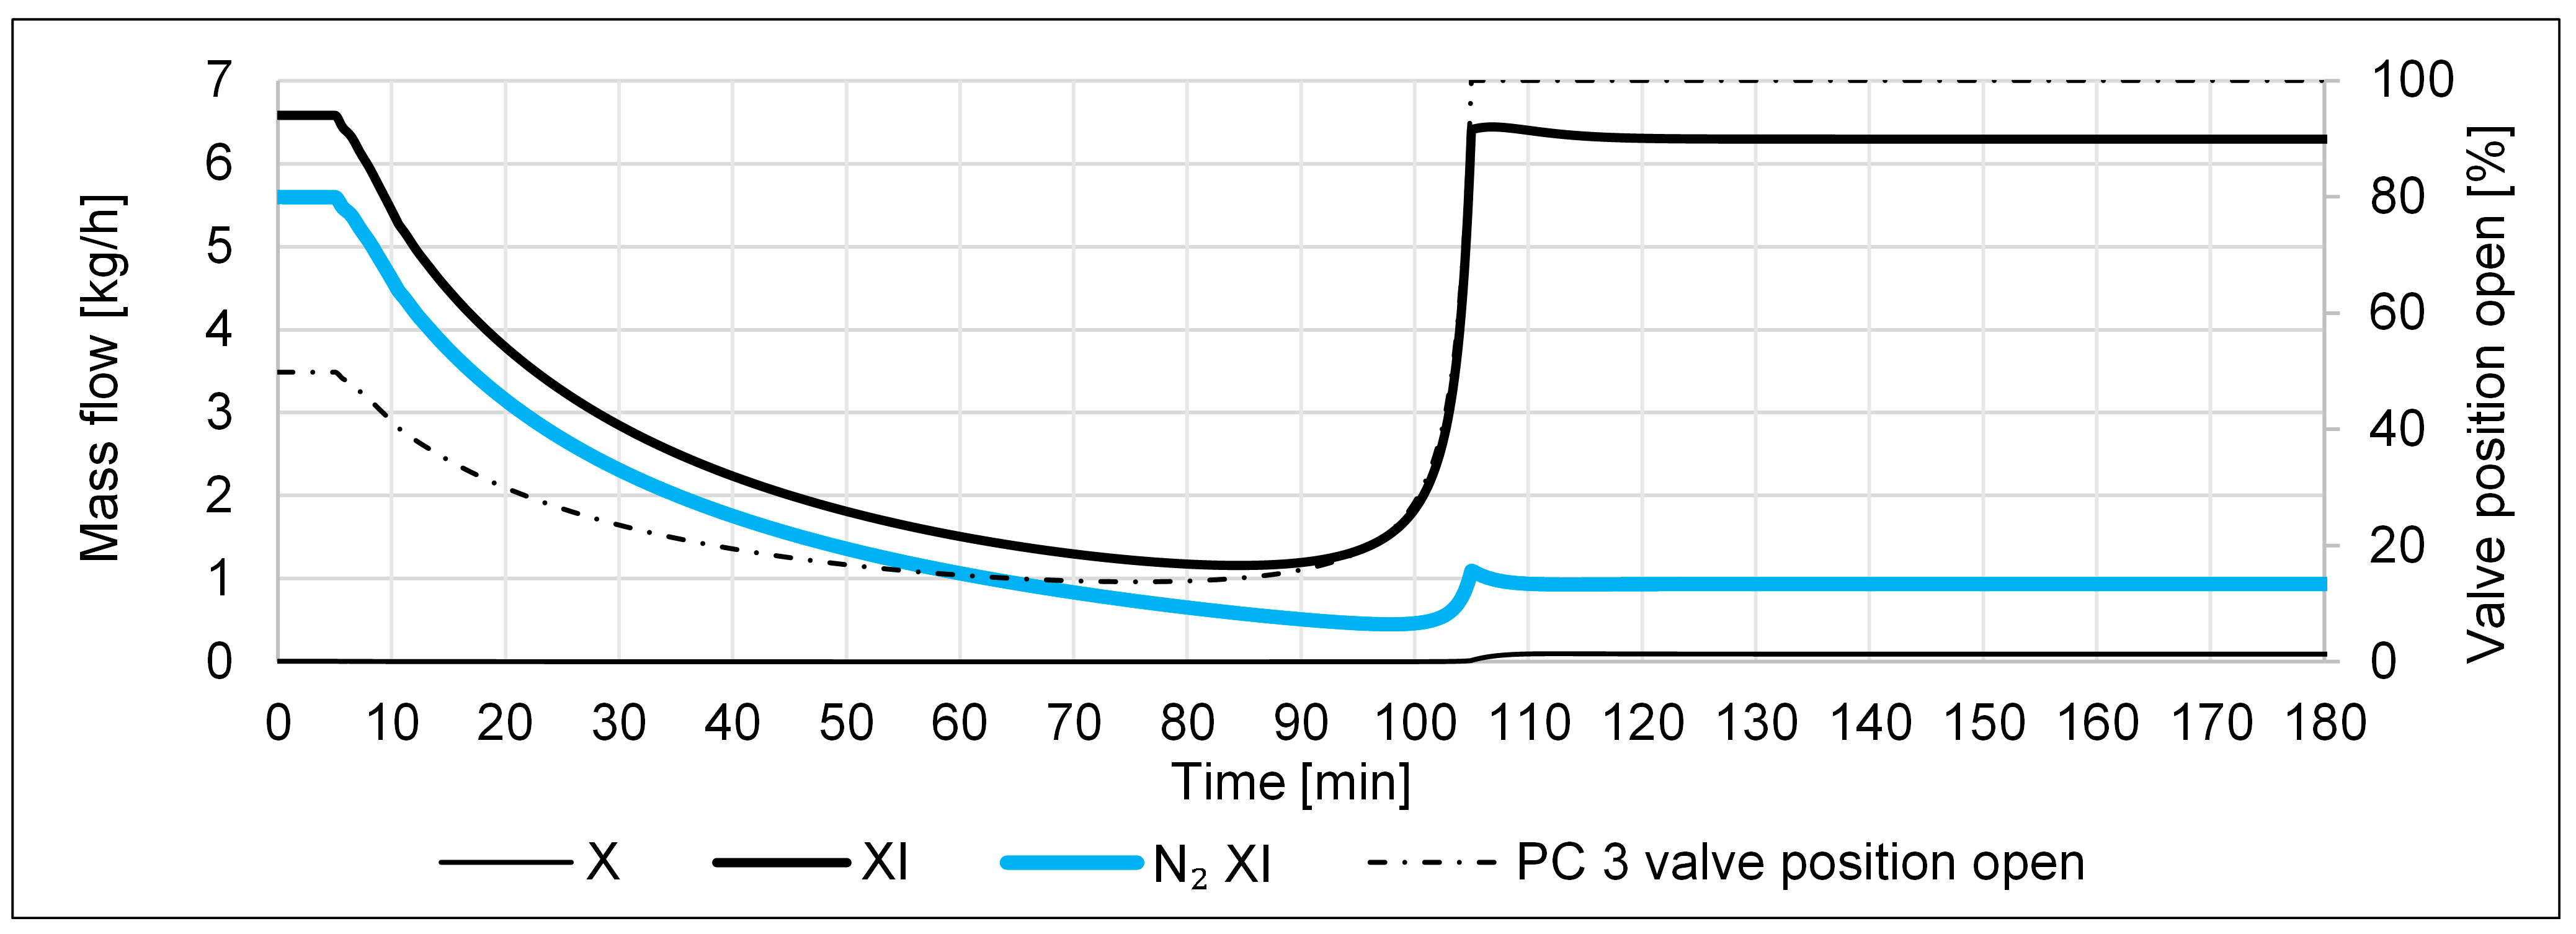
In Figure 4, Figure 5 and Figure 6, the results of scenario (b) are depicted. In Figure 4, the N2 inlet decreases from minute 7.5 to minute 10, while the RH2N2 increases from 2.96 to 4. At first, up to minute 70, the amount of NH3 that is produced in the reactor decreases from section to section (s. Figure 4 streams III to VI), and the amount of NH3 leaving the cycle (s. Figure 4 stream VII) decreases. It can be seen in Figure 5 that these decreases go along with a decrease in the recycle stream, i.e., the total recycle stream XI decreases due to a decrease in the recycled N2. The cycle is being emptied out. In order for the pressure in the high-pressure part to be kept constant, the recycle valve is closed at the same time (s. Figure 5 line PC 3 on the right axis). However, at ca. minute 70, the recycle valve is opened again and is being opened further and rather rapidly at ca. minute 100 until it is 100% open at minute 105. After the recycle valve is at 100%, the only other way to keep the high-pressure constant is for the purge valve to open. This happens at minute 105, as can be seen in Figure 5 from the increase in the purge stream X. This shows that the cascaded control also works in this scenario. Along with the opening of the recycle valve, the recycled mass streams also increase again until they both peak at minute 105 once the purge stream is active. The recycle streams start to level out and reach a steady state at ca. minute 130 (s. Figure 5). The total recycle stream reaches a value that is below but close to its starting value (s. stream XI in Figure 5), which means that in scenario (b), in terms of mass content, the cycle is first emptied out and then filled up again to where it started. However, by comparing minutes 0 and 130 in Figure 5, it can be seen that the recycle stream is losing N2 in the process. Furthermore, judging from Figure 4, the cycle is also losing NH3 at first, but as the recycle valve opens again at ca. minute 70, the NH3 in the recycle stream is increasing (s. stream III) as well as the NH3 mass streams in the reactor sections (s. streams IV to VI). However, as can also be seen in Figure 4, the amount of NH3 leaving the system, stream VII, first decreases slightly from minute 7.5 to minute 10, then stays constant until minute 105, only to decrease sharply and then level off.
The closing and opening of the recycle valve and all of the formerly described results can only be explained by looking at the molar compositions of the streams, which are depicted in Figure 6. In Figure 6, the molar shares of H2 increase while the N2 shares decrease constantly, both at the reactor inlet, the outlet of the last reactor section, and in the recycle stream (s. H2 and N2 streams III, VI, and VIII). This continues up to a point where the molar shares of H2 make up almost 90%, while the N2 shares are close to 2%. This means that compared to the start with a molar composition of about 30 and 60% for H2 and N2 for all streams in Figure 6, almost all N2 is replaced by H2 during the scenario. Regarding NH3, up to ca. minute 70, the molar concentration of NH3 at the reactor outlet is increasing, while the concentrations at the reactor inlet and in the recycle stream stay almost constant (s. NH3 streams VI, III, and VIII in Figure 6). This means that up to this point, an increase in H2 and a decrease in N2 in the cycle are favorable to NH3 conversion in the reactor. This further means that albeit the total mass stream decreases (s. stream XI in Figure 5), the NH3 leaving the system remains close to constant (s. stream VII in Figure 4). However, after ca. minute 70, too much H2 and too little N2 are present in the cycle, such that their ratio for NH3 conversion is less favorable, less NH3 is produced and the molar concentration of NH3 at the reactor outlet drops (s. stream NH3 VI in Figure 6). The higher the share of NH3 in the condenser, the more NH3 can be condensed, but as this share decreases, less NH3 condenses, and the pressure in the condenser increases. In order to prevent this, the recycle valve begins to open again, and the recycle stream increases (s. valve position and stream XI in Figure 5). As a result, the amount of NH3 that is being condensed and leaving the cycle can be maintained (s. stream VII in Figure 4), but only until the recycle valve is fully open at minute 105. Once the recycle stream is at maximum (s. stream XI in Figure 5), it cannot compensate for the less and less conversion of NH3 in the reactor (s. stream NH3 VI in Figure 6). As a result, the NH3 condensation in the condenser decreases, and in order to keep the liquid level in the condenser constant (s. LC in Figure 1), less NH3 leaves the cycle (s. stream VII in Figure 4). This would lead to an increase in the pressure in the condenser. To prevent this, the purge valve opens, and the purge stream is activated (s. stream X in Figure 5). The activation of the purge finally stabilizes the cycle, and all variables come to a new steady state at ca. minute 130 (s. streams in Figure 4, Figure 5 and Figure 6).
To sum up, in scenario (b), the controls can keep the liquid NH3 output steady for a while. During this time, however, the composition in the cycle changes from N2 to H2 being the dominant component of the system. In addition, during that time, the recycled mass flow decreases continuously, only to rise sharply again. This sharp rise happens in connection with a fast opening of the recycle valve and a fast increase in the purge stream. Such fast changes are damaging in terms of component durability and should thus be avoided. After that sudden change, the cycle returns to a new steady state, with, compared to the beginning, an almost identical recycle mass flow but a lower liquid NH3 output and a mass flow that is lost through the purge.
Consequently, a decrease in the N2 inlet should be avoided in the test campaigns, and instead, the RH2N2 value of 2.96 should be maintained.
In addition, comparing scenarios (a) and (b), scenario (a) retains a higher liquid NH3 production but at the cost of a higher recycle flux to be compressed by the cycle compressor and thus increasing the power demand of the cycle. Furthermore, the cooling demand in the condenser also increases with an increase in the recycle flow. On top of that, scenario (b) displays a lower loss through the purge. Therefore, it is hard to decide whether an increase or a decrease in N2 influx is worse for cycle performance.
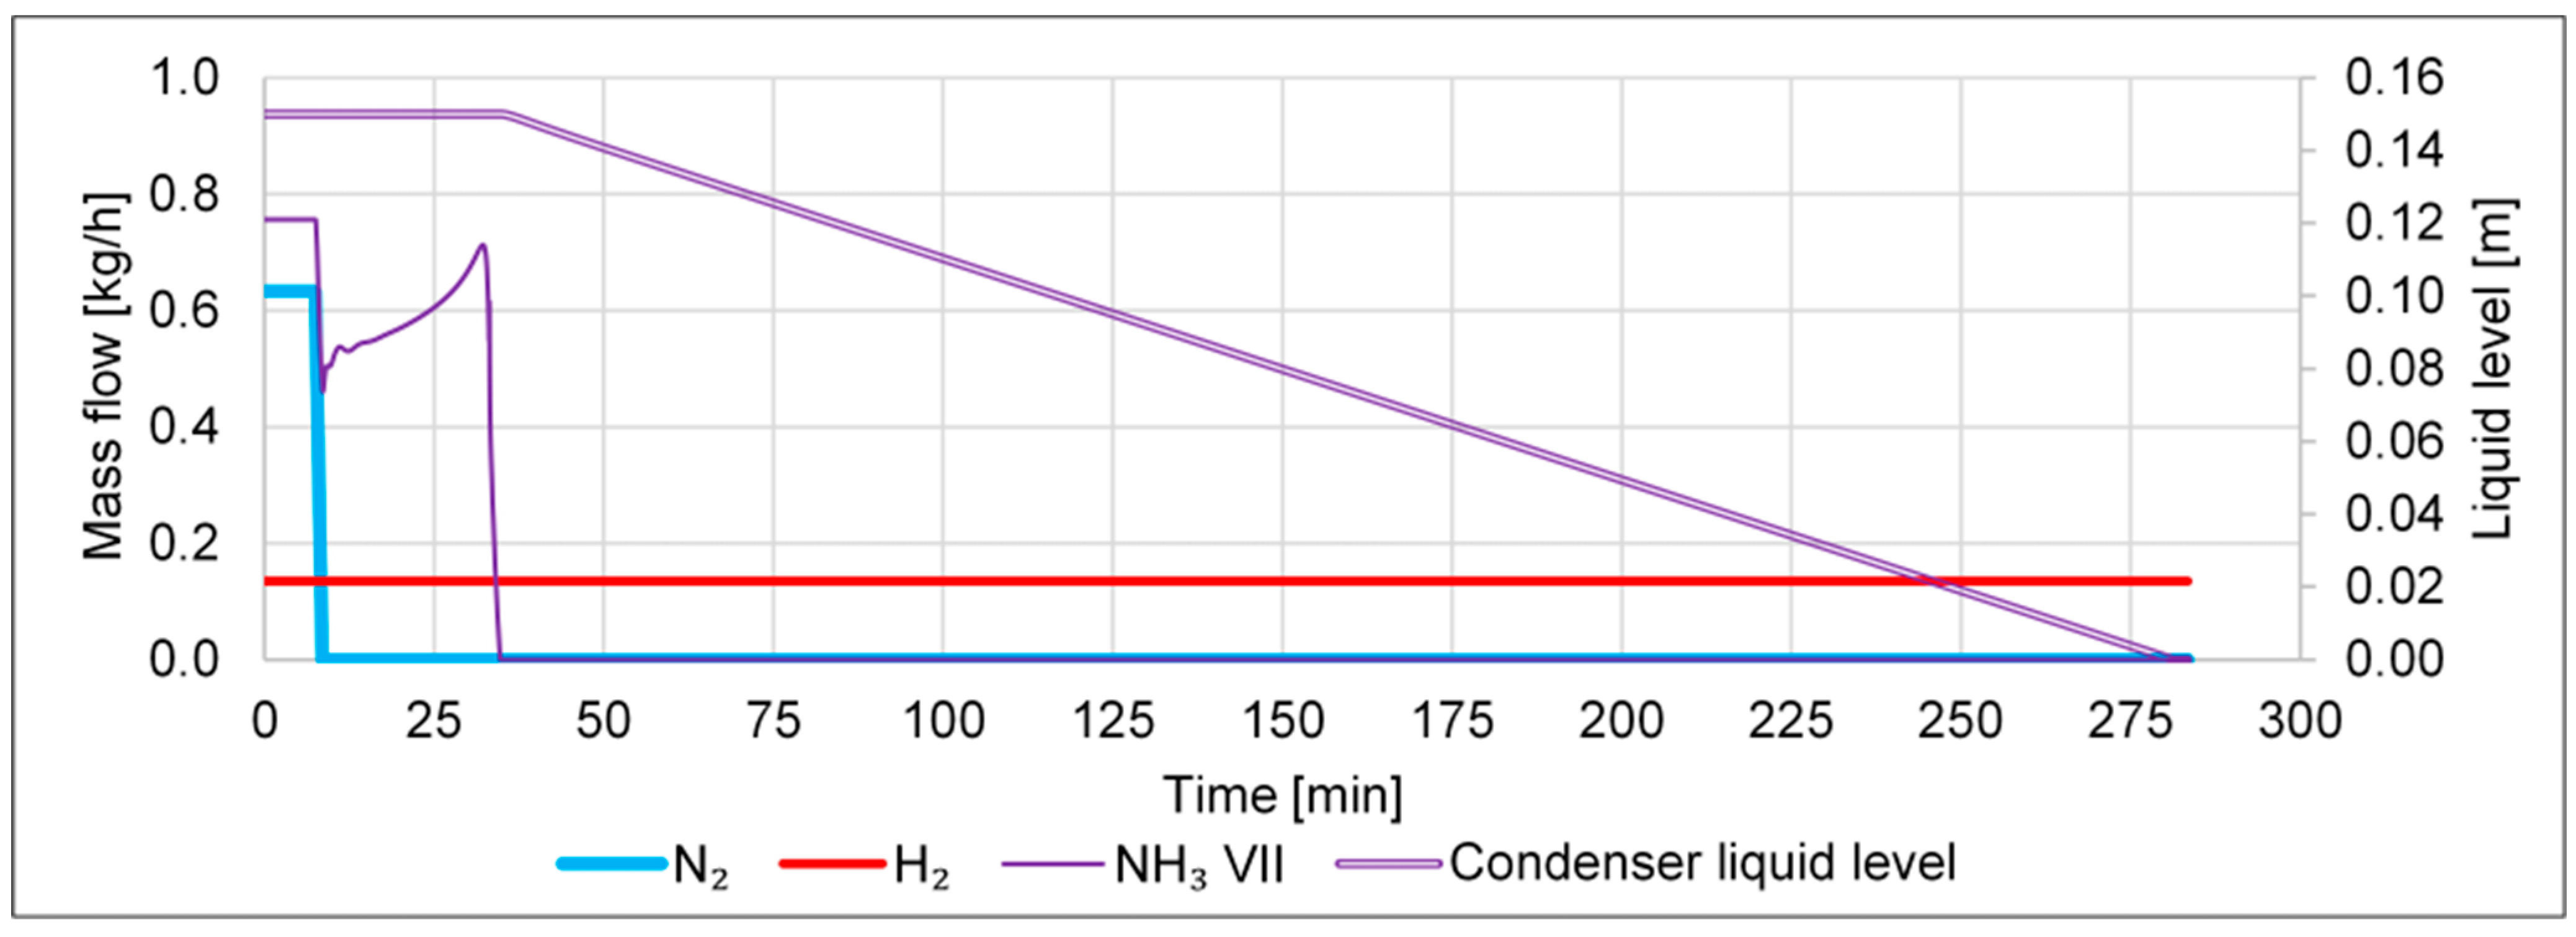
Scenario (c) is depicted in Figure 7 and Figure 8. In Figure 7, it can be seen that with the drop in the N2 supply, the NH3 outlet stream VII also drops, then recovers for a short while as the N2 in the system is being used up (see the drop in the recycle stream N2 XI in Figure 8). The pressure in the high-pressure part is maintained by the closure of the recycle valve (s. valve position in Figure 8). At ca. minute 30, not enough N2 is left in the system for continued NH3 conversion. The H2 and NH3 in the cycle accumulate, leading to an increase in pressure in the high-pressure part of the cycle, resulting in the recycle valve being opened again (s. valve position in Figure 8). Once the valve is completely open, the purge line opens at minute 33 (s. stream X in Figure 8). From then on, the recycled mass stream stabilizes (s. stream XI in Figure 8). This happens because no more NH3 leaves the system via stream VII (s. stream NH3 VII in Figure 7). Instead, the condenser loses NH3 in the vapor state, and consequently, the liquid level of NH3 decreases in the condenser (s. condenser liquid level on the right axis in Figure 7). The vaporized NH3 mainly enters the recycle stream. A smaller part is lost in the purge. At minute 280, the condenser does not contain any liquid NH3 anymore, and the simulation fails, as the condenser has to contain two phases for a working simulation. However, in reality, the cycle would continue to operate, but all the inlet H2 would be purged, and no liquid NH3 would be produced.
To sum up the case of a stop of the N2 supply of scenario (c), the system first enters a stable state, constantly losing liquid NH3 in the condenser, which is vaporized and partly lost in the purge. This stable state ends after approximately 4.5 h when the condenser contains no liquid NH3 anymore. The simulation fails at this point due to the requirement of two phases being present in the condenser but lacking the liquid phase. In reality, the process would continue, with the undesired state of a complete loss of the inlet H2 through the purge, gas being recycled with no purpose, and no liquid NH3 leaving the cycle.
For the test campaigns, this means that a short-term stop in the N2 inlet does not have any major ramifications, as some NH3 continues to be produced. However, a long-term stop in the N2 inlet means that the cycle has to be shut down, as the condenser is being emptied out, no more NH3 is being produced, and H2 is being wasted.
Scenario (d) is depicted in Figure 9 and Figure 10. In Figure 9, it can be seen that with the drop in the H2 supply, the NH3 outlet stream VII also drops. The H2 in the system is being used up (see the drop in H2 mole fractions in Figure 10) to a point at ca. minute 20, where no NH3 is produced anymore, and the entire mole fractions stay constant (s. Figure 10). Similar to scenario (c), in this scenario, the liquid NH3 in the condenser starts to evaporate, and the liquid level drops (s. Figure 9 right axis condenser liquid level). At minute 340, 60 min later than in scenario (c), no liquid NH3 is left in the condenser, and the simulation ends. However, in the real plant, the cycle would also, in this case, continue to operate, with all the N2 entering the cycle being purged and no liquid NH3 leaving the cycle.
To sum up the case of a stop of the H2 supply of scenario (d), the system first enters a stable state, constantly losing liquid NH3 in the condenser, which is vaporized and partly purged. This state continues for approximately 5.6 h until the condenser contains no liquid NH3 anymore. However, compared to scenario (c), the cycle loses less liquid NH3 per time and is thus a more favorable scenario. In addition, the H2 supplied via electrolysis is more costly than the N2. However, both should never be wasted and lost in the purge.
The results of scenario (d) have the same consequence for the test campaigns as the results of scenario (c). A short-term stop in the H2 inlet is acceptable if reversed quickly. A long-term stop means that the plant has to be shut down.
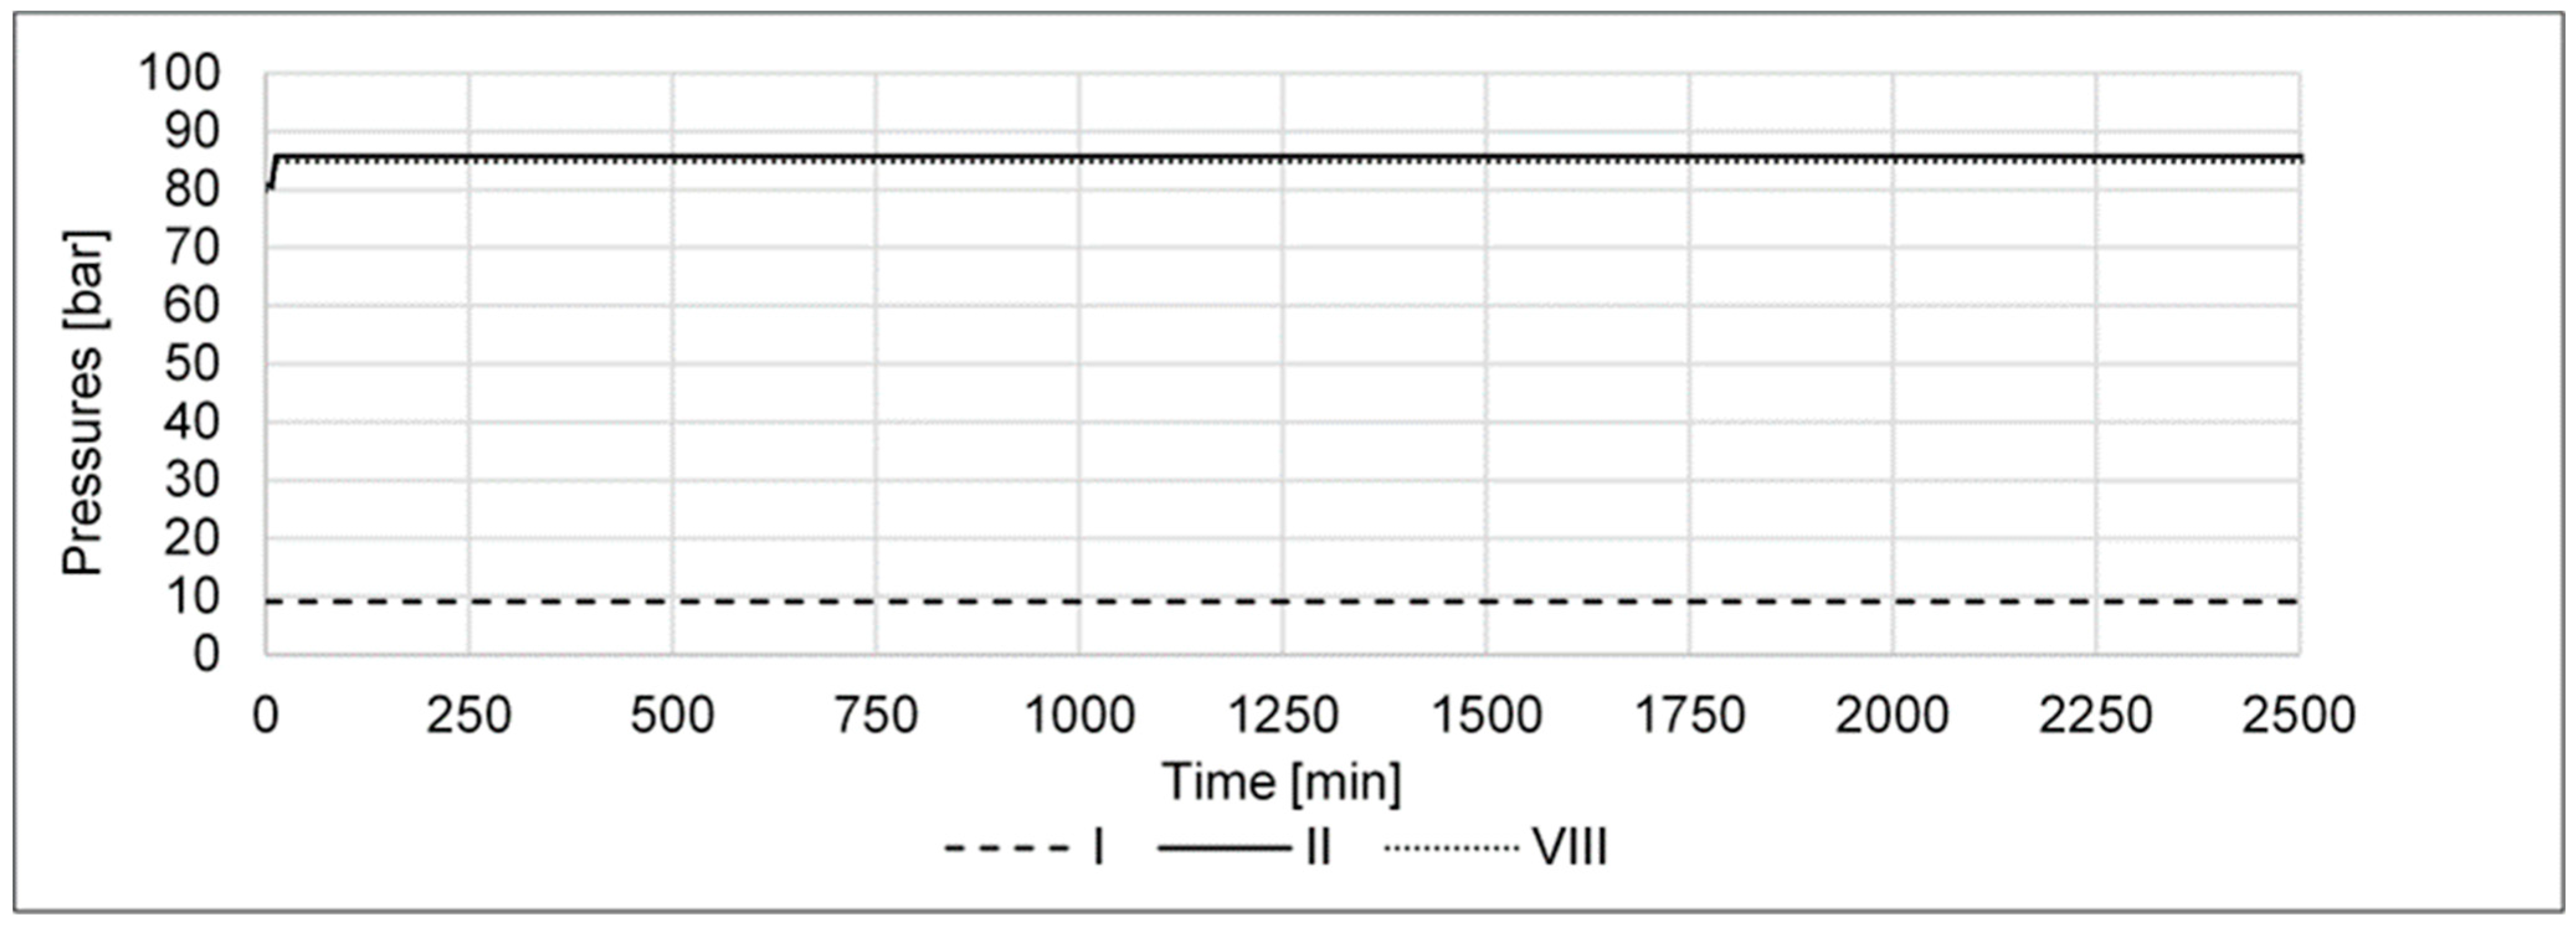
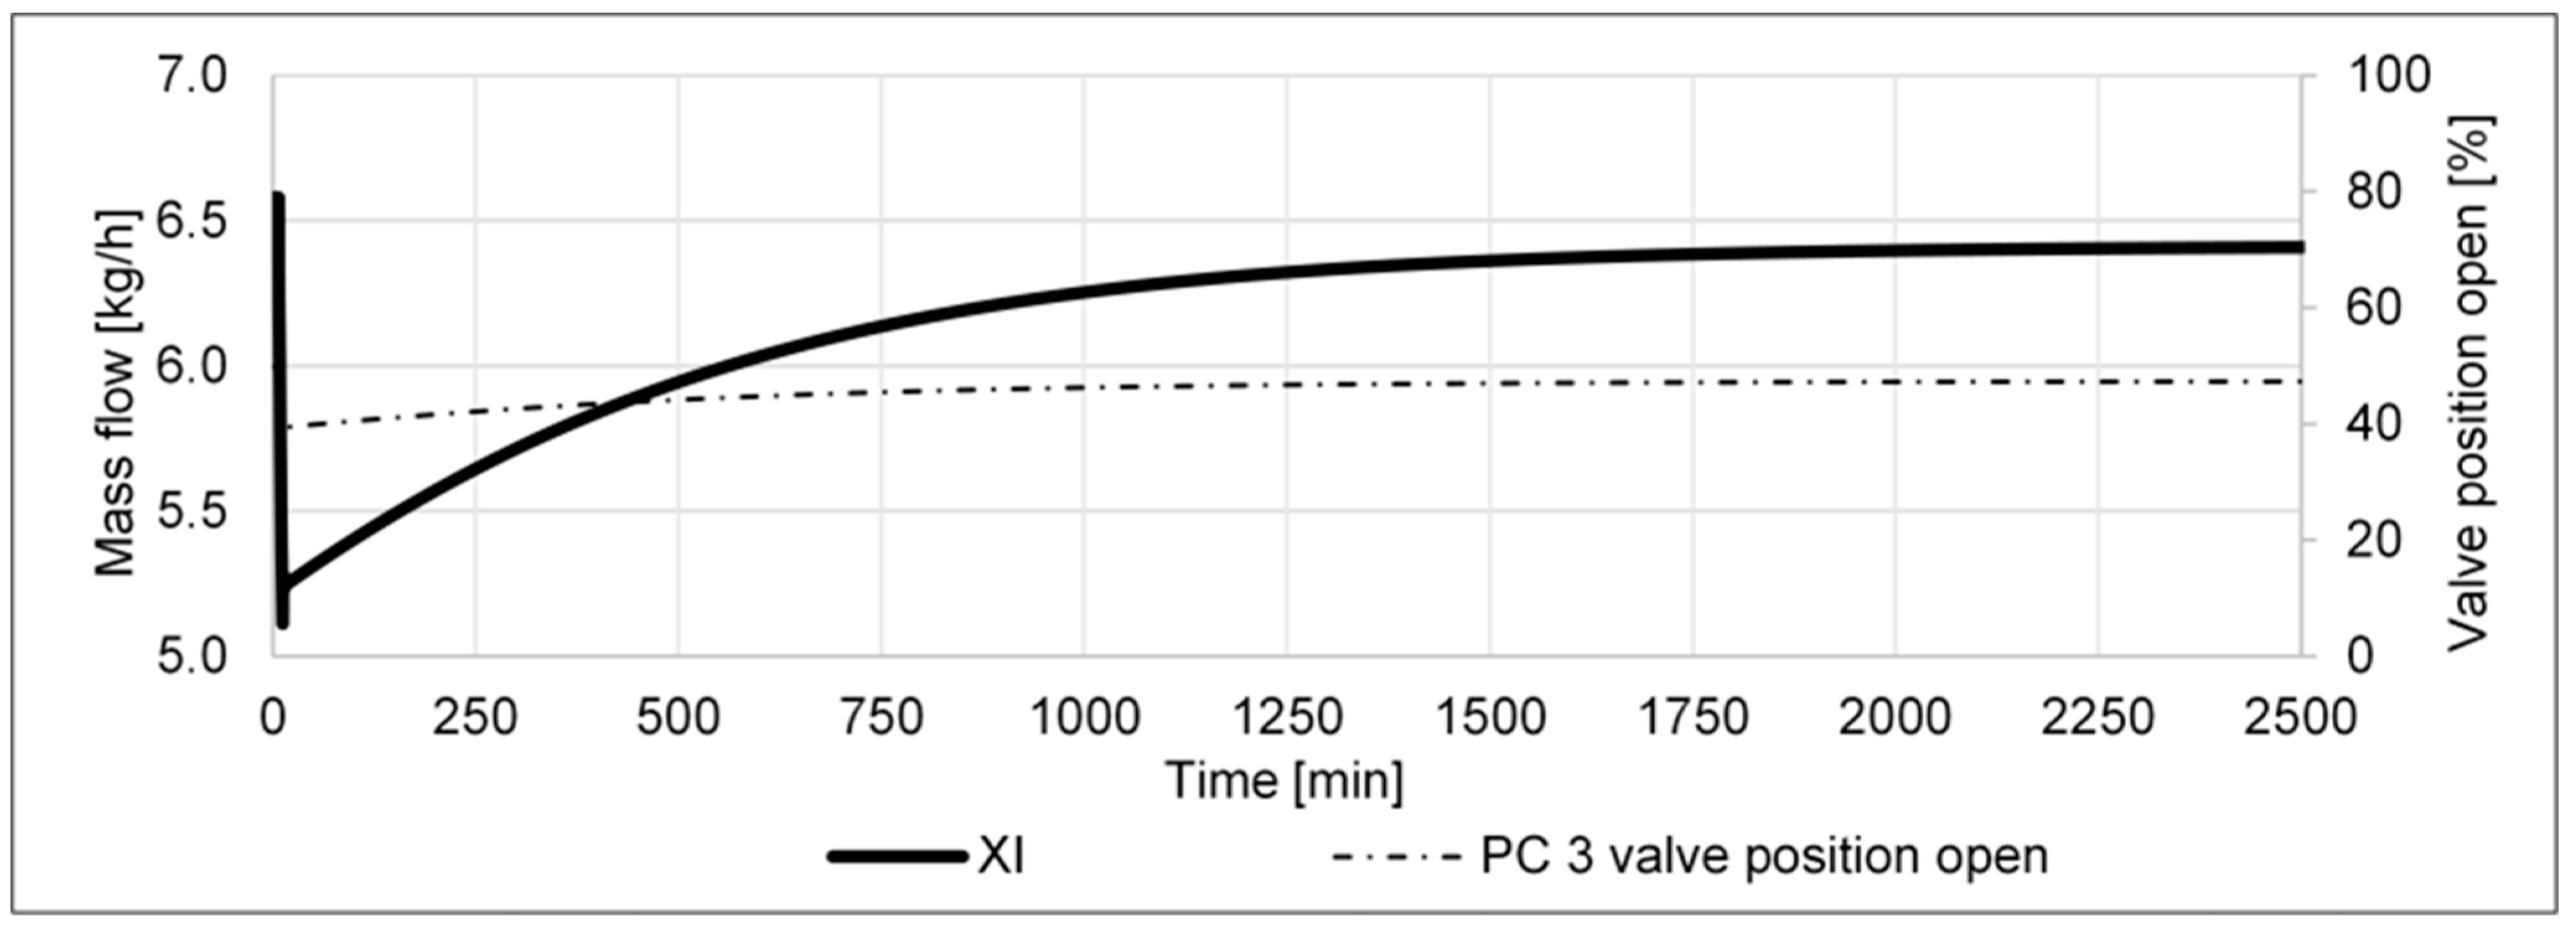
The results of scenario (e) are depicted in Figure 11, Figure 12 and Figure 13. In Figure 11, the pressure increase in the high-pressure part of the cycle is displayed. The reason for the maximum time of 2500 min, i.e., 1.7 days, can be seen in Figure 12, as the system takes that long to reach a steady state again. The recycled mass stream drops from 6.6 kg/h to 4.1 kg/h only to increase slowly to reach a value of 5.9 kg/h (s. stream XI in Figure 12). Likewise, the recycle valve closes from 50 to 30 only to open again to a value of 42% (s. right axis recycle valve position in Figure 12). The slow response and high response time of the recycle valve hint at the fact that the control of the recycle valve can be optimized with regard to a faster response. However, Figure 12 mainly shows that an increase in the high pressure reduces the recycled mass stream. Furthermore, this reduction comes along with an increase in the liquid NH3 that leaves the cycle and with a reduction in the mass stream that is purged (s. Figure 13 for the mass percentage changes of these two streams, left axis NH3 VII and right axis purge X).
To sum up, an increase in the high pressure of scenario (e) is desired, as it increases the liquid NH3 that leaves the cycle and, at the same time, reduces the mass that is lost through the purge. However, the recycle valve control parameters should be improved regarding a minimized response time.
For the test campaigns, this means that the compressor should be operated at maximum outlet pressure at all times to maximize NH3 production.
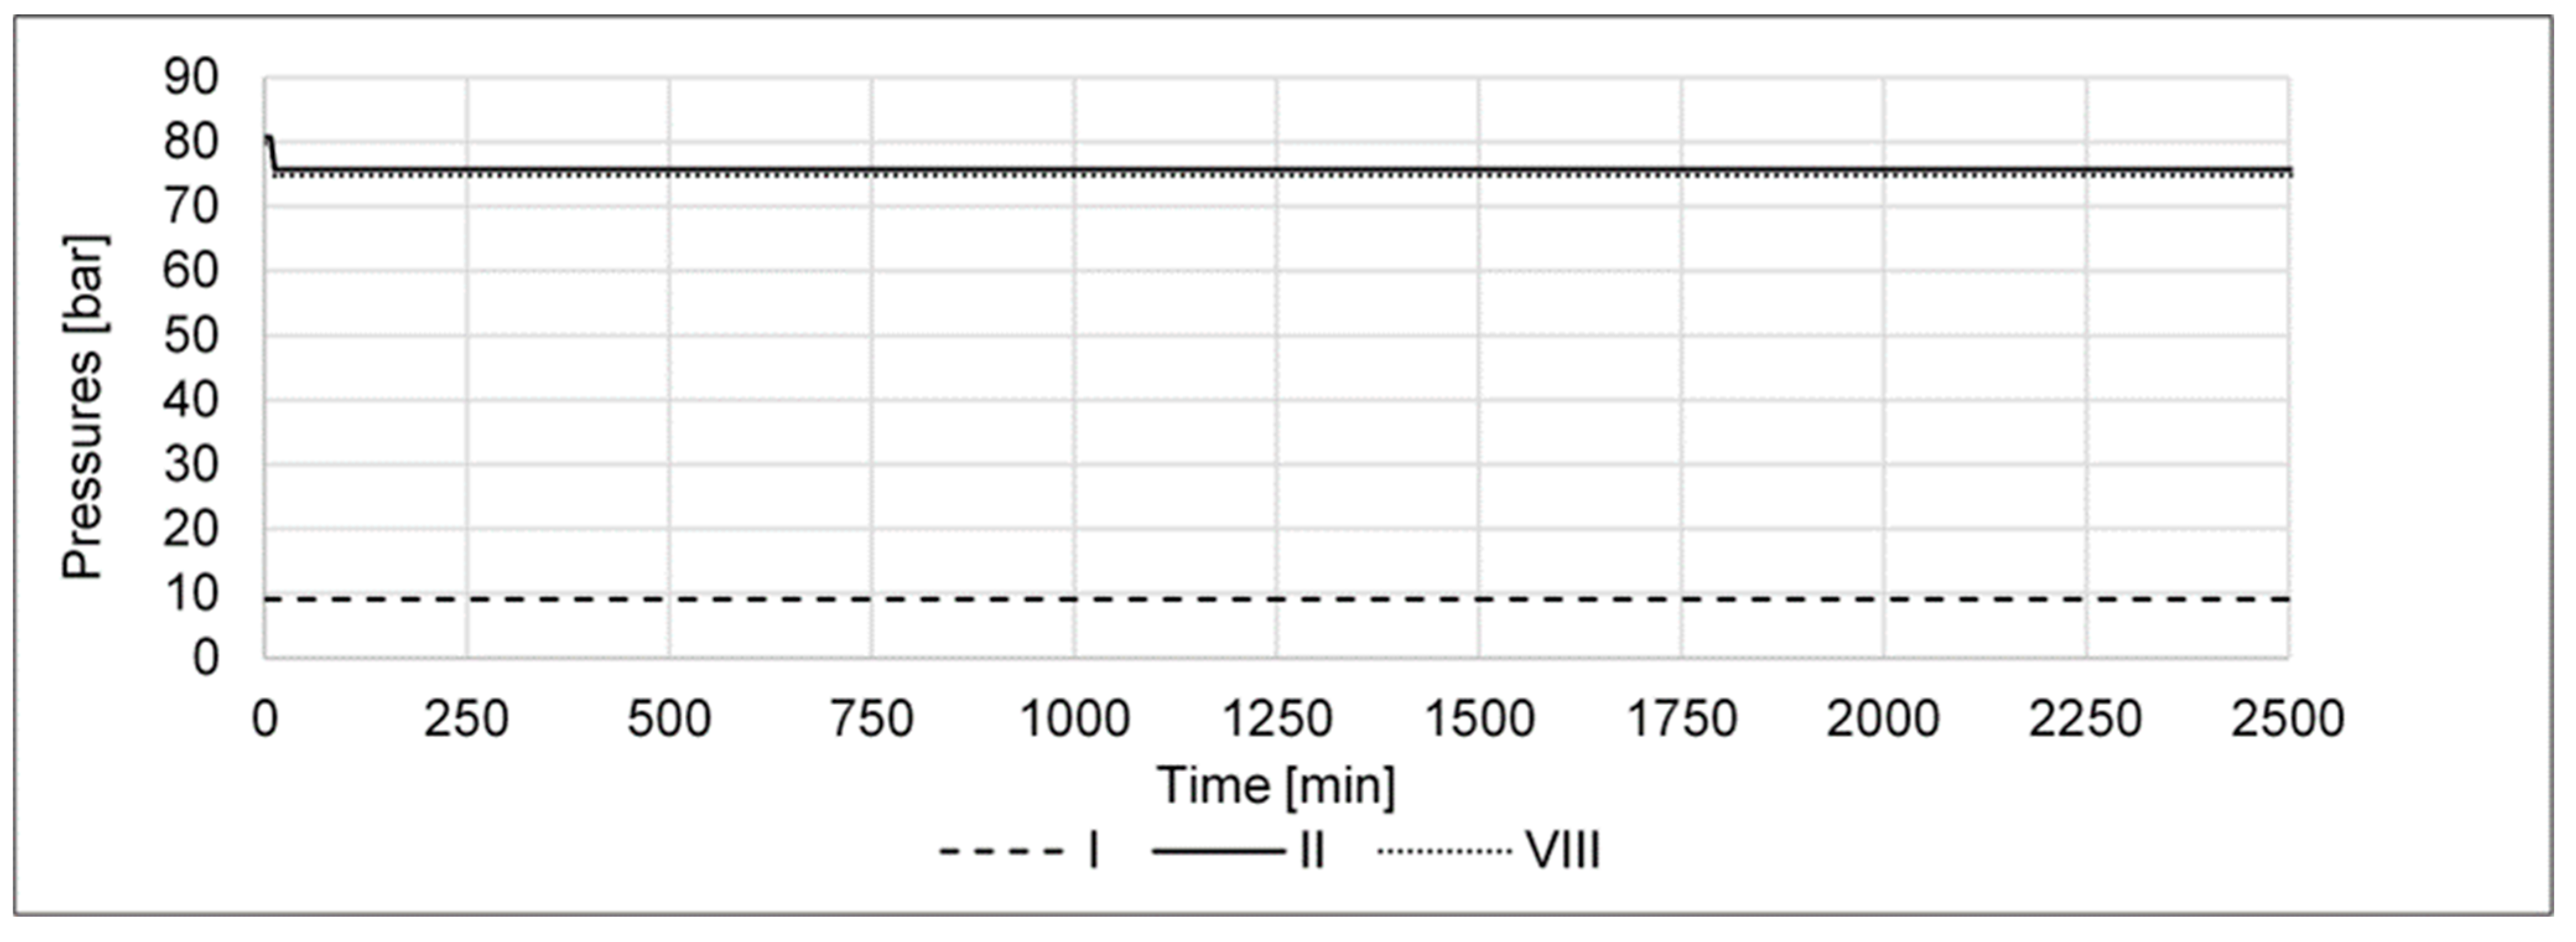
The results of scenario (f) are depicted in Figure 14, Figure 15 and Figure 16. In Figure 14, the pressure decrease in the high-pressure part of the cycle is displayed. The reason for the maximum time of 2.500 min, i.e., 1.7 days, here as well can be seen in Figure 15, as the system takes that long to reach a steady state again. The recycled mass stream rises from 6.6 kg/h to 12.2 kg/h only to decrease slowly to reach a stable value of 5.4 kg/h (s. Figure 15 stream XI). Accordingly, the recycle valve opens from 50 to 98, only to close again to a value of 45.1% (s. Figure 15 right axis recycle valve position). Similar to scenario (e), the slow response time of the recycle valve here also hints at the fact that the control parameters of the recycle valve can be optimized with regard to a faster response. However, Figure 15 mainly shows that a decrease in the high pressure reduces the recycled mass stream here, too. Different from scenario (e), the recycle valve cannot control the high pressure on its own. The purge valve is opened as well, resulting in an increase in the purge stream (s. Figure 16 right axis stream X). Furthermore, the amount of liquid NH3 that leaves the cycle is reduced (s. Figure 16 stream VII).
To sum up scenario (f), a decrease in the high pressure is undesired, as it decreases the liquid NH3 output that leaves the cycle and, at the same time, increases the mass that is lost through the purge. On top of that, the slow response time of the recycle valve control implies here as well, that its control parameters should be improved.
For the test campaign, scenario (f) has the same implication as scenario (e), i.e., the compressor should always be operated at maximum pressure.
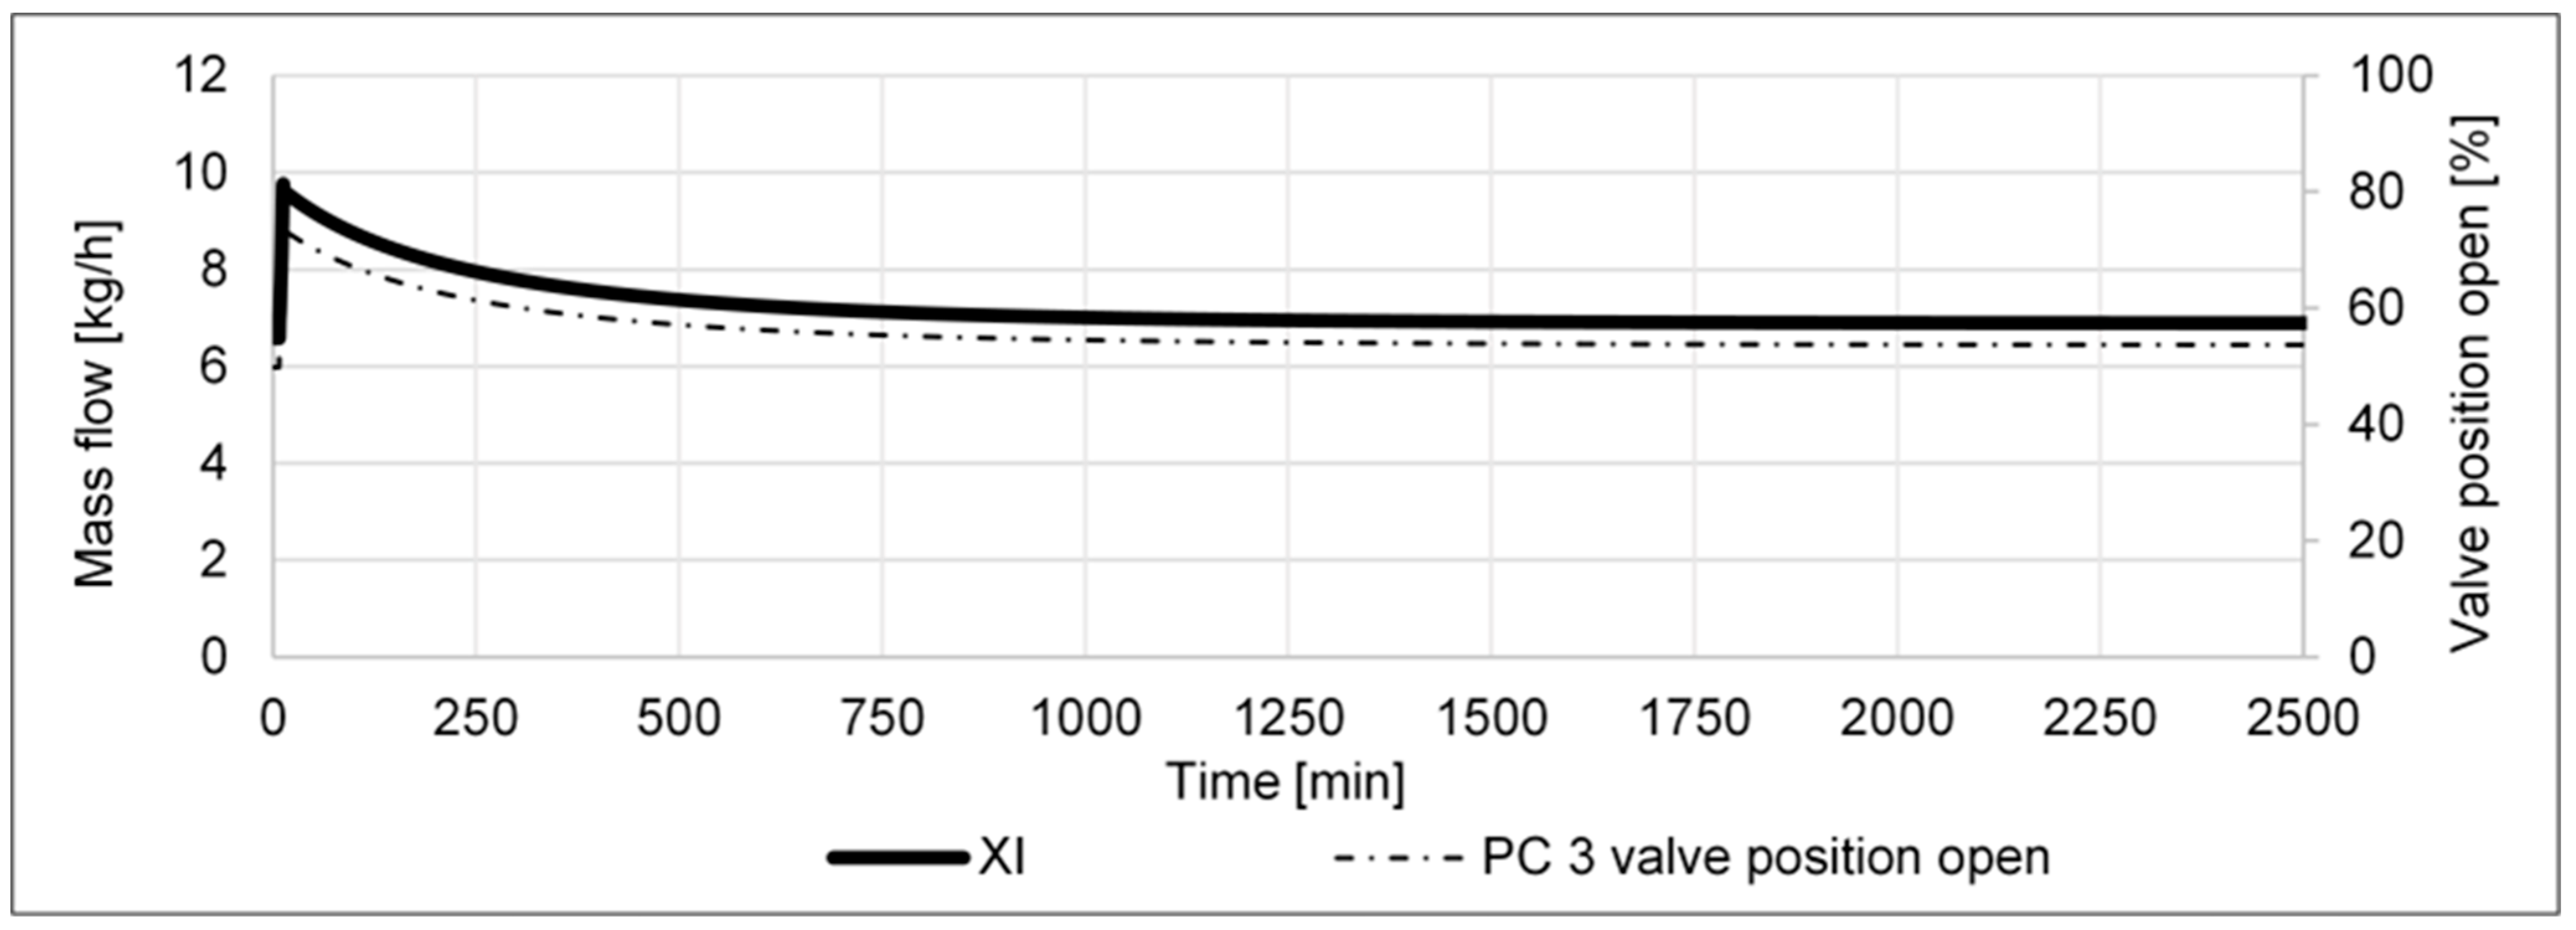
The results of scenario (g) are shown in Figure 17, Figure 18 and Figure 19. In Figure 17, the constant condenser liquid level (left vertical axis), as well as the condenser temperature increase (right vertical axis), are displayed. The constant liquid level value shows that the LC (s. Figure 1) works despite a change in the condenser temperature. In this scenario as well, the reason for the maximum time of 2500 min, i.e., 1.7 days, can be seen in Figure 18, as the system takes that long to reach a new steady state. The recycled mass stream rises from 6.6 to 9.8 only to decrease slowly to reach a value of 6.9 kg/h (s. Figure 18 stream XI). Correspondingly, the recycle valve opens from 50 to 74.5 only to close again to a value of 53.7% (s. Figure 18 recycle valve position right axis). The slow response of the recycle valve here also leads to the assumption that the recycle valve control parameters can be optimized. From Figure 19, it can be seen that an increase in the condenser temperature leads to both a decrease in liquid NH3 output (s. percentage change of stream NH3 VII) and an increase in the purge stream (s. percentage change of stream X right axis). Both effects are undesired.
To sum up, in scenario (g), an increase in the condenser temperature has a similar impact as the pressure decrease in scenario (f), i.e., a decrease in liquid NH3 output and an increase in the mass lost through the purge. Therefore, scenario (g) has to be prevented as well. In general, it can be said that all scenarios that come with an increase in the recycle mass flow, i.e., scenarios (a) and (g), raise the power input of the compressor and the condenser and are thus undesired.
For the test campaigns, scenario (g) shows that the condenser temperature should not be increased. There will be different cooling utilities, i.e., air, water, and chilled water, available at the test site. All these utilities will be used to try to keep the targeted condenser temperature at 15 °C.
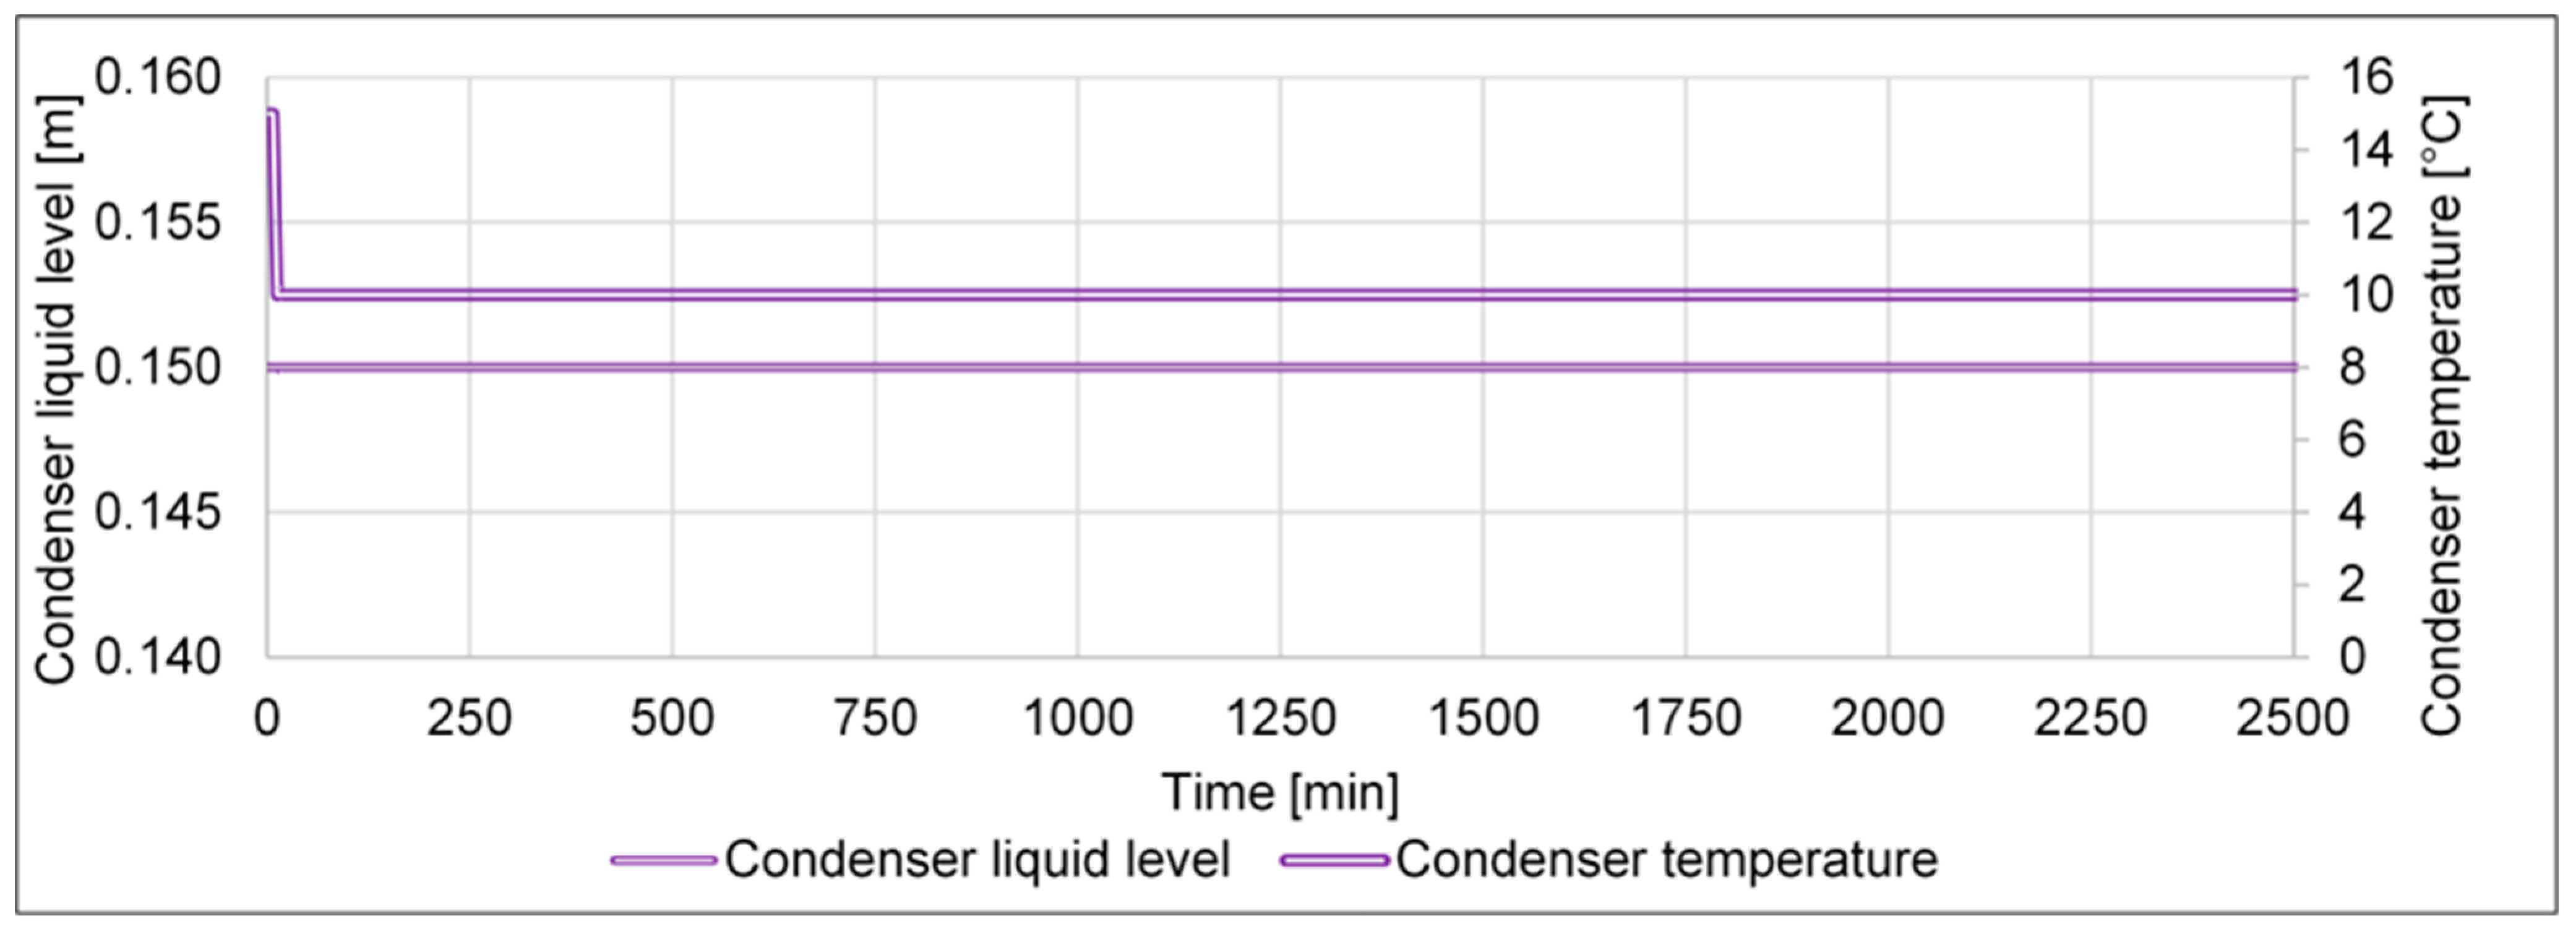
The results of scenario (h) are depicted in Figure 20, Figure 21 and Figure 22. In Figure 20, the constant condenser liquid level (left vertical axis), as well as the condenser temperature decrease (right vertical axis), are displayed. The constant liquid level value, similar to scenario (g), also shows that the LC works despite a change in the condenser temperature. As can be seen in Figure 21, the material in the cycle (s. stream XI) first decreases rapidly and then slowly increases to a value of 6.4 kg/h, 0.2 kg/h less than at the start of the scenario. This means that in contrast to scenario (g), the mass in the system decreases, and this comes along with an increase in liquid NH3 output and a reduction in the mass that is lost in the purge (s. Figure 22 left and right vertical axis, streams NH3 VII and X).
Summarizing scenario (h), a decrease in the condenser temperature has the same desired impacts as the high-pressure increase in scenario (e), namely an increase in the liquid NH3 stream leaving the cycle as well as a reduction in the mass that is being lost via the purge.
Consequently, in the test campaigns, the available cooling utilities will not only be used to keep the targeted condenser temperature at 15 °C but will also be used to try and further reduce the condenser temperature in order to increase the NH3 output.
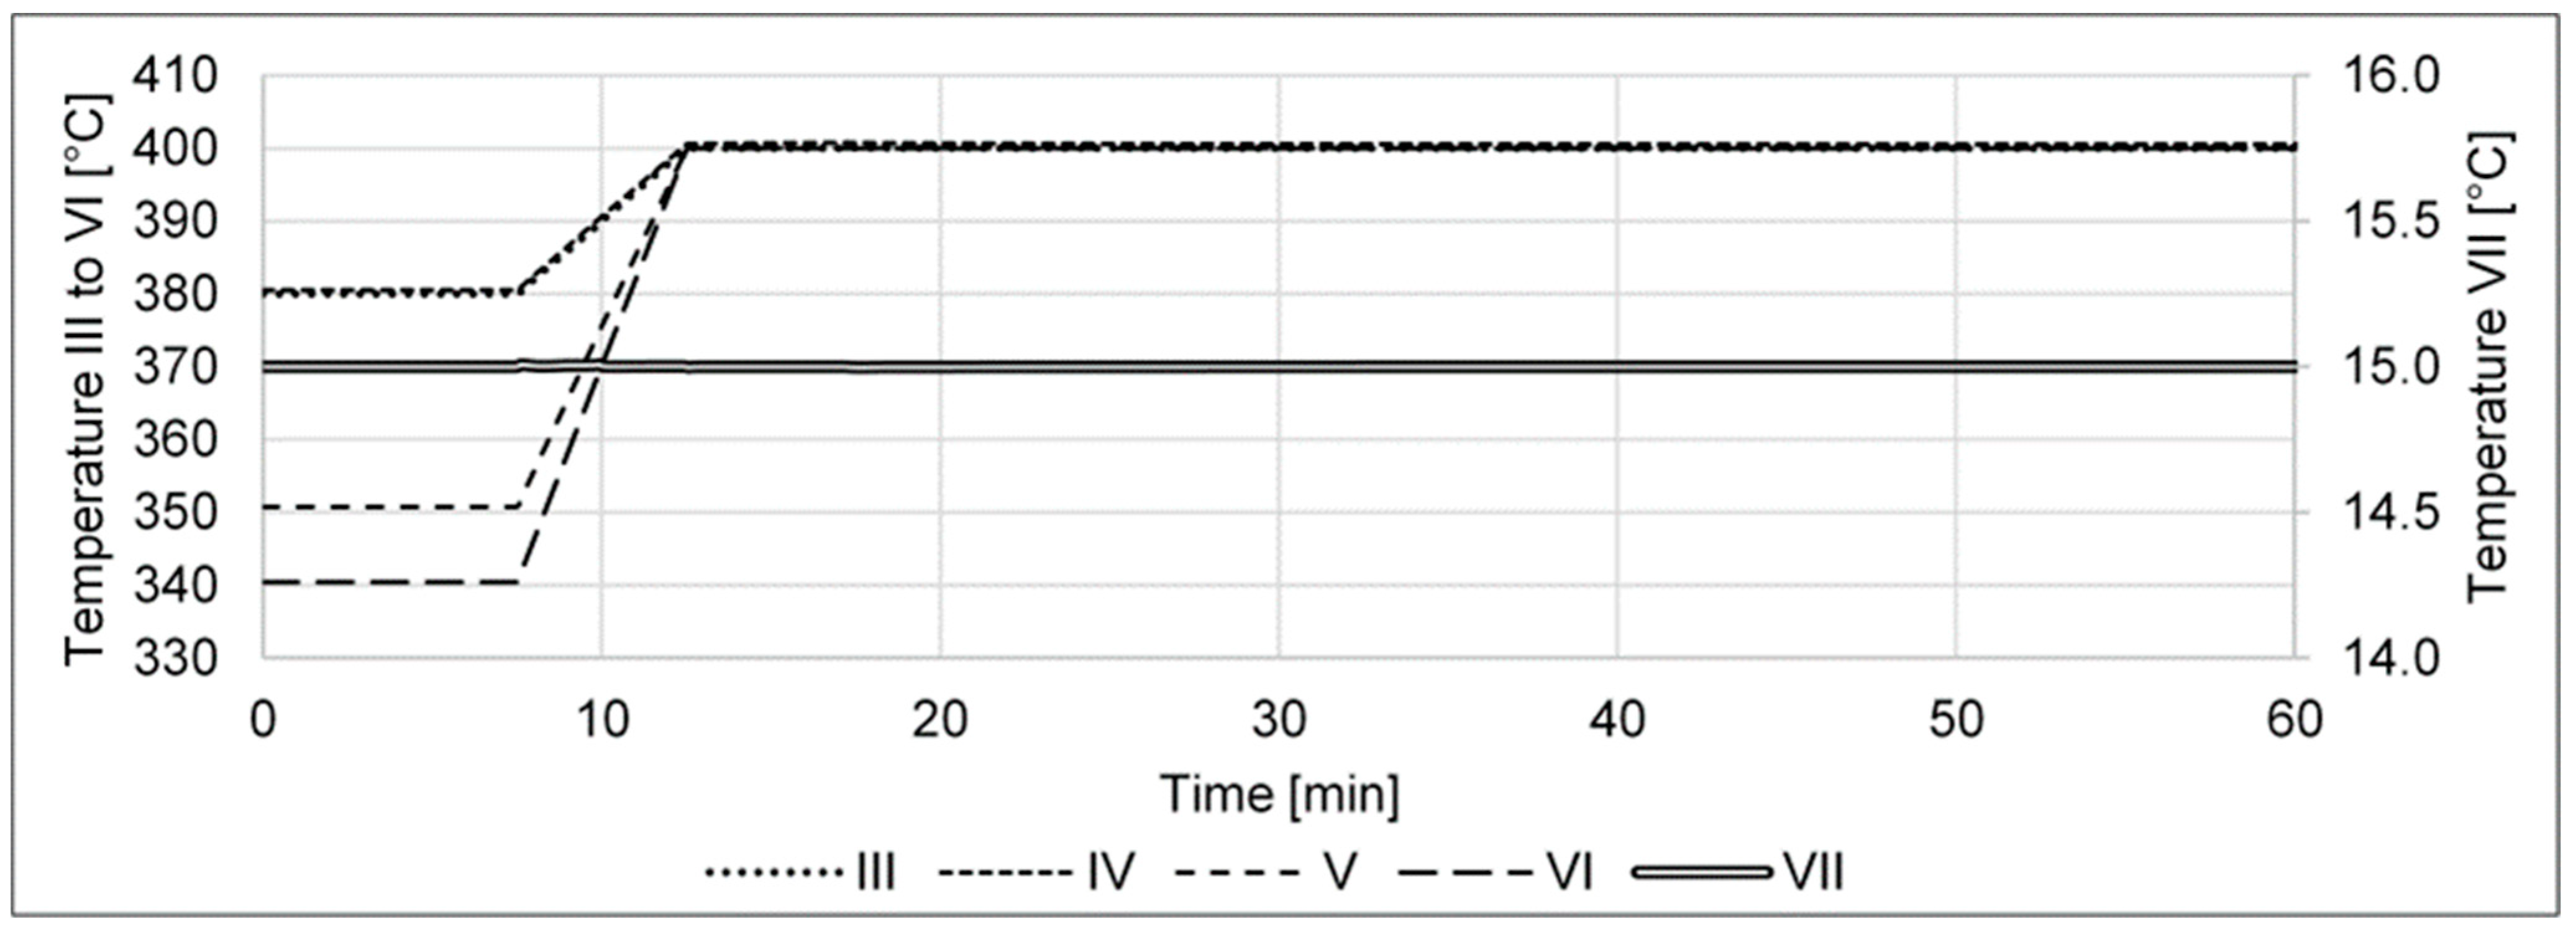
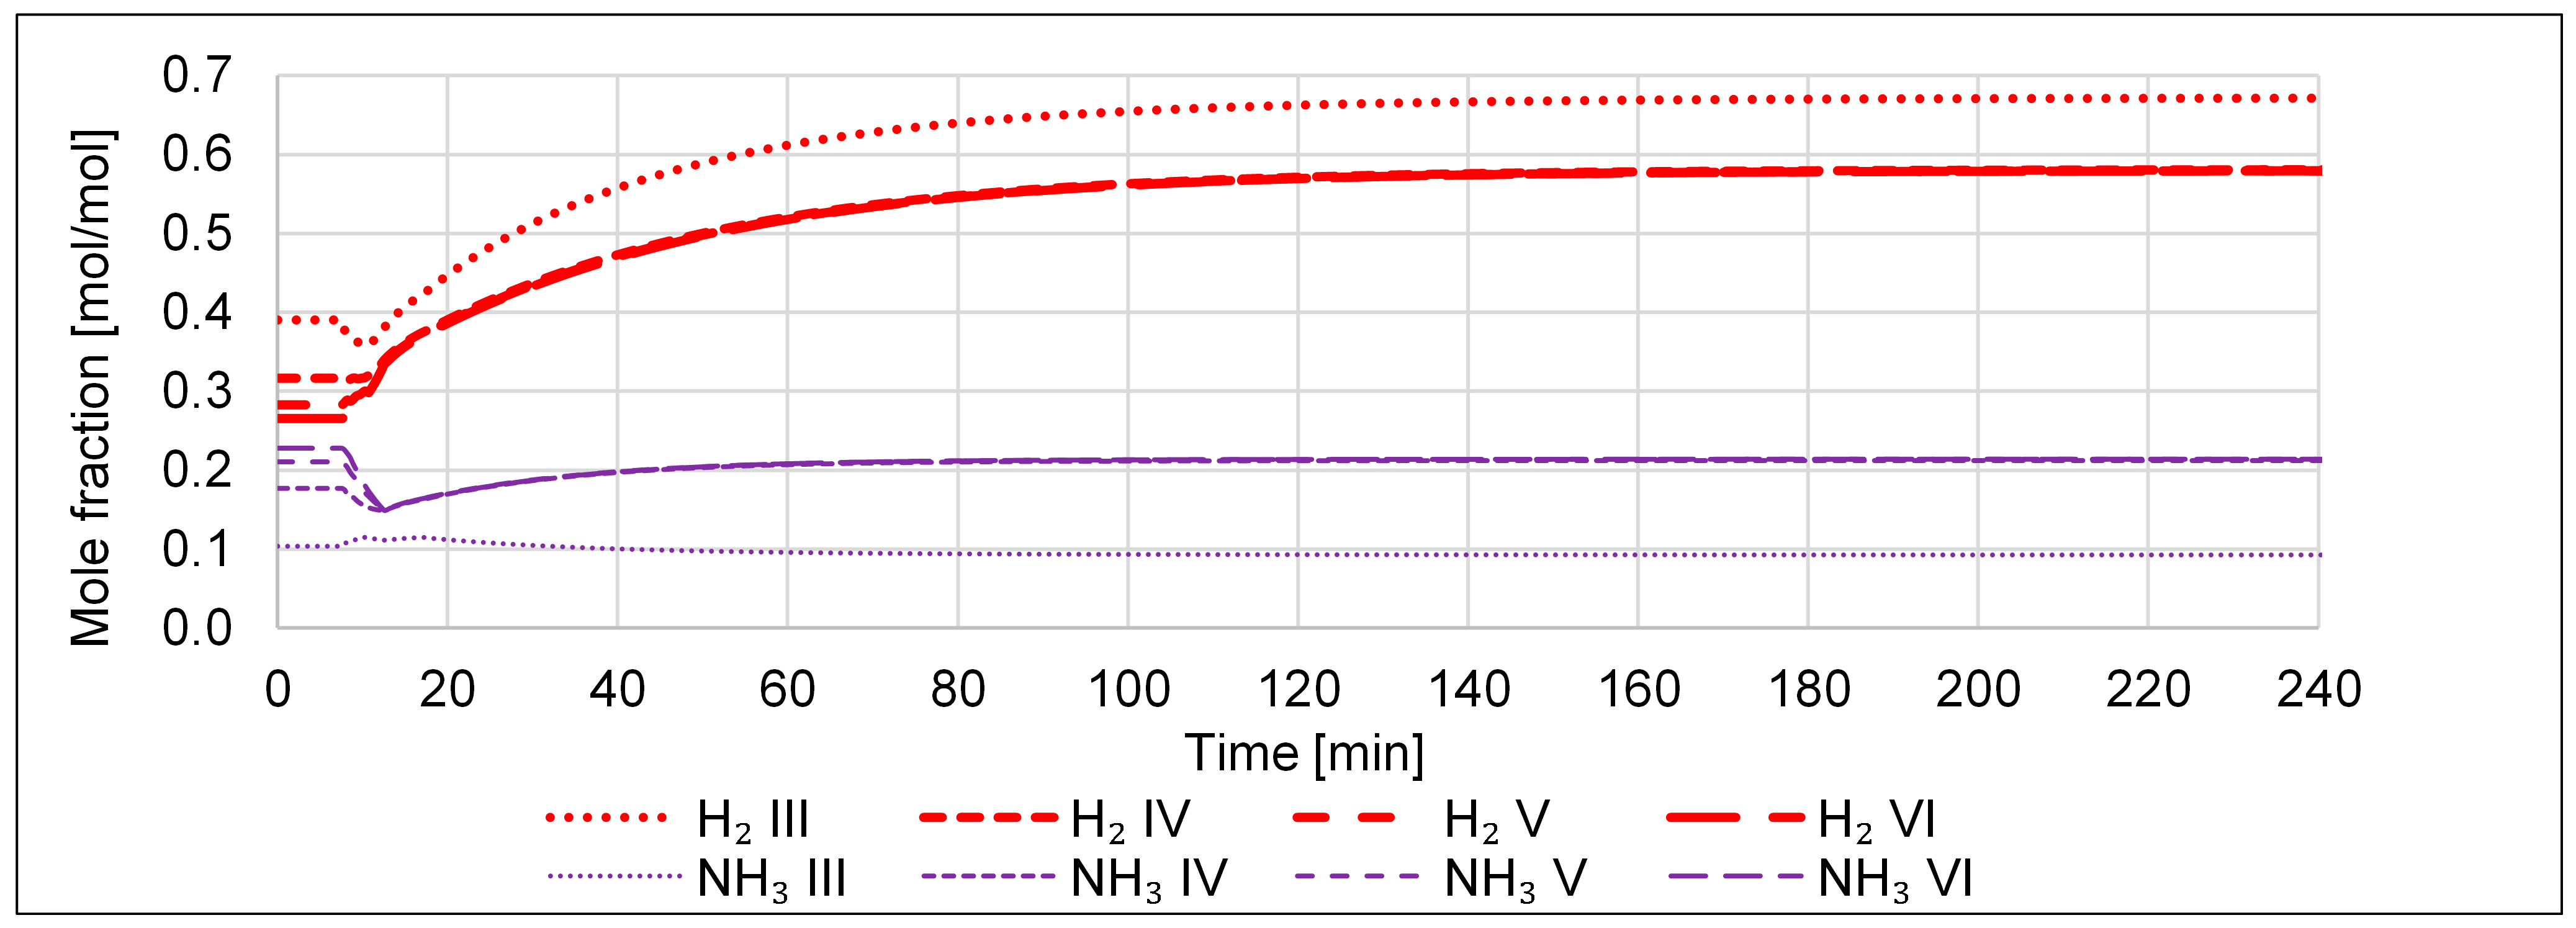
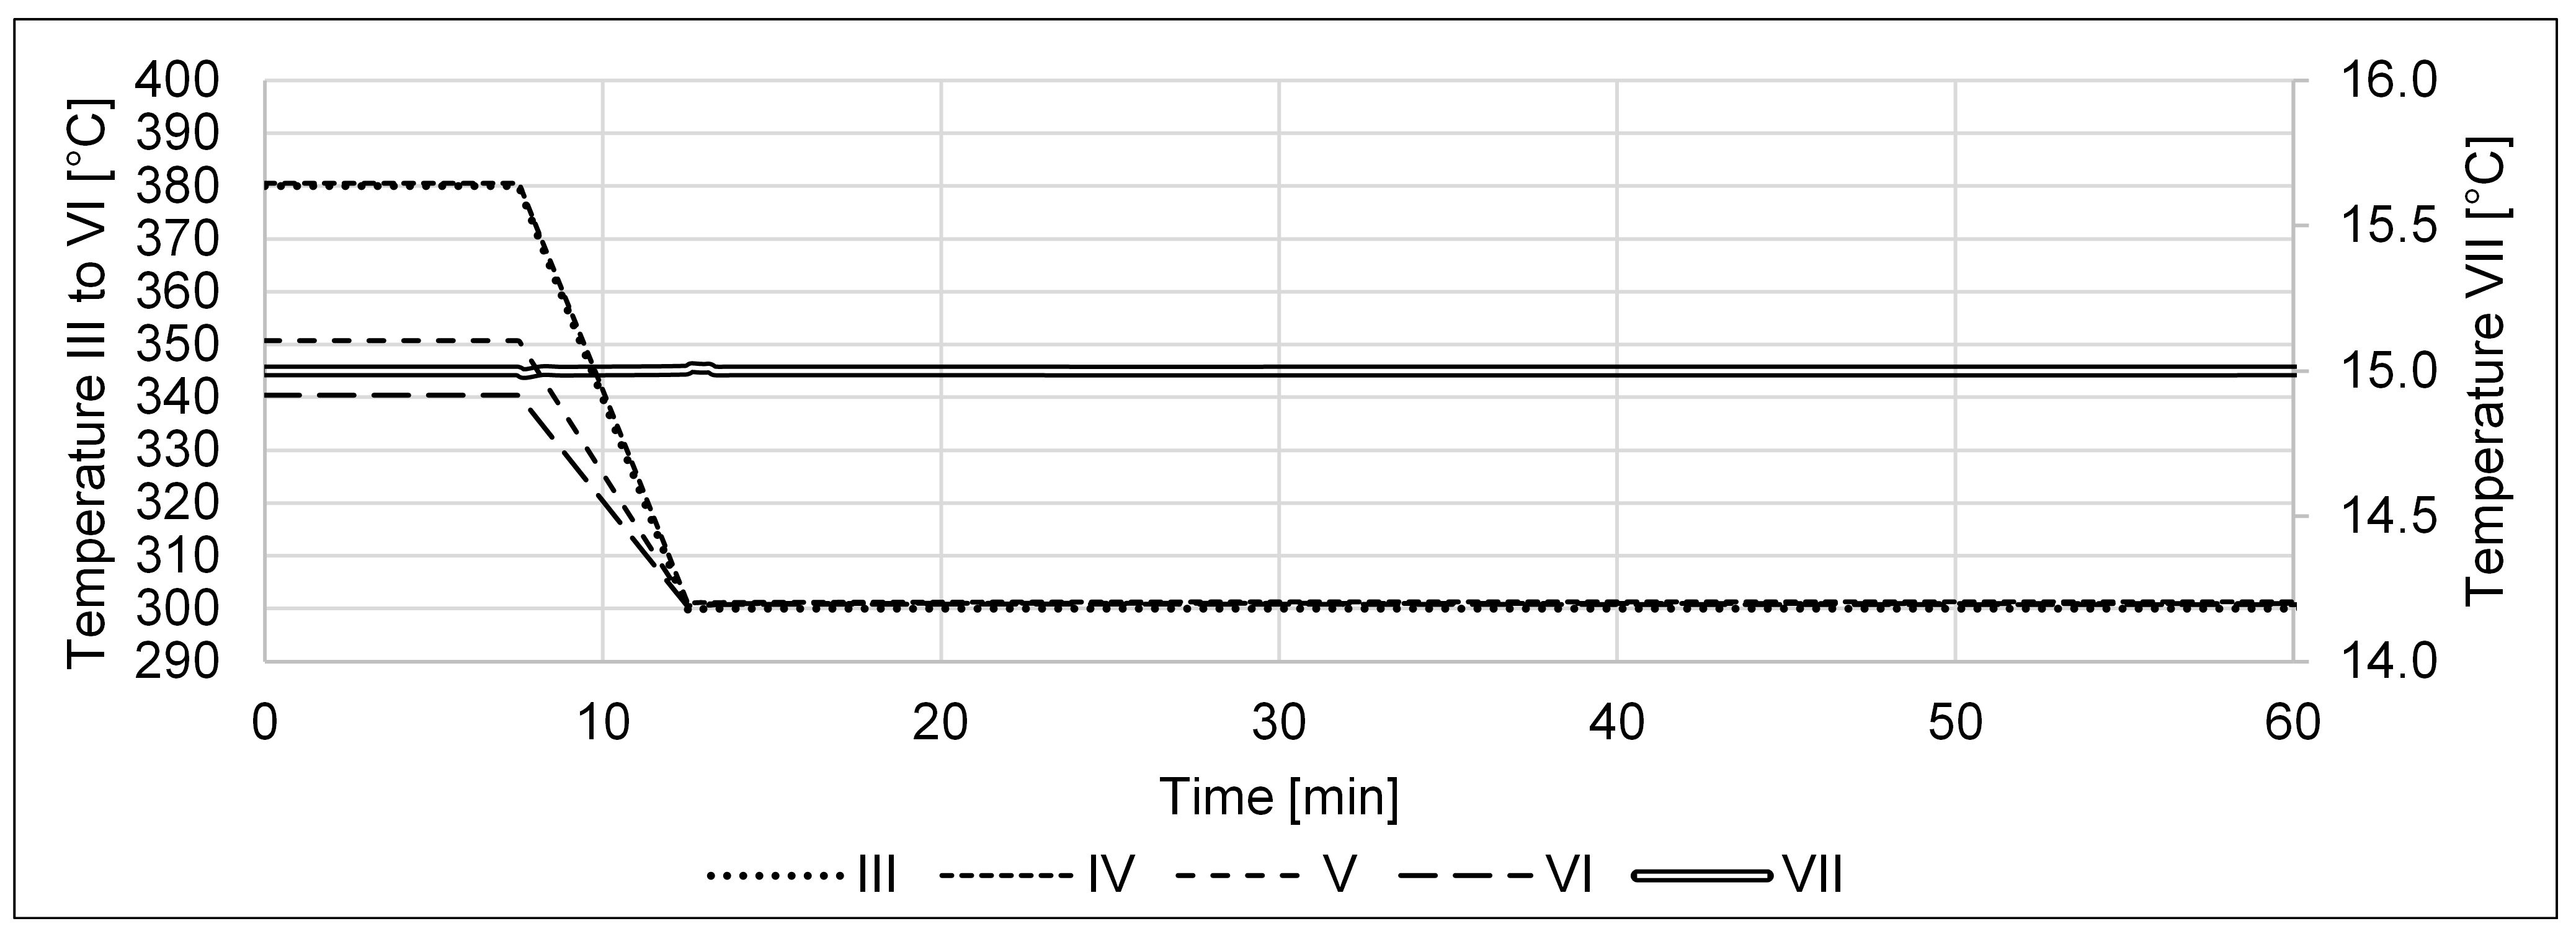
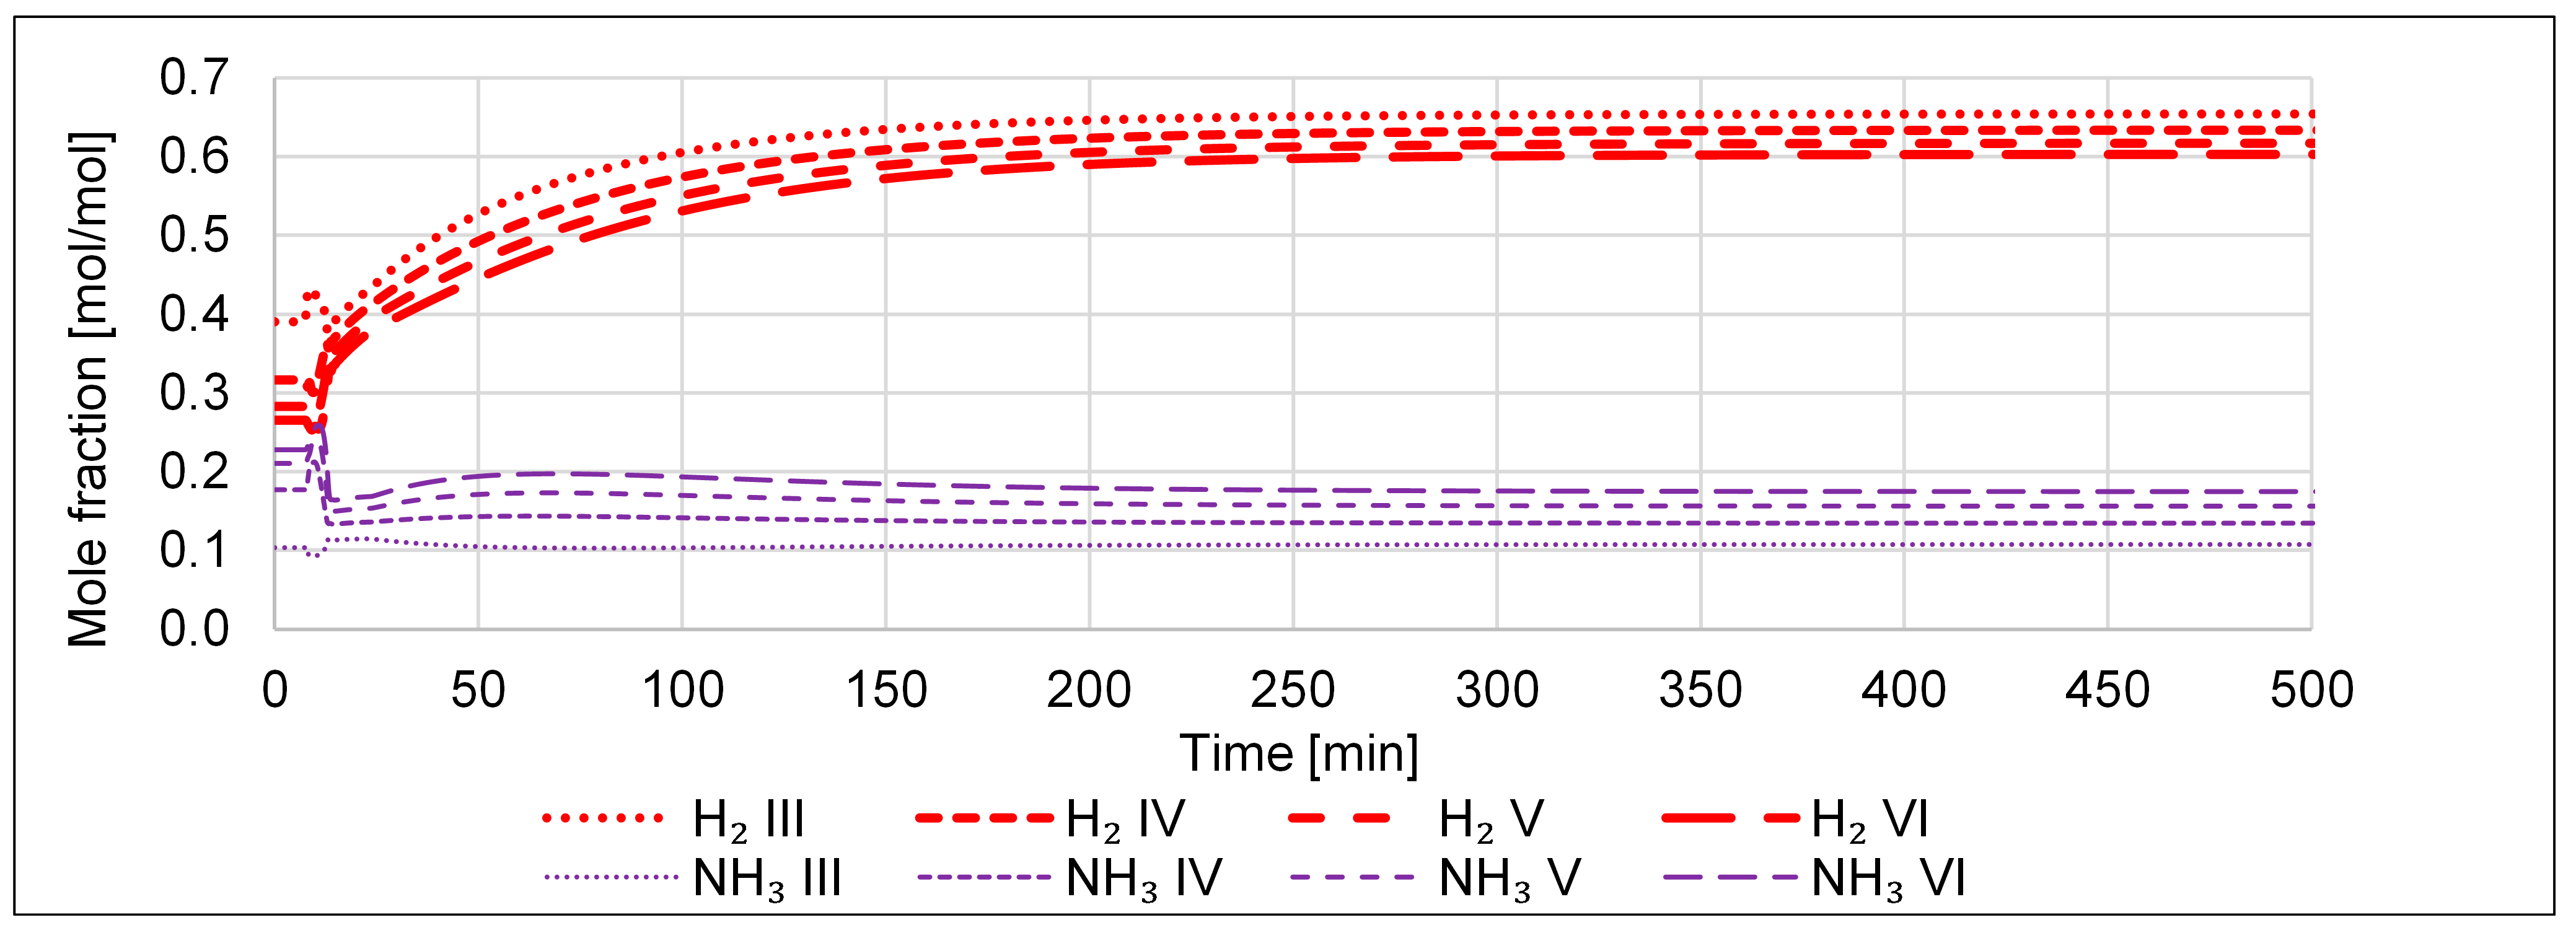
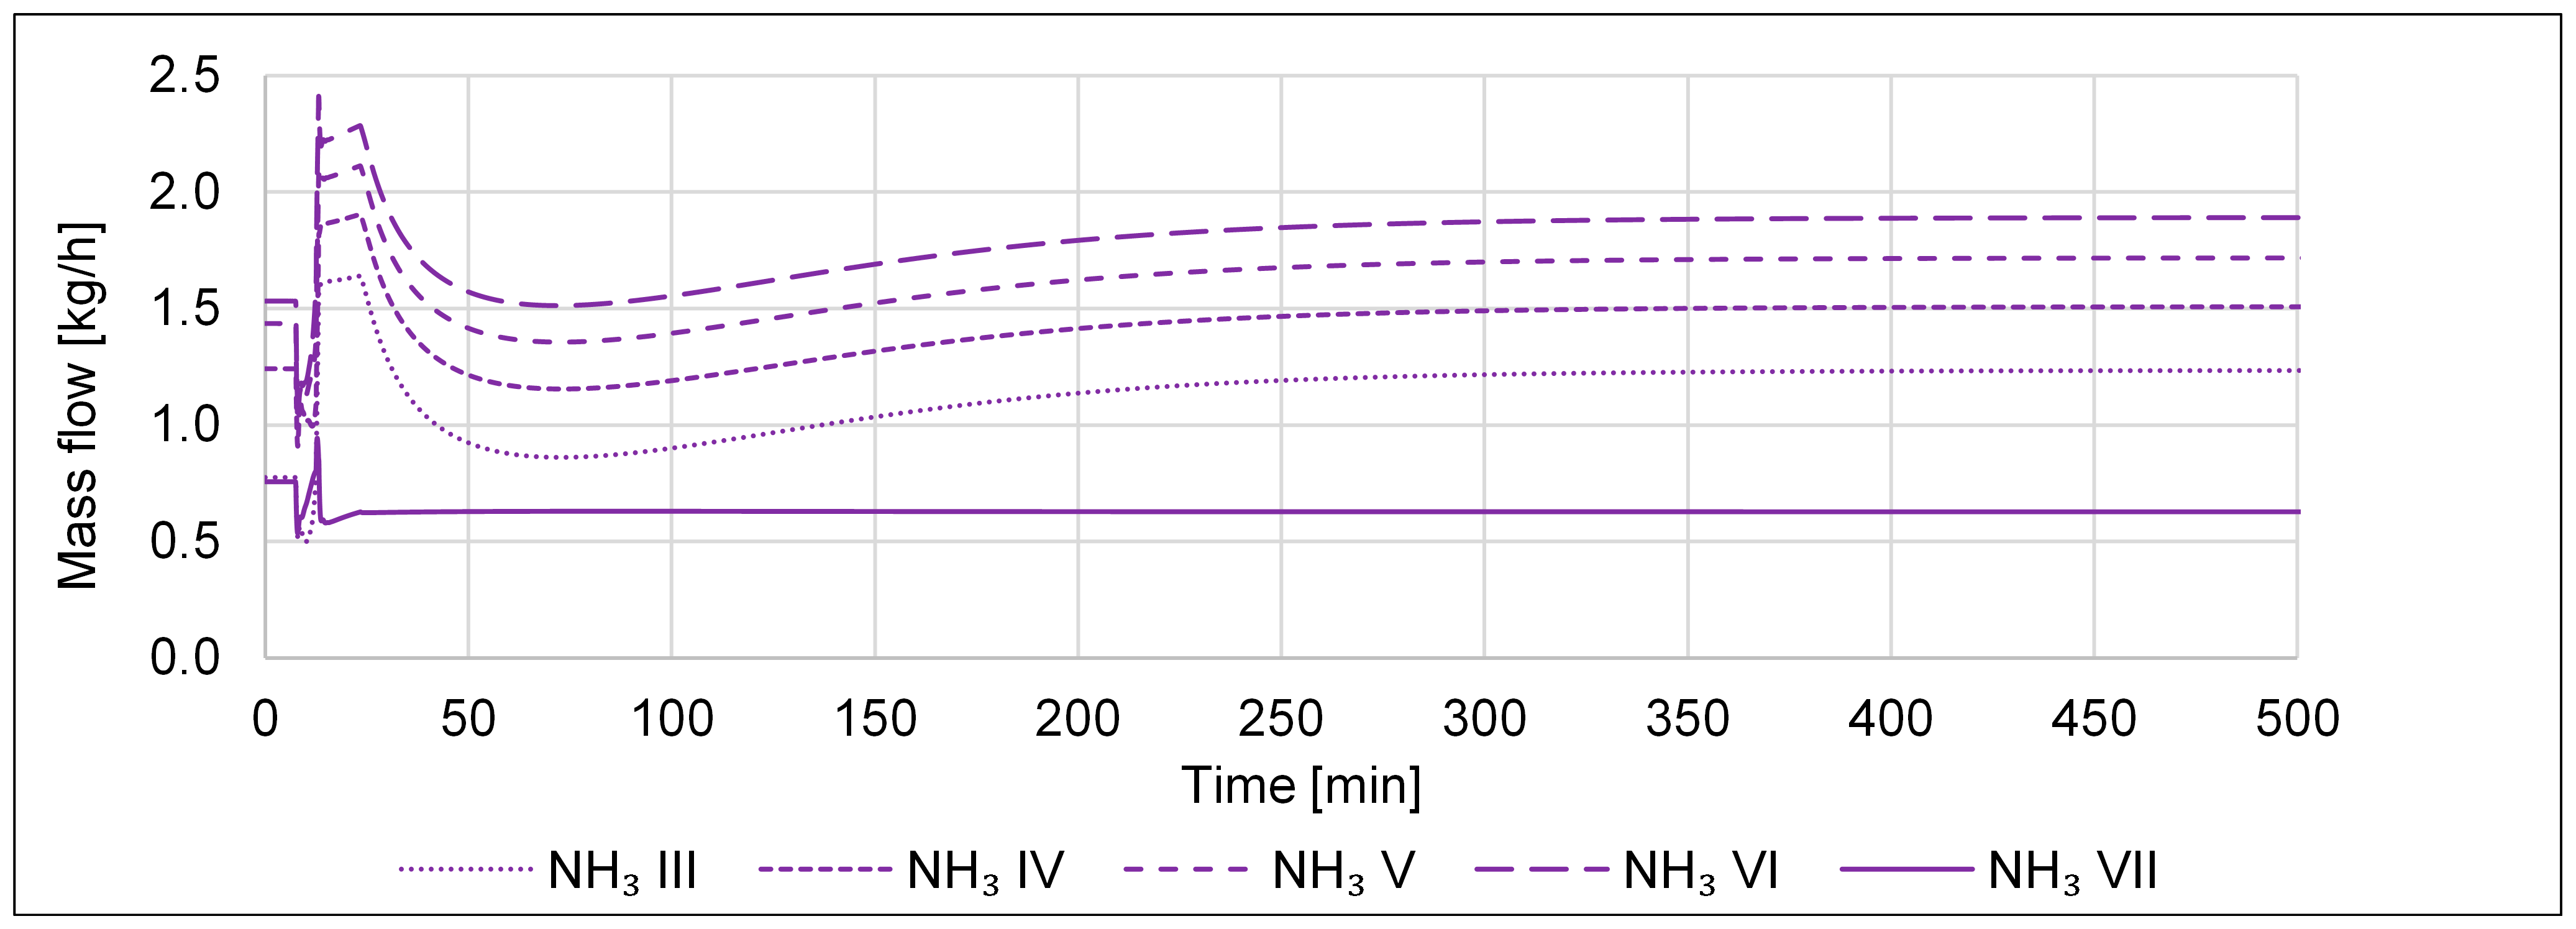
The results of scenario (i) are depicted in Figure 23, Figure 24, Figure 25 and Figure 26. In Figure 23, the change from a falling temperature profile of 380, 380, 350, and 340 °C in the preheater and the three reactor compartments to an isothermal profile of 400 °C is depicted (s. streams III to VI). Consequently, the mole composition profile in the reactor changes as well, as can be seen in Figure 24. The conversion into NH3 decreases in the first reactor compartment (s. the drop of the mole fraction NH3 IV in Figure 24). In the two following compartments, no NH3 is produced anymore, as the mole fractions NH3 V and VI are the same as the mole fraction NH3 IV. Furthermore, the NH3 composition at the outlet of the third reactor section, stream VI, is significantly lower than at the start of the scenario. This means that less NH3 can be condensed in the condenser, and the liquid NH3 stream VII leaving the cycle decreases, as depicted in Figure 25.
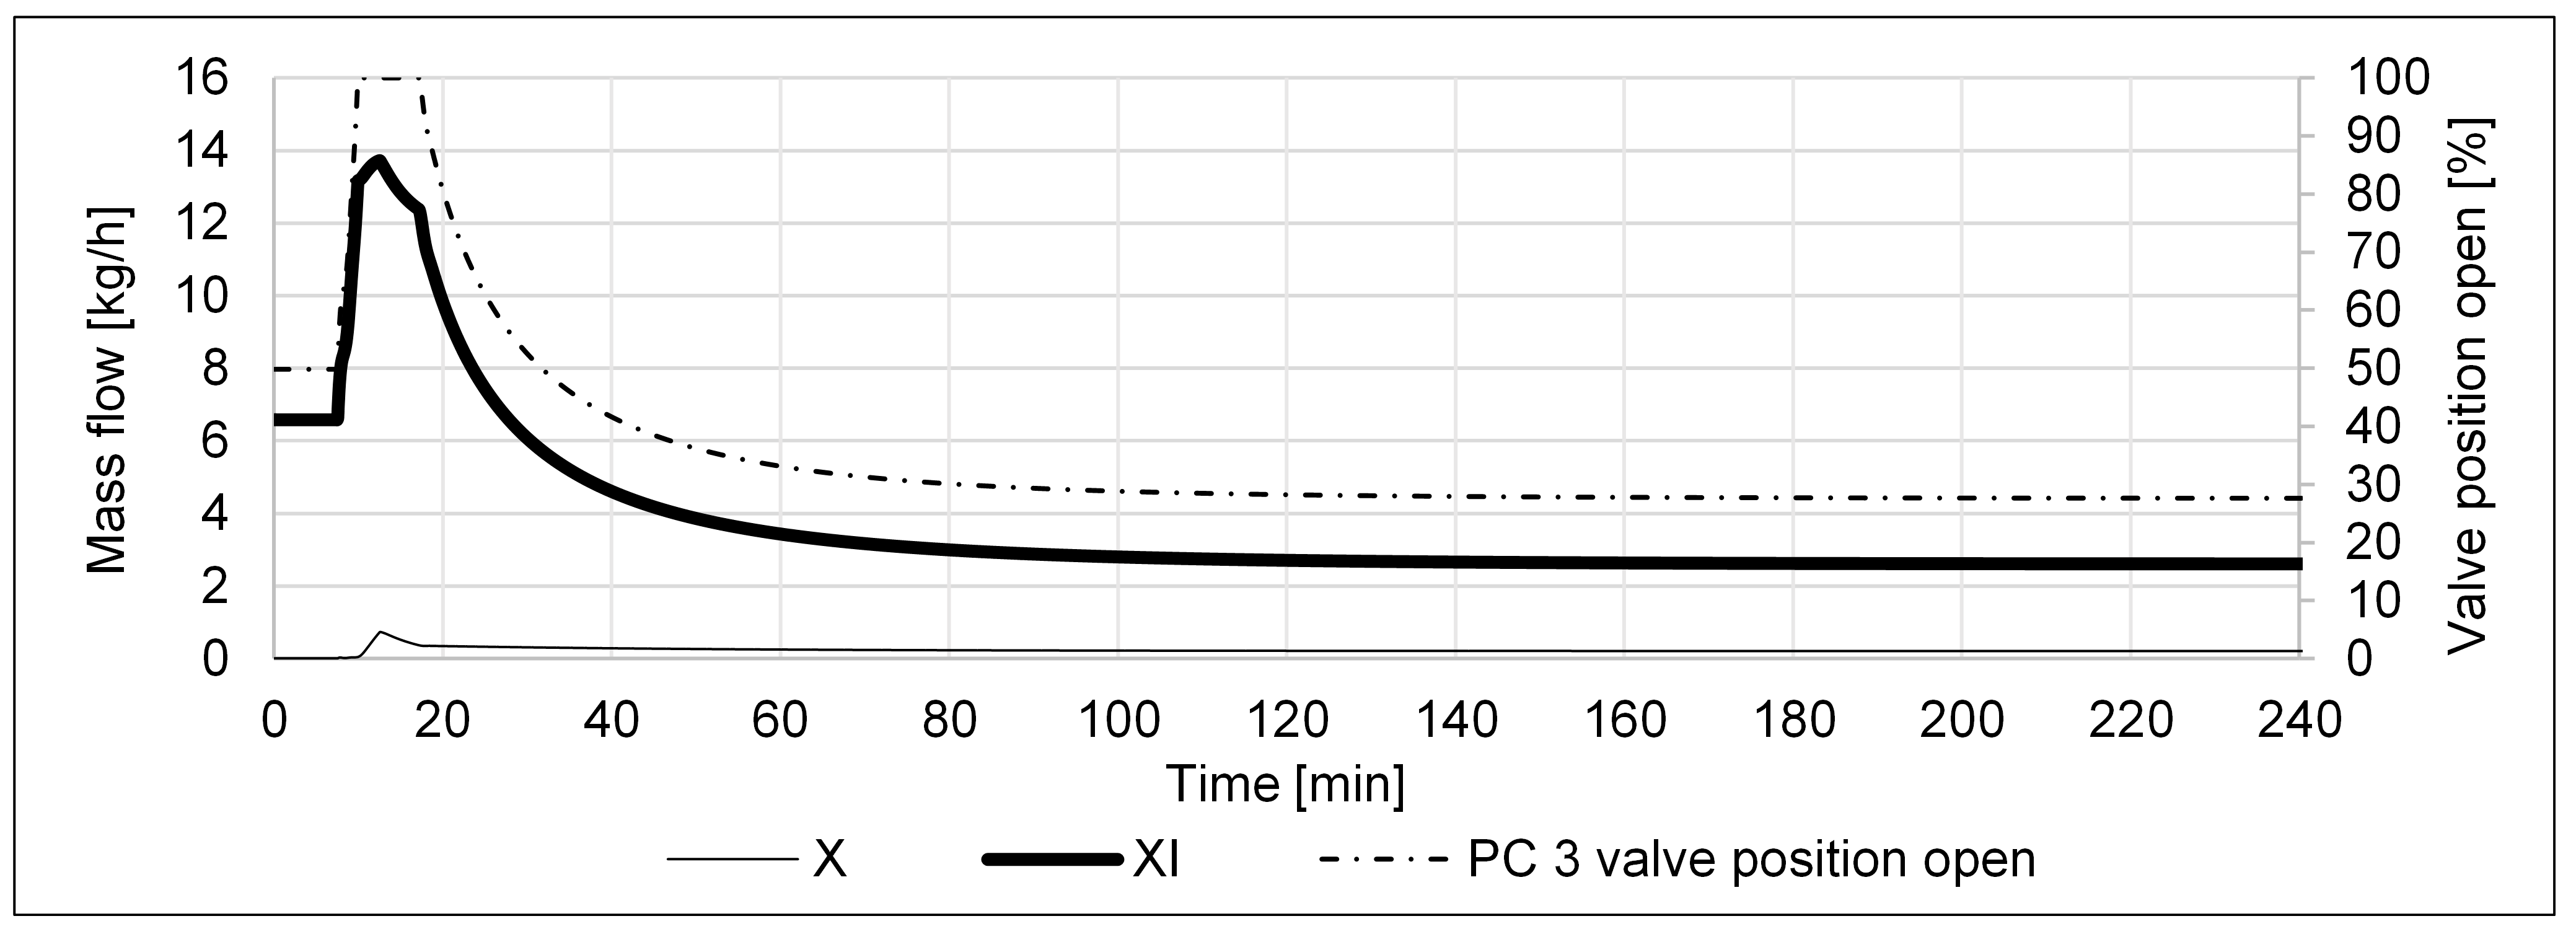
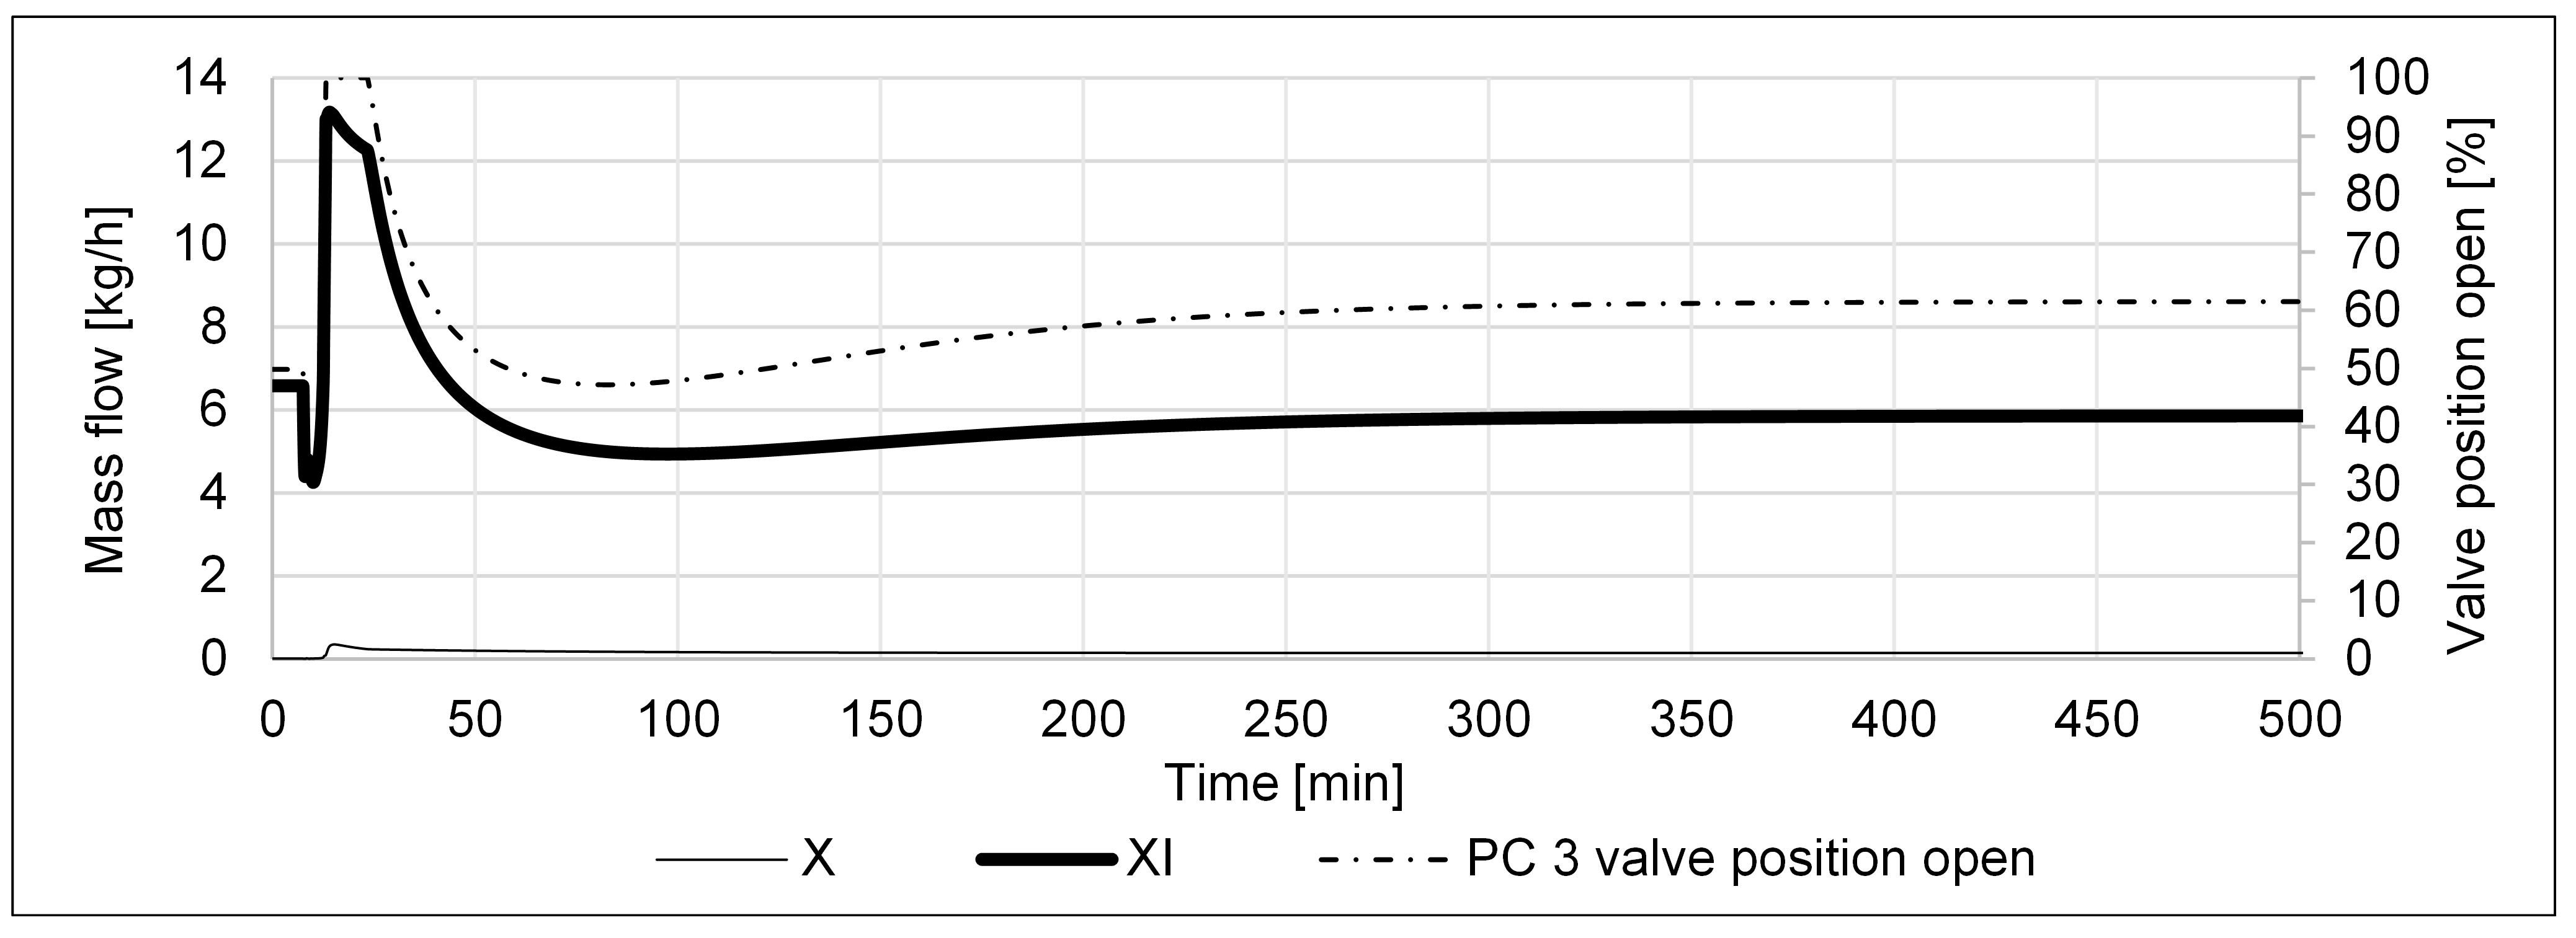
In addition, a lower NH3 conversion in the reactor means that more N2 and H2 remain in the system, leading to a higher recycle mass flow (s. sharp increase in stream XI in Figure 26) and an increase in the opening of the recycle valve (s. the rapid opening of the recycle valve position in Figure 26 right axis). As a last resort to prevent a potential pressure increase in the high-pressure section of the cycle, the purge valve opens, and the purge stream X in Figure 26 increases. At ca. minute 17 (s. Figure 25 and Figure 26), the system starts to stabilize. More and more N2 and H2 enter the system through the inlets. However, since almost three parts of H2 to one part of N2 enter the system, and both are not converted to as much NH3 as before, and H2 becomes the dominant component in the cycle with a molar share of almost 0.7 (s. Figure 24 molar fractions of H2 of streams III to VI). This change in composition leads to a new and stable steady state as NH3 conversion starts to pick up again (s. rise in NH3 mole fractions IV to VI in Figure 24). This conversion decreases the recycle mass stream (s. stream XI in Figure 26), and the recycle valve is closed again (s. also Figure 26 right axis). All streams in Figure 24, Figure 25 and Figure 26 level off, and at approximately minute 240, the new steady state is reached.
This new steady state displays a smaller NH3 conversion in the reactor resulting in a smaller liquid NH3 stream leaving the system and is thus undesired. In addition, a larger mass stream is lost through the purge. The only positive outcome is a decreased recycle mass stream, which leads to a smaller power uptake of the recycle compressor.
The practical implications of scenario (i) are that during the test campaign, the falling temperature profile in the reactor of 380, 350, and 340 °C should be monitored closely and not be increased as it worsens the conversion in the reactor.
The results of scenario (j) are depicted in Figure 27, Figure 28, Figure 29 and Figure 30. In Figure 27, the change from a falling temperature profile of 380, 380, 350, and 340 °C in the preheater and the three reactor compartments to an isothermal profile of 300 °C is depicted. Consequently, the mole composition profile in the reactor changes as well, as can be seen in Figure 28. In contrast to scenario (i), the conversion into NH3 in the three reactor sections continues, but at a lower level than at the beginning (s. Figure 28 NH3 mole fractions IV to VI). This points to the fact that the reactor is not long enough for the NH3 conversion to reach its equilibrium at 300 °C.
The NH3 composition at the outlet of the third reactor section is significantly lower than at the start of the scenario (s. Figure 28 NH3 mole fraction VI). This means that less NH3 can be condensed in the condenser, and the liquid NH3 stream VII leaving the cycle decreases, as depicted in Figure 29 (stream NH3 VII). Furthermore, a lower NH3 conversion in the reactor means that more N2 and H2 remain in the system, leading to a higher recycle mass flow (s. stream XI in Figure 30) and an opening of the recycle valve (s. Figure 30, recycle valve position right axis). As a last resort to prevent a potential pressure increase in the high-pressure section of the cycle, the purge valve opens, and the purge stream X in Figure 30 increases. At ca. minute 24 (s. Figure 29 and Figure 30), the recycle stream decreases, and the recycle valve closes (s. Figure 30). The system starts to stabilize with a dip at ca. minute 75, followed by a leveling off of the streams (s. Figure 28, Figure 29 and Figure 30) to reach a new steady state at approximately minute 400.
Similar to scenario (i), the new steady state of scenario (j) also displays a smaller NH3 conversion in the reactor, resulting in a smaller liquid NH3 stream leaving the system. Thus, scenario (j) is undesired, too. Comparing Figure 29 to Figure 25 and Figure 30 to Figure 26, the cool-down scenario (j) seems to be more tolerable than the heat-up scenario (i), as the decrease in liquid NH3 and the increase in the purge stream are less severe. However, the cool-down scenario takes longer to be stabilized by the controls to reach a new steady state. Furthermore, the recycle mass stream at the end of scenario (j) is higher than in scenario (i), which means that the energy uptake of the compressor in scenario (j) is higher.
For the test campaigns, scenario (j) has the same lessons learned as scenario (i), i.e., that the optimum reactor temperature profile should not be lowered but be kept and monitored closely.
In summary, the control infrastructure is able to safely control all ten scenarios. Thus, it can be assumed that the test campaigns should be rather safe for the operating personnel. None of the scenarios results in a potentially risky situation, e.g., an uncontrolled increase in the reactor temperature or pressure.
However, the two scenarios, (c) and (d), should be avoided over all other scenarios, as they both lead to a zero NH3 output in the end. A temporary failure in the N2 and H2 supply is acceptable but should be fixed as soon as possible when the tests are conducted.
In addition, some of the scenarios, i.e., (b), (c), (i), and (j), display a rather sudden change in the recycle valve position accompanied by a rather sudden change in the recycle mass flow. Such stark changes may cause damage to the cycle components. Hence, in the test plant operation, these scenarios should not be tested too many times and should be avoided in long-term operation.
Furthermore, it can be said that all scenarios which entail an increase in the mass stream that is purged and lost to the system, i.e., all scenarios apart from (e) and (h), are undesired.
Scenarios (e) and (h) are the only desirable scenarios, as in both scenarios, the liquid NH3 stream that leaves the cycle increases, and both the purge and recycle mass stream decrease. Comparing scenarios (e) and (h), (e) displays a larger reduction in the purge stream as well as in the recycle stream, but (h) shows a higher increase in the liquid NH3 production. This is why it is hard to say if an investment in a compressor with a higher outlet pressure is more favorable to the P2A system than a cooler with a lower cooling temperature to cool the condenser. Only the test campaigns will reveal which scenario, (e) or (h), is more favorable in terms of NH3 production and cycle efficiency. Afterward, it can be decided how to best optimize the cycle, i.e., by an investment in a better compressor or a better cooling system.
All scenarios (e) to (h) show that the recycle valve control parameters should be improved in terms of reaction time. In addition, the cascaded control of the high-pressure part of the cycle as a whole should potentially be revised, as in all of these four scenarios, it takes a very long time to reach the new steady state. The optimization of these control parameters and the cascaded control design will be part of the test campaigns.
Lastly, comparing scenarios i) and j), the cool-down reactor scenario (j) results in a lesser decrease in the liquid NH3 output, and the purge mass stream is smaller. However, in scenario (i), the recycle mass stream is smaller, and the time taken for the controls to reach a new steady state is also reduced. Thus, it can be argued that both a high and a low isothermal reactor profile are worse for the P2A system. In either case, for the test campaigns, it is vital to monitor the reactor temperature profile closely and to maintain the optimal temperature profile.

4. Discussion & Conclusions

In this work, a total of ten scenarios of a novel small-scale P2A cycle employing the software Aspen Plus Dynamics® were conducted. A novel kinetic reaction model was implemented as well. The scenarios all emulate events, i.e., changes in operating parameters and failure events that are likely to occur during the first-time operation of the containerized new system in 2023. Thus, the simulations are preparation and guidance as to what to expect and how best to conduct the actual tests.
The ten scenarios are: an increase in N2 input (a)), a decrease in N2 input (b)), a stop in N2 input (c)), a stop in H2 input (d)), a high-pressure increase (e)), a high-pressure decrease (f)), a condenser temperature increase (g)), a condenser temperature decrease (h)), a change to a high-temperature isothermal reactor profile (i)), and lastly a change to a low-temperature isothermal reactor profile (j)).
The simulations showed that all scenarios could be safely controlled by the control infrastructure. This suggests that the scenarios are also safe for the operating personnel during the test campaigns, provided that the system is monitored and that the other safety installations, such as gas warning devices and safety valves, operate reliantly.
However, the failures in the N2 and H2 supply, scenarios (c) and (d), should be remedied as quickly as possible should they occur. In the long run, these are the only scenarios that lead to a zero NH3 output of the cycle. The system will continue to operate, but the inlets will be purged after some cycles in the loop, with no NH3 being produced. As a consequence of the real plant tests, a temporary failure in the N2 and H2 supply can be controlled, but, as was to be expected, a long-time failure needs to be fixed, and the plant needs to be shut down in the meantime.
In addition, some of the scenarios, i.e., (b), (c), (i), and (j), cause rather sudden changes, e.g., in the recycle valve position, which are likely to damage the cycle components. Hence, in the test plant operation, these scenarios should not be tested too many times and should be avoided in long-term operation.
Lastly, scenarios (e) and (h) are the only two desirable scenarios because they lead to an increase in NH3 production and a decrease in the recycle mass and purge. Consequently, for the actual tests, the aim will be to operate the compressor at maximum outlet pressure and to keep the condenser temperature as low as possible. Especially the optimization of the cooling will be studied in the test campaigns, with different cooling utilities available at the test site, i.e., air, water, and chilled water.
Looking ahead, the results of the simulations will not only be used as guidance for the test campaigns in 2023 but also to validate the simulations. In addition, the test results will help to improve the dynamic model by altering chosen settings and changing assumptions that were made so the model better fits the behavior of the real plant. A comparison of the actual test data with the performance of the improved model will be published in a follow-up paper to this work. The optimized and validated dynamic model can then be used for the design and prediction of the dynamic behavior of similar small-scale P2A systems.

Author Contributions

Conceptualization, methodology, and writing—original draft preparation, P.K.; writing—review and editing, D.B., M.C.S., A.A.-M. and C.L.; project administration, D.B.; funding acquisition, B.E. All authors have read and agreed to the published version of the manuscript.

Funding

This project received funding from the European Union’s Horizon 2020 research and innovation programme under grant agreement No. 884157. https://flexnconfu.eu/ (accessed on 21 February 2023).Processes 11 00680 i001

Data Availability Statement

Data will be made available, if possible, on request after consultation with the project partners, as some data is confidential.

Conflicts of Interest

The authors declare no conflict of interest. The funders had no role in the design of the study; in the collection, analyses, or interpretation of data; in the writing of the manuscript; or in the decision to publish the results.

Nomenclature

Acronyms
CO2 Carbon dioxide
EU European Union
FC Flow control
FLEXnCONFU Flexibilize combined cycle power plant through power-to-X solutions using non-conventional fuels
Δ h ¯ ° Molar   standard   reaction   enthalpy   [ kJ / mol ]
H2 Hydrogen
HYSPR Aspen HYSYS® Peng Robinson
LLHW Langmuir Hinshelwood Hougen Watson
N2 Nitrogen
NH3 Ammonia
p Pressure ,   partial   pressure   [ barg ,   bar ]
P2A Power-to-ammonia
PC Pressure control
PID Proportional integration differential controller
r Mass - specific   reaction   kinetics   [ kmol / ( kg s ) ]
RH2N2 Cycle inlet molar ratio of H2 to N2
T Temperature   [ ° C ,   K ]
TC Temperature control
Roman letters
I, II, …, XII Stream numbering

References

  1. European Commission Directorate-General for Energy. The Role and Potential of Power-to-X in 2050: METIS Studies, Study S8; European Commission: Brussels, Belgium, 2019; ISBN 978-92-76-03322-6. [Google Scholar]
  2. Kroch, E. Ammonia—A Fuel For Motor Buses. J. Inst. Pet. 1945, 31, 213–223. [Google Scholar]
  3. Atchison, J. Amogy: Ammonia-Powered Tractor. Press Release. Available online: https://www.ammoniaenergy.org/articles/amogy-ammonia-powered-tractor/ (accessed on 5 December 2022).
  4. MAN Energy Solutions. MAN B&W Two-Stroke Engine Operating on Ammonia. Available online: https://www.man-es.com/docs/default-source/marine/tools/man-b-w-two-stroke-engine-operating-on-ammonia.pdf?sfvrsn=544dc811_10 (accessed on 4 December 2022).
  5. Atchison, J. Ocean Network Express: Adding Ammonia Power to the Fleet. Press Release. Available online: https://www.ammoniaenergy.org/articles/ocean-network-express-adding-ammonia-power-to-the-fleet/?mc_cid=f6b5bf45bb&mc_eid=d2d2750d43 (accessed on 5 December 2022).
  6. Kobayashi, H.; Hayakawa, A.; Somarathne, K.K.A.; Okafor, E.C. Science and technology of ammonia combustion. Proc. Combust. Inst. 2019, 37, 109–133. [Google Scholar] [CrossRef]
  7. Ito, S.; Uchida, M.; Suda, T.; Fujimori, T. Development of Ammonia Gas Turbine Co-Generation Tech. IHI Eng. Rev. 2020, 53, 1–6. [Google Scholar]
  8. Okafor, E.C.; Kurata, O.; Yamashita, H.; Inoue, T.; Tsujimura, T.; Iki, N.; Hayakawa, A.; Ito, S.; Uchida, M.; Kobayashi, H. Liquid ammonia spray combustion in two-stage micro gas turbine combustors at 0.25 MPa; Relevance of combustion enhancement to flame stability and NOx control. Appl. Energy Combust. Sci. 2021, 7, 100038. [Google Scholar] [CrossRef]
  9. Valera-Medina, A.; Xiao, H.; Owen-Jones, M.; David, W.; Bowen, P.J. Ammonia for power. Prog. Energy Combust. Sci. 2018, 69, 63–102. [Google Scholar] [CrossRef]
  10. Kaltschmitt, M. (Ed.) Renewable Energy: Technology, Economics and Environment; with 66 Tables; Springer: Berlin/Heidelberg, Germany, 2007; ISBN 978-3-540-70947-3. [Google Scholar]
  11. European Commission. A European Green Deal: Striving to be the First Climate-Neutral Continent. Available online: https://ec.europa.eu/info/strategy/priorities-2019-2024/european-green-deal_en (accessed on 5 December 2022).
  12. Ausfelder, F.; Herrmann, E.O.; López González, L.F. Perspective Europe 2030: Technology Options for CO2-Emission Reduction of Hydrogen Feedstock in Ammonia Production; DECHEMA Gesellschaft für Chemische Technik und Biotechnologie e.V: Frankfurt am Main, Germany, 2022; ISBN 978-3-89746-237-3. [Google Scholar]
  13. Rouwenhorst, K.H.; van der Ham, A.G.; Mul, G.; Kersten, S.R. Islanded ammonia power systems: Technology review & conceptual process design. Renew. Sustain. Energy Rev. 2019, 114, 109339. [Google Scholar] [CrossRef]
  14. Reese, M.; Marquart, C.; Malmali, M.; Wagner, K.; Buchanan, E.; McCormick, A.; Cussler, E.L. Performance of a Small-Scale Haber Process. Ind. Eng. Chem. Res. 2016, 55, 3742–3750. [Google Scholar] [CrossRef]
  15. Duckett, A. Green Ammonia Project Set for Launch in UK Today. Press Release. Available online: https://www.thechemicalengineer.com/news/green-ammonia-project-set-for-launch-in-uk-today/ (accessed on 4 December 2022).
  16. Yamagami, A.; Fujiwara, H. World’s First Successful Ammonia Synthesis Using Renewable Energy-Based Hydrogen and Power Generation: Progress Toward Realization of Hydrogen Energy Carriers. Press Release. Available online: https://www.jgc.com/en/news/assets/pdf/20181019e.pdf (accessed on 4 December 2022).
  17. Stephens, A.D.; Richards, R.J. Steady state and dynamic analysis of an ammonia synthesis plant. Automatica 1973, 9, 65–78. [Google Scholar] [CrossRef]
  18. Zhang, C.; Vasudevan, S.; Rangaiah, G.P. Plantwide Control System Design and Performance Evaluation for Ammonia Synthesis Process. Ind. Eng. Chem. Res. 2010, 49, 12538–12547. [Google Scholar] [CrossRef]
  19. Dastjerd, F.T.; Sadeghi, J. The Simulation and Control of Ammonia Unit of Shiraz Petrochemical Complex, Iran. J. Chem. Pet. Eng. 2018, 52, 107–122. [Google Scholar] [CrossRef]
  20. Verleysen, K.; Parente, A.; Contino, F. How sensitive is a dynamic ammonia synthesis process? Global sensitivity analysis of a dynamic Haber-Bosch process (for flexible seasonal energy storage). Energy 2021, 232, 121016. [Google Scholar] [CrossRef]
  21. Bland, M.J. Optimisation of an Ammonia Synthesis Loop; Norwegian University of Science and Technology: Trondheim, Norway, 2015. [Google Scholar]
  22. Aspen Tech. Aspen Plus Ammonia Model. Available online: https://user.eng.umd.edu/~nsw/chbe446/Ammonia-Aspen.pdf (accessed on 5 December 2022).
  23. Appl, M.; Ammonia,vol. 2, 3. Production Processes. Ullmann’s Encyclopedia of Industrial Chemistry; Wiley-VCH Verlag GmbH & Co. KGaA: Weinheim, Germany, 2000; ISBN 3527306730. [Google Scholar]
  24. Araújo, A.; Skogestad, S. Control structure design for the ammonia synthesis process. Comput. Chem. Eng. 2008, 32, 2920–2932. [Google Scholar] [CrossRef] [Green Version]
  25. de Tian, W.; Yu, Z.P.; Sun, S.L. Dynamic Simulation of Ammonia Synthesis Loop under Abnormal Conditions. AMR 2011, 396–398, 955–958. [Google Scholar] [CrossRef]
  26. Palys, M.; McCormick, A.; Cussler, E.; Daoutidis, P. Modeling and Optimal Design of Absorbent Enhanced Ammonia Synthesis. Processes 2018, 6, 91. [Google Scholar] [CrossRef] [Green Version]
  27. Verleysen, K.; Coppitters, D.; Parente, A.; de Paepe, W.; Contino, F. How can power-to-ammonia be robust? Optimization of an ammonia synthesis plant powered by a wind turbine considering operational uncertainties. Fuel 2020, 266, 117049. [Google Scholar] [CrossRef]
  28. Kirova-Yordanova, Z. Exergy analysis of industrial ammonia synthesis. Energy 2004, 29, 2373–2384. [Google Scholar] [CrossRef]
  29. Penkuhn, M.; Tsatsaronis, G. Comparison of different ammonia synthesis loop configurations with the aid of advanced exergy analysis. Energy 2017, 137, 854–864. [Google Scholar] [CrossRef]
  30. Morud, J.C.; Skogestad, S. Analysis of instability in an industrial ammonia reactor. AIChE J. 1998, 44, 888–895. [Google Scholar] [CrossRef]
  31. Kasiri, N.; Hosseini, A.R.; Moghadam, M. Dynamic simulation of an ammonia synthesis reactor. In European Symposium on Computer Aided Process Engineering-13, 36th European Symposium of the Working Party on Computer Aided Process Engineering; Elsevier: Amsterdam, The Netherlands, 2003; pp. 695–700. ISBN 9780444513687. [Google Scholar]
  32. Altaf, B.; Montague, G.; Martin, E.B. Dynamic Process Monitoring of An Ammonia Synthesis Fixed-Bed Reactor. Int. J. Mech. Mechatron. Eng. 2016, 10, 462–472. [Google Scholar] [CrossRef]
  33. Allman, A.; Daoutidis, P. Optimal scheduling for wind-powered ammonia generation: Effects of key design parameters. Chem. Eng. Res. Des. 2018, 131, 5–15. [Google Scholar] [CrossRef]
  34. Jinasena, A.; Bernt, L.; Bjørn, G. Dynamic model of an ammonia synthesis reactor based on open information. In Proceedings of the 9th EUROSIM Congress on Modelling and Simulation, EUROSIM 2016, The 57th SIMS Conference on Simulation and Modelling SIMS 2016. Mo, 12–16 September 2016; Linköping University Electronic Press: Linköping, Sweden, 2018; pp. 998–1004. [Google Scholar]
  35. Adhi, T.P.; Prasetyo, M.I. Process Stability Identification Through Dynamic Study of Single-bed Ammonia Reactor with Feed-Effluent Heat Exchanger (FEHE). MATEC Web Conf. 2018, 156, 3003. [Google Scholar] [CrossRef] [Green Version]
  36. Tripodi, A.; Compagnoni, M.; Bahadori, E.; Rossetti, I. Process simulation of ammonia synthesis over optimized Ru/C catalyst and multibed Fe + Ru configurations. J. Ind. Eng. Chem. 2018, 66, 176–186. [Google Scholar] [CrossRef]
  37. ICI Caldaie Company, C. Tregambe, Personal Communication in the Framework of the Collaboration in the EU H2020 FLEXnCONFU Project. Available online: www.flexnconfu.eu (accessed on 1 September 2022).
  38. Koschwitz, P.; Bellotti, D.; Liang, C.; Epple, B. Dynamic Simulation of a Novel Small-scale Power to Ammonia Concept. Energy Proc. 2022, 28, 1–10. [Google Scholar] [CrossRef]
  39. Koschwitz, P.; Bellotti, D.; Liang, C.; Epple, B. Steady state process simulations of a novel containerized power to ammonia concept. Int. J. Hydrogen Energy 2022, 47, 25322–25334. [Google Scholar] [CrossRef]
  40. Aspen Tech. Aspen Plus Dynamics simulation software V11 (37.0.0.395). Available online: https://www.aspentech.com/en/products/engineering/aspen-plus-dynamics (accessed on 21 February 2023).
  41. Bazzanella, A.M.; Ausfelder, F. DECHEMA Gesellschaft für Chemische Technik und Biotechnologie e.V. In Low Carbon Energy and Feedstock for the European Chemical Industry: Technology Study; DECHEMA e.V.: Frankfurt am Main, Germany, 2017; ISBN 978-3-89746-196-2. [Google Scholar]
  42. Proton Ventures BV. Personal Communication in the Framework of the Collaboration in the EU H2020 FLEXnCONFU Project. Available online: www.flexnconfu.eu (accessed on 1 February 2021).
  43. McPhy. Electrolyser Series H 2021. Sales Brochure. Available online: https://cellar-c2.services.clever-cloud.com/com-mcphy/uploads/2020/08/20.05.McPhy_Portfolio_ELY_Piel_EN.pdf (accessed on 1 December 2022).
  44. Air Liquide. Alphagaz 2 Nitrogen/N2. Product Data Sheet. Available online: https://mygas.airliquide.be/files/830649f95c7d94a5d1ca3b9a428c7ede434dc08d_ALPHAGAZ____2_NITROGEN_en_BE_v1.6.pdf (accessed on 1 December 2022).
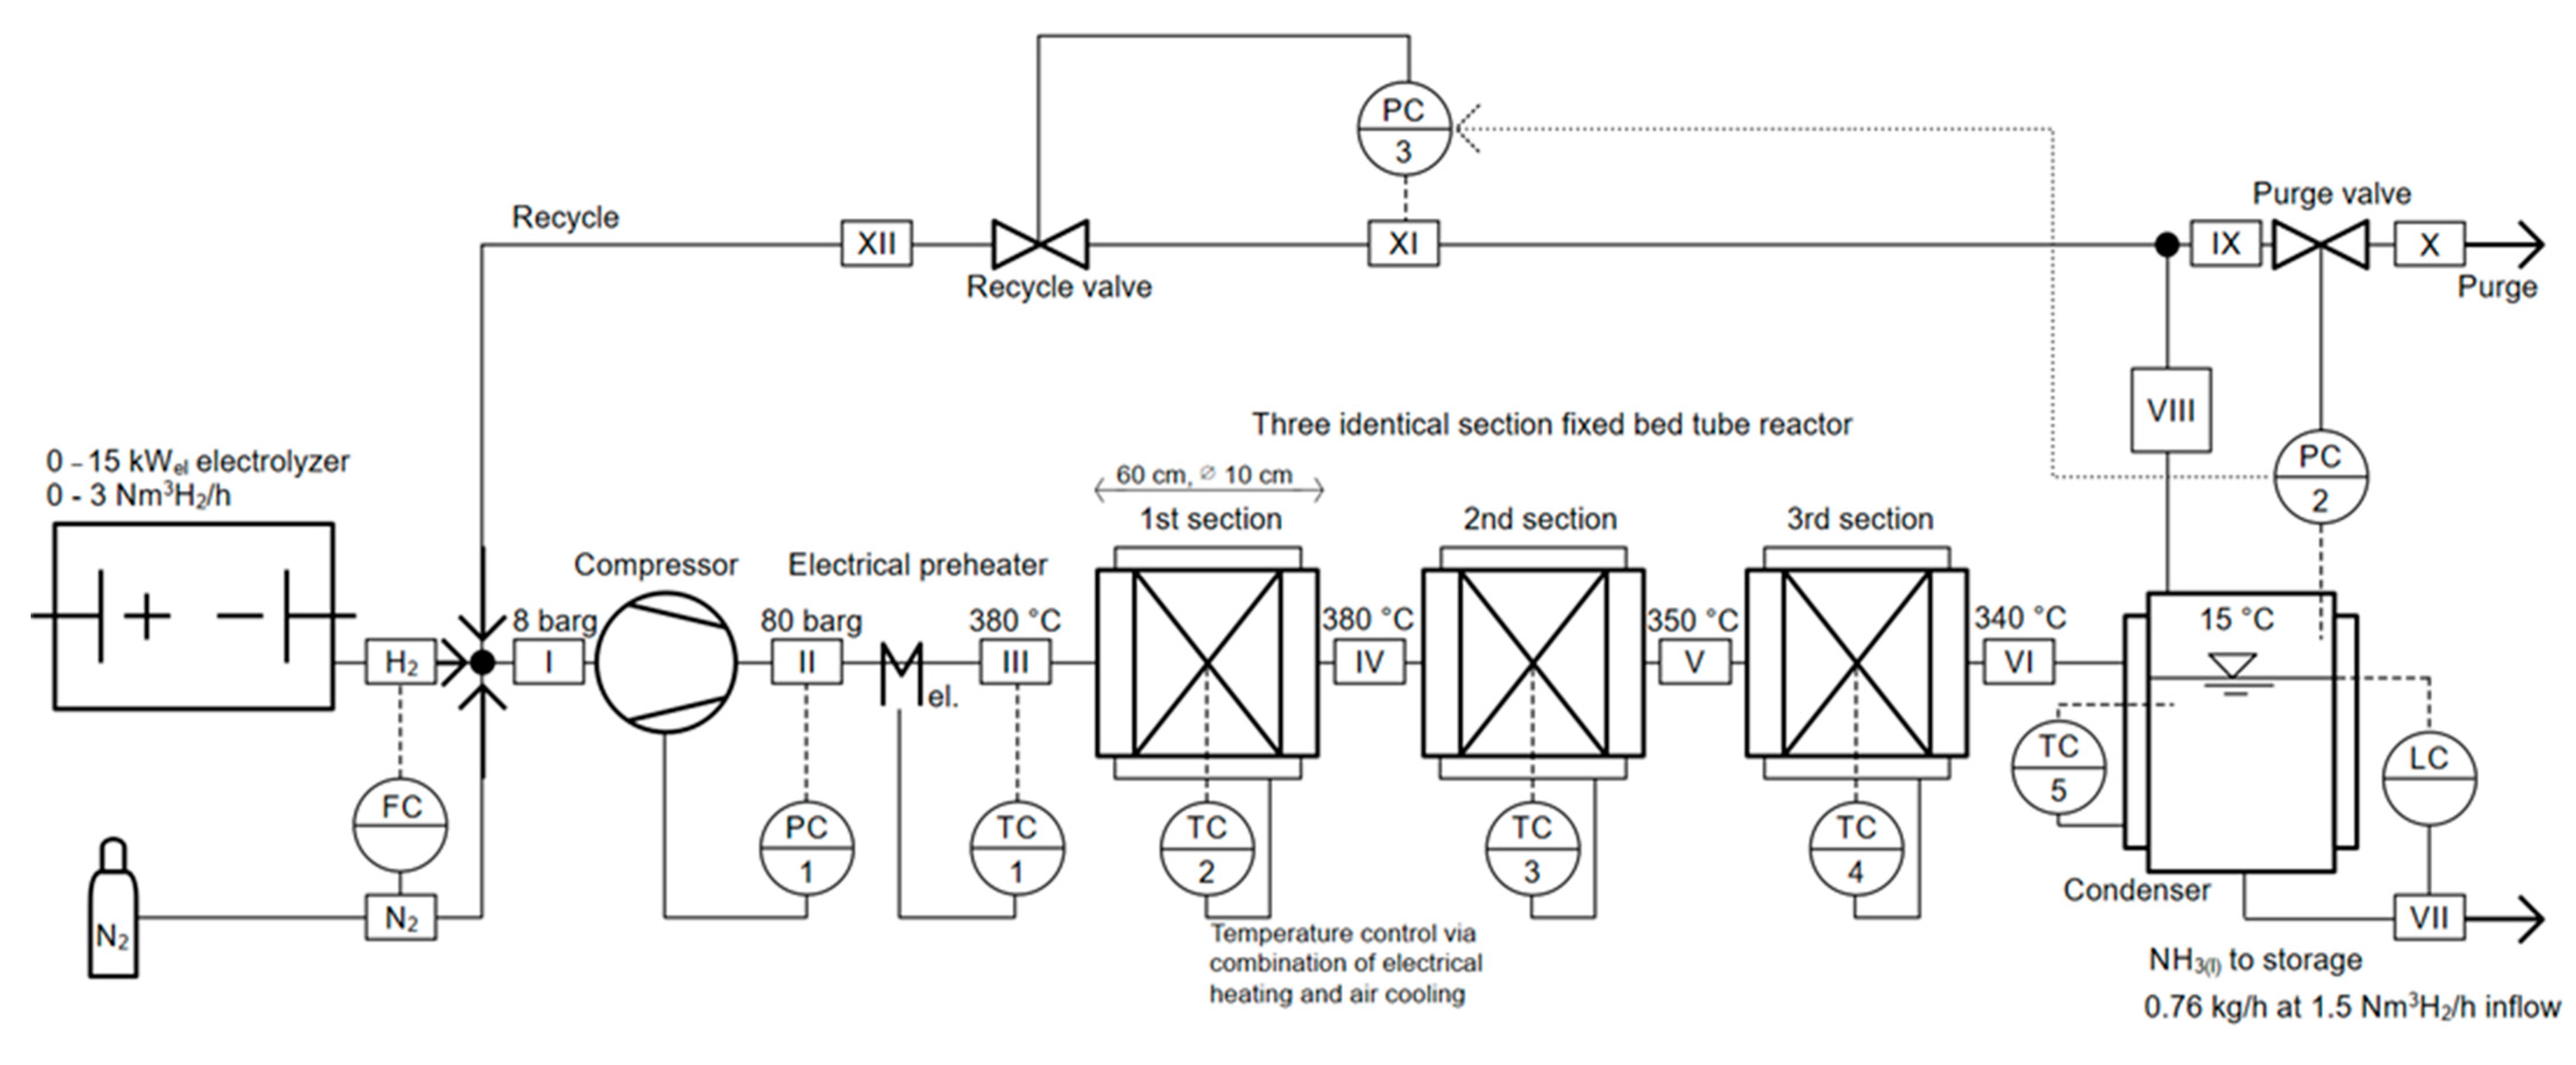
Figure 1. Process and control diagram of the P2A cycle.
Processes 11 00680 g001
Figure 2. Selected mass flows of scenario (a).
Processes 11 00680 g002
Figure 3. Further mass flows and position of the recycle valve (right vertical axis) of scenario (a).
Processes 11 00680 g003
Figure 4. Selected mass flows of scenario (b).
Processes 11 00680 g004
Figure 5. Further mass flows and position of the recycle valve (right vertical axis) of scenario (b).
Processes 11 00680 g005
Figure 6. Selected mole fractions of scenario (b).
Processes 11 00680 g006
Figure 7. Selected mass flows (left vertical axis) and condenser liquid level (right vertical axis) of scenario (c).
Processes 11 00680 g007
Figure 8. Further mass flows (left vertical axis) and position of the recycle valve (right vertical axis) of scenario (c).
Processes 11 00680 g008
Figure 9. Selected mass flows (left vertical axis) and condenser liquid level (right vertical axis) of scenario (d).
Processes 11 00680 g009
Figure 10. Selected mole fractions of scenario (d).
Processes 11 00680 g010
Figure 11. Selected pressure values of scenario (e).
Processes 11 00680 g011
Figure 12. Recycle mass flow and position of the recycle valve (left and right vertical axis) of scenario (e).
Processes 11 00680 g012
Figure 13. Percentage change of mass flows NH3 VII and X (left and right vertical axis) of scenario (e).
Processes 11 00680 g013
Figure 14. Selected pressure values of scenario (f).
Processes 11 00680 g014
Figure 15. Recycle mass flow (left vertical axis) and position of the recycle valve (right vertical axis) of scenario (f).
Processes 11 00680 g015
Figure 16. Percentage change of mass flows NH3 VII and X (left and right vertical axis) of scenario (f).
Processes 11 00680 g016
Figure 17. Condenser liquid level and position of the recycle valve (left and right vertical axis) of scenario (g).
Processes 11 00680 g017
Figure 18. Recycle mass flow and position of the recycle valve (left and right vertical axis) of scenario (g).
Processes 11 00680 g018
Figure 19. Percentage change of mass flows NH3 VII and X (left and right vertical axis) of scenario (g).
Processes 11 00680 g019
Figure 20. Condenser liquid level and position of the recycle valve (left and right vertical axis) of scenario (h).
Processes 11 00680 g020
Figure 21. Recycle mass flow (left vertical axis) and position of the recycle valve (right vertical axis) of scenario (h).
Processes 11 00680 g021
Figure 22. Percentage change of mass flows NH3 VII and X (left and right vertical axis) of scenario (h).
Processes 11 00680 g022
Figure 23. Temperatures of selected streams of scenario (i).
Processes 11 00680 g023
Figure 24. Selected mole fractions of scenario (i).
Processes 11 00680 g024
Figure 25. Selected NH3 mass flows of scenario (i).
Processes 11 00680 g025
Figure 26. Purge X and recycle XI mass flows and position of the recycle valve (left and right vertical axis) of scenario (i).
Processes 11 00680 g026
Figure 27. Temperatures of selected streams of scenario (j).
Processes 11 00680 g027
Figure 28. Selected mole fractions of scenario (j).
Processes 11 00680 g028
Figure 29. Selected NH3 mass flows of scenario (j).
Processes 11 00680 g029
Figure 30. Purge X and recycle XI mass flows and position of the recycle valve (left and right vertical axis) of scenario (j).
Processes 11 00680 g030
Table 1. Main differences between the novel and the more conventional P2A designs.
P2A DesignOperating FlexibilityCost of Investment
ConventionalRather lowRather high
The dynamic behavior of an internal gas-gas heat exchanger can be difficult due to the feedback of the internal loop brought to the system by this type of heat exchanger [35].The use of two compressors with about the same investment cost increases the overall investment cost by 20% [37].
NovelRather highRather low
The dynamic behavior of the electric preheater is fast and efficient. Further, feedback behavior is not to be expected, as there is no internal loop.The novel layout uses a recycle valve instead of a recycle compressor. The investment cost of such a valve is negligible.
Table 2. Main parameters of the novel P2A design and its implementation in Aspen Plus Dynamics®.
P2A Design
ElectrolyzerElectrical power input0–15kW
Hydrogen production0–3Nm3/h
ReactorsCatalystNovel iron-based catalyst [39]
Catalyst mass14kg
Length0.6m
Diameter0.1m
CondenserVolume10l
Aspen Plus Dynamics®
GeneralProperty methodModified HYSPR used by industry partners [39]
Type of controlsPID optimized with Ziegler–Nichols
Time integrationDefault Mixed Newton & Implicit Euler
CompressorIsentropic efficiency80%
Inlet pressure8barg
Outlet pressure80barg
ReactorsPressure drop correlationErgun
KineticsModified LLHW fitted to catalyst performance data (Equation (2), [39])
Optimal temperature profile380, 350, and 340 [39]°C
CondenserTemperature15°C
Initial liquid level50%
Disclaimer/Publisher’s Note: The statements, opinions and data contained in all publications are solely those of the individual author(s) and contributor(s) and not of MDPI and/or the editor(s). MDPI and/or the editor(s) disclaim responsibility for any injury to people or property resulting from any ideas, methods, instructions or products referred to in the content.