
Assessing Hyperloop Transport Optimizing Cost with Different Designs of Capsule


Department of Civil Engineering, College of Engineering, Taif University, Taif 21944, Saudi Arabia
Processes 2023, 11(3), 744; https://doi.org/10.3390/pr11030744
Submission received: 31 January 2023
/
Revised: 25 February 2023
/
Accepted: 1 March 2023
/
Published: 2 March 2023
(This article belongs to the Special Issue Energy Process Systems Simulation, Modeling, Optimization and Design)
Abstract
:Hyperloop technology is a transport mode designed to move passengers anywhere in the world, using electric propulsion to carry passengers through a vacuum/near-vacuum tube for a maximum speed of 1200 km/h. Given this, governments, engineers, researchers, and billionaires have been racing over the past years to obtain the first operational system in the world off the ground and bring it from concept to reality. The paper aimed to maximize the capacity of the Hyperloop’s capsule and identify a suitable design of Hyperloop technology based on the different capacities and speeds of the capsules as well as the assumptions of the initial annual demand. Additionally, significant attention will be paid to the interior design of the capsules in which people travel to make the journey more comfortable and enjoyable. The design will be conducted in AutoCAD and Autodesk Revit models based on the allocation of different components such as capacity, compressor fan, batteries, compressor motor, etc. The Hyperloop is powered by solar panels located on the top of the tube, which will allow the capsule to generate more energy based on its capacity than it needs to run. The optimizing cost of each design of the Hyperloop’s capsule will be considered using an MS Excel sheet. As a result, the Hyperloop capsule with a lower capacity (28 seats) has the highest value of optimizing cost due to the number of acquired capsules (38) compared to 25 capsules and 16 capsules for medium- and high-capacity capsules, respectively. The total annual cost of the Hyperloop’s capsules with different capacities of 28, 40, and 50 seats is EUR 5.6 million, EUR 5.5 million, and EUR 6.2 million, respectively, which is determined through the sum of the purchasing cost, operating cost and maintenance cost of capsules.
1. Introduction
The concept of the Hyperloop has a rich history reaching back to 1904, and the idea was re-initiated in 2013 by Elon Musk. It is open-sourced and was designed by his joint companies, Tesla and SpaceX, before other companies worldwide were encouraged to participate in the development of Hyperloop technology [1,2]. The Hyperloop transport system is defined as fast, comfortable, and efficient as well as the future of high-speed transportation [3]. It would be faster than airplanes, high-speed rail (HSR), Maglev, classic rail, and car, resulting in time savings due to the location of other transport mode stations in the suburbs of the major city, which requires extra time for passengers. Nevertheless, transportation between major cities by Hyperloop has been proposed as transportation for major cities [4,5]. The estimation of the potential demand will help the decision-makers in proposing new services to create an equilibrium between the objectives to be stretched and fulfilled by public resources [3].
The Hyperloop is known as the fifth transport mode after rail, road, water, and air modes and seeks to change the paradigm by being inexpensive and fast for people rather than expensive modes (e.g., air), slow modes (e.g., water and road), or a combination of expensive and slow modes (e.g., rail) [4]. From the perspective of Hyperloop development, the concept of the Hyperloop system is being significantly pushed to become a reality by different companies around the world, for example, Hyperloop Transportation Technologies (USA), Virgin Hyperloop One (USA), Transport (Canada), Hardt Hyperloop (The Netherlands), DP World Cargo Speed (UAE), etc. These companies need to maintain a full complement of developers, architects, engineers, and other personnel to get close to a commercial Hyperloop. Regarding the connection of the major cities to integrate labor markets and commercial activities, the Hyperloop system would be the most suitable transport mode as well as fully utilizing the capacity of national airports. The substantial effects on airport competition in long distance air transport markets should be taken into account in terms of particular economic impact assessments due to the interest shown by several local authorities and academics all over the world in regard to the development of Hyperloop services [2]. However, a capsule or pod is known as one of the essential components of Hyperloop technology aside from a tube and station, and it is designed to transport people at a very high speed. Moreover, the capsule is a tube pressurized at atmospheric pressure that runs substantially free of friction or air resistance inside the tube and is supported by pressurized air, a cushion of air, and aerodynamic lift [4].
The overall aim of this paper was to increase the capacity of the Hyperloop capsule by estimating the different sizes of the capsules and calculating their purchasing, operating, and maintenance costs. A majority of the optimizing cost was obtained from the operating cost of the capsule, followed by the purchasing cost and maintenance cost. For example, the operating cost of a capsule with a capacity of 50 seats was estimated at EUR 2.8 million, followed by EUR 2.1 million, and EUR 0.25 million for the purchasing cost and maintenance costs, respectively.
2. Literature Reviews
Numerous studies have been conducted to investigate the influence of different impact factors of the Hyperloop system such as the design of the capsule, safety issues, comfort, costs, commercial potential, regulatory and policy issues, aerodynamic drag, and environmental impact [4]. For trains, the aerodynamic drag and aerothermal environment can be reduced by a cross passage in the case of a single train passing. During the intersection of two trains, the train’s lateral force coefficient fluctuates more than the aerodynamic drag coefficient. In this case, the maximum lateral force coefficient of a single train passing is 0.349 times that of two trains crossing [6]. Recently, the HSR has become a popular transport mode due to its benefits of safety, speed, and comfort [7]. The rapid development of modern railway transport systems makes the dynamics problem of the railway track and vehicle systems more complicated and prominent, especially the dramatic increases in transportation density, hauling mass, and operating speed. In this case, the dynamic interaction between the track and vehicle becomes stronger when the operating speed of the train is higher, which will cause more problems in ride comfort and running safety [8]. For the evacuated tube transportation, the Maglev train model was used since there is no designed train based on the characteristics of high-temperature superconducting (HTS) Maglev and the appearance of a high-speed train. However, the influence of the tracks on the generation of the shock wave in terms of aerodynamic heating at the top surface was lower than the tail curve bottom [9]. The HTS Maglev train can cause serious aerodynamic thermal problems when it travels inside a closed tube, affecting traffic safety. The aerodynamic thermal of the HST Maglev-evacuated tube transport (ETT) system is affected by the speed, as the shock wave will appear at high speed [10]. It was found that the aerodynamic drag of the vehicle can be significantly reduced by lowering the air pressure [11]. For HSR, the carried wind tunnel tests were carried out on the aeroelastic model of the catenary system to study the wind vibration characteristics. The results show that the displacement response of the contact wire under uniform flow is lower than that under turbulent flow. The galloping of the overhead contact lines is also a big potential hazard to the normal operation of the electric railway, which is caused by aerodynamic instability that might form a large amplitude under the wind load [12].
In evacuated tube transportation, three nose lengths of 5 m, 10 m, and 15 m at 1500 km/h were examined for the flow structure and aerodynamic loads by overset mesh technology. As a result, the smallest shock intensity was recognized at the 10 m case, followed by the 15 m case, and the largest case at 5 m [7]. Ma, Tianhao et al. found that there was a linear relationship between the initial tube pressure and the range of the shock wave as the range increased with the increase in the pressure of the initial tube. For example, the pressure difference between the front and rear of the train was reduced by lowering the pressure in the tube, and the aerodynamic drag was also reduced [13]. In the future, evacuated tube transportation will have great potential because of its environmental protection and energy-saving advantages. A three-dimensional geometric and shear stress transport k–w turbulence model was presented to study the effect of the initial ambient temperature on the flow field structure in the tube. As a result, the shorter the flow temperature region in the wake, the higher the initial ambient temperature [14].
Hyperloop networks will contain links between main cities with the possibility of having intermediate stops and connections to other branches and lines. The cities located at the end of the route served by the Hyperloop system must have high economic productivity, and flat landscapes are needed for the corridor to operate the Hyperloop at its maximum speed of 1200 km/h. For the new Hyperloop infrastructure, the total amount of land required can be minimized by placing the corridor close to any infrastructure of existing transport [15]. Additionally, capsules can merge/diverge from/to different destinations through junctions, which will help the Hyperloop to reach its maximum transport capacity [2]. The maximum width of the Hyperloop passenger capsule is assumed to be about 1.35 m (4.43 ft), and the maximum height is 1.10 m (3.61 ft) with an equivalent frontal area of 1.4 m2 (15 ft2) [4]. The Hyperloop system is characterized by its transport capacity and traffic, as the capacity is defined as the maximum number of passengers who can be transported in one direction per unit of time [15].
Janic dealt with the estimation of direct energy consumption by the Hyperloop transport system as well as the related emissions of CO2 through developing analytical models that are dependent on mechanical energy. The Hyperloop system was assumed to be fully operational, as the estimated energy consumption and associated CO2 emissions of the system are based on the vehicle seating capacity, nonstop journey distance, and load factor [4]. The energy consumption of the Hyperloop system could be minimized through different operational strategies. A network of energy-autonomous capsules was considered with respect to the optimization problem representing the battery energy storage and propulsion systems of the capsule. With a minimum energy need of 25 Wh/passenger/km, the maximum operating power of the capsule’s propulsion system was determined for the proposed framework in the range of 1.7–5 MW [16].
In general, a one-kilometer Hyperloop system requires electrical energy of up to 1900 MWh per day for heavier freight and 500 to 600 MWh per day for passenger travel. Moreover, the peak power demand might be up to 2000 MW for heavier freight systems and in a range of 100 to 600 MW for passenger systems [5]. Magnetic levitation has been used recently by developers to reduce electromagnetic motors and rolling resistance to accelerate and decelerate capsules. Mostly, the power would be needed from the electricity grid during the initial launch and acceleration phases, as the kinetic energy is converted back into electric energy in regenerating braking [1]. The Hyperloop capsule would require power between 820 and 1980 MW to travel at 1200 km/h for an estimated weight of 26,000 kg [2]. Acceleration and deceleration are important factors in the design of the Hyperloop system with a value of 0.2 G, as shown in Table 1.
However, the input data for the application of the analytical models in terms of specific characteristics of the Hyperloop capsule such as the service frequency, nonstop journey distance, capacity, and some external conditions were taken from different secondary sources [4]. In the future, a major contribution will be made toward the development of Hyperloop capsules with better aerodynamic behavior, which requires less electrical energy to propel the capsule in evacuated tubes [17]. The validity of Hyperloop commercial claims was determined in relation to different components such as capacity, travel time, energy demand, land implications, passenger comfort, safety, and cost. In terms of capacity, it was suggested that each capsule can carry a maximum of 28 passengers and needs to depart every 2 min with a total of 840 passengers per hour. The capsules have to depart every 30 s during rush hours and reach a total of 3360 passengers per hour. Additionally, a capsule with a capacity of 40 seats was proposed by the Hyperloop Transportation Technology (HTT) company, which needs to depart every 40 s to reach a total of 3600 passengers per hour. Table 2 shows the capacity of different sizes of the Hyperloop capsule, resulting in a Hyperloop small capsule (28 seats) and a big capsule can have a service of 568 and 398 capsules to transport a maximum capacity of 15,904 and 16,520 passengers per day, respectively [18]. The number of Hyperloop capsules in operation would be determined via demand as well as the daily system operating hours and launch intervals [1].
Borges RM and Quaglietta E provided a comparative analysis of the capacity that the Hyperloop system can offer for different signaling systems and several operational scenarios. The Hyperloop capsules will be driven by an automatic train operation (ATO) to reach very high speeds and to operate capsules during their movement in platoons under both virtual coupling (VC) and moving-block (MB) signaling concepts.
Regarding energy demand, the Hyperloop was estimated to require about 50 MJ per passenger, as it could be self-sustaining through the use of renewable energy sources. For example, the solar array was estimated for the twin Hyperloop tubes with solar cells to supply around 57 MW of electrical power and consume an average of about 21 MW [18].
The calculation of the Hyperloop’s infrastructure construction costs depends on different elements such as the total length of the line, the number of stations and platforms, the number of tubes, the length of underground and elevated sections, the civil construction costs for the pillars, etc. For example, the unit cost of the Hyperloop for the line from Los Angeles to San Francisco in the USA with the purchase of capsules was estimated at EUR 170,000 per seat [19]. The investment cost of constructing tubes raised on pillars was estimated at EUR 25–35 million per km, whilst it was about EUR 70 million per km in the tunnels, and the average annual cost of a station was estimated at EUR 0.56 million per km, as presented in Table 3 [20].
The costs of the Hyperloop’s vehicles (capsules) are expressed per seat km and calculated for 28 seats per capsule, operating 15 h per day within an average distance of 600 km/h in the operating period. For example, the total cost of a vehicle in Table 4 is EUR 0.0075 per seat-km, resulting in EUR 0.006, EUR 0.0006, and EUR 0.0009 per seat-km of investment cost, maintenance cost, and operating and overhead costs, respectively [18].
For specific routes worldwide, the average cost was estimated to be EUR 76 million per kilometer for just the Hyperloop technology excluding land purchasing. For example, the construction costs were estimated at EUR 47 million per kilometer for the Abu Dhabi route, while it was predicted that it would cost EUR 59 million per kilometer for the underwater track from Helsinki to Stockholm [16]. In Poland, the cost of constructing the Hyperloop infrastructure would cost over EUR 46 billion for distances between 3000 and 30,000 km [2]. In 2018, Van Goeverden et al. studied the performances of the Hyperloop system and compared it to HSR and air passenger transport (APT) in terms of the financial, operational, environmental, and social performances. In this case, the operational results showed that the capacity of the capsule was low and implied a low utilization of the infrastructure. For a considered distance of 600 km, the cost of vehicles was estimated at EURR 0.008 seat-km for the Hyperloop, compared to EUR 0.031 seat-km and EUR 0.034 seat-km for HSR and APT, respectively. In terms of the social and environmental performance, the Hyperloop system was assumed to have zero GHG (CO2) emissions and less than 177 kWh/p-km of energy consumption [18]. The main contribution work of this paper was to increase the capacity of the Hyperloop system and make it a sustainable and competitive alternative to other long-distance transport systems such as Maglev, HSR, APT, etc.
3. Methods
The methodology of calculating the cost of building and operating a Hyperloop line is based mainly on the design of the Hyperloop capsule, which is determined by the structure, capacity, and the time passengers will take to embark and disembark. The Hyperloop has still developed transport technology in several countries such as the United States of America, the Netherlands, the United Arab Emirates, South Korea, Canada, etc., and looking at different capacity sizes is necessary.
3.1. Design of Capsule Layouts
The capacity (number of seats) of the capsule designed for Hyperloop services depends on the technical specifications envisaged by the manufacturers, and the specific requirements agreed with the prospective buyer. The increase in capacity will increase the size of the capsule, which will lead to an increase in the energy consumption and others as the length of the capsule and the number of seats vary with the capsule design. The capacity depends on the capsule layout and more precisely, on the division into different classes as well as on the dimensions of the tube, which should be kept reasonable by having a small spacing in the capsule. In general, three group sizes of the capsule layouts can be identified in this paper: low-capacity capsules (28 seats), medium-capacity capsules (40 seats), and high-capacity capsules (50 seats).
The first proposed layout of the Hyperloop capsule is a low-capacity capsule designed for a capacity of 28 seats with a length of 19.76 m, as shown in Figure 1, resulting from the frontal length and end of the capsule and the seat spaces of 8.96 m, 1.82 m, and 8.98 m, respectively. With rounded corners, the maximum width of the capsule was 3.06 m, as any components of propulsion or suspension were not included.
The second proposed layout of the Hyperloop capsule was designed for a capacity of 40 seats with a length of 22.48 m, as shown in Figure 2, resulting from the frontal length and end of the capsule, and the seat spaces of 8.95 m, 1.82 m and 11.69 m, respectively. The width of a medium-capacity capsule was about 2.54 m.
The third proposed layout of the Hyperloop capsule was designed for a capacity of 50 seats with a length of 25.01 m, as shown in Figure 3, resulting from the frontal length and end of the capsule, and the seat spaces of 8.96 m, 1.82 m, and 14.23 m, respectively.
As a result, the three design layouts show that the width was the same whilst the length was different, and was mainly based on the capacity of the capsule (number of seats).
3.2. Full Cost Model
The main objective of this paper was to determine an estimate of the optimizing cost of purchasing, operating, and maintaining a Hyperloop with the supply and demand conditions and technical characteristics. The optimizing costs (OC) can be divided into acquisition cost (HLA), operating cost (HLO), and maintenance cost (HLM). Formally, the total costs of the Hyperloop can be denoted as:
where
= Optimizing cost of Hyperloop (€/year);
= Acquisition cost of Hyperloop (€/year);
= Operating cost of Hyperloop (€/year);
= Maintaining cost of Hyperloop (€/year).
The optimizing cost of the Hyperloop system is generally dependent on the capacity (number of seats), the assumed travel demand, speed, distance, etc. In this case, the full cost model is explained as follows:
where
= Average useful life of each capsule unit (years);
= Initial year of opening the Hyperloop for public service (years);
= The number of capsules bought every year;
= Unit cost of purchasing capsule per seat (€);
= Average capacity of the capsule (number of seats);
= Social discount rate (%);
= Annual unit cost of operating capsule per seat (€);
= number of the purchased capsules;
= Annual unit cost of maintaining capsule per seat (€);
= Average distance travelled by each capsule (kilometers).
In this paper, the unit costs of purchasing, operating, and maintaining the Hyperloop system were mainly dependent on previous studies, and all values were assumed. The purchasing costs of the capsules depend on the multiplication of the number of capsules, capacity, and the average unit cost of purchasing capsules per seat. In this case, the number of purchased capsules was based on the operation cycle time of the capsule taken to turnaround along the travel line, service frequency, and the exogenous contingency factor of 1.5 associated with the risk of failing to deliver services. The daily service frequency per direction was determined through the estimated demand, the effective occupation capacity of a capsule, and the daily operating hours. The estimated daily demand per direction is dependent on the initial annual demand assumed and the number of days per year. On the other hand, the operating cost of the capsule was obtained by the multiplication of capsule capacity, service frequency, the average unit cost of the operating capsule, and the length of the corridor. Finally, the maintenance cost of the capsule can be found through the multiplication of the number of purchased capsules, the average unit cost of maintaining the capsule, and the average seat capacity.
4. Results and Discussion
As a part of the Saudi National Industrial Development and Logistics Program (NIDLP), in terms of improving the local, regional, and international connectivity of transport networks, the Hyperloop technology will be competitive with existing transport modes such as car, bus, rail, and air transport.
For simulation purposes, the individual travel demand within the origin-destination corridor is an endogenous variable, and it corresponds to an assumed initial demand of five million passengers per year for the initial year, starting at t = 5, and it is related to the case of developing countries. All the Hyperloop capsules are equal in terms of their shapes and main components and they operate in a single configuration. Under alternative capsule capacity assumptions of 28, 40, and 50 seats, the number of acquired capsules was obtained to be 38, 25, and 16 capsules based on the hourly service frequency of 16, 11, and 10 capsules, respectively.
In addition, the capsule turnaround time was included, and it was determined to be 1.58, 1.49, and 1.35 s, which depends on the assumed equal length of 412 kilometers (same as the Riyadh–Dammam length) and different speeds of 900, 1000, and 1200 km/h, respectively. In this paper, most of the parameters were based on previous studies such as speed, risk of failure, the average utilization of capsules, the unit costs of purchasing, operating, and maintaining capsules, etc. For example, the same value of the risk of failure of 1.5 was assumed for all three capsule sizes to provide services. Additionally, the load factor was dependent on the size of the capsule, as it increased with the decrease in capacity due to the limit of seats that can be reserved immediately. To have all values per year, the equation of capital recovery factor was used with an estimated value of 5 years, 35 years, 10%, and 3% for the construction period, cycle time, proportion cost on planning, and social discount rate, respectively.
The effective capsule occupation was determined at 25, 35, and 41 seats based on an assumed load factor of 90%, 87%, and 82%, respectively. Then, the corresponding initial values would be 38, 25, and 16 capsules with the effective occupation of 25, 35, and 41 seats, respectively, as shown in Figure 4.
In practice, the actual capsule provision in Hyperloop lines is generally affected by many project-specific parameters such as the distance of the corridor and the average commercial speed as the total travel time is reduced when the average speed is increased and vice versa. The number of capsules increases to 38 capsules when the speed is reduced to 900 km/h; on the other hand, increasing the speed to 1000 and 1200 km/h would imply that 25 and 16 capsules, respectively, would be needed, as shown in Figure 5.
With respect to the effective cost calculations, the acquisition unit cost of a capsule was assumed to be equal for all three-capacity sizes of EUR 55,456 per seat, giving a total annual acquisition cost of EUR 2.7 million, EUR 2.5 million, and EUR 2.1 million, respectively. The value of the purchasing capsules was converted to the annual value by using the capital recovery factor, as the social discount rate (i) and cycle time (t) were assumed to be 3% and 35 years, respectively, for all three seat-capacity capsules. Therefore, fewer capsules are needed when the capacity of the capsules increases, as shown in Figure 6.
On the other hand, the operating and maintenance costs of the capsule were mainly dependent on the demand along the line, which can be measured through the number of capsules. The average unit cost of operating a capsule and the length of the corridor were assumed to be EUR 4.6 and 412 kilometers for all three categories, respectively, based on previous studies [20], which are considered as two of the main parameters to calculate the operating costs in addition to the capsule capacities and transport service frequency on the same corridor over time. As a result, the capsule operating cost for all three capacity sizes (28, 40, and 50) was EUR 2.6 million, EUR 2.7 million, and EUR 2.8 million, respectively, as shown in Figure 7.
The operating cost is often cheaper for larger-sized capsules in some years, whereas it is too expensive in other years. For example, a capsule with 50 seats was 6% and 10% more expensive than one with 40 or 28 seats, respectively.
Finally, the maintenance cost of the capsule was measured through the number of acquired capsules that were previously obtained for all three capsule-sized categories of 38, 25, and 16 capsules. The average unit cost of maintaining a capsule of EUR 0.0006 was based on the study of Van Goeverden et al. (2018) and the average utilization of a capsule of 500,000 was assumed. As a result, the total maintenance costs for three capsule-sized machines were EUR 324.3 thousand, EUR 300.1 thousand, and EUR 247.7 thousand, respectively.
As shown in Figure 8, the larger-size capsules with a capacity of 50 seats were cheaper to maintain than capsules with capacities of 40 and 28 seats by 2% and 10%, respectively. In summary, the annual optimizing cost of the Hyperloop with different capacities was EUR 5.6 million, EUR 5.5 million, and EUR 6.2 million.
5. Conclusions
In conclusion, the calculation of the optimizing cost of the Hyperloop system using different seat capacities is dependent on the unit costs mentioned in the literature reviews. However, the total number of capsules needed is reduced with higher-capacity capsules; on the other hand, their operating and maintenance costs could be higher, particularly if they are more intensively used.
As a result, 48.7% of the Hyperloop capsule’s optimizing costs for a distance of 412 kilometers resulted from the purchasing costs. In addition, the rest of the cost outcomes were the result of the operating cost and maintenance cost of the Hyperloop capsule, which were 45.5 % and 6.0%, respectively. In comparison, the total capsule cost of low-capacity capsules was the highest at EUR 5.6 million compared to the medium and high-capacity capsules with a value of EUR 5.5 million and EUR 5.2 million, respectively.
In terms of the limitations, the Hyperloop is still in the development stage, and the results are based on estimated values rather than the most efficient ones, just as the initial demand value was assumed to be five million passengers. The unit cost of purchasing, operating, and maintaining the Hyperloop capsule was based on an assumption used by other researchers. In terms of comparing this study with others, most of the previous studies focused on different topics such as the characteristics of Hyperloop capsules, the costs of constructing a Hyperloop line, etc.
Funding
This research received no external funding.
Institutional Review Board Statement
Not applicable.
Informed Consent Statement
Not applicable.
Data Availability Statement
Not applicable.
Acknowledgments
The researcher would like to acknowledge the Deanship of Scientific Research, Taif University, for funding this work.
Conflicts of Interest
The author declares no conflict of interest.
References
- Tbaileh, A.; Elizondo, M.; Kintner-Meyer, M.; Vyakaranam, B.; Agrawal, U.; Dwyer, M.; Samaan, N. Modeling and Impact of Hyperloop Technology on the Electricity Grid. IEEE Trans. Power Syst. 2021, 36, 3938–3947. [Google Scholar] [CrossRef]
- Bhuiya, M.A.; Youssef, M.Z. Initial Propulsion System Study for the Futuristic Hyperloop Transportation System: Design, Modeling, and Hardware in the Loop Verification. IEEE Access 2022, 10, 104050–104066. [Google Scholar] [CrossRef]
- Agrawal, P.; Pravinvongvuth, S. Estimation of Travel Demand for Bangkok–Chiang Mai Hyperloop Using Traveler Surveys. Sustainability 2021, 13, 14037. [Google Scholar] [CrossRef]
- Musk, E. Hyperloop Alpha. 2013. Available online: http://www.spacex.com/sites/spacex/files/hyperloop_alpha-20130812.pdf (accessed on 12 August 2013).
- Taylor, C.L.; Hyde, D.J.; Barr, L.C. Hyperloop Commercial Feasibility Analysis: High-Level Overview; John, A., Ed.; Volpe National Transportation System Centre: Cleveland, OH, USA, 2016. [Google Scholar]
- Hu, X.; Deng, Z.; Zhang, W. Effect of cross passage on aerodynamic characteristics of super-high-speed evacuated tube transportation. J. Wind. Eng. Ind. Aerodyn. 2021, 211, 104562. [Google Scholar] [CrossRef]
- Hu, X.; Deng, Z.; Zhang, J.; Zhang, W. Aerodynamic behaviors in supersonic evacuated tube transportation with different train nose lengths. Int. J. Heat Mass Transf. 2022, 183, 122130. [Google Scholar] [CrossRef]
- Zhai, W. Vehicle–Track Coupled Dynamics Models; Springer: Gateway East, Singapore, 2020. [Google Scholar]
- Hu, X.; Deng, Z.; Zhang, J.; Zhang, W. Effect of tracks on the flow and heat transfer of supersonic evacuated tube maglev transportation. J. Fluids Struct. 2021, 107, 103413. [Google Scholar] [CrossRef]
- Wang, J.; Bao, S.; Hu, X.; Li, H.; Deng, Z. Numerical Study on the Influence of the Speed on the Aerodynamic Thermal in the HTS Maglev–Evacuated Tube Transport System. IEEE Trans. Appl. Supercond. 2021, 31, 1–4. [Google Scholar] [CrossRef]
- Ma, T.; Wang, B.; Hu, X.; Wang, J.; Rao, Y.; Zheng, J.; Deng, Z. Aerodynamic drag characteristics of the HTS maglev vehicle running in a low air-pressure tube. In Proceedings of the 2020 IEEE International Conference on Applied Superconductivity and Electromagnetic Devices (ASEMD), Tianjin, China, 16–18 October 2020; pp. 1–2. [Google Scholar]
- Duan, F.; Song, Y.; Gao, S.; Liu, Y.; Chu, W.; Lu, X.; Liu, Z. Study on Aerodynamic Instability and Galloping Response of Rail Overhead Contact Line Based on Wind Tunnel Tests. IEEE Trans. Veh. Technol. 2023, 1–11. [Google Scholar] [CrossRef]
- Ma, T.; Hu, X.; Wang, J.; Rao, Y.; Zheng, J.; Deng, Z. Effect of Air Pressure on Aerodynamic Characteristics of the HTS Maglev Running in a Tube. IEEE Trans. Appl. Supercond. 2021, 31, 1–4. [Google Scholar] [CrossRef]
- Bao, S.; Hu, X.; Wang, J.; Ma, T.; Rao, Y.; Deng, Z. Numerical study on the influence of initial ambient temperature on the aerodynamic heating in the tube train system. Adv. Aerodyn. 2020, 2, 1–18. [Google Scholar] [CrossRef]
- Xie, Q.; Zhi, X.; Li, H.; Sun, Q.; Xiao, Y. Wind tunnel test on aeroelastic model of catenary system for high speed railway. China Railw. Sci. 2015, 36, 73–80. [Google Scholar] [CrossRef]
- Janić, M. Estimation of direct energy consumption and CO2 emission by high-speed rail, transrapid maglev and hyperloop passenger transport systems. Int. J. Sustain. Transp. 2021, 15, 696–717. [Google Scholar] [CrossRef]
- Jain, A. A Study of the Effect of Shape on the Aerodynamic Performance of Hyperloop Pod. 2019. Available online: https://ufdcimages.uflib.ufl.edu/UF/E0/05/60/36/00001/Jain_A.pdf (accessed on 1 December 2019).
- Walker, R. Hyperloop: Cutting through the Hype. 2018. Available online: https://trl.co.uk/uploads/trl/documents/ACA003-Hyperloop.pdf (accessed on 8 June 2018).
- Hansen, I.A. Hyperloop transport technology assessment and system analysis. Transp. Plan. Technol. 2020, 43, 803–820. [Google Scholar] [CrossRef]
- Van Goeverden, K.; Milakis, D.; Janic, M.; Konings, R. Analysis and modelling of performances of the HL (Hyperloop) transport system. Eur. Transp. Res. Rev. 2018, 10, 41. [Google Scholar] [CrossRef]
Figure 1.
Low-capacity capsule.
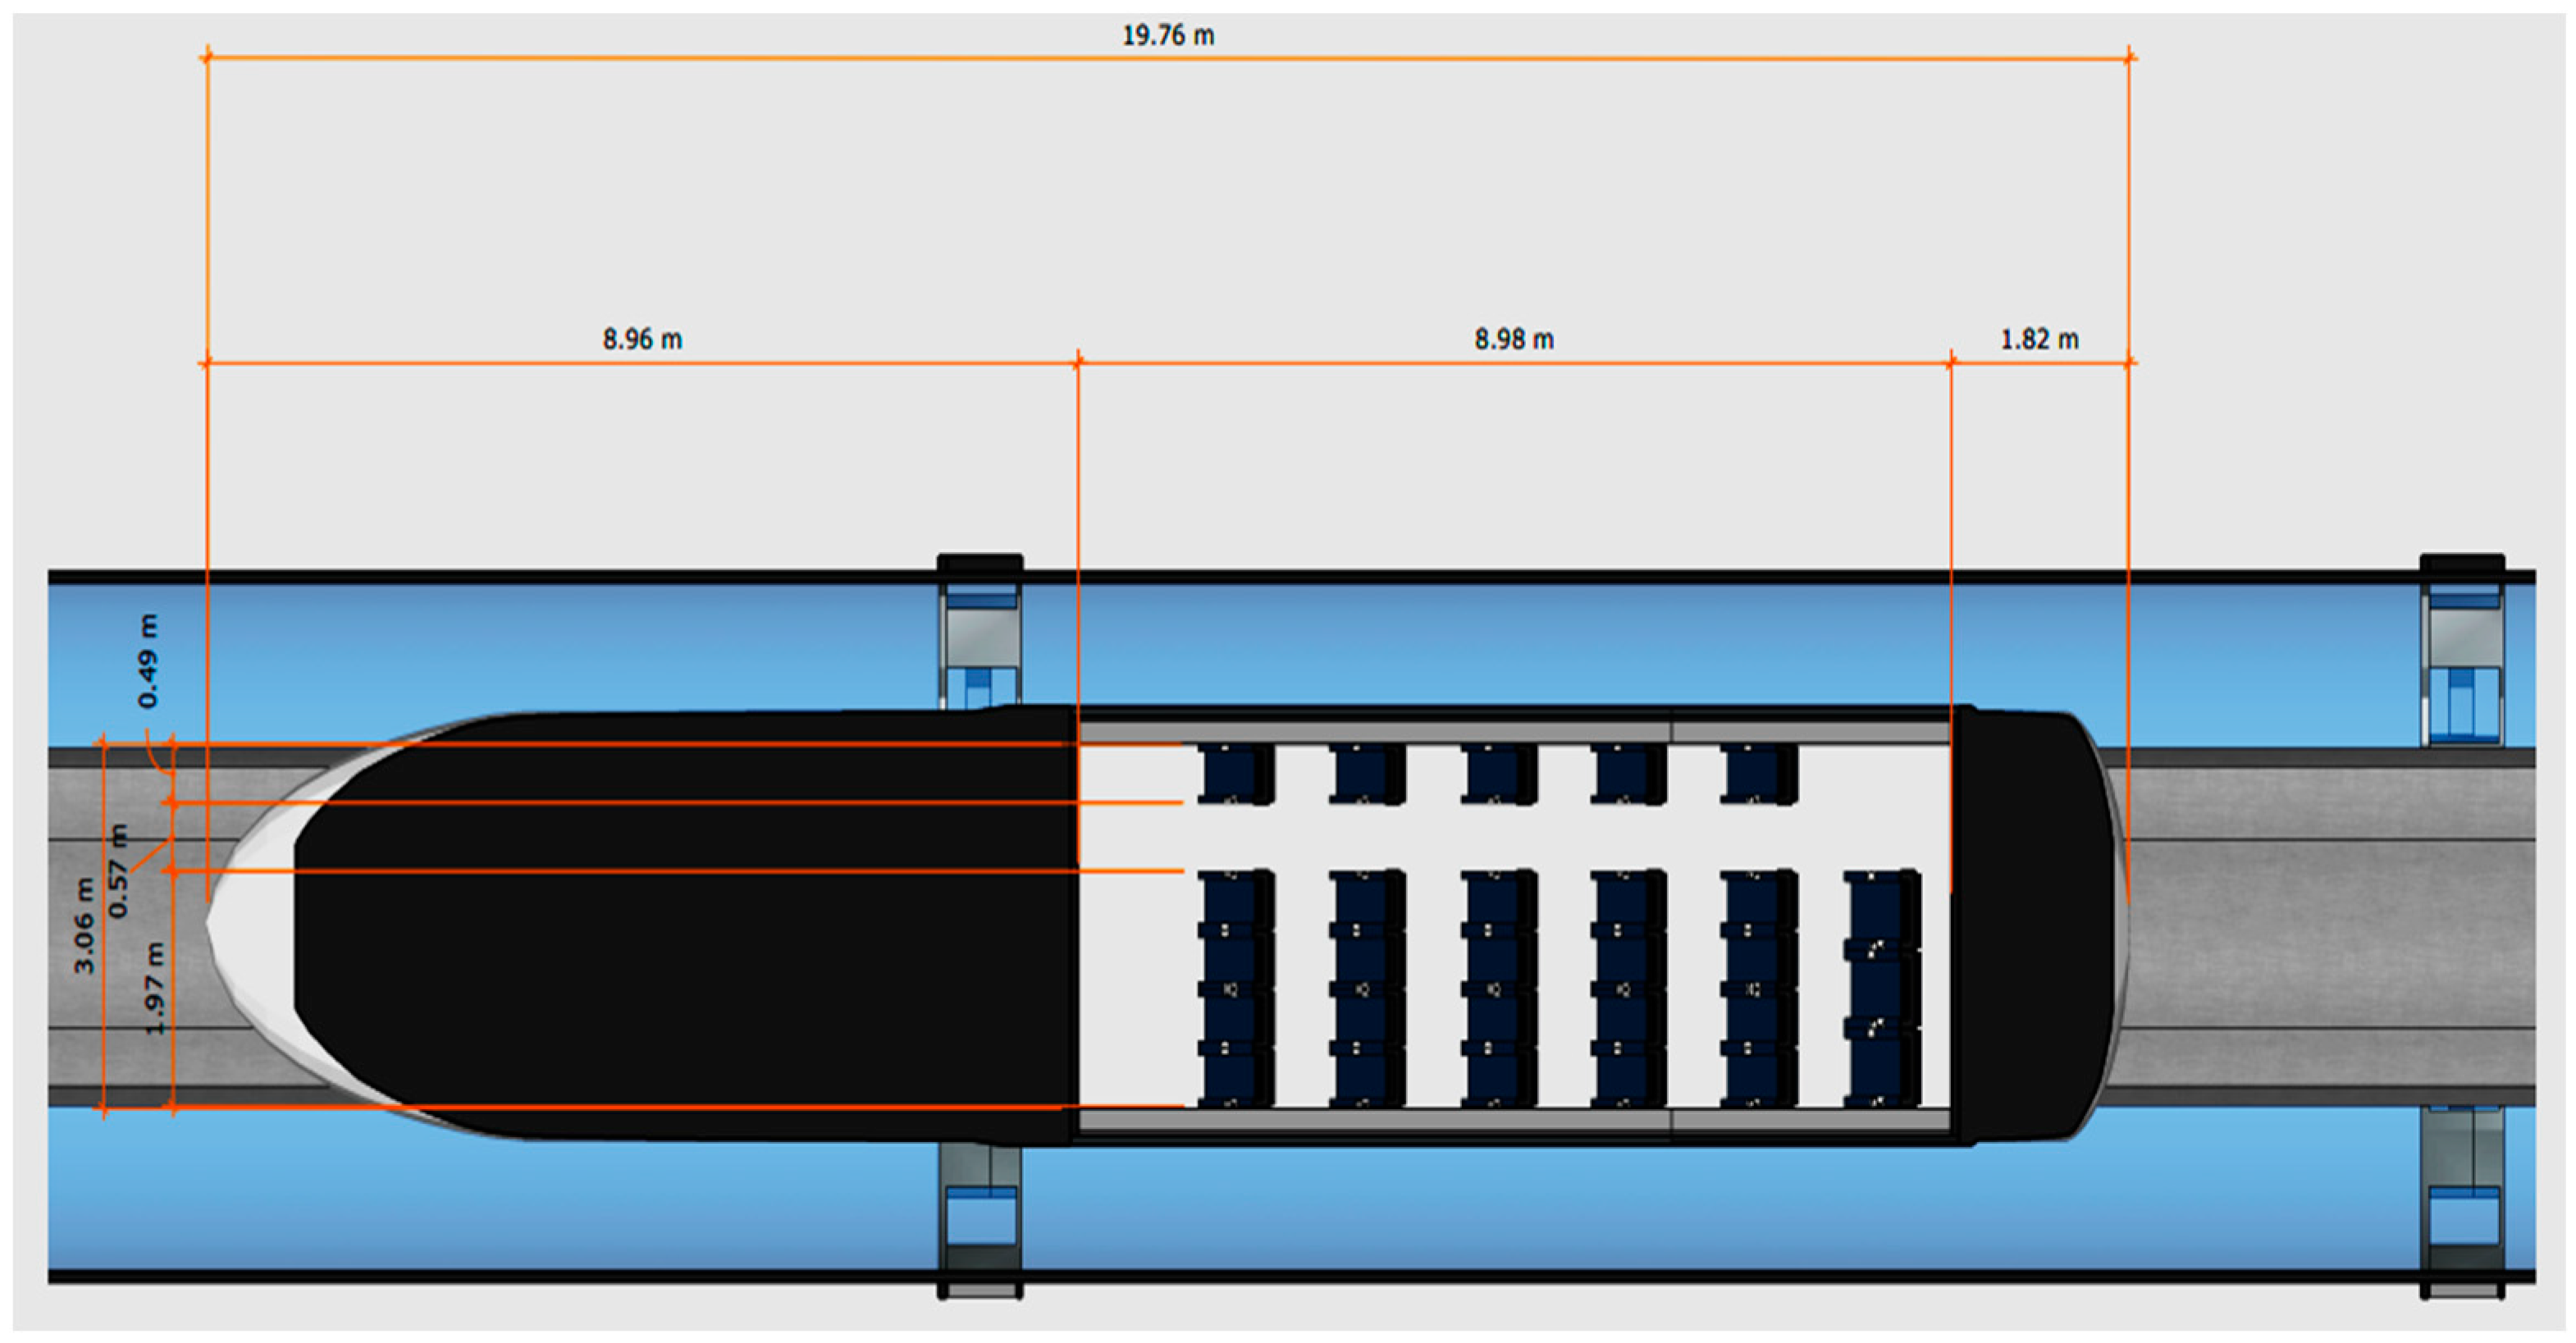
Figure 2.
Medium-capacity capsule.

Figure 3.
High-capacity capsule.

Figure 4.
The number of capsules needed under alternative capacity assumptions.

Figure 5.
The number of capsules needed under alternative speed assumptions.

Figure 6.
Acquisition costs per year under alternative capsule capacities.

Figure 7.
Operating costs per year under alternative capsule capacities.

Figure 8.
Maintenance costs per year under alternative capsule capacities.


Table 1.
General parameters for the design of the Hyperloop system [2].
Table 1.
General parameters for the design of the Hyperloop system [2].
| Parameter | Value |
|---|---|
| Acceleration | 1.96 m/s2 or 0.2 G |
| Deceleration | 1.96 m/s2 or 0.2 G |
| Steady state velocity | 300 m/s |
| Distance | 615 km |
Table 2.
Analysis of the passenger capacity for different capsule sizes [18].
Table 2.
Analysis of the passenger capacity for different capsule sizes [18].
| Transport Mode | Capacity | Departure Times | Service per Day | Service per Hour | Departure Frequency | Capacity per Day |
|---|---|---|---|---|---|---|
| Hyperloop small capsule | 28 | 5:30 am–10:00 pm | 568 | 32 | Every 113 s | 15,904 |
| Hyperloop big capsule | 40 | 5:30 am–10:00 pm | 398 | 22 | Every 163 s | 16,520 |
Table 3.
Analysis of the passenger capacity for different capsule sizes [20].
Table 3.
Analysis of the passenger capacity for different capsule sizes [20].
| Cost Element | Investment Cost (EUR Million/km) | Annual Cost (EUR Million/km) | |
|---|---|---|---|
| Capsule | 116 | 4.64 | |
| Station | 4.76 | 0.58 | |
| Track Infrastructure | Pillars, solid soil | 25 | 0.92 |
| Pillars, weak soil | 35 | 1.28 | |
| Tunnel | 70 | 2.57 | |
Table 4.
Analysis of passenger capacity for different capsule sizes [18].
Table 4.
Analysis of passenger capacity for different capsule sizes [18].
| Cost Element | Investment Cost (EUR) | Maintenance Cost (EUR) | Operating and Overhead Cost (EUR) | Total Cost (EUR) | |
|---|---|---|---|---|---|
| Capsule | Vehicle | 580,000 | 58,000 | 82,500 | 720,500 |
| Seat | 21,000 | 2100 | 3000 | 26,100 | |
| Seat-km | 0.006 | 0.0006 | 0.0009 | 0.0075 |
Disclaimer/Publisher’s Note: The statements, opinions and data contained in all publications are solely those of the individual author(s) and contributor(s) and not of MDPI and/or the editor(s). MDPI and/or the editor(s) disclaim responsibility for any injury to people or property resulting from any ideas, methods, instructions or products referred to in the content. |
© 2023 by the author. Licensee MDPI, Basel, Switzerland. This article is an open access article distributed under the terms and conditions of the Creative Commons Attribution (CC BY) license (https://creativecommons.org/licenses/by/4.0/).
Share and Cite
MDPI and ACS Style
Almujibah, H. Assessing Hyperloop Transport Optimizing Cost with Different Designs of Capsule. Processes 2023, 11, 744. https://doi.org/10.3390/pr11030744
AMA Style
Almujibah H. Assessing Hyperloop Transport Optimizing Cost with Different Designs of Capsule. Processes. 2023; 11(3):744. https://doi.org/10.3390/pr11030744
Chicago/Turabian StyleAlmujibah, Hamad. 2023. "Assessing Hyperloop Transport Optimizing Cost with Different Designs of Capsule" Processes 11, no. 3: 744. https://doi.org/10.3390/pr11030744
Note that from the first issue of 2016, this journal uses article numbers instead of page numbers. See further details here.