Article

Effect of Air-Drying and Freeze-Drying Temperature on the Process Kinetics and Physicochemical Characteristics of White Mulberry Fruits (Morus alba L.)

1
Department of Thermal Technology and Food Process Engineering, University of Life Sciences in Lublin, 31 Głęboka St., 20-612 Lublin, Poland
2
Department of Biochemistry and Food Chemistry, University of Life Sciences in Lublin, 8 Skromna St., 20-704 Lublin, Poland
3
Department of Food Engineering and Process Management, Institute of Food Sciences, Warsaw University of Life Sciences (SGGW), Nowoursynowska 159c, 02-776 Warsaw, Poland
*
Author to whom correspondence should be addressed.
Processes 2023, 11(3), 750; https://doi.org/10.3390/pr11030750
Submission received: 4 February 2023 / Revised: 1 March 2023 / Accepted: 2 March 2023 / Published: 3 March 2023
(This article belongs to the Special Issue Current Trends in Food and Food Byproducts Processing)

Abstract

:
Mulberry fruits (MF) contain many biologically active compounds beneficial for human health. In particular, in the literature, there are no studies on the kinetics of the freeze-drying of MF and the effect of the process temperature on the properties of dried fruits. The objective of this study was to ascertain how freeze-drying (FD) and air-drying temperature affected the kinetics of dehydration and chosen physicochemical parameters of MF. Both temperature and dehydration methods significantly influenced the drying rate and properties of MF. The Midilli model was the best fitted to the experimental data of the course of drying curves and with the lowest values of mean-square error. The highest lightness and yellowness were noted for freeze-dried fruit, whereas air-dried MF were characterized by the highest redness. An increase in drying temperature significantly changed the color of fruits and led to the degradation of L-ascorbic acid content. The highest content of L-ascorbic acid was found in fresh fruits (214 ± 4 mg/100 g dry mass (DM)) and freeze-dried fruits at 30 °C (182 ± 3 mg/100 g DM). Both FD and AD drying significantly reduced the content of this compound. The lowest reduction in L-ascorbic acid was observed for freeze-dried fruits. Fruits freeze-dried at 30 °C showed the highest content of total phenolics and antioxidant capacity.

1. Introduction

White mulberry (Morus alba L.) is a small tree native to Southeast Asia. Currently, it is common in tropical-to-temperate regions [1,2]. The range of the white mulberry reaches from lowland areas to an altitude of about 4000 m above sea level. Its species name is associated with the whitish color of the bark. Mulberry fruits can be white, pink, purple, and black [3]. Chinese sources say that mulberries were already known 2600 BC. and were initially used for breeding silkworms. Mulberry leaves, bark, and fruits have been used in natural Chinese medicine for many years [4]. Mulberry fruits (MF) are a rich source of well-absorbed carbohydrates, proteins, minerals, and vitamins. They also contain compounds with potential health benefits: polyphenols, flavonoids, anthocyanins, and a significant amount of antioxidant compounds [5,6]. Due to the significant quantities of health-promoting ingredients, mulberry fruits are used in preparations with anti-inflammatory, anti-cancer, anti-diabetic, liver-protecting, eyesight-improving, and slimming preparations [7,8,9,10,11].
Mulberries are harvested in a very short time, usually by shaking the trees. Ripe fruits are soft, prone to damage and susceptible to mold growth. The storage time of MF in refrigerated conditions is a maximum of several days, therefore, MF are usually processed immediately after harvesting. The main directions of processing are the production of juices, dried fruits, pastes, jams, and wine [12,13,14].
The main producers of dried mulberries are Asian countries (Turkey, Pakistan, and China). In these countries, on an industrial scale, the drying process is most often carried out in natural conditions with good insolation [12,15]. This drying method is mainly used due to the low cost of the process. However, it has many disadvantages resulting from the instability of the drying process, weather conditions, and the risk of damage or destruction of the product by pests and pathogens [15]. For this reason, natural drying may contribute to significant losses of bioactive substances contained in MF [6]. The improvement of unfavorable drying conditions, while reducing energy expenditure, can be achieved by carrying out the drying process with the use of solar radiation in solar dryers [15,16,17]. Hot air drying of mulberry fruits is also quite common and carried out in various types of devices [18,19]. Taking into account the best possible preservation of the physicochemical properties of dried MF, the dehydration process is more and more often carried out using vacuum [20,21], freeze [22], and microwave dryers [23]. Attempts have also been made to dehydrate these fruits using hybrid drying [22,24].
According to the available literature, many models can be used for the description of the drying kinetics of different kinds of food [14]. The Newton [25] and the Page [26] equations are frequently used. Some authors propose modifications of those models, e.g., the Pabis and Henderson equation [27], the logarithmic equation [28], the Wang and Singh equation [29], the Midilli equation [30], and the logistic equation [31] are also used for the description of the drying course. However, there is no information on the impact of different dehydration methods and temperatures on the drying process and the physicochemical properties of the dried MF. Therefore, this study aimed to determine the effect of the temperature of air-drying and freeze-drying of mulberries on the kinetics of the process and the selected physicochemical properties of dried fruits.

2. Materials and Methods

2.1. Raw Material

Mulberry fruits were obtained from wild trees in the vicinity of Lublin, Poland. The raw material was harvested at full maturity in July 2021. Selected, undamaged fruits were subjected to convection drying immediately after harvesting; fruits intended for freeze-drying were frozen in the Liebherr GTL-4905 freezer chamber (Gothenburg, Sweden) at −30 °C.

2.2. Dry Matter Content

The dry matter content (DM) of MF was determined in accordance with the Association of Official Analytical Chemists (AOAC), method 934.06 [32] using a Pol-Eko dryer, SLW 53 STD (Wodzisław Śląski, Poland).

2.3. Drying Process

Both freeze-drying (FD) and air-drying (AD) of MF were performed. The FD process was carried out in a freeze dryer Alpha 1–4 Martin Christ (Gefriertrocknungsanlagen GmbH, Osterode am Harz, Germany) with a one-sided contact method of heat supply [33]. Three different temperatures of the heating plates were applied (30, 50, and 70 °C) with the pressure in the drying chamber equal 60 Pa. During FD, the process was carried out until the moisture content of the MF was 5% (±0.2%).
In the case of AD, the single layer of fresh MR was air-dried at 40 °C, 50 °C, and 70 °C at air flow of 0.5 ms−1 using a convection dryer (Promis-Tech, Wroclaw, Poland) until the moisture content of the dried fruits was 10 % (±0.2%). The minimum temperature of AD was increased in relation to freeze-drying to 40 °C because preliminary tests showed that air-drying at 30 °C is long-lasting and does not allow for the achievement of the assumed final moisture content of 10%. We did not stop the FD process at 10% moisture content of the samples due to the possibility of incomplete ice sublimation from MF, and, thus, possible local microbial growth in the samples.
With both methods of drying, the 100 g samples of MF were used and changes in the weight of the dried fruit samples were recorded during the process. A detailed description of used FD and AD methods was presented by Krzykowski et al. [34].

2.4. Modeling of Drying Curves

Based on changes in the reduced water content (MR), the drying process’ kinetics was determined:
MR = u t u 0  
where ut denoted the water content in the course of drying (kg H2O/kg DM), and u0 is the initial water content (kg H2O/kg DM). In this equation, the equilibrium water content (ur) was neglected because the value of ur is negligible compared to the values of u0 and ut. Such a simplification is commonly used and does not have a major impact on the results of drying kinetics [35].
Seven equations frequently cited in the literature were examined in order to choose the best mathematical model representing the sublimation and convection drying kinetics of white mulberry fruit (Table 1).

2.5. Color Coordinates

The color coordinates of the raw and dried MF were determined in the CIE L*a*b* colorimetric system [33], which allows to determine the lightness (L*) color, as well as the color change from green to red (a*) and from blue to yellow (b*). Before the color measurements, the samples were ground and homogenized to a powder in the GM-200 laboratory mill (Retsch, Dusseldorf, Germany). The value of the total color difference (ΔE) of individual samples in relation to the raw material was also determined [34]. The moisture content of the samples before the test was established at 10% (±0.2%).

2.6. Total Ascorbic Acid Content

The total ascorbic acid (TAC) content was calculated as the sum of L-ascorbic acid and L-dehydroascorbic acid in mg/100 g DM of the product using the HPLC method [36]. Briefly, 2 mL of 50% (w/v) m-phosphoric acid was used to extract 1 g of dried MF. The mixture was centrifuged for 15 min (16,000× g). The procedure was repeated two times and supernatants were combined. The obtained extract was divided into two parts. The first part was used for the determination of ascorbic acid and the second for the evaluation of TAC after reduction of L-dehydroascorbic acid (DA). Overall, 100 mM tris (2-carboxyethyl) phosphine was used to convert L-dehydroascorbic acid to ascorbic acid. Quantitative determinations were carried out by calculation of the external standard using calibration curve of the standard.

2.7. Total Phenolics Content and Antioxidant Capacity

Methanolic extracts of fresh and dried MF were prepared for the determination of total phenolics content (TP) and antioxidant capacity (AC). Folin–Ciocalteu assay was used to determine TP in the prepared extracts, and the content of TP was expressed as milligrams GAE (gallic acid equivalent) per g of DM (dry mass) [37]. Antiradical activities against ABTS and DPPH radicals were also evaluated according to [38] and expressed as the EC50 index (mg DM/mL) [39].

2.8. Statistical Analysis of Data

Drying kinetics of MF was presented as average values from three repetitions, whereas the other analyses concerning the quality of dried fruit were performed in five repetitions. The mean values and standard deviations were calculated. For statistical evaluation of data, a one-way analysis of variance and Tukey’s test were conducted with a significance level of α = 0.05.
For the evaluation of drying kinetics of MF, the regression analysis was performed and the coefficient of determination (R2), mean-square error (RMSE), and chi-quadrate test (χ2) RMSE and χ2 were determined [34].

3. Results and Discussion

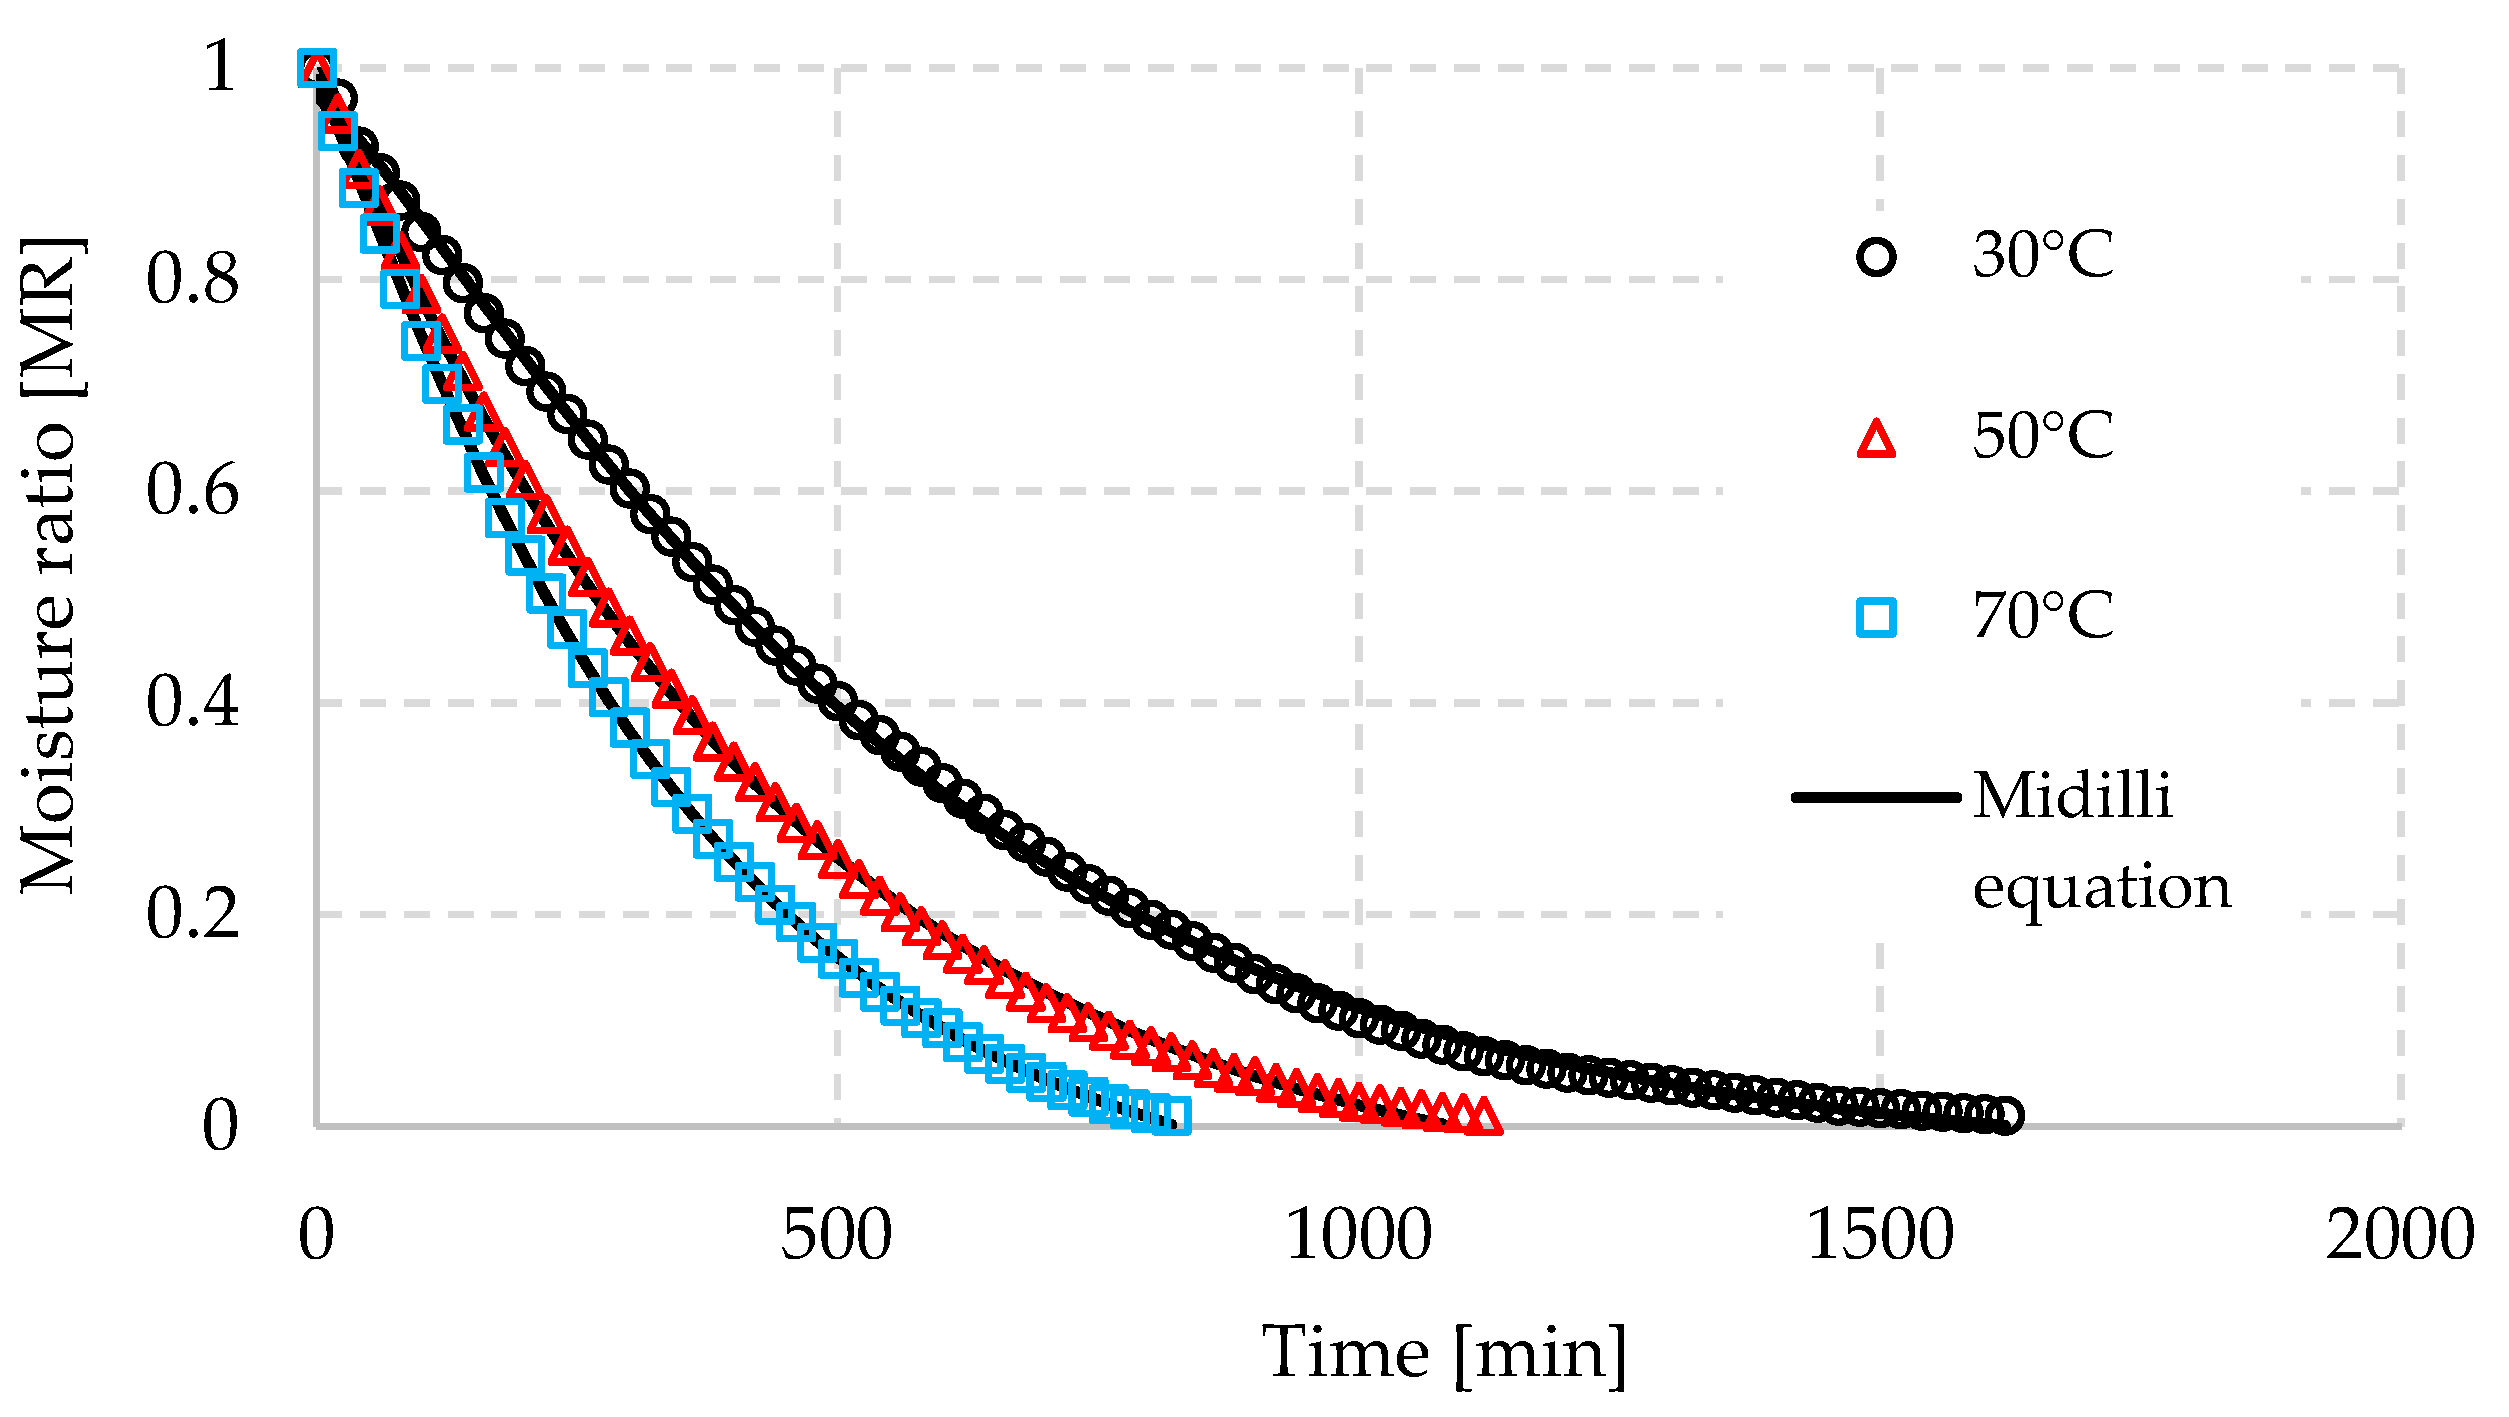
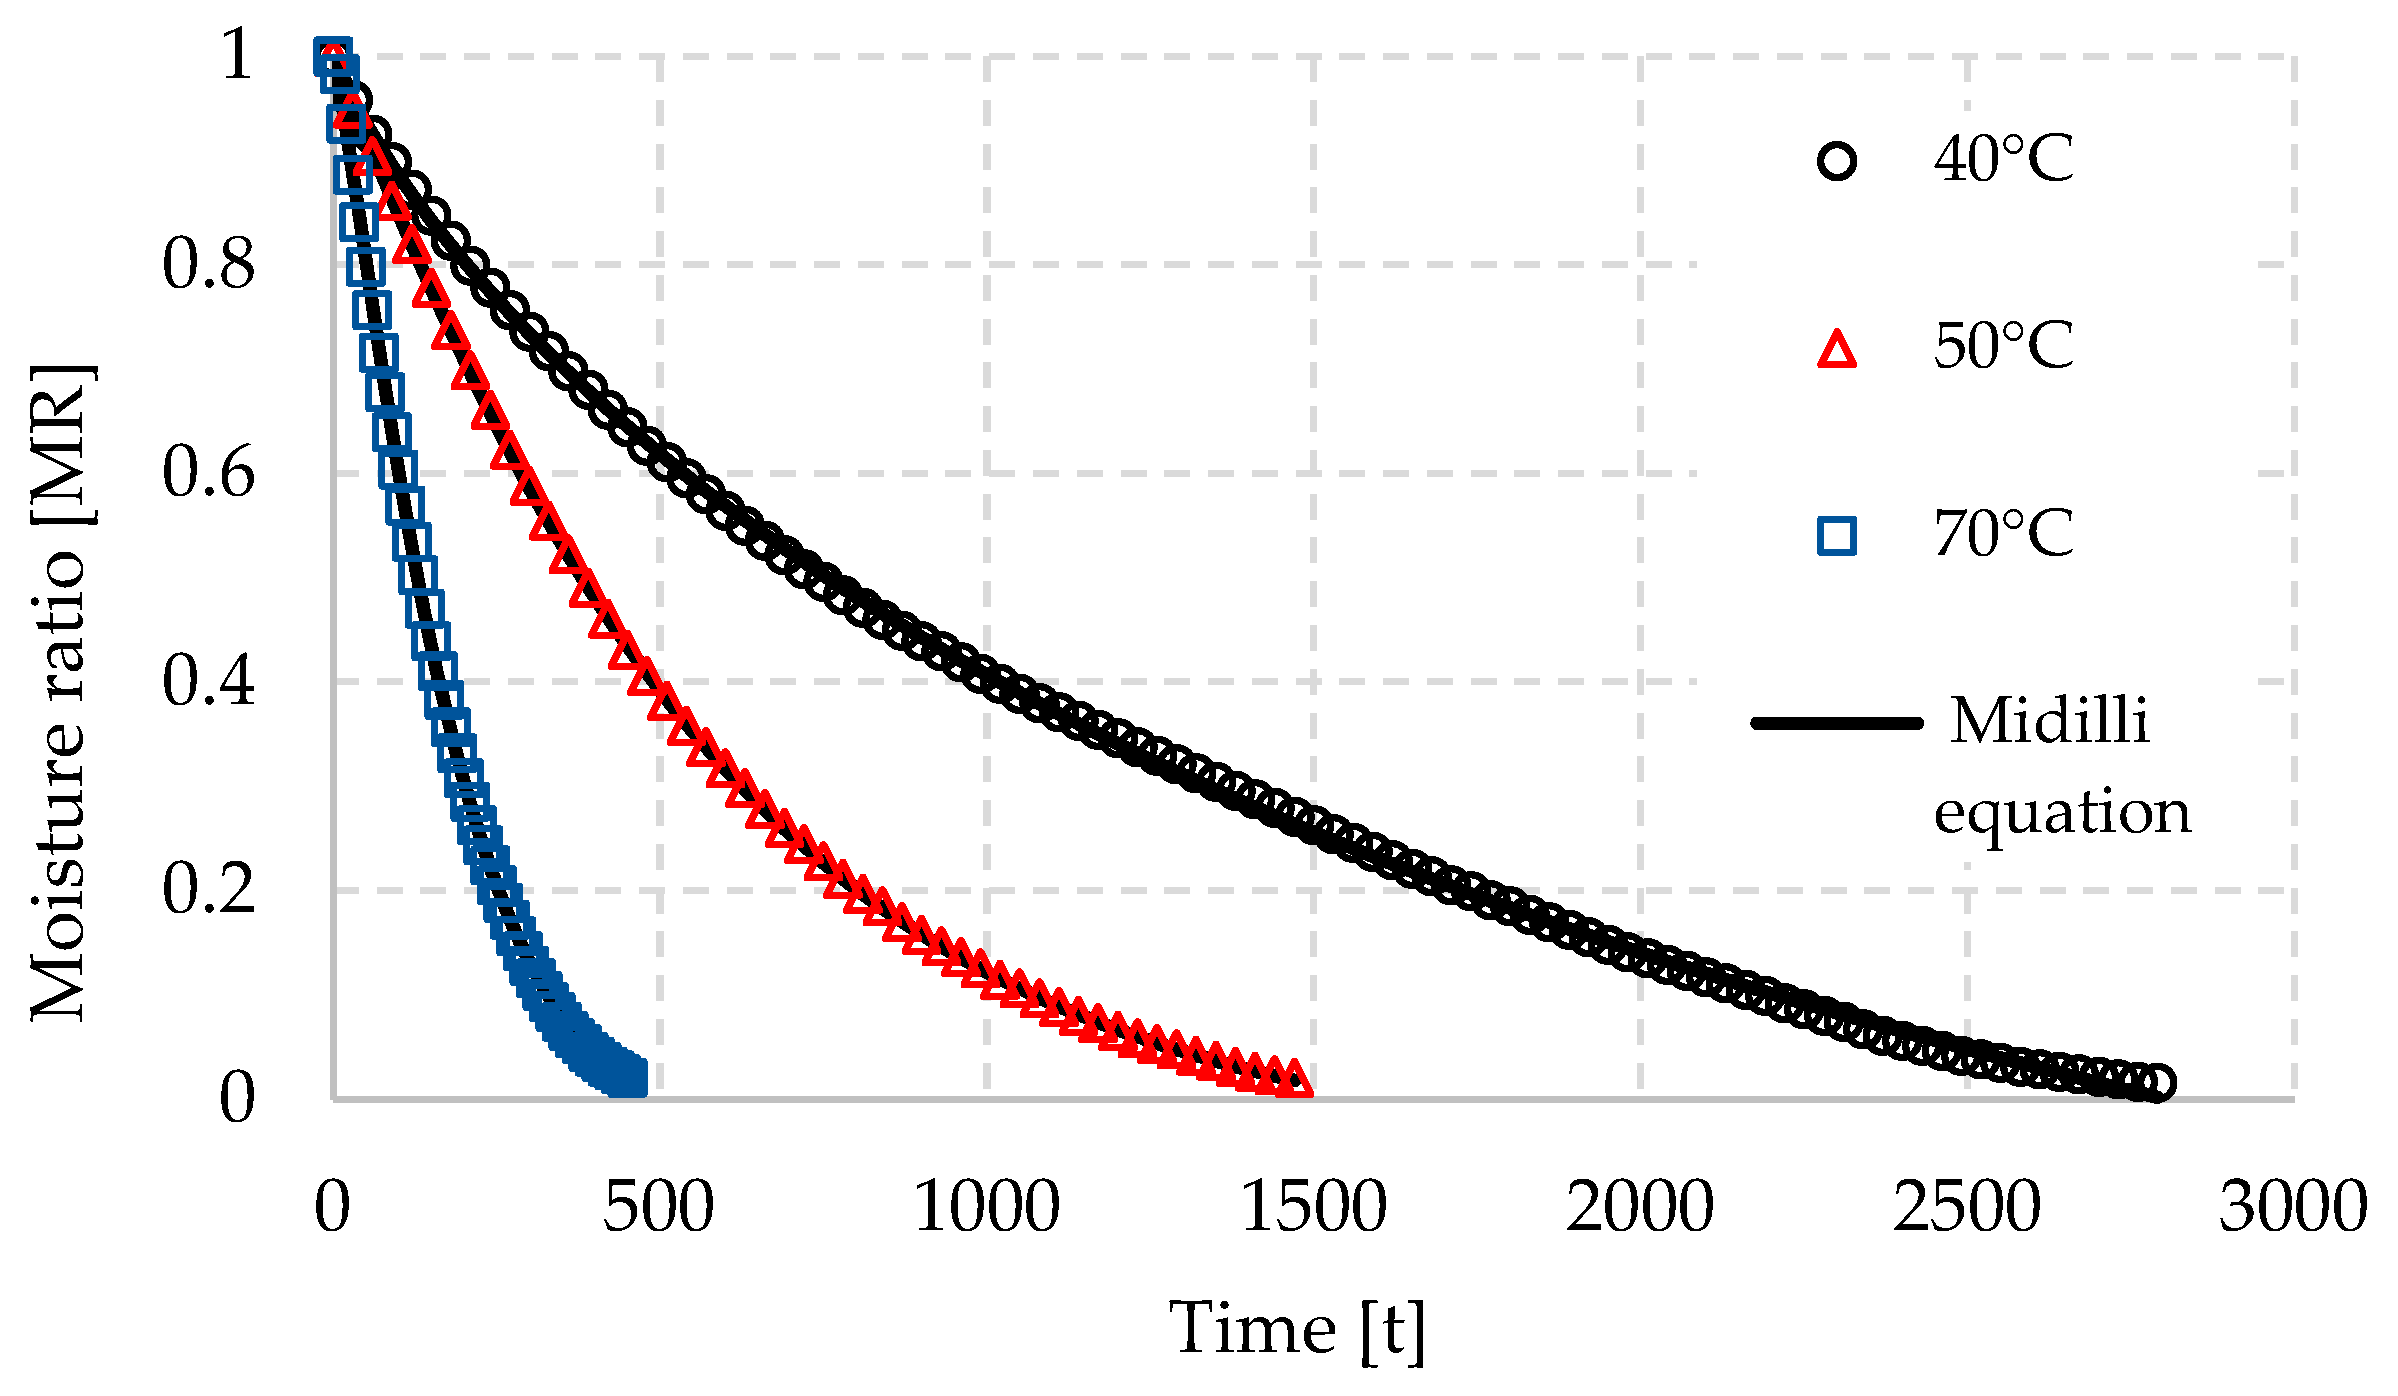
3.1. Drying Kinetics

Drying kinetics (DK) show the relationship between the water removal and process variables. Moreover, the knowledge of the DK allows us to determine the extent to which the pre-treatments of food used before dehydration and the conditions of the process affect its course. Thus, this information contributes to the optimization of the drying process through the selection of appropriate process conditions and its duration [40]. The DK of MF was presented as a change in MR during the duration of the FD and AD process (Figure 1 and Figure 2). An increase in the drying temperature reduced the duration of the process for both analyzed drying methods. Increasing the temperature of the lyophilizer’s heating plates from 30 °C to 70 °C resulted in the shortening of the freeze-drying time by about two-fold (from 1620 to 810 min). A similar tendency was observed when fruits of wild strawberries were freeze-dried at 20 and 40 °C [34]. The AD time of MF ranged from 450 to 2800 min depending on drying temperature. Interestingly, during air-drying, a six-fold reduction was observed when the air temperature was raised from 40 °C to 70 °C. A similar reduction in DT was observed by other authors when the slices of bananas were AD at 40 and 80 °C [41].
Table 2 and Table 3 provide the regression analysis of the seven tested models used to describe the kinetics of freeze-dried and air-dried MF. The coefficients of the analyzed regression equations are summarized in Table 4 and Table 5. For each of the analyzed models, a good fit of the data to the experimental test was obtained and high values of R2 with low values of RMSE and χ2 were obtained. The best results of modeling were obtained when the Midilli equation was used for the description of the drying kinetics. Such a tendency was found both for AD and FD. For all analyzed levels of temperature, the Midilli model was characterized by the value of R2 in the range from 0.999 to 1.000, and the highest mean RMSE was 0.0004. The Midilli model is often used as the best equation to describe the drying kinetics of many biological materials [40,41,42]. Other authors showed that the kinetics of AD and microwave drying of MF is best described when the logarithmic and Page models are used [19,23]. However, for the Midilli model, only slightly worse fitting was obtained [43]. These differences can result from differences in the properties of used raw materials and drying method. Drying kinetics also strongly depend on the method of raw materials pretreatments before dehydration [44].

3.2. Color Coordinates

The color of dried fruits is an important quality parameter that decides consumers’ acceptance. The dehydration of fruit almost often causes changes in the color of the dried product. The color coordinates for fresh fruits were as follows: L* = 27.16 ± 0.24, a* = 0.46 ± 0.88, and b* = 10.60 ± 0.13. Both FD and AD increased the lightness of dried MF compared with fresh fruits (Table 6). However, the highest values of L* were found for freeze-dried fruits and increased from 62.67 to 75.24 with the increase in drying temperature. In the case of AD, the highest value of L* was obtained for MF dehydrated at 50 °C (56.67) and the lowest at 40 °C (39.55). The higher lightness of the freeze-dried material compared to the air-dried product may be both from the presence of oxygen during AD and shrinkage of MF as a result of convective drying [45]. Drying also caused an increase in redness (a*) and yellowness (b*) of MF. Higher values of a* were found for air-dried fruits. Importantly, an increase in AD temperature did not influence the redness of MF, whereas FD caused a decrease in this parameter when the temperature of the heating plates was 60 °C. In the case of yellowness, higher values of this parameter were found for lyophilized fruits than for air-dried mulberries. A reverse tendency was found in the case of air-dried fruits. The lowest yellowness was observed when the temperature of the process was 70 °C. Consequently, the total color difference (ΔE) was higher for freeze-dried MF than for air-dried fruits and slightly but significantly increased with an increase in FD temperature. Other authors [22] found that the freeze-dried MF were characterized by higher redness and yellowness compared with air-dried fruits. However, they dehydrated black mulberry fruits, and the values of lightness, redness, and yellowness were considerably lower compared with our results. An increase in FD temperature often causes increasing L* of dried products, whereas redness and yellowness can change in various ways depending on the kind of dried fruits. Biernacka et al. [46] found that the redness and yellowness of strawberries increase with the increase in FD temperature from 20 to 60 °C. Other authors observed that in the case of cranberries, the temperature had no significant influence on the redness of freeze-dried fruits [47]. Taking into account air-dried fruits, a similar situation is observed. The drying temperature significantly changed color coordinates but the range of changes is strictly related to a kind of dried fruit and the method of pretreatments [48].

3.3. Total Ascorbic Acid Content

Ascorbic acid is a water-soluble component with many health benefits. This compound shows high antioxidant activity and protects proteins and DNA from oxidation [49]. In addition, the function of the epithelial barrier against infections is supported by this acid. It is also essential for the creation of collagen proteins and is crucial for stopping bleeding and aiding in wound healing [50]. Moreover, it also functions as an enzyme cofactor during metabolic energy production and hormone synthesis [51]. The average content of TAC in fresh mulberry fruits was 34.6 mg per 100 g of raw material, which was 214 mg per 100 g of dry mass. Both FD and AD caused a decrease in TAC content in dried MF (Figure 3). Moreover, an increase in DT increased the loss of TAC. The TAC content in freeze-dried MF ranged from 182 to 135 mg/100 g DM, whereas in the case of air-drying, it changed from 82 to 45 mg/100 g DM. The lowest content of L-ascorbic acid in dried mulberry fruit was recorded for the air-dried method at 70 °C and the highest for freeze-dried MF at 30 °C. In the case of freeze-drying, the loss of TAC compared to the raw material amounted to approximately 15% at the temperature of the heating plates of 30 °C and a maximum of approximately 38% at the temperature of 70 °C. The air-drying process caused the degradation of TAC acid by approximately 62% at an air temperature of 40 °C and approximately 79% at 70 °C. The higher degradation of TAC during AD can result from the presence of oxygen, whereas during FD, the access to oxygen is limited [52]. Moreover, extended time of dehydration has a negative influence on TAC content [35]. Others authors [53] also found that AD compared with other methods of drying causes the greatest degradation of TAC. In addition to the drying temperature, the time of heating also increased the degradation of this acid [54]. Therefore, the drying process should be stopped immediately after the raw material reaches the assumed moisture content.

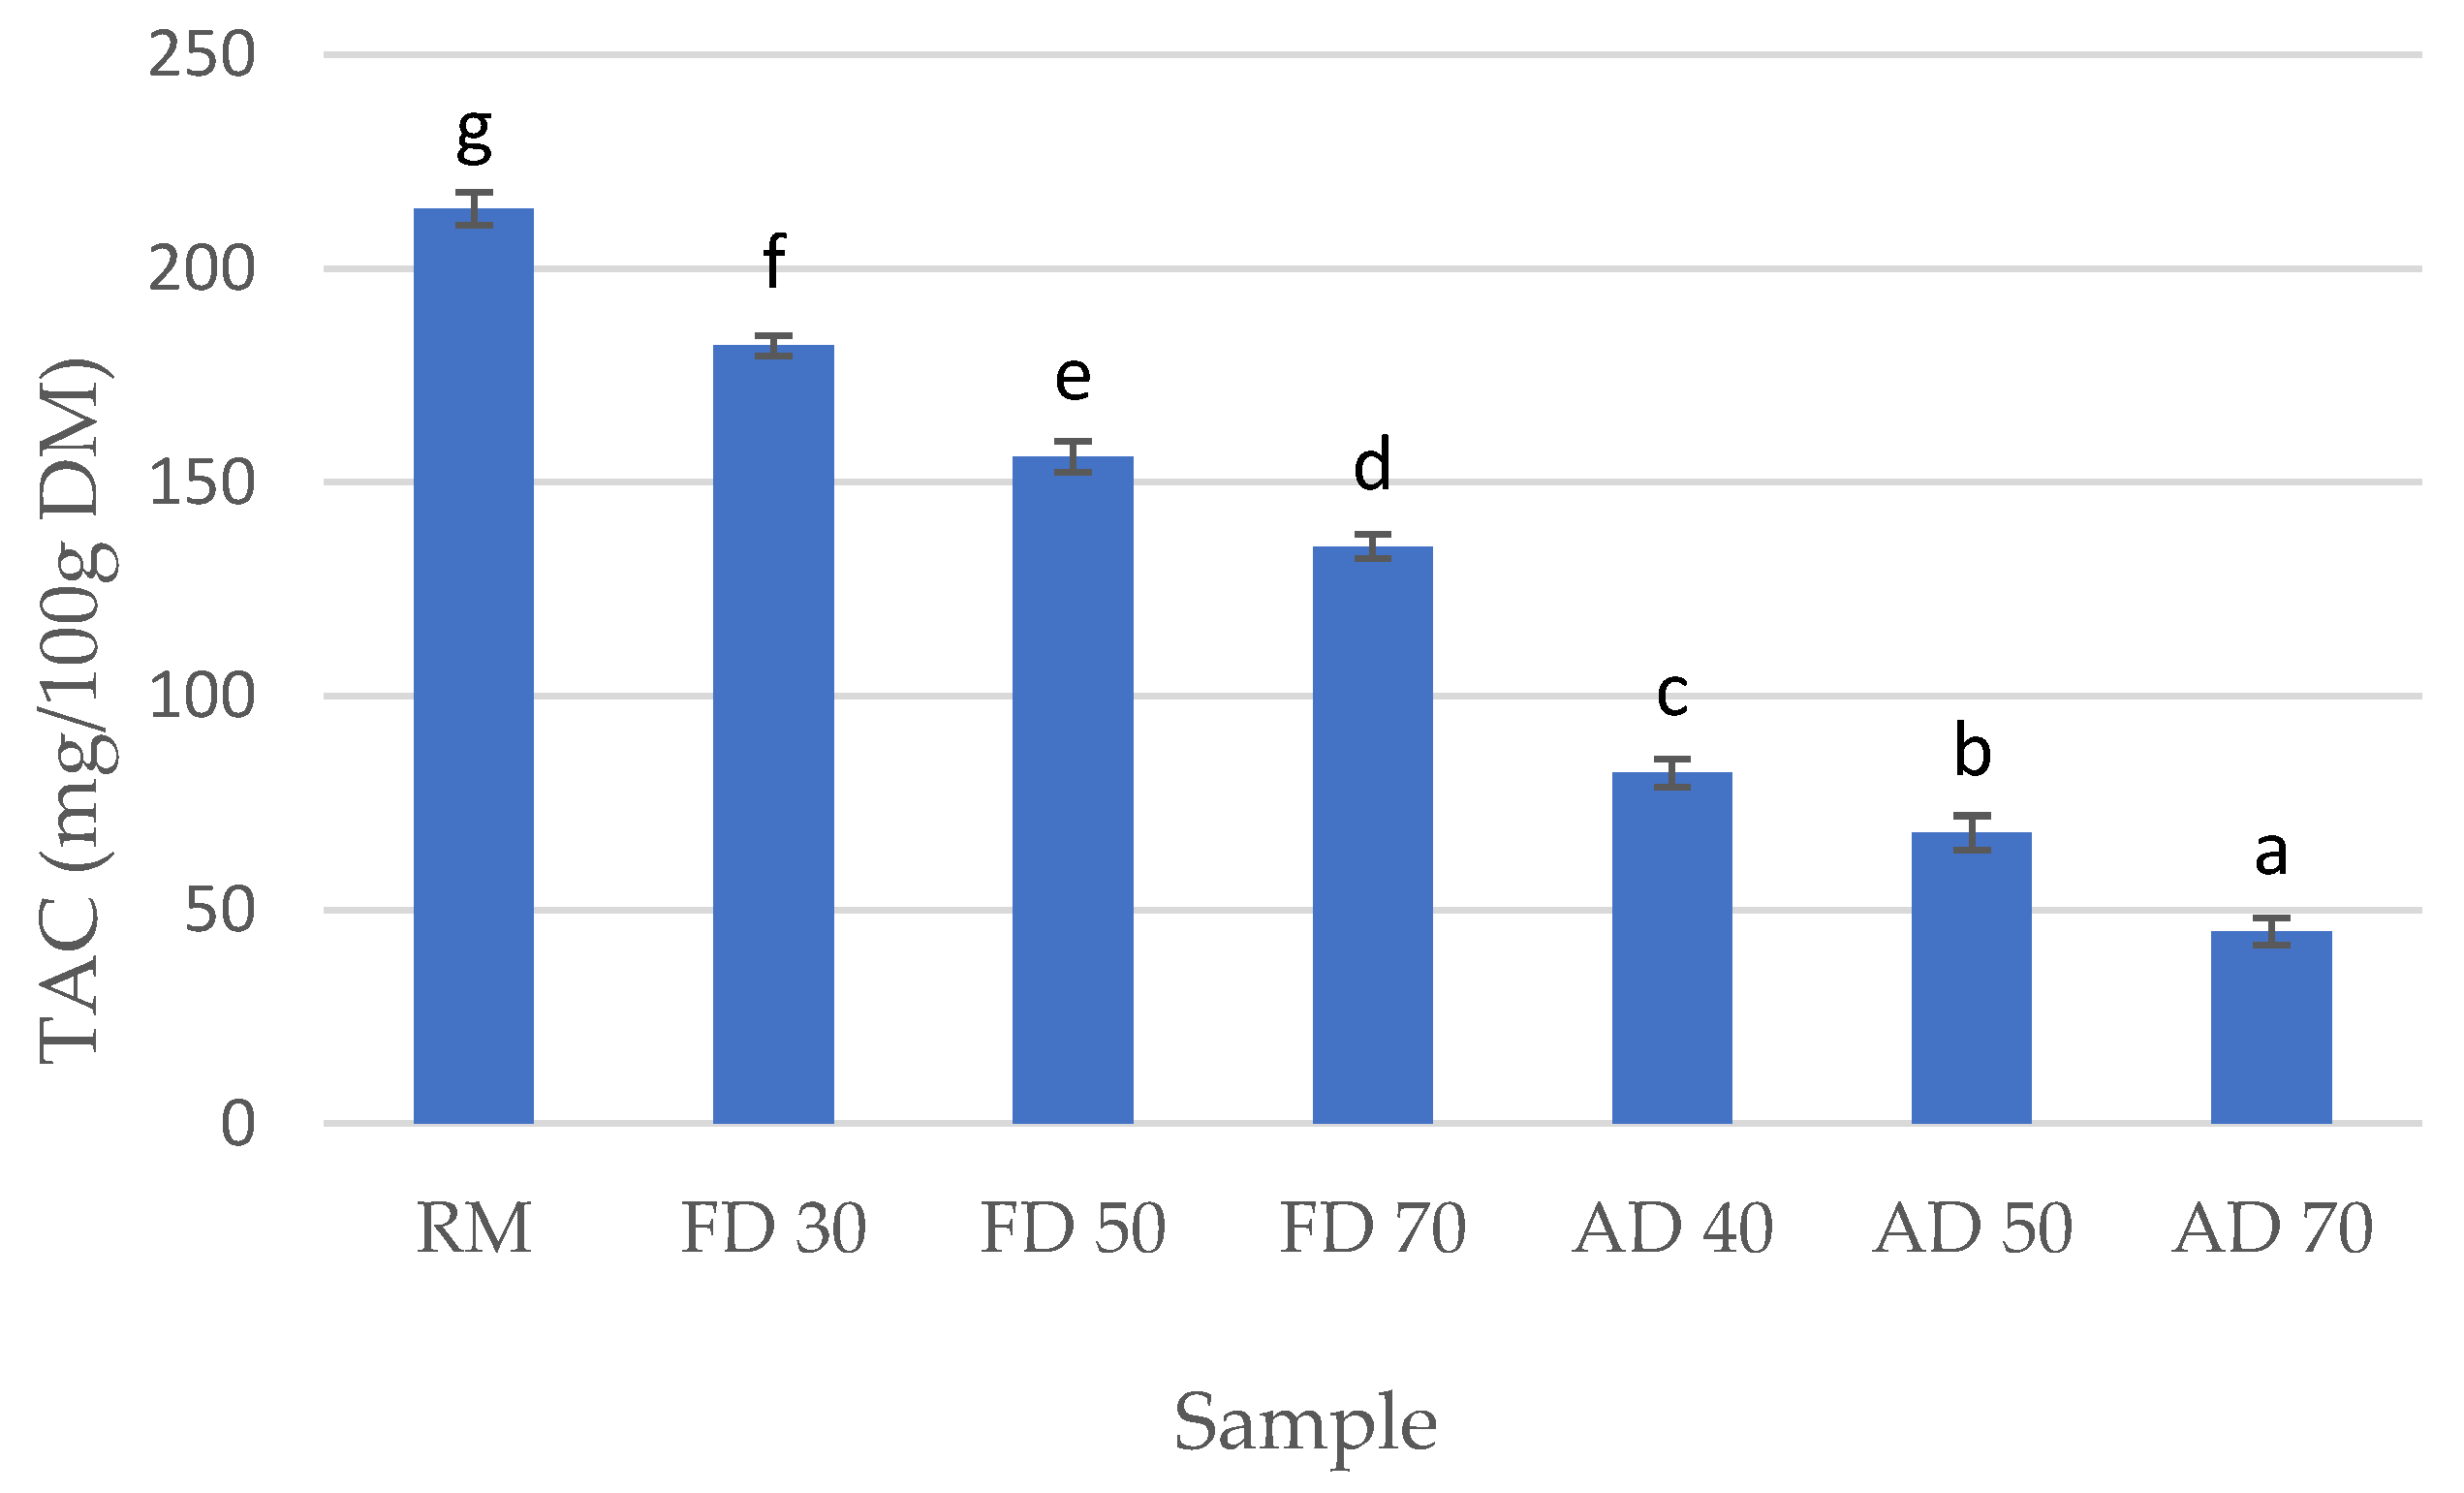
3.4. Phenolics Content and Antioxidant Capacity

The content of phenolics in fresh fruits was 158.8 mg GAE/g DM. Table 7 presents the results of TP and AC in dried MF. Both FD and AD caused a decrease in phenolics content. An increase in drying temperature also reduced the content of TP. However, considering the same level of drying temperature, significantly higher values of phenolics were observed in freeze-dried MF. The content of total phenolics in freeze-dried MF was in the range of 93.6–140.4 mg GAE/g DM, whereas in the case of AD changed from 88.5 to 122.6 mg GAE/g DM. Butkhup et al. [55] studied the chemical composition of eight mulberry cultivars air-dried at 60 °C. They discovered that depending on the cultivar, TP varied from 104.8 to 213.5 mg GAE/100 g DW. Other authors showed that the level of phenolic strongly depends on the degree of fruit maturity. The highest values of TP were observed in fully-ripened MF [54].
The drying method had relatively little influence on AC expressed by both DPPH and ABTS antiradical activities. The lowest values of EC50, which means the highest AC, were found for fresh fruits and fruits lyophilized at 30 °C. An increase in DT caused an increase in EC50 values and, consequently, a decrease in AC was observed. At the same level of drying temperature, significantly higher values of AC were observed for freeze-dried MF. FD is commonly known as one of the best methods of food preservation. However, according to our results and the data obtained by other authors [56,57], an increase in DT also leads to a significant decrease in the phytochemicals content and AC of dried food. However, for some raw materials, the method of pretreatment and shorter period of dehydration avoid too much degradation of biologically active compounds from taking place, even at higher drying temperatures [35]. Therefore, optimal drying conditions should be determined separately for each kind of raw material.

4. Conclusions

Both the drying method and DT significantly influenced the drying kinetics of MF. An increase in the temperature of AD from 40 to 70 °C and FD from 30 to 70 °C reduced the drying time six-fold and two-fold, respectively. The changes of MR both during FD and AD of MF were best described using the Midilli model. The color of dried MF was significantly affected by both the drying method and process temperature. The highest lightness and yellowness were noted for freeze-dried fruit, whereas air-dried MF were characterized by the highest redness. The lower values of this parameter were observed after convection drying, and the maximum L* was noted for air-dried fruits at 50 °C. The highest content of TAC was found in fresh fruits. An increase in drying temperature remarkably reduced the content of L-ascorbic acid. Taking into account the same levels of drying temperature, FD better protected TAC than AD. A similar tendency was observed in the case of TP and AC. However, the differences between freeze-dried and air-dried MF were significantly lower than in the case of TAC. To sum up, FD at 30 °C preserved MF to the best extent. On the other hand, AD at 40 °C also gave satisfactory results, taking into account the TP and AC of MF.

Author Contributions

Conceptualization, A.K. methodology, A.K., S.R. and B.B.; software, A.K.; validation, A.K., S.R. and R.P.; formal analysis, A.K. and R.P.; investigation, A.K., S.R., B.B., U.G.-D. and E.J.-T.; resources, B.B.; data curation, A.K.; writing—original draft preparation, A.K., D.D.; writing—review and editing, D.D.; visualization, A.K.; supervision, D.D.; project administration, D.D. All authors have read and agreed to the published version of the manuscript.

Funding

This research received no external funding.

Institutional Review Board Statement

Not applicable.

Data Availability Statement

The data presented in this study are available on request from the corresponding author.

Conflicts of Interest

The authors declare no conflict of interest.

References

  1. Sung, J.M.; Kim, Y.B.; Kum, J.S.; Choi, Y.S.; Seo, D.H.; Choi, H.W.; Park, J.D. Effects of freeze-dried mulberry on antioxidant activities and fermented characteristics of yogurt during refrigerated storage. Korean J. Food Sci. Anim. 2015, 35, 807–814. [Google Scholar] [CrossRef] [Green Version]
  2. Machii, H.; Koyama, A.; Yamanouchi, H. FAO Electronic Conference: Mulberry for Animal Production. 2000. Available online: http://www.fao.org/livestock/agap/frg/mulberry/ (accessed on 20 December 2022).
  3. Grześkowiak, J.; Łochyńska, M. Bioactive Compounds in White Mulberry (Morus alba L.) and Their Therapeutic Activity. Post. Fitoter. 2017, 18, 31–35. Available online: http://www.postepyfitoterapii.pl/wp-content/uploads/2017/06/pf_2017_031-035.pdf (accessed on 15 January 2023).
  4. Ali, M.A.; Memon, N.; Luthria, D.; Bhanger, M.I.; Pitafi, A.A. Phenolic Acid Profiling and Antioxidant Potential of Mulberry Leaves and Fruits Grow in Pakistan. Pol. J. Food Nutr. Sci. 2010, 60, 25–32. Available online: http://journal.pan.olsztyn.pl/pdf-98237-30952?filename=PHENOLIC%20ACIDS%20PROFILING.pdf (accessed on 12 January 2023).
  5. Ercisli, S.; Orhan, E. Chemical composition of white (Morus alba), red (Morus rubra) and black (Morus nigra) mulberry fruits. J. Food Chem. 2007, 103, 1380–1384. [Google Scholar] [CrossRef]
  6. Khattak, M.K.; Hanif, M.; Khan, M.; Ramzan, M.; Abdurab, K. Comparison of Drying Process and Preservatives on Drying Kinetics, Texture and Antioxidants Retention in Mulberry Fruits. J. Anim. Plant Sci. 2019, 29, 803–808. Available online: http://www.thejaps.org.pk/docs/v-29-03/21.pdf (accessed on 3 January 2023).
  7. Afrin, S.; Giampieri, F.; Forbes-Hernandez, T.Y.; Gasparrini, M.; Amici, A.; Cianciosi, D. Manuka honey synergistically enhances the chemopreventive effect of 5-fluorouracil on human colon cancer cells by inducing oxidative stress and apoptosis, altering metabolic phenotypes and suppressing metastasis ability. Free Radic. Biol. Med. 2018, 126, 41–54. [Google Scholar] [CrossRef]
  8. Cianciosi, D.; Varela-Lopez, A.; Forbes-Hernandez, T.Y.; Gasparrini, M.; Afrin, S.; Reboredo-Rodriguez, P.; Zhang, J.; Quiles, J.L.; Nabavi, S.F.; Battino, M.; et al. Targeting molecular pathways in cancer stem cells by natural bioactive compounds. Pharmacol. Res. 2018, 135, 150–165. [Google Scholar] [CrossRef]
  9. Pan, P.; Huang, Y.W.; Oshima, K.; Yearsley, M.; Zhang, J.; Yu, J.; Arnold, M.; Wang, L.S. An immunological perspective for preventing cancer with berries. J. Berry Res. 2018, 8, 163–175. [Google Scholar] [CrossRef]
  10. Sharma, A.; Kashyap, D.; Sak, K.; Tuli, H.S.; Sharma, A.K. Therapeutic charm of quercetin and its derivatives: A review of research and patents. Pharm. Pat. Anal. 2018, 7, 15–32. [Google Scholar] [CrossRef]
  11. Wen, P.; Hu, T.G.; Linhardt, R.J.; Liao, S.T.; Wu, H.; Zou, Y.X. Mulberry: A Review of Bioactive Compounds and Advanced Processing Technology. Trends Food Sci. Technol. 2019, 83, 138–158. [Google Scholar] [CrossRef]
  12. Doymaz, I. Drying Kinetics of White Mulberry. J. Food Eng. 2004, 61, 341–346. [Google Scholar] [CrossRef]
  13. Maskan, M.; Gogus, F. Sorption Isotherms and drying characteristics of mulberry (Morus alba). J. Food Eng. 1998, 37, 437–449. [Google Scholar] [CrossRef]
  14. Akbulut, A.; Durmus, A. Energy and exergy analyses of thin layer drying of mulberry in a forced solar dryer. Energy 2010, 35, 1754–1763. [Google Scholar] [CrossRef]
  15. Ali, M.; Durrani, Y.; Ayub, M. Effect of Drying Techniques and Storage on Mulberry (Morus alba) Quality. Sarhad J. Agric. 2016, 32, 80–88. [Google Scholar] [CrossRef]
  16. Akbulut, A.; Durmus, A. Thin layer solar drying and mathematical modelling of mulberry. Int. J. Energy Res. 2009, 33, 687–695. [Google Scholar] [CrossRef]
  17. Karaaslan, S.; Ekinci, K.; Akbolat, D.; Kumbul, B.S. Mathematical MOdeling of Thin Layer Drying Kinetics of White Mulberry (Morus alba L.) in Solar Tunnel Drier. Agronomy 2017, 60, 486–490. Available online: https://agronomyjournal.usamv.ro/pdf/2017/Art80.pdf (accessed on 20 December 2022).
  18. Chottamom, P.; Kongmanee, R.; Manklang, C.; Soponronnarit, S. Effect of osmotic treatment on drying kinetics and antioxidant properties of dried mulberry. Dry. Technol. 2012, 30, 80–87. [Google Scholar] [CrossRef]
  19. Doymaz, I.; Pala, M. Effect of ethyl oleate on drying characteristics of mulberries. Nahr. Food 2003, 47, 304–308. [Google Scholar] [CrossRef]
  20. Esmaeili, A.M.; Nikbakht, A.M.; Motevali, A.; Mousavi, S.S. Investigation of Black Mulberry Drying Kinetics Applying Different Pretreatments. J. Agric. Sci. Technol. 2013, 15, 23–34. Available online: https://jast.modares.ac.ir/article-23-1970-en.pdf (accessed on 12 December 2022).
  21. Zhou, M.; Chen, Q.; Bi, J.; Wang, Y.; Wu, X. Degradation kinetics of cyanidin 3-O-glucoside and cyanidin 3-Orutinoside during hot air and vacuum drying in mulberry (Morus alba L.) fruit: A comparative study based on solid food system. Food Chem. 2017, 229, 574–579. [Google Scholar] [CrossRef]
  22. Chen, Q.; Li, Z.; Bi, J.; Zhou, L.; Yi, J.; Wu, X. Effect of hybrid drying methods on physicochemical, nutritional and anti-oxidant properties of dried black mulberry. LWT-Food Sci. Technol. 2017, 80, 178–184. [Google Scholar] [CrossRef]
  23. Darvishi, H.; Zarein, M.; Minaei, S.; Khafajeh, H. Exergy and energy analysis, drying kinetics and mathematical modeling of white mulberry drying process. Int. J. Food Eng. 2014, 10, 269–280. [Google Scholar] [CrossRef]
  24. Wojdyło, A.; Figiel, A.; Oszmiański, J. Effect of drying methods with the application of vacuum microwaves on the bioactive compounds, color, and antioxidant activity of strawberry fruits. J. Agric. Food Chem. 2009, 57, 1337–1343. [Google Scholar] [CrossRef]
  25. Rayaguru, K.; Routray, W. Mathematical Modeling of Thin Layer Drying Kinetics of Stone Apple Slices. Int. Food Res. J. 2012, 19, 1503–1510. Available online: http://www.ifrj.upm.edu.my/19%20(04)%202012/30%20IFRJ%2019%20(04)%202012%20Winny%20(397).pdf (accessed on 28 January 2023).
  26. El-Beltagy, A.; Gamea, G.R.; Amer Essa, A.H. Solar drying characteristics of strawberry. J. Food Eng. 2007, 78, 456–464. [Google Scholar] [CrossRef]
  27. Özdemir, M.; Onur Devres, Y. Thin layer drying characteristics of hazelnuts during roasting. J. Food Eng. 1999, 42, 225–233. [Google Scholar] [CrossRef]
  28. Sarimeseli, A. Microwave drying characteristics of coriander (Coriandrum sativum L.) leaves. Energy Convers. Manag. 2011, 52, 1449–1453. [Google Scholar] [CrossRef]
  29. Motevali, A.; Younji, S.; Chayjan, R.A.; Aghilinategh, N.; Banakar, A. Drying kinetics of dill leaves in a convective dryer. Int. Agrophysics 2013, 27, 39–47. [Google Scholar] [CrossRef] [Green Version]
  30. Midilli, A.; Kucuk, H.; Yapar, Z. A new model for single-layer drying. Dry. Technol. 2007, 20, 1503–1513. [Google Scholar] [CrossRef]
  31. Diamante, L.M.; Munro, P.A. Mathematical modelling of the thin layer solar drying of sweet potato slices. Sol. Energy 1993, 51, 271–276. [Google Scholar] [CrossRef]
  32. AOAC International. Method 934.06 moisture in dried fruits. In Official Methods of the Association of Analytical Chemists, 15th ed.; AOAC: Virginia, VA, USA, 1990. [Google Scholar]
  33. Dziki, D.; Polak, R.; Rudy, S.; Krzykowski, A.; Gawlik-Dziki, U.; Rózyło, R.; Miś, A.; Combrzyński, M. Simulation of the process kinetics and analysis of physicochemical properties in the freeze drying of kale. Int. Agrophysics 2018, 32, 49–56. [Google Scholar] [CrossRef]
  34. Krzykowski, A.; Dziki, D.; Rudy, S.; Gawlik-Dziki, U.; Janiszewska-Turak, E.; Biernacka, B. Wild strawberry Fragaria vesca L.: Kinetics of fruit drying and quality characteristics of the dried fruits. Processes 2020, 8, 1265. [Google Scholar] [CrossRef]
  35. Krzykowski, A.; Dziki, D.; Rudy, S.; Gawlik-Dziki, U.; Polak, R.; Biernacka, B. Effect of pre-treatment conditions and freeze-drying temperature on the process kinetics and physicochemical properties of pepper. LWT Food Sci. Technol. 2018, 98, 25–30. [Google Scholar] [CrossRef]
  36. Mazurek, A.; Jamroz, J. Precision of dehydroascorbic acid quantitation with the use of the subtraction method—Validation of HPLC–DAD method for determination of total vitamin C in food. Food Chem. 2015, 173, 543–550. [Google Scholar] [CrossRef]
  37. Romankiewicz, D.; Hassoon, W.H.; Cacak-Pietrzak, G.; Sobczyk, M.; Wirkowska-Wojdyła, M.; Ceglińska, A.; Dziki, D. The effect of chia seeds (Salvia hispanica L.) addition on quality and nutritional value of wheat bread. J. Food Qual. 2017, 2017, 7352631. [Google Scholar] [CrossRef] [Green Version]
  38. Sujka, K.; Cacak-Pietrzak, G.; Sułek, A.; Murgrabia, K.; Dziki, D. Buckwheat hull-enriched pasta: Physicochemical and sensory properties. Molecules 2022, 27, 4065. [Google Scholar] [CrossRef]
  39. Singh, A.; Raju, R.; Mrad, M.; Reddell, P.; Münch, G. The reciprocal EC50 value as a convenient measure of the potency of a compound in bioactivity-guided purification of natural products. Fitoterapia 2020, 143, 104598. [Google Scholar] [CrossRef]
  40. Royen, M.J.; Noori, A.W.; Haydary, J. Experimental study and mathematical modeling of convective thin-layer drying of apple slices. Processes 2020, 8, 1562. [Google Scholar] [CrossRef]
  41. Macedo, L.L.; Vimercati, W.C.; Araújo, C.S.; Saraiva, S.H.; Teixeira, L.J.Q. Effect of drying air temperature on drying kinetics and physicochemical characteristics of dried banana. J. Food Process Eng. 2020, 43, e13451. [Google Scholar] [CrossRef]
  42. Soysal, Y.; Öztekin, S.; Eren, Ö. Microwave drying of parsley: Modeling, kinetics, and energy aspects. Biosyst. Eng. 2006, 93, 403–413. [Google Scholar] [CrossRef]
  43. Artnaseaw, A.; Theerakulpisut, S.; Benjapiyaporn, C. Drying characteristic of shiitake mushroom and jinda chili during vacuum heat pump drying. Food Bioprod. Process. 2010, 88, 105–114. [Google Scholar] [CrossRef]
  44. Dziki, D. Recent trends in pretreatment of food before freeze-drying. Processes 2020, 8, 1661. [Google Scholar] [CrossRef]
  45. Calín-Sánchez, Á.; Lipan, L.; Cano-Lamadrid, M.; Kharaghani, A.; Masztalerz, K.; Carbonell-Barrachina, Á.A.; Figiel, A. Comparison of traditional and novel drying techniques and its effect on quality of fruits, vegetables and aromatic herbs. Foods 2020, 9, 1261. [Google Scholar] [CrossRef]
  46. Biernacka, B.; Dziki, D.; Rudy, S.; Krzykowski, A.; Polak, R.; Dziki, L. Influence of pretreatments and freeze-drying conditions of strawberries on drying kinetics and physicochemical properties. Processes 2022, 10, 1588. [Google Scholar] [CrossRef]
  47. Rudy, S.; Dziki, D.; Krzykowski, A.; Gawlik-Dziki, U.; Polak, R.; Różyło, R.; Kulig, R. Influence of pre-treatments and freeze-drying temperature on the process kinetics and selected physico-chemical properties of cranberries (Vaccinium macrocarpon Ait.). LWT-Food Sci. Technol. 2015, 63, 497–503. [Google Scholar] [CrossRef]
  48. Karabulut, I.; Topcu, A.; Duran, A.; Turan, S.; Ozturb, B. Effect of hot air drying and sun drying on color values and β-carotene content of apricot (Prunus armenica L.). LWT-Food Sci. Technol. 2007, 40, 753–758. [Google Scholar] [CrossRef]
  49. Nowosad, K.; Sujka, M.; Zielińska, E.; Pankiewicz, U. Accumulation of vitamin c in yeast under pulsed electric field (PEF) conditions. Appl. Sci. 2022, 12, 10206. [Google Scholar] [CrossRef]
  50. McCall, S.J.; Clark, A.B.; Luben, R.N.; Wareham, N.J.; Khaw, K.T.; Myint, P.K. Plasma vitamin C levels: Risk factors for deficiency and association with self-reported functional health in the European Prospective Investigation into Cancer-Norfolk. Nutrients 2019, 11, 1552. [Google Scholar] [CrossRef] [Green Version]
  51. Young, J.I.; Züchner, S.; Wang, G. Regulation of the epigenome by vitamin C. Annu. Rev. Nutr. 2015, 35, 545–564. [Google Scholar] [CrossRef] [Green Version]
  52. Ratti, C. Hot air and freeze-drying of high-value foods: A review. J. Food Eng. 2001, 49, 311–319. [Google Scholar] [CrossRef]
  53. Akar, G.; Mazi, I.B. Color change, ascorbic acid degradation kinetics, and rehydration behavior of kiwifruit as affected by different drying methods. J. Food Process Eng. 2019, 42, e13011. [Google Scholar] [CrossRef]
  54. Sernikli, C.; Kadakal, C. Thermal degradation kinetics of ascorbic acid and some b-complex vitamins in black mulberry (Morus nigra) juice. Celal Bayar Univ. J. Sci. 2020, 16, 379–386. [Google Scholar] [CrossRef]
  55. Butkhup, L.; Samappito, W.; Samappito, S. Phenolic composition and antioxidant activity of white mulberry (Morus alba L.) fruits. Int. J. Food Sci. Technol. 2013, 48, 934–940. [Google Scholar] [CrossRef]
  56. Rezvankhah, A.; Djomech, Z.E.; Askari, G. Encapsulation and delivery of bioactive compounds using spray and freeze-drying techniques: A review. Dry. Technol. 2020, 38, 235–258. [Google Scholar] [CrossRef]
  57. Song, X.D.; Mujumdar, A.S.; Law, C.L.; Fang, X.M.; Peng, W.J.; Deng, L.Z.; Wang, J.; Xiao, H.W. Effect of drying air temperature on drying kinetics, color, carotenoid content, antioxidant capacity and oxidation of fat for lotus pollen. Dry. Technol. 2020, 38, 1151–1164. [Google Scholar] [CrossRef]
Figure 1. Drying curves of the freeze-dried mulberry fruits.
Processes 11 00750 g001
Figure 2. Drying curves of the air-dried of mulberry fruits.
Processes 11 00750 g002
Figure 3. Total content of L-ascorbic acid in fresh and dried mulberry fruits; RM—raw material, FD—freeze-drying, AD—air-drying, 30, 40, 50 and 70—drying temperature in °C. The values designated by the different small letters (a–g) show significant differences between the means for AD and FD and different drying temperature (α = 0.05).
Processes 11 00750 g003
Table 1. Equations applied to the drying curves.
Model NumberModel NameModel EquationReferences
1Newton MR = exp ( k · τ ) [25]
2Page MR = exp ( k · τ n ) [26]
3Henderson and Pabis MR = a exp ( k · τ ) [27]
4Logarithmic MR = a exp ( k · τ ) + b [28]
5Wang and Singh MR = 1 + a τ + b τ 2 [29]
6Midilli MR = a   ·   exp   ( k   · τ n ) + b   ·   τ [30]
7Logistic MR = b ( ( 1 + a exp ( k · τ ) ) 1 [31]
k—drying coefficient (min−1); a, b—coefficients of the equations; n—exponent; τ—time (min).
Table 2. Analysis of models describing the kinetics of freeze-drying of mulberry fruits.
Model NameSample
30 °C50 °C70 °C
R2RMSEχ2R2RMSEχ2R2RMSEχ2
Newton0.9910.0063.503 × 10−50.9910.0063.508 × 10−50.9870.0075.094 × 10−5
Page0.9980.0012.154 × 10−60.9980.0011.000 × 10−60.9980.0011.787 × 10−6
Henderson and Pabis0.9910.0075.126 × 10−50.9930.0041.828 × 10−50.9900.0052.878 × 10−5
Logarithmic0.9980.0012.298 × 10−60.9990.0001.536 × 10−71.0000.0007.188 × 10−8
Wang and Singh0.9970.0023.677 × 10−60.9960.0037.326 × 10−60.9980.0011.450 × 10−6
Logistic0.9990.0013.145 × 10−70.9990.0012.738 × 10−70.9990.0015.319 × 10−7
Midilli0.9990.0002.185 × 10−71.0000.0001.890 × 10−81.0000.0007.350 × 10−9
Table 3. Analysis of models describing the kinetics of air-drying of mulberry fruits.
Model NameSample
40 °C50 °C70 °C
R2RMSEχ2R2RMSEχ2R2RMSEχ2
Newton0.9890.0075.347 × 10−50.9930.0041.744 × 10−50.9870.0071.435 × 10−4
Page0.9900.0074.631 × 10−50.9990.0012.911 × 10−70.9980.0013.471 × 10−7
Henderson and Pabis0.9890.0075.380 × 10−50.9950.0075.381 × 10−50.9900.0054.679 × 10−5
Logarithmic0.9980.0012.145 × 10−60.9060.0543.055 × 10−31.0000.0008.919 × 10−7
Wang and Singh0.9830.0121.473 × 10−40.9830.0025.920 × 10−60.9980.0011.694 × 10−7
Logistic0.9930.0052.337 × 10−50.9990.0001.015 × 10−70.9990.0011.679 × 10−7
Midilli1.0000.0008.305 × 10−81.0000.0005.109 × 10−101.0000.0001.586 × 10−8
Table 4. Values in the models describing the freeze-drying of mulberry fruits.
TemperatureEquationCoefficient
ak (min−1)nb
30 °CNewton 0.001970
Page 0.0005111.210111
Henderson and Pabis0.0005111.210111
Logarithmic1.1110920.003301 −0.1964
Wang and Singh−0.001426 0.000001
Logistic1.6603630.700757 0.003019
Midilli0.9730770.0004751.210584−0.000015
50 °CNewton 0.005995
Page 0.0009911.169959
Henderson and Pabis1.0502530.002918
Logarithmic1.0987450.001668 −0.088077
Wang and Singh−0.002023 0.000001
Logistic1.9242200.956935 0.003966
Midilli1.0018430.0019101.206081−0.000080
70 °CNewton 0.008463
Page 0.0010871.198783
Henderson and Pabis1.0536480.003647
Logarithmic1.1362640.002737 −0.124730
Wang and Singh−0.002552 0.000002
Logistic1.7363350.771779 0.005216
Midilli0.9888000.0015731.117076−0.000068
Table 5. Values in the models describing the air-drying of mulberry fruits.
TemperatureEquationCoefficient
ak (min−1)nb
40 °CNewton 0.000959
Page 0.0006911.046169
Henderson and Pabis0.9957970.000955
Logarithmic1.0949920.000685 −0.144593
Wang and Singh−0.000716 0.000001
Logistic2.2114701.342309 0.009708
Midilli1.0057950.0029440.804393−0.000063
50 °CNewton 0.001956
Page 0.0007621.147366
Henderson and Pabis1.0452170.002044
Logarithmic1.02833510.002643 −0.026413
Wang and Singh−0.001459 0.000001
Logistic2.2108541.230381 0.002661
Midilli0.9949490.0010191.091671−0.000024
70 °CNewton 0.005995
Page 0.0013881.278262
Henderson and Pabis1.0875550.006512
Logarithmic1.1794090.004836 −0.136079
Wang and Singh−0.004461 0.000005
Logistic1.6535680.648026 0.009708
Midilli1.0018430.0019101.206082−0.000080
Table 6. Color coordinates of dried mulberry fruits.
MD *DT (°C)Parameter
LightnessRednessYellownessΔE
FD3062.67 ± 0.17 d**12.82 ± 0.03 b34.84 ± 0.13 d44.53 ± 0.20 d
5063.19 ± 0.67 d14.19 ± 0.04 c34.43 ± 0.12 d45.54 ± 0.59 e
7075.24 ± 0.62 e6.02 ± 0.11 a27.32 ± 0.43 b51.21 ± 0.45 f
AD4039.55 ± 0.52 a15.22 ± 0.28 d26.99 ± 0.35 b26.89 ± 0.55 b
5056.67 ± 0.26 c15.34 ± 0.11 d30.51 ± 0.11 c38.59 ± 0.27 c
7042.73 ± 1.02 b14.98 ± 0.30 d24.59 ± 0.54 a23.82 ± 0.75 a
* MD—method of drying, DT—drying temperature, FD—freeze-drying, AD—air drying, ΔE—total coller differene. ** The values designated by the different small letters (a–f) in the columns of the table show significant differences between the means for both AD and FD and different drying temperature. (α = 0.05).
Table 7. TP and antioxidant capacity in freeze-dried and air-dried MF.
MD *DT
(°C)
TP
(mg GAE/g DM)
EC50DPPH
(mg DM/mL)
EC50ABTS
(mg DM/mL)
FD30140.4 ± 2.6 d**6.02 ± 0.11 a24.59 ± 0.54 a
50118.1 ± 3.7 c12.82 ± 0.03 b26.99 ± 0.35 b
7093.6 ± 5.2 b14.19 ± 0.04 c32.51 ± 0.11 c
AD40122.6 ± 2.6 c15.22 ± 0.28 d27.32 ± 0.43 b
5098.1 ± 3.8 b15.34 ± 0.11 d34.84 ± 0.13 d
7088.5 ± 4.6 a17.65 ± 0.30 e34.43 ± 0.12 d
* MD—method of drying, FD—freeze-drying AD—air drying, DT—drying temperature, TP—total phenolic content, EC50ABTS—antiradical activity against ABTS, EC50DPPH—antiradical activity against ABTS. ** The values designated by the different small letters (a–e) in the columns of the table show significant differences between the means for AD and FD and different drying temperature (α = 0.05).
Disclaimer/Publisher’s Note: The statements, opinions and data contained in all publications are solely those of the individual author(s) and contributor(s) and not of MDPI and/or the editor(s). MDPI and/or the editor(s) disclaim responsibility for any injury to people or property resulting from any ideas, methods, instructions or products referred to in the content.

