Article

A Simulation Study of the Resiliency of Mobile Energy Storage Networks

1
Department of Electrical Engineering and Computer Science, Texas A&M University-Kingsville, Kingsville, TX 78363, USA
2
Department of Engineering Technology, Purdue University Northwest, Hammond, IN 46323, USA
*
Author to whom correspondence should be addressed.
Processes 2023, 11(3), 762; https://doi.org/10.3390/pr11030762
Submission received: 17 January 2023 / Revised: 1 March 2023 / Accepted: 3 March 2023 / Published: 4 March 2023
(This article belongs to the Special Issue Recent Advances in Electrical Power Engineering)

Abstract

:
Resilience is regarded as an essential design objective of a wide range of systems in modern society. This work is based on a vision that networks of mobile energy storage systems could provide an alternative off-grid power system design for rural and underdeveloped regions. To evaluate the resiliency of networked energy storage systems under overload failure, a model of concurrent cascading failure and healing processes is developed and demonstrated. Two resilience metrics are used to evaluate the resilience of a real-world network, namely the recovery level at a specified time and the recovery time. The simulations generate system trajectories at each time step. We explore the dependence of the system behavior on different model parameters that capture key recovery strategies. The success probability of the recovery of a failed node needs to be high enough for the network to restore its original functionality. Similarly, the increase in recovery budget parameter also leads to faster and higher recovery levels. However, in most cases, there appears to be upper limits for both parameters, beyond which any further increase could not improve the recovery performance. There is an optimum portion of the loads of the active neighboring nodes that will be carried by the newly recovered node that results in the shortest recovery times or highest recovery levels. Our work sheds light on how to enhance networked systems resiliency by considering the optimization of various model parameters.

1. Introduction

Energy storage systems (ESSs) have been indispensable to the modernization of electric grids in developed nations [1], the rebuilding of power systems in regions following major disasters [2], and the electrification of remote, poor, or underdeveloped communities [3]. While ESSs are often associated with distributed renewable generations and contribute to improved reliability of the grid and reduced cost of electricity [4,5], the deployment of utility-scale ESSs in the U.S. was approximately 1 GW at the end of 2019 (~0.1% of the total generating capacity) [6], which is far less than the 2050 goal of 59 GW power capacity [7].
In the last decade, there have been many studies on strategies to expand ESS deployment. The potential of combined applications of stationary battery ESSs to increase profitability was shown in [8]. The concept of mobile ESSs, mainly based on electric vehicles, was developed to improve power system operations [9,10]. In [11,12,13,14], the promise of a hybrid (stationary + mobile), grid-independent form of battery ESSs to maximize renewable generation, incentivize ESS deployment, and promote electrical transportation was demonstrated.
However, the previous studies have focused on individual ESSs instead of ESS networks, i.e., “interconnected” systems of ESSs. As a forward-looking concept, ESS networks, compared with a single ESS, would be able to deliver improved grid services via coordinated operations of multiple ESSs. On the other hand, as candidates of off-grid power systems, ESS networks would also be more reliable and economic than isolated ESSs. ESS networks can also provide back-up power and emergency power when the grid is down due to catastrophic disasters, accidents, cyberattacks, or wars [15,16,17]. While it is widely accepted that ESSs can improve the resiliency of power systems, there have been few studies on the resiliency of ESS networks themselves. In view of this, the objective of this work is to develop a modeling and simulation framework to provide decision support for the resiliency planning of mobile ESS networks.
Many complex systems of modern society such as power systems [18], telecommunication systems [19], financial transaction systems [20], command and control systems [21] have been widely modeled as networks. To evaluate the resiliency of networked systems, three elements need to be taken into consideration: initial failure, cascading, and healing. For ESS networks, the primary concern here is overload failures, i.e., ESSs not able to meet demands due to supply loss or demand surge. Starting from a small number of failed ESSs, the overload failure may propagate over the network. Cascading overload failures have been studied intensively [22,23,24]. In [22], for instance, researchers studied a type of overload failure in evolving scale-free networks. It was shown that if the capacities of nodes grow with the size of the network, cascading failure could be avoided. The authors of [23] studied cascading failures in an electric transmission system model when power demand is increased. It was found that operations near critical points can produce power-law tails in the blackout size probability distribution similar to those observed during various North American blackouts. In [24], the authors considered cascades due to load redistribution in an interdependent system consisting of two networks. These previous studies on cascading failures have also informed various methods to increase networks robustness against overload failures. On the other hand, there have been many studies on healing processes in networked systems [25,26,27]. Suppressing cascading failures in networks by activating healing mechanisms was designed in [25,26], where the healing was achieved by forming a link at each stage of the cascade, with a certain probability, to link the failed nodes with functioning ones. It was shown that only with the probability above a critical value, systemic failure can be prevented. In [27], the authors stated that after cascading failure fragmented the system into smaller clusters, each node has the option of whether to establish a new edge or not, depending on the ratio of its degree after the failure to its original degree. This proposed healing mechanism was able to restore the functionality of the system and was also validated by applying it to real-world systems. However, healing in load-based failure scenarios has not been adequately investigated [28]. Further, very little research attention has been paid to networks with concurrent cascading failure and healing [29].
In this work, we examine the performance of off-grid ESS networks under overload cascading failure with a newly proposed dynamic healing mechanism. Via numerical simulations, we explore the effects of various model parameters on the system dynamics. For the purpose of resiliency planning, we use two resiliency metrics called systemic impact and the time to restoration [30,31]. The main contributions of this work are summarized as follows. First, a new concept of mobile energy storage network is proposed and demonstrated via computer simulation. Second, a modeling-based planning approach is developed to evaluate the resilience of the networked system. Finally, the results provide some insights on the recovery strategies to improve system resiliency.
The rest of the paper is organized as follows. In Section 2, the networked energy storage system model is described, and the simulation framework for network resiliency planning is presented. The results of the network dynamics and resiliency metrics under various combinations of model parameters are shown and discussed in Section 3. Conclusions are in Section 4.

2. Model Description

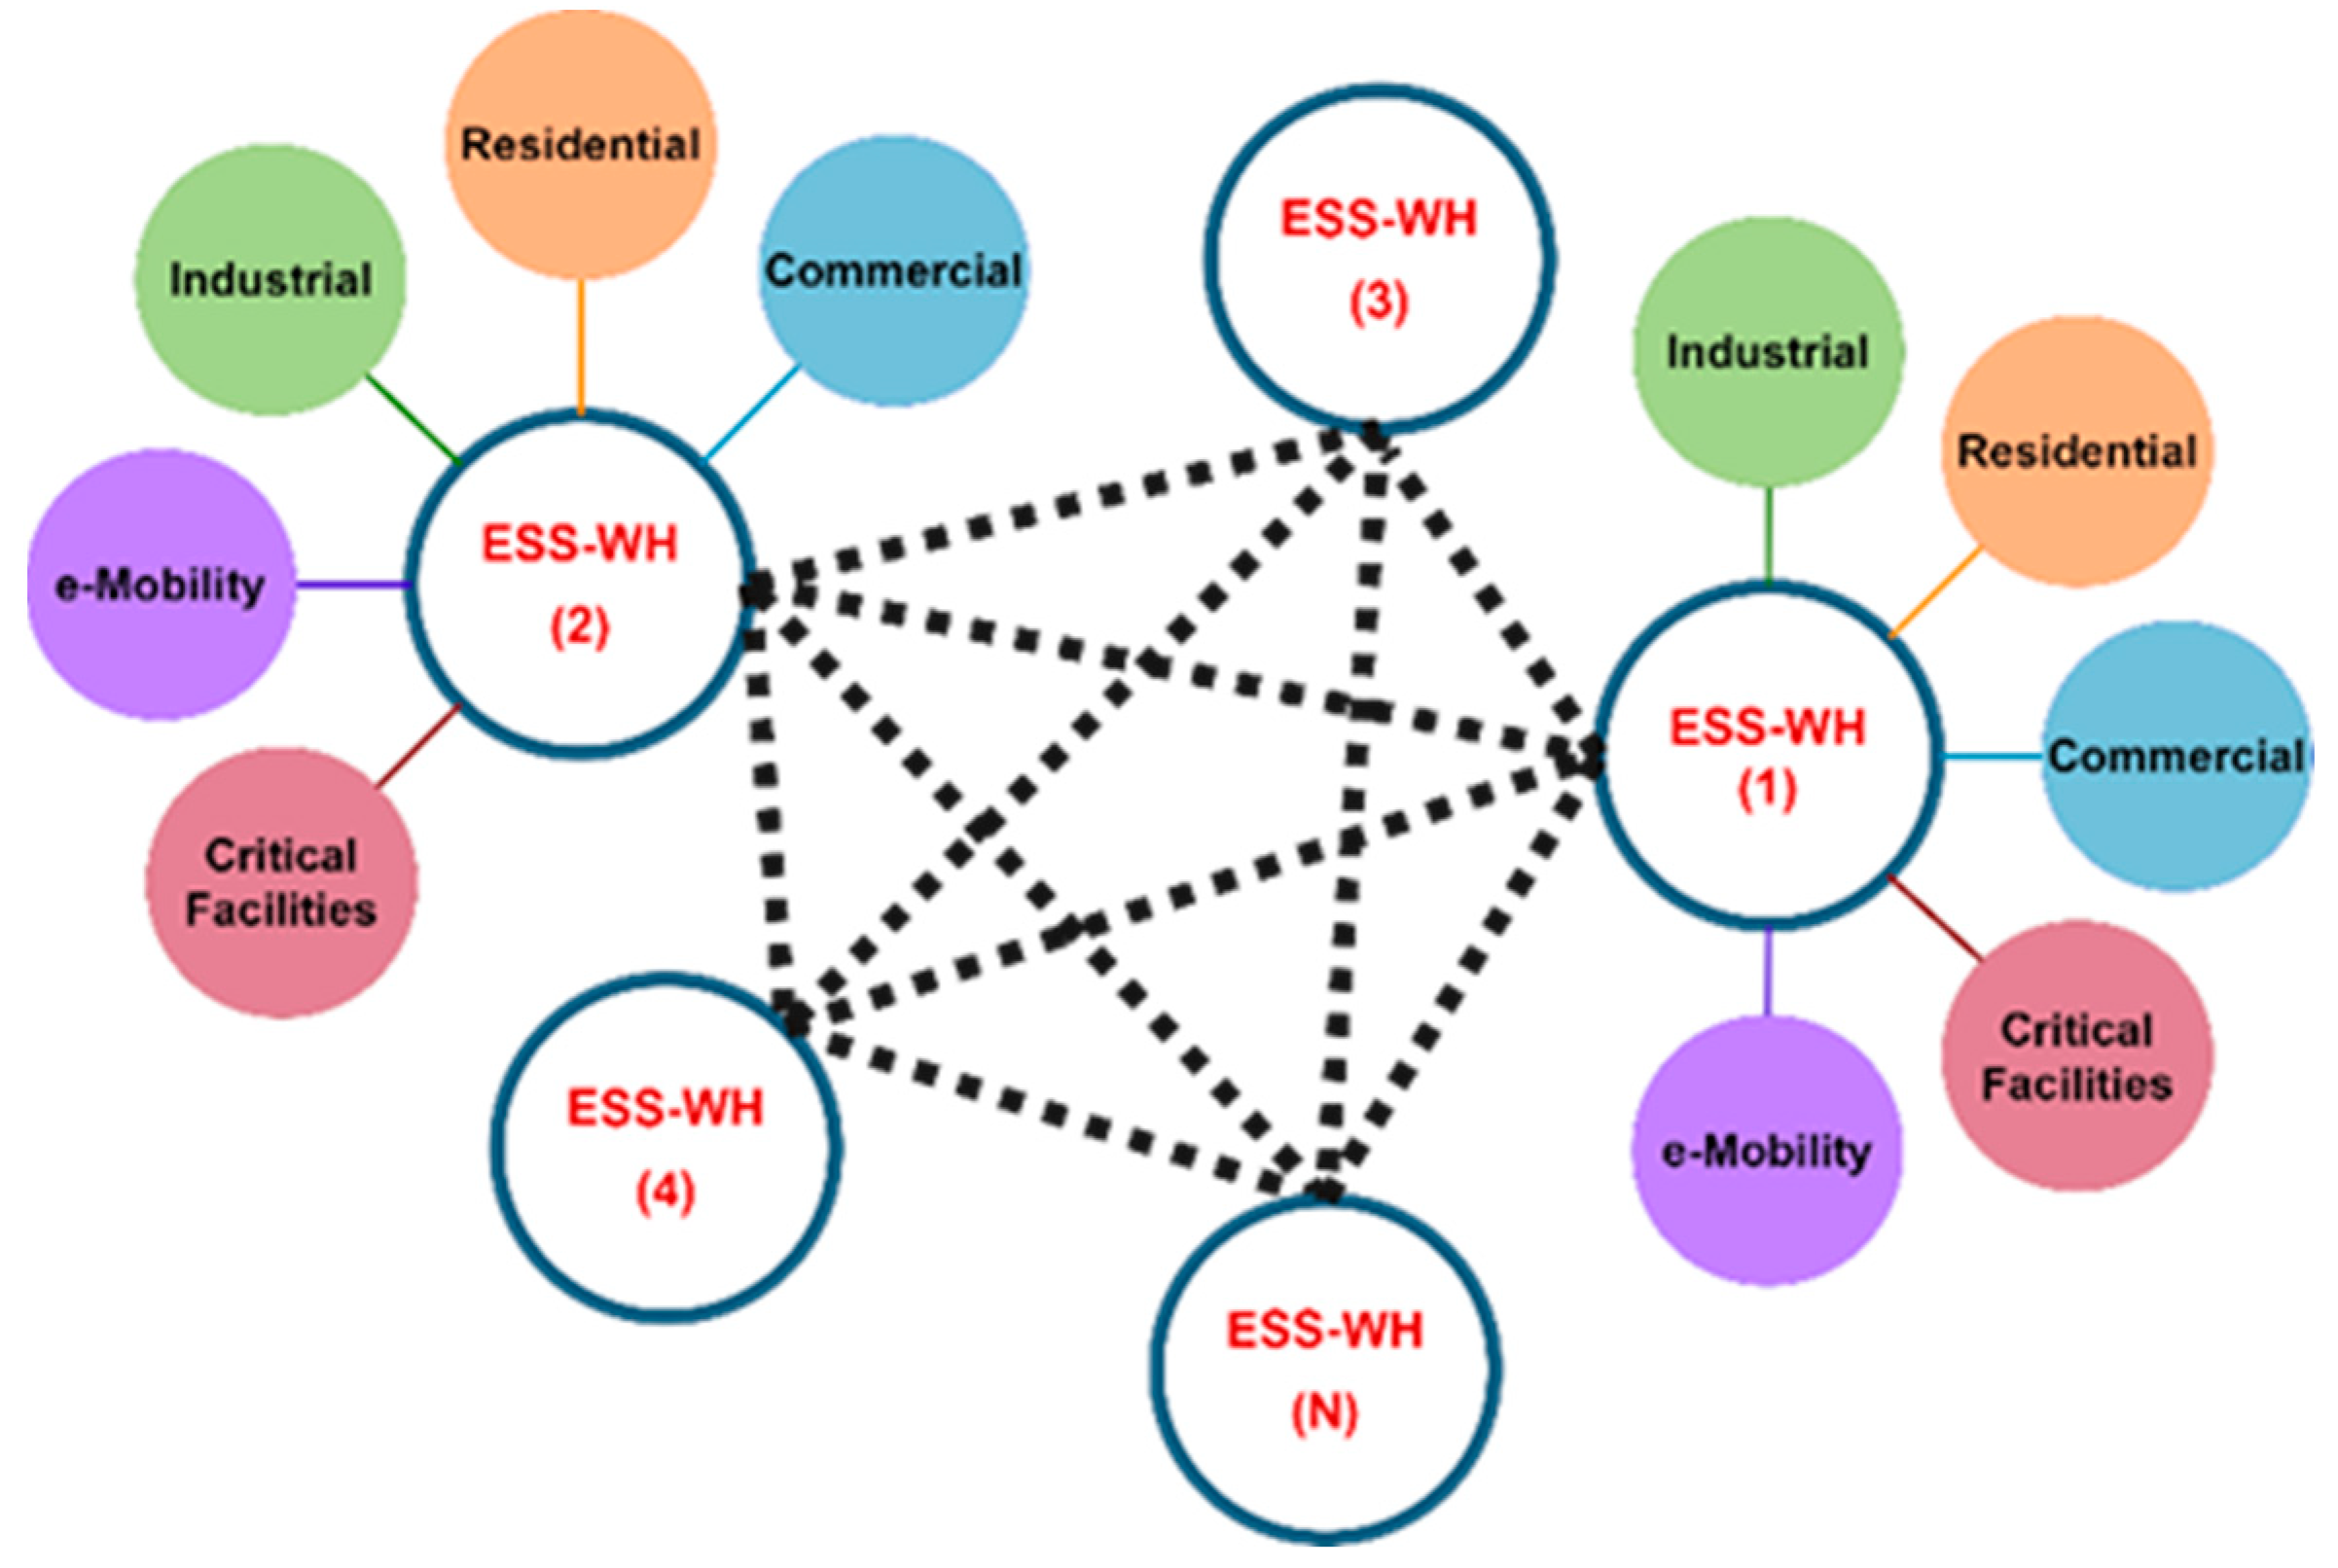
2.1. Off-Grid ESS Networks

Different from the conventional electric power grid, a scenario of an off-grid network of energy storage system warehouses (ESS-WHs) is introduced and analyzed in this study. Each ESS-WH houses a certain number of large-scale mobile battery energy storage systems (MoBESSs). The size of each MoBESS is anticipated to be ~5 MWh and will be charged at the respective warehouse [11,12,13,14]. Figure 1 illustrates the conceptual description of the networked energy storage systems model. In this network, each ESS-WH represents a hub that is responsible for supplying the energy demands of a cluster of facilities such as residential, commercial, and industrial buildings, as well as the critical infrastructures (i.e., hospitals, police stations, call centers, schools, etc.). Transportation is also integrated into this network. It is worth mentioning here that the transportation sector is electrified (e-Mobility) and utilized by electric vehicles (EVs), e-buses, e-trucks, and e-rails. When discussing the energy sources of the ESS-WHs, other than the power grid, renewable energy sources (RESs) could be the dominant energy suppliers to the MoBESSs through stationed chargers at the ESS-WHs. The MoBESSs are then shipped by large electric trucks to the targeted destinations including demand facilities and other ESS-WHs.

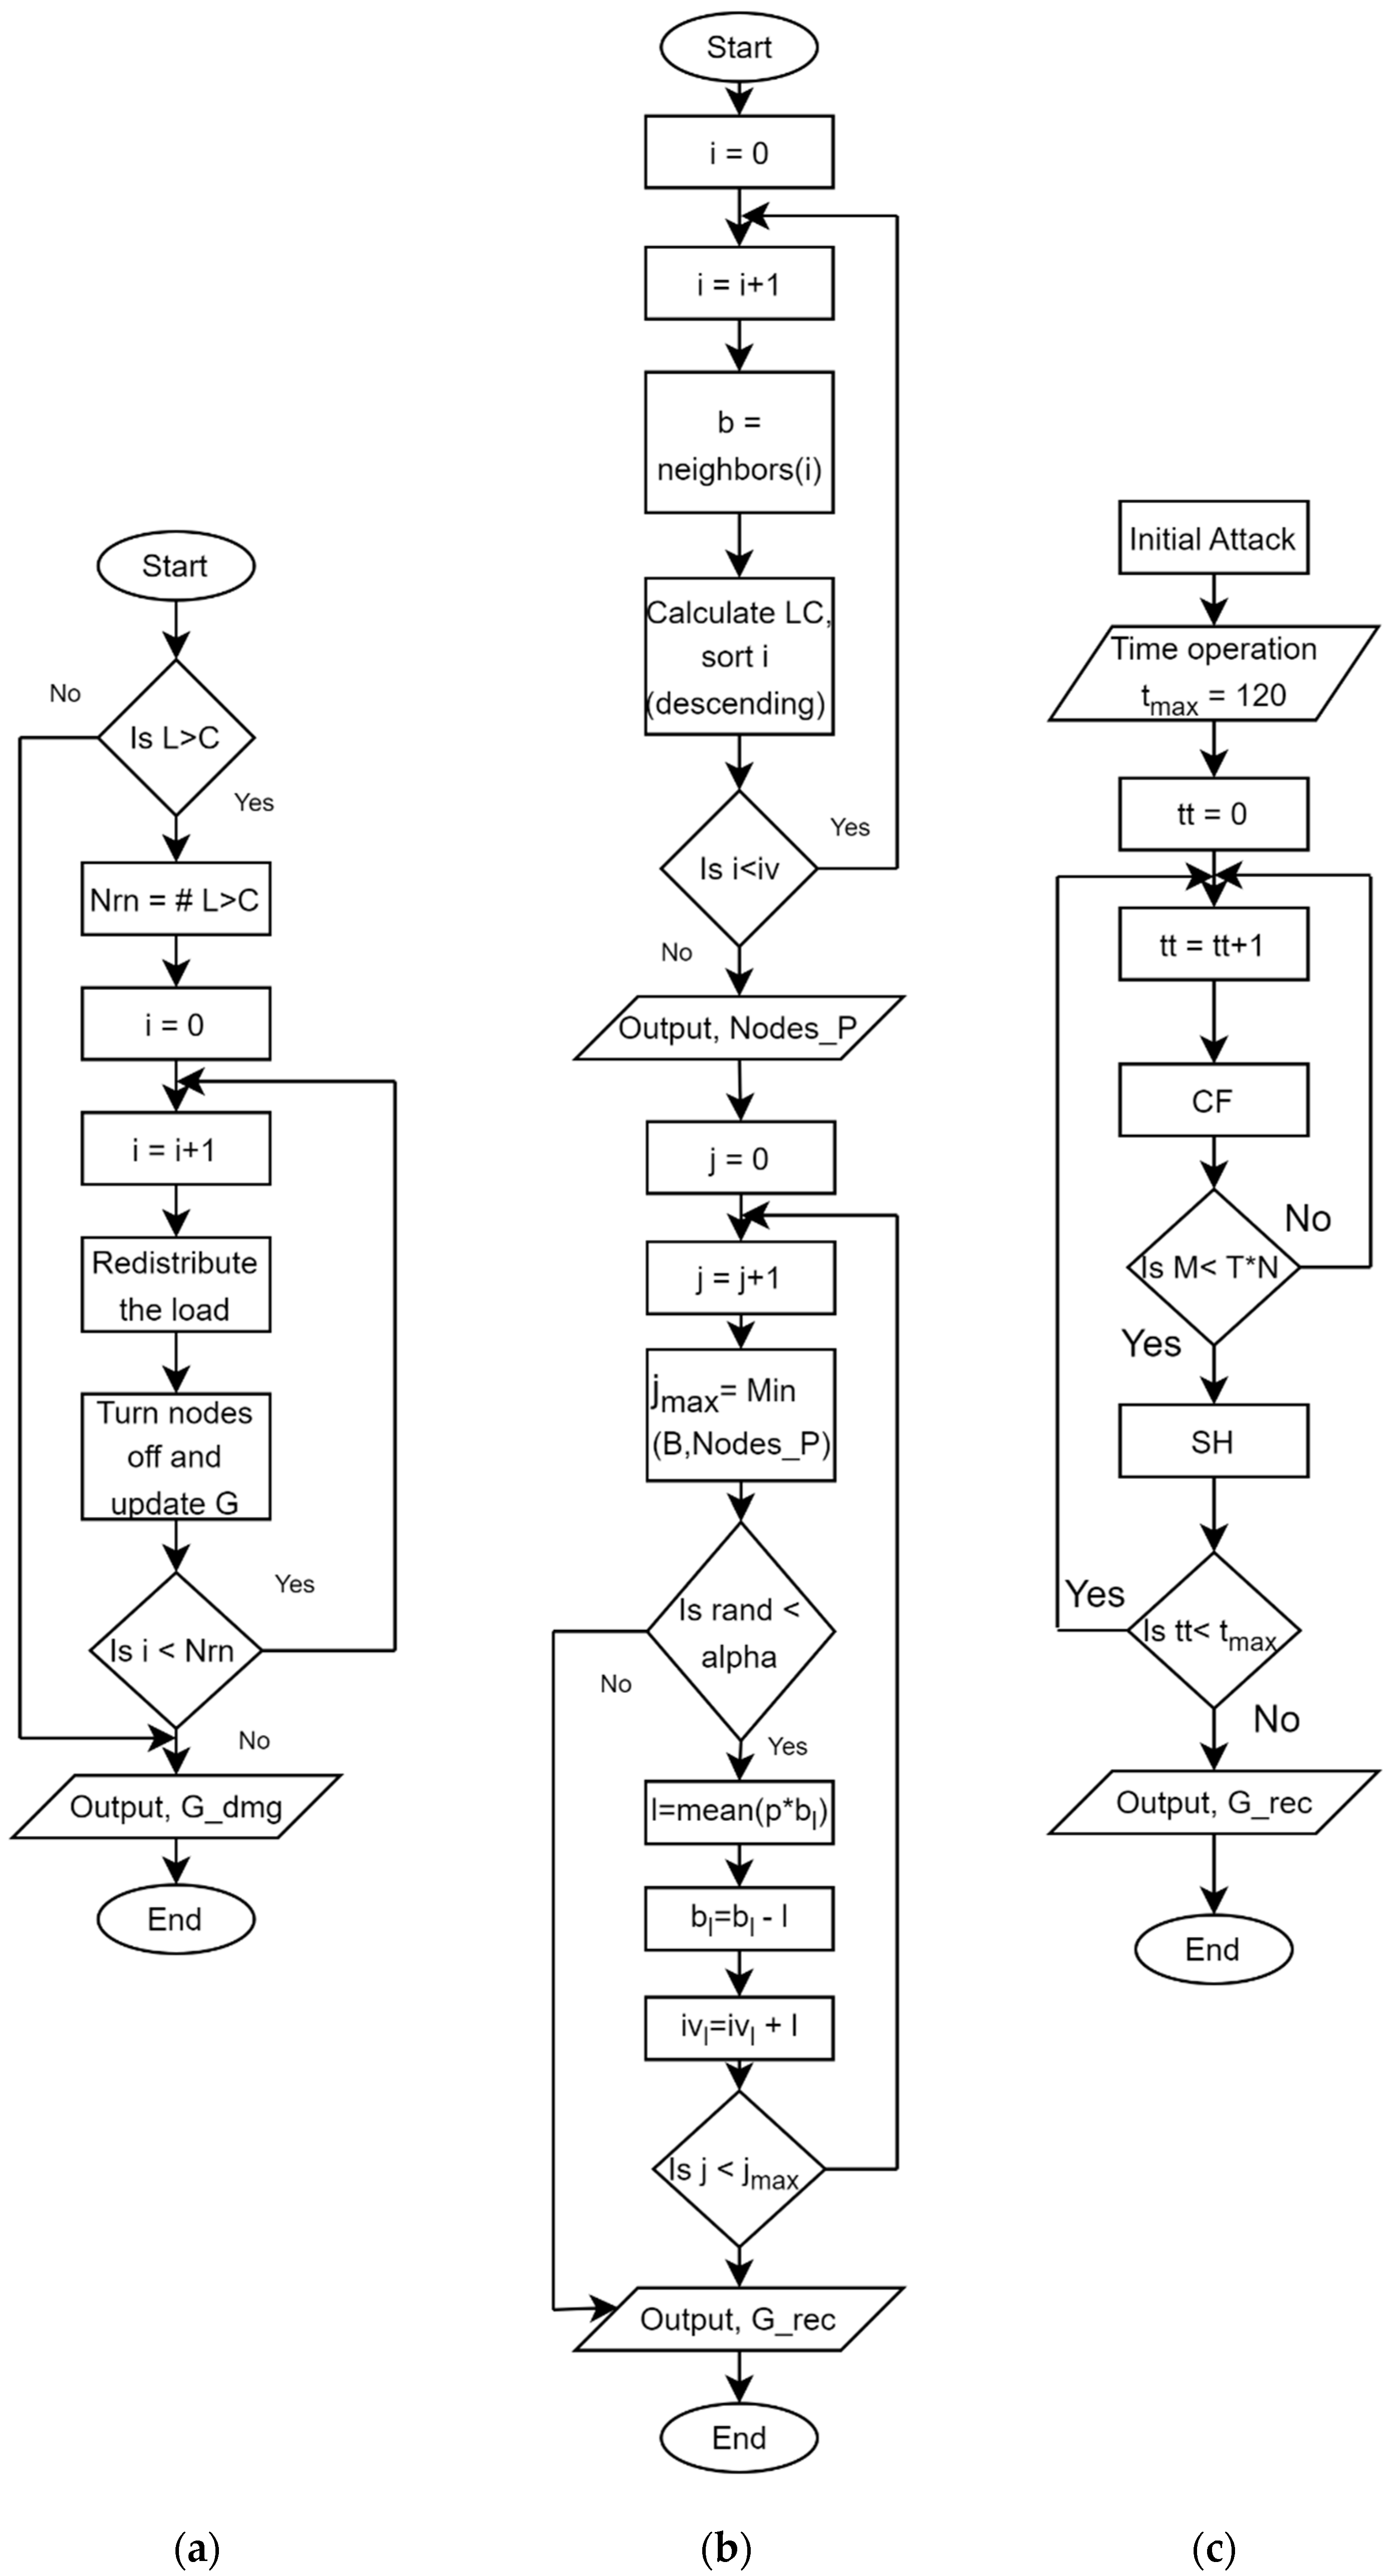
2.2. Simulation Framework

In the ESS-WH network, a load-based failure occurs when the loads of some nodes (ESS-WHs) exceed their maximum loads (capacity). The failure of these nodes might trigger a cascading overload failure, which in turn could cause the entire system to collapse. In this paper, such initial failure of an ESS-WH (called attack) can be attributed to an overload in energy demand or a shortage in the RES supply to the ESS-WH. In such a scenario, the energy demand of a failed ESS-WH will be fully or partially covered by the neighboring ESS-WHs via transportation by electric trucks based on the network healing model until the normal operation of the failed ESS-WHs is maximally restored. Under many circumstances, the failure could cascade as a result of this mechanism, i.e., more ESS-WHs will turn to failure. Figure 2 shows the components of the simulation framework to study the load-based failure and healing in the ESS-WH network. Table 1 provides the explanation of the symbols used in the simulation framework. And Table 2 lists the inputs, outputs, and parameters of each of the 6 modules in Figure 2.
The ESS-WH network under study here is a form of off-grid electrification infrastructure, which is an alternative to the electric power grids in certain regions. The operation of the network of off-grid ESS-WHs does not rely on the power grid; the dynamical processes simulated in this work do not include those in conventional power systems. The timescale of network failure and recovery are in the order of hours, which is typical in transportation systems (the system operation is based on shipment of MoBESSs). We use discrete-time simulations to model the processes in the network, each time-step representing an hour. However, the length of each time-step can be varied to fit the timescale in different systems.
The simulation starts by assigning all the network’s nodes with random loads values from a uniform distribution. It is assumed that the capacity of each node is proportional to its initially load. We then perform discrete-time simulation in which the cascading failure (CF) and the self-healing (SH) processes run concurrently. When the maximum time step is reached, the simulation will terminate. At the initial time step, a disturbance of additional load is added to selected nodes of highest degrees. A node fails when its new load is larger than its capacity. The load of the failing node will be equally redistributed among its active neighboring nodes and added to their loads as demonstrated in Figure 3a. However, in our model, we assume that the links of the inactive node i are not removed. We just turn it off when it initially failed or when its load exceeds its capacity. At the same time step, our model let the SH algorithm start a two-phase recovery process, as shown in Figure 3b. The first phase, or, as we define it, SH-decision, starts by scanning the active neighbors of the inactive nodes. Then, it calculates the load-to-capacity ratio LC, or the capacity usage of each active neighbor. Our main goal is to decide which nodes to save first by finding those nodes with high-capacity usages that are about to fail in the next time step. By ranking them in a descending order, the CF will be mitigated and suppressed. To the best of our knowledge, we are the first who propose and design such a mechanism for recovering any damaged loaded network. Precisely, the mechanism both mitigates the CF and turns the inactive nodes back on again. The second phase of the recovery process is called SH-implementation, where we take into our consideration the recovery potentials (RP) constraints. Apparently, the higher the RP an organization has for recovering the network, the less the CF effect and the higher the number of reactivated nodes. In particular, the implementation of (SH) is developed by taking a portion p of the load of each active neighboring nodes, finding the mean l, and then subtracting it from the load of each of them. After that, this quantity will be added to the corresponding inactive node. Figure 3c represents the main function where we run both CF and SH concurrently.
There is another type of failure in the ESS-WH network (out of the scope of this work). It is caused by broken links between nodes. This can be due to the malfunctioning of the electric trucks in maintaining a full schedule of the MoBESS shipments back and forth between the ESS-WHs and the demand destinations. In this study, the electric truck shipments of MoBESSs are assumed to be uninterrupted.

3. Results and Discussions

3.1. Road Network

A Minnesota road network is studied in this paper [32]. As shown in Figure 4, the network consists of 2640 nodes and 3302 links. A node represents a road intersection or endpoint, and a link represents a road connecting these nodes. Since the proposed ESS-WH network has seen no actual implementation so far, to demonstrate this early concept, we need to base the studies on a network. We use the available data of this road network in which the nodes indicate the locations of individual ESS-WHs and the links mark the transportation routes among the ESS-WHs. A road network is adopted as the skeleton of the ESS-WH network mainly because the shipments of MoBESSs are road-based (not because it is a real system configuration). Although the ESS-WH network is hypothetical, the design based on the road network can be considered as a reasonable initial design.

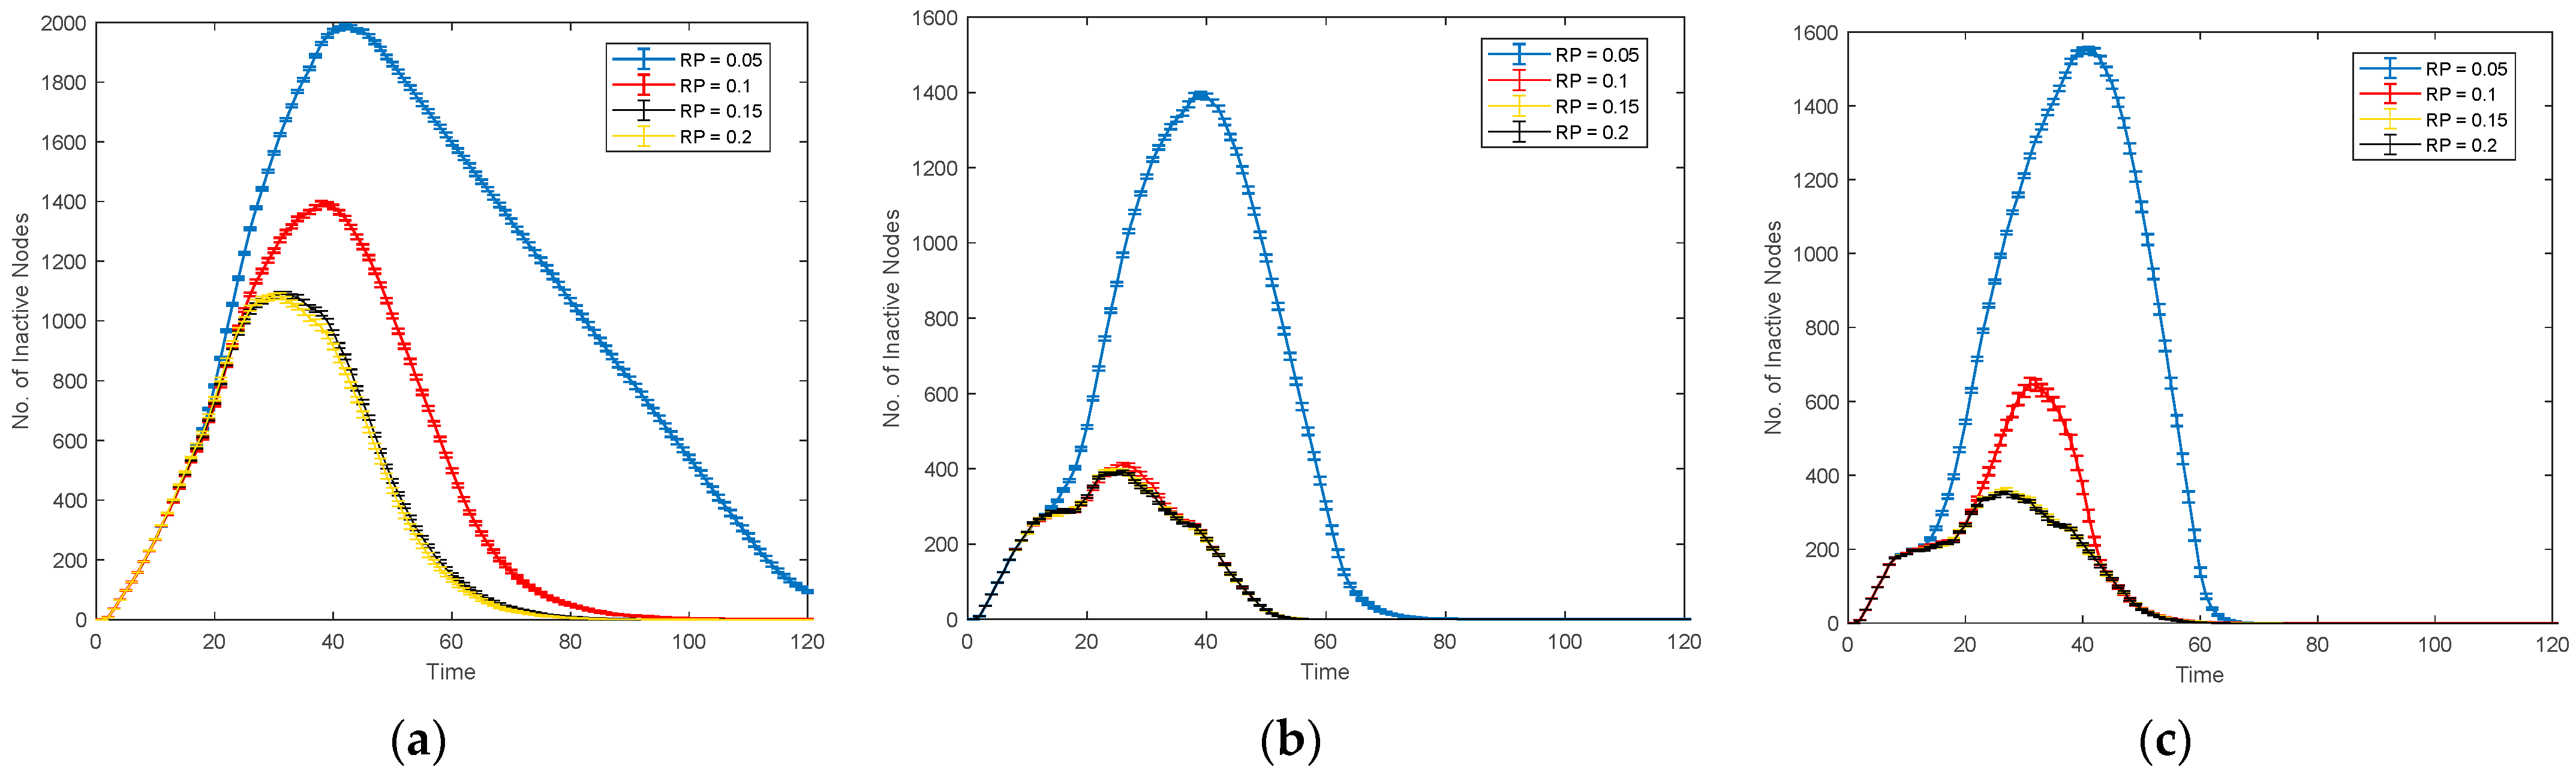
3.2. System Recovery Trajectories

We define the recovery trajectory of a networked system as the plot of the number of failed (or inactive) nodes against time (or time steps in our discrete-time simulations). In the off-gird ESS-WH network, the initial attack that causes the failure of a node (ESS-WH) can be due to the reduced energy supply from RESs or the increased demand within its service area. Since, by design, the demand of a failed ESS-WH is to be taken care of by its neighboring active nodes, under certain conditions, the failure could cascade and propagate across the network. Therefore, a self-healing mechanism needs to be in place to prevent the collapse of the entire system. Once the healing mechanism kicks in at triggering time, depending on other process parameters (α—the success probability of restoring a failed node, P—the portion of the loads of the active neighboring nodes that will be carried by the newly recovered node, and RP—the ‘budget’ of recovery representing the maximum number of nodes that can be recovered in one self-healing step, normalized by the total number of nodes in the network), the ESS-WH network may track different recovery trajectories.
Figure 5 shows the recovery trajectories when a various number of the road network’s nodes are subject to initial attacks. The trend here is as expected, without self-healing kicking in (see the initial segments of each curve); the greater number of nodes we initially attack, the more severe the cascading failure would be. An interesting, counterintuitive result can be observed here: all the six curves will almost merge or ripple around a specific value at the same time step. In other words, it will take our model the same time to recover the network in the six different attack scenarios. Here, we set α = 1, P = 0.01, T = 0.05, RP = 0.8. Next, we explore the parameter dependence of the recovery trajectories to better understand the system behavior.
With some additional simulations conducted, we observe the effect of different values of P on the recovery trajectories. Figure 6 shows that when P is as small as 0.01, the model can recover 98% of the inactive nodes. When P = 0.02, the recovery is approximately 92%. In the ESS-WH network, when an ESS-WH fails (turns inactive) and then is selected for reactivation (restoration), it needs to support the network operation by covering a certain portion of demands from its neighboring active nodes, especially those with close-to-capacity demands. It is not difficult to see that when the portion is high, it will overload the restored ESS-WH again and have a negative impact on the overall healing process. As one can see in Figure 6, increasing P does not necessarily make the recovery more effective; in fact, in this case, it has the opposite effect. For comparison, when the healing mechanism is not implemented (or P = 0), the CF will be fully developed. The implication is that somewhere between 0 and 0.01, in principle, one can find an optimal P value that can accomplish maximum node recovery.
To show the effect of the recovery potential (RP) on the recovery trajectories, more simulations are run, and the results are presented in Figure 7. Here, other parameters are kept fixed as α = 1, T = 0.05, P = 0.01, and number of initial attack nodes is eight. Five different levels of recovery potentials are selected: 5%, 10%, 15%, 20%, and 80%. It can be seen that when α is set to be one, an unexpected result occurs, which is that it is not necessarily true that the higher the RP, the faster the recovery. The case with RP = 5% takes the shortest time to achieve 95% node recovery. However, in this case, the number of failed nodes in the process almost reaches 1400, which is significantly higher than other cases. Another expected result in Figure 7 is that RP has an upper limit, beyond which any further increase in it cannot improve the performance (see the overlapped curves for the two cases, RP = 0.2 and RP = 0.8). Practically, this indicates that too-high recovery potentials would be wasteful. In the ESS-WH network, the reactivation of failed ESS-WHs could be achieved through acquiring additional energy sources (e.g., buying electricity from the grid) at certain expenses. RP can be viewed as the budget restriction of node healing. Therefore, the exploration of the effect of RP on the system trajectory can provide insight into the budget planning of the ESS-WH network recovery.
To investigate the effect of recovery potentials RP further, three more simulations (for α = 0.2, α = 0.5, α = 0.8) are run and the representative results are presented in Figure 8. For each of the five scenarios in Figure 8a–c, we run 20 iterations, find the average, and then plot the recovery trajectories and show the precision of our simulations by using error bars. Unlike the result shown in Figure 7, with the increase in recovery potentials in the system under the load-failure mechanism, the time to fully recover the system shortens. Another amazing attribute of the proposed model is that the effect of the CF will be less and less while RP increases (see the maximum values of the curves in Figure 8a–c). One can expect that when the certainty α of the healing mechanism is increased, the recovering time shortens; however, it does not necessarily reduce the maximum number of inactive nodes. Lastly, similar to the case of α = 1 shown in Figure 7, the results in Figure 8a,b show that RP has an upper limit, beyond which any further increase in it cannot improve the recovery performance.

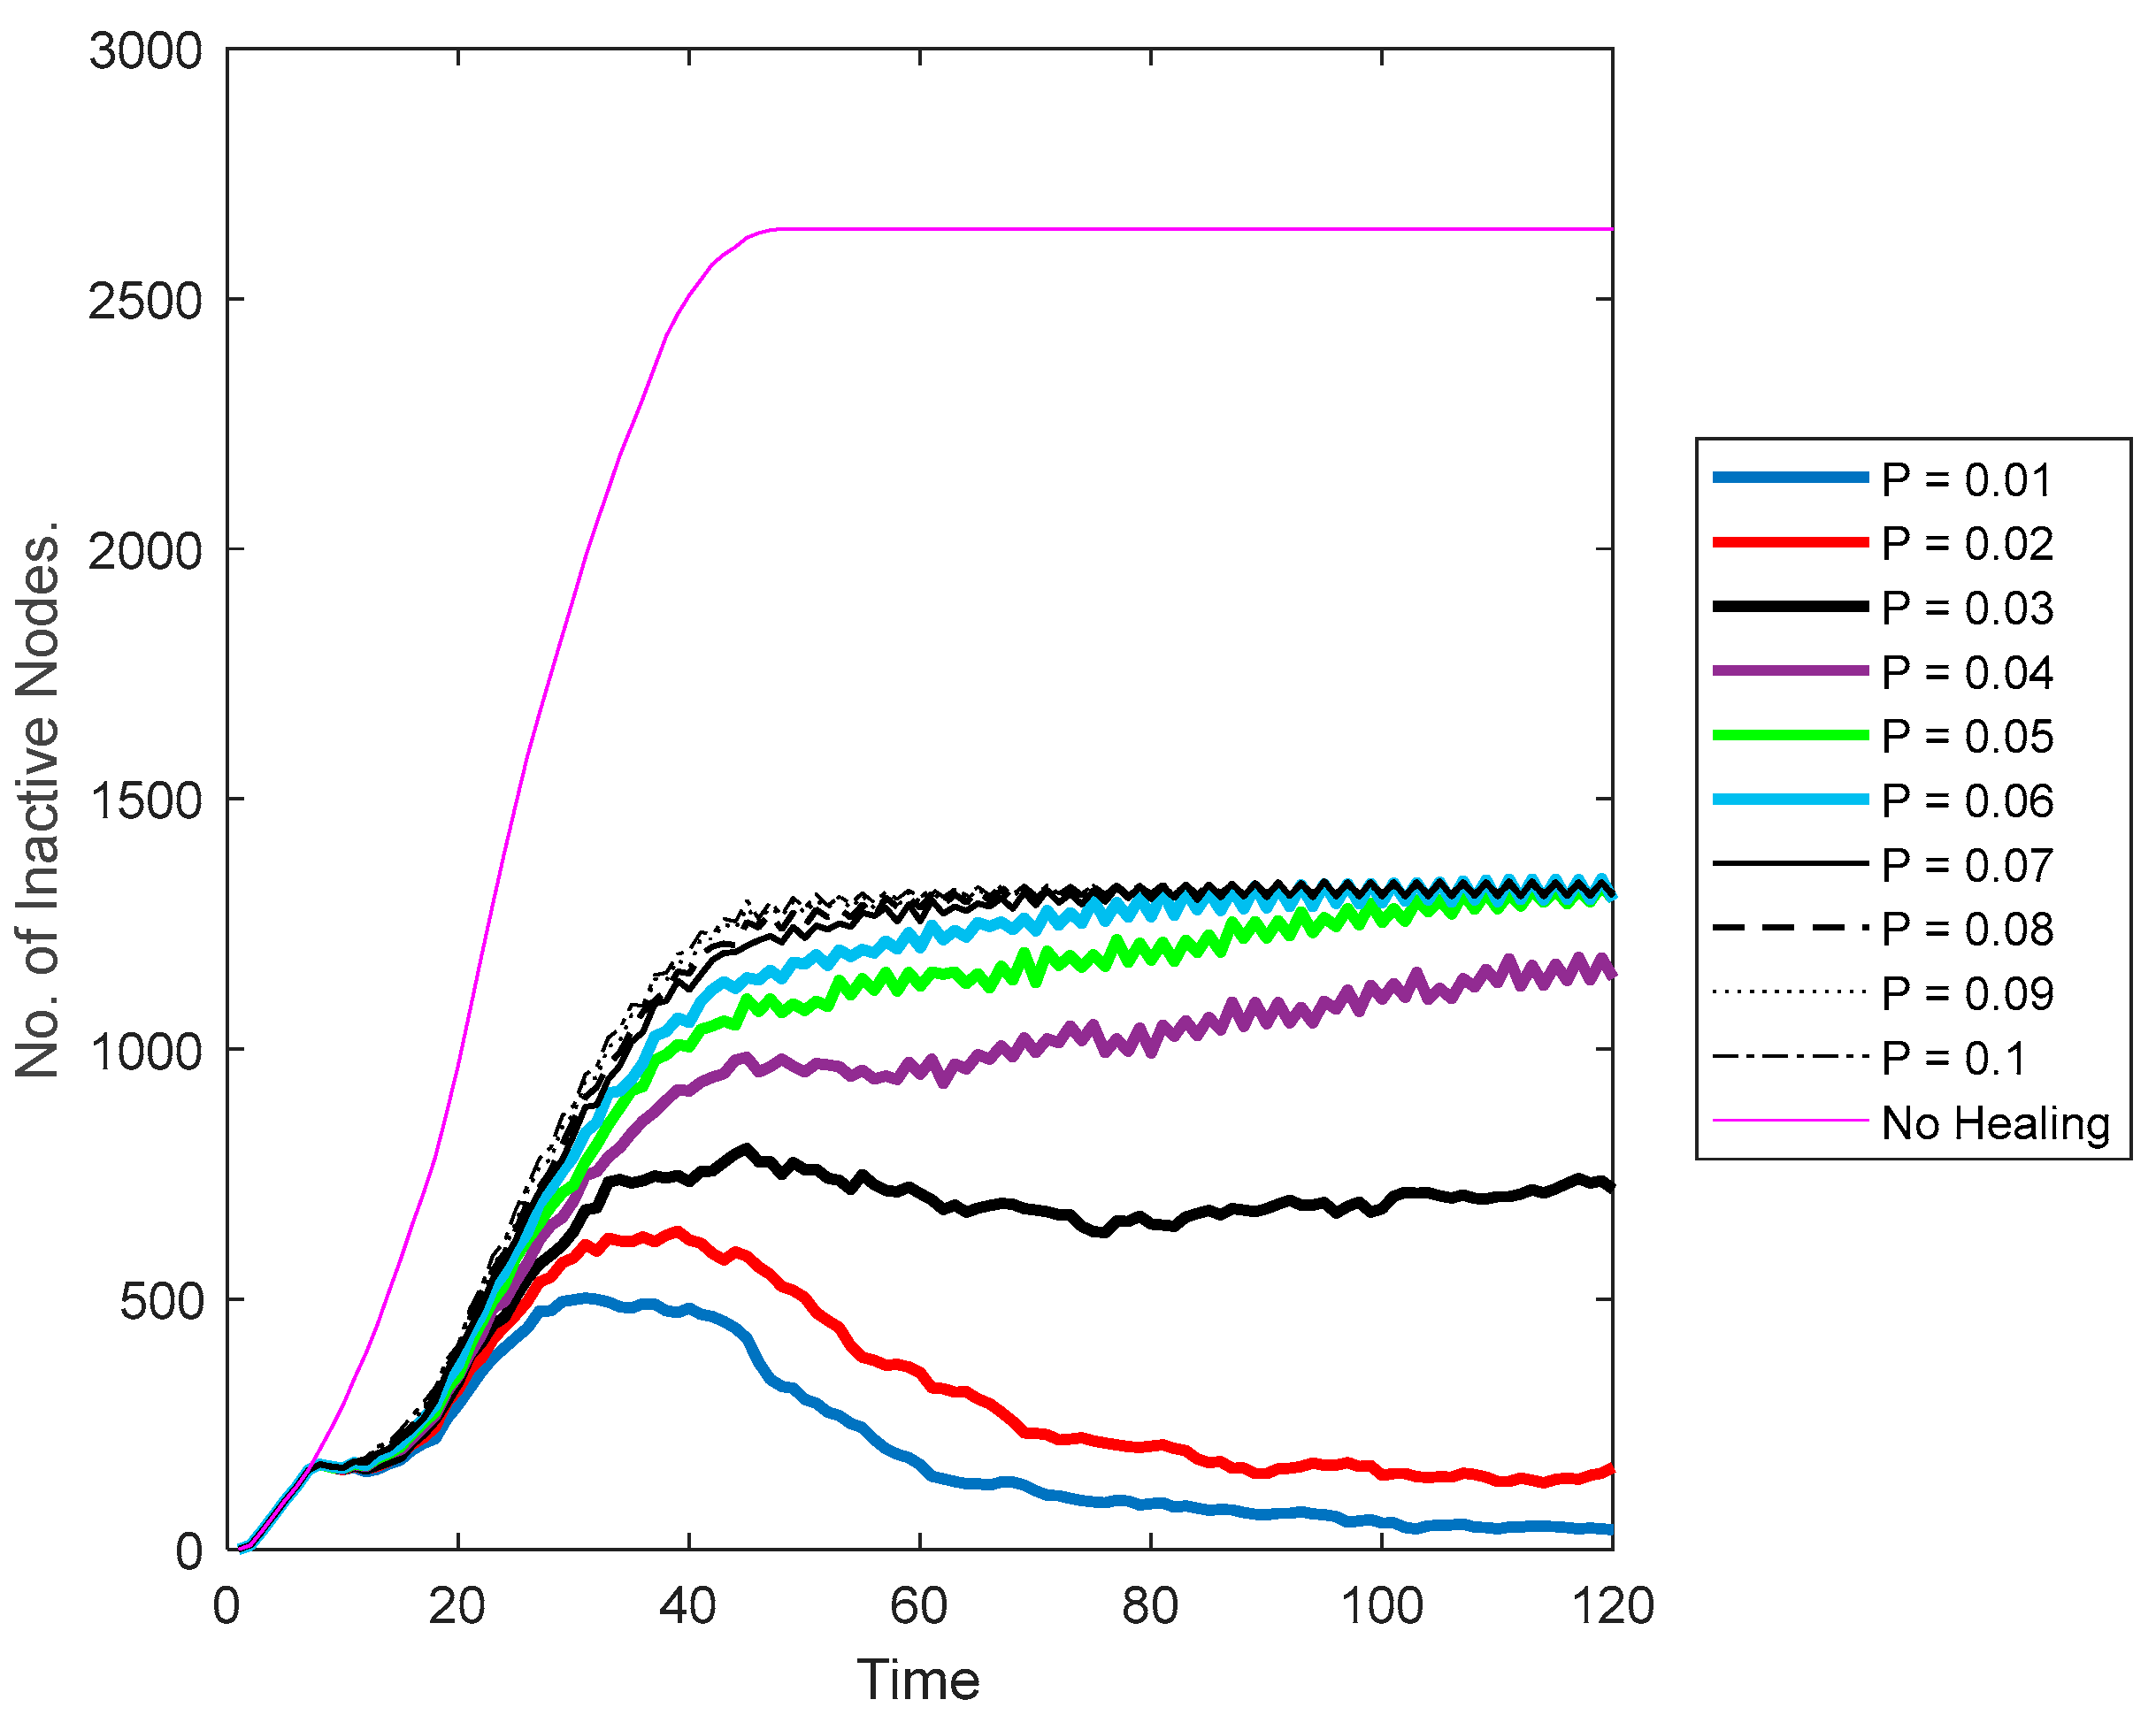
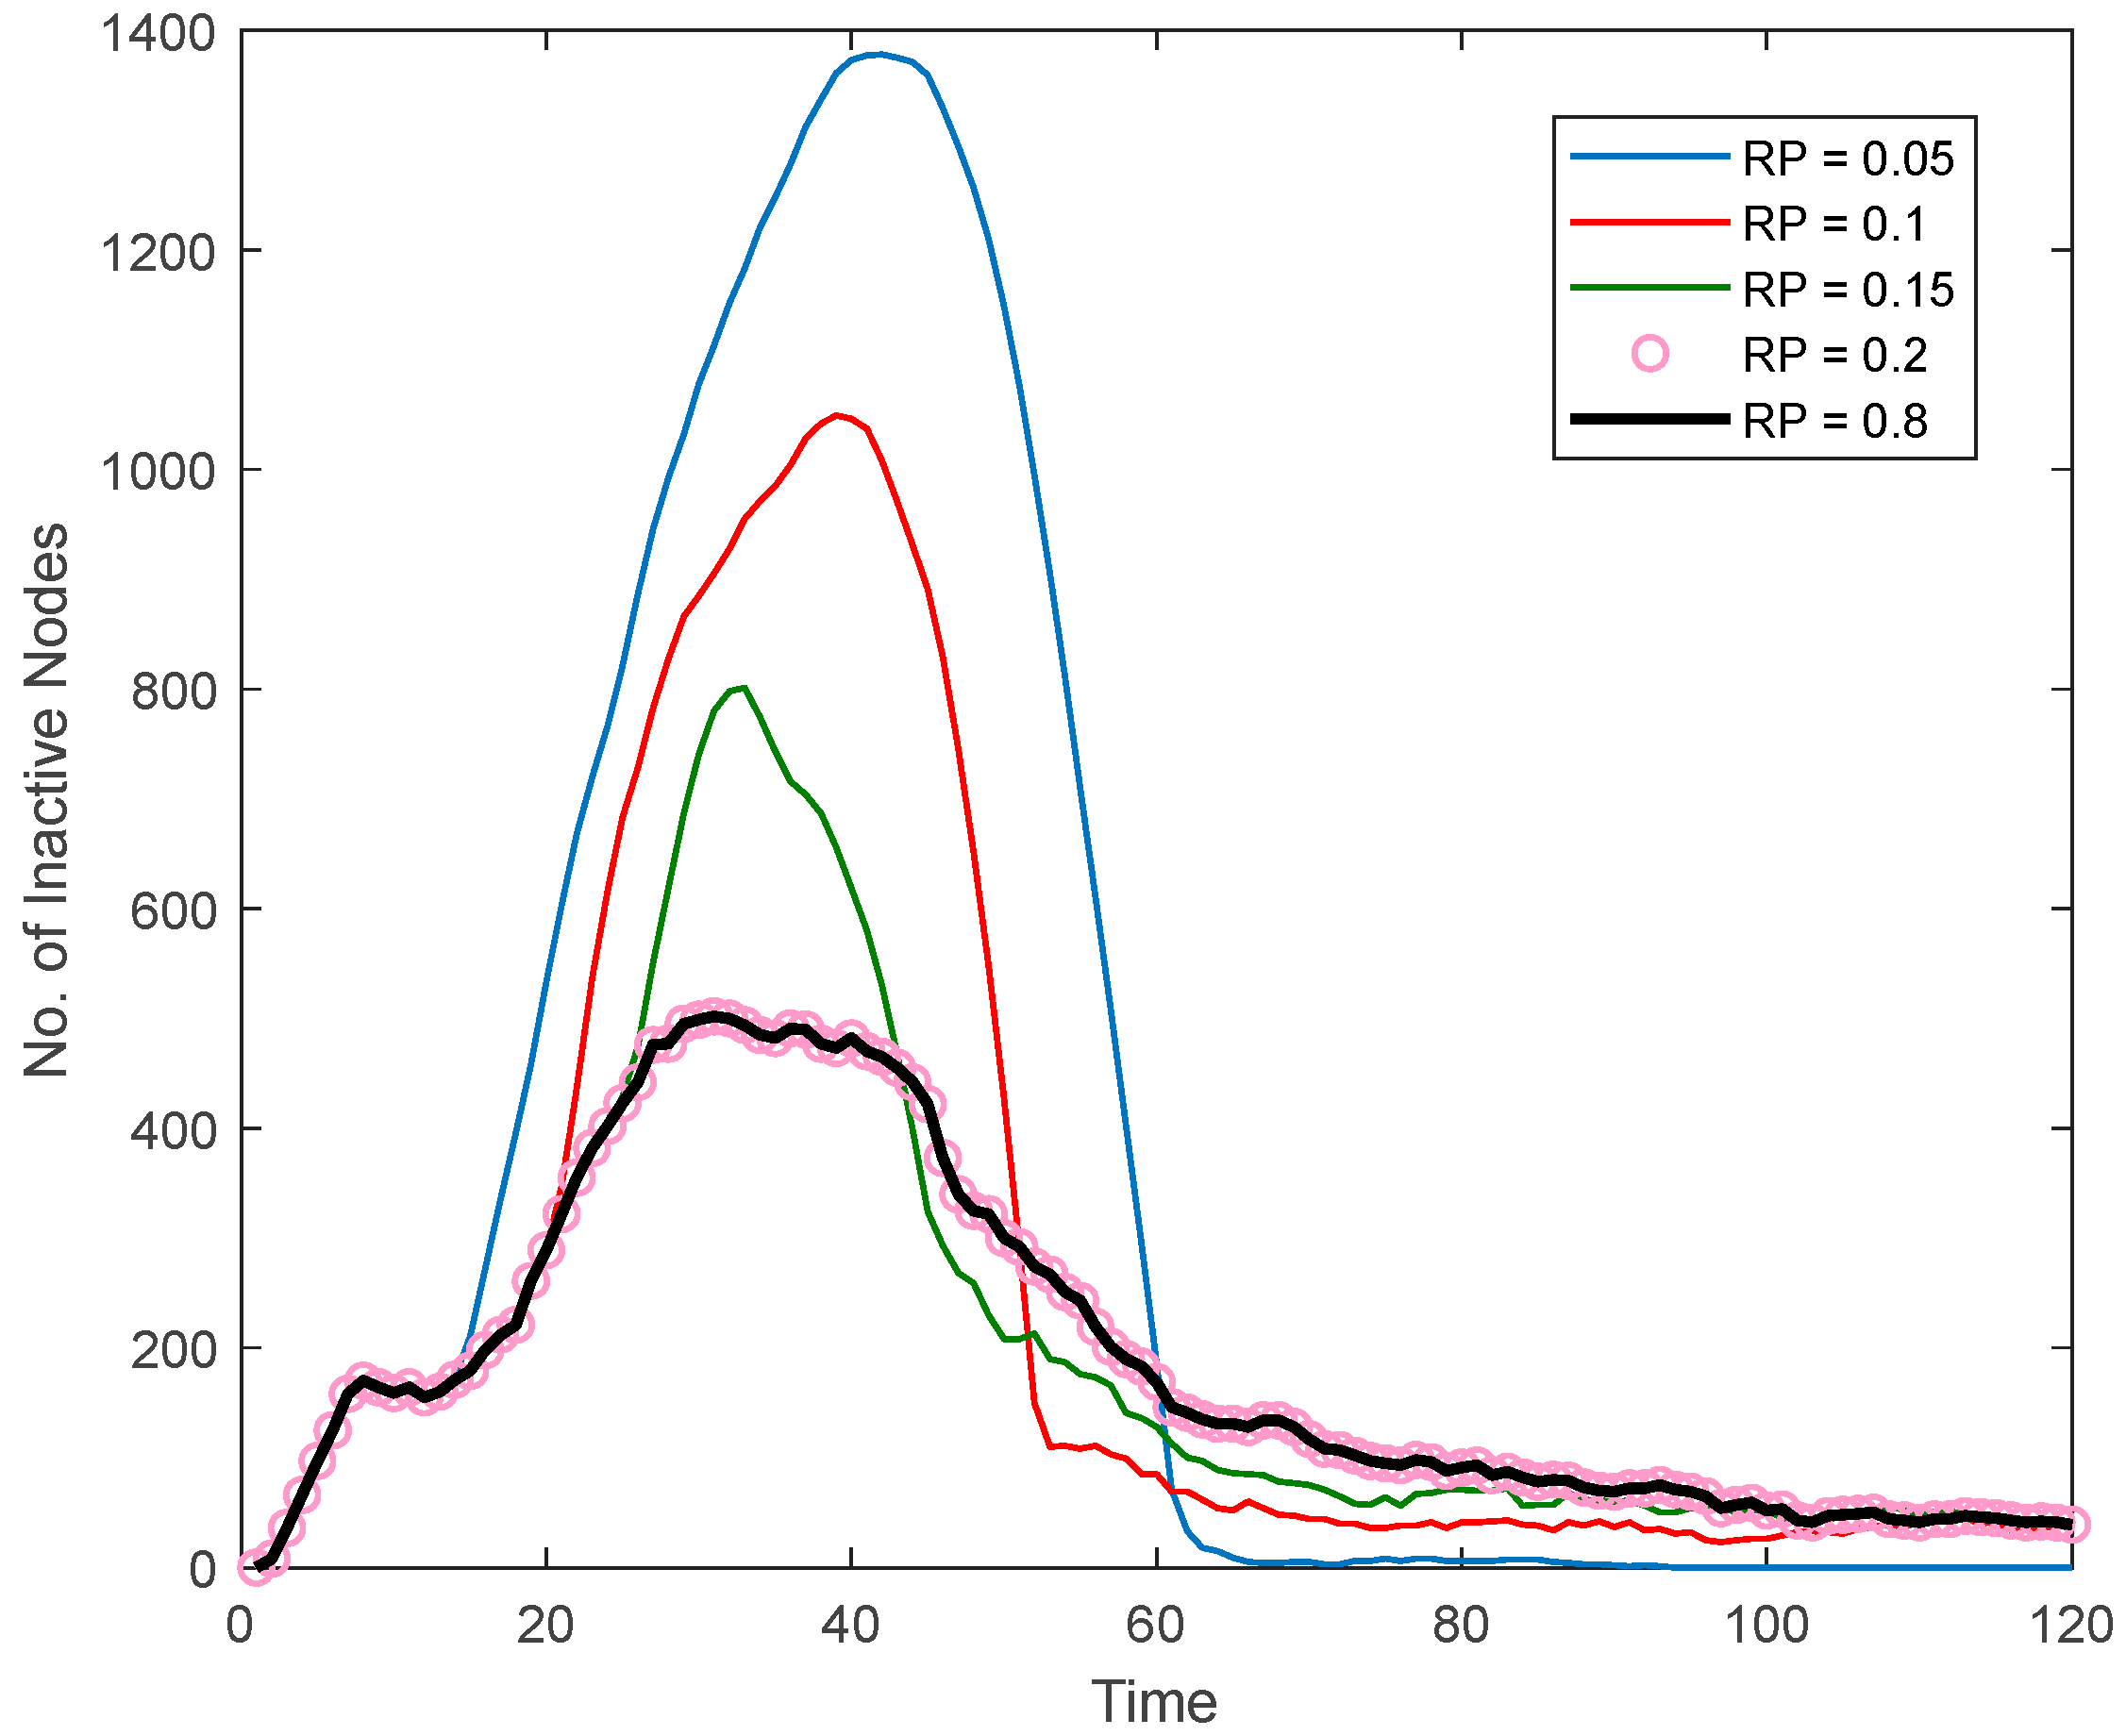
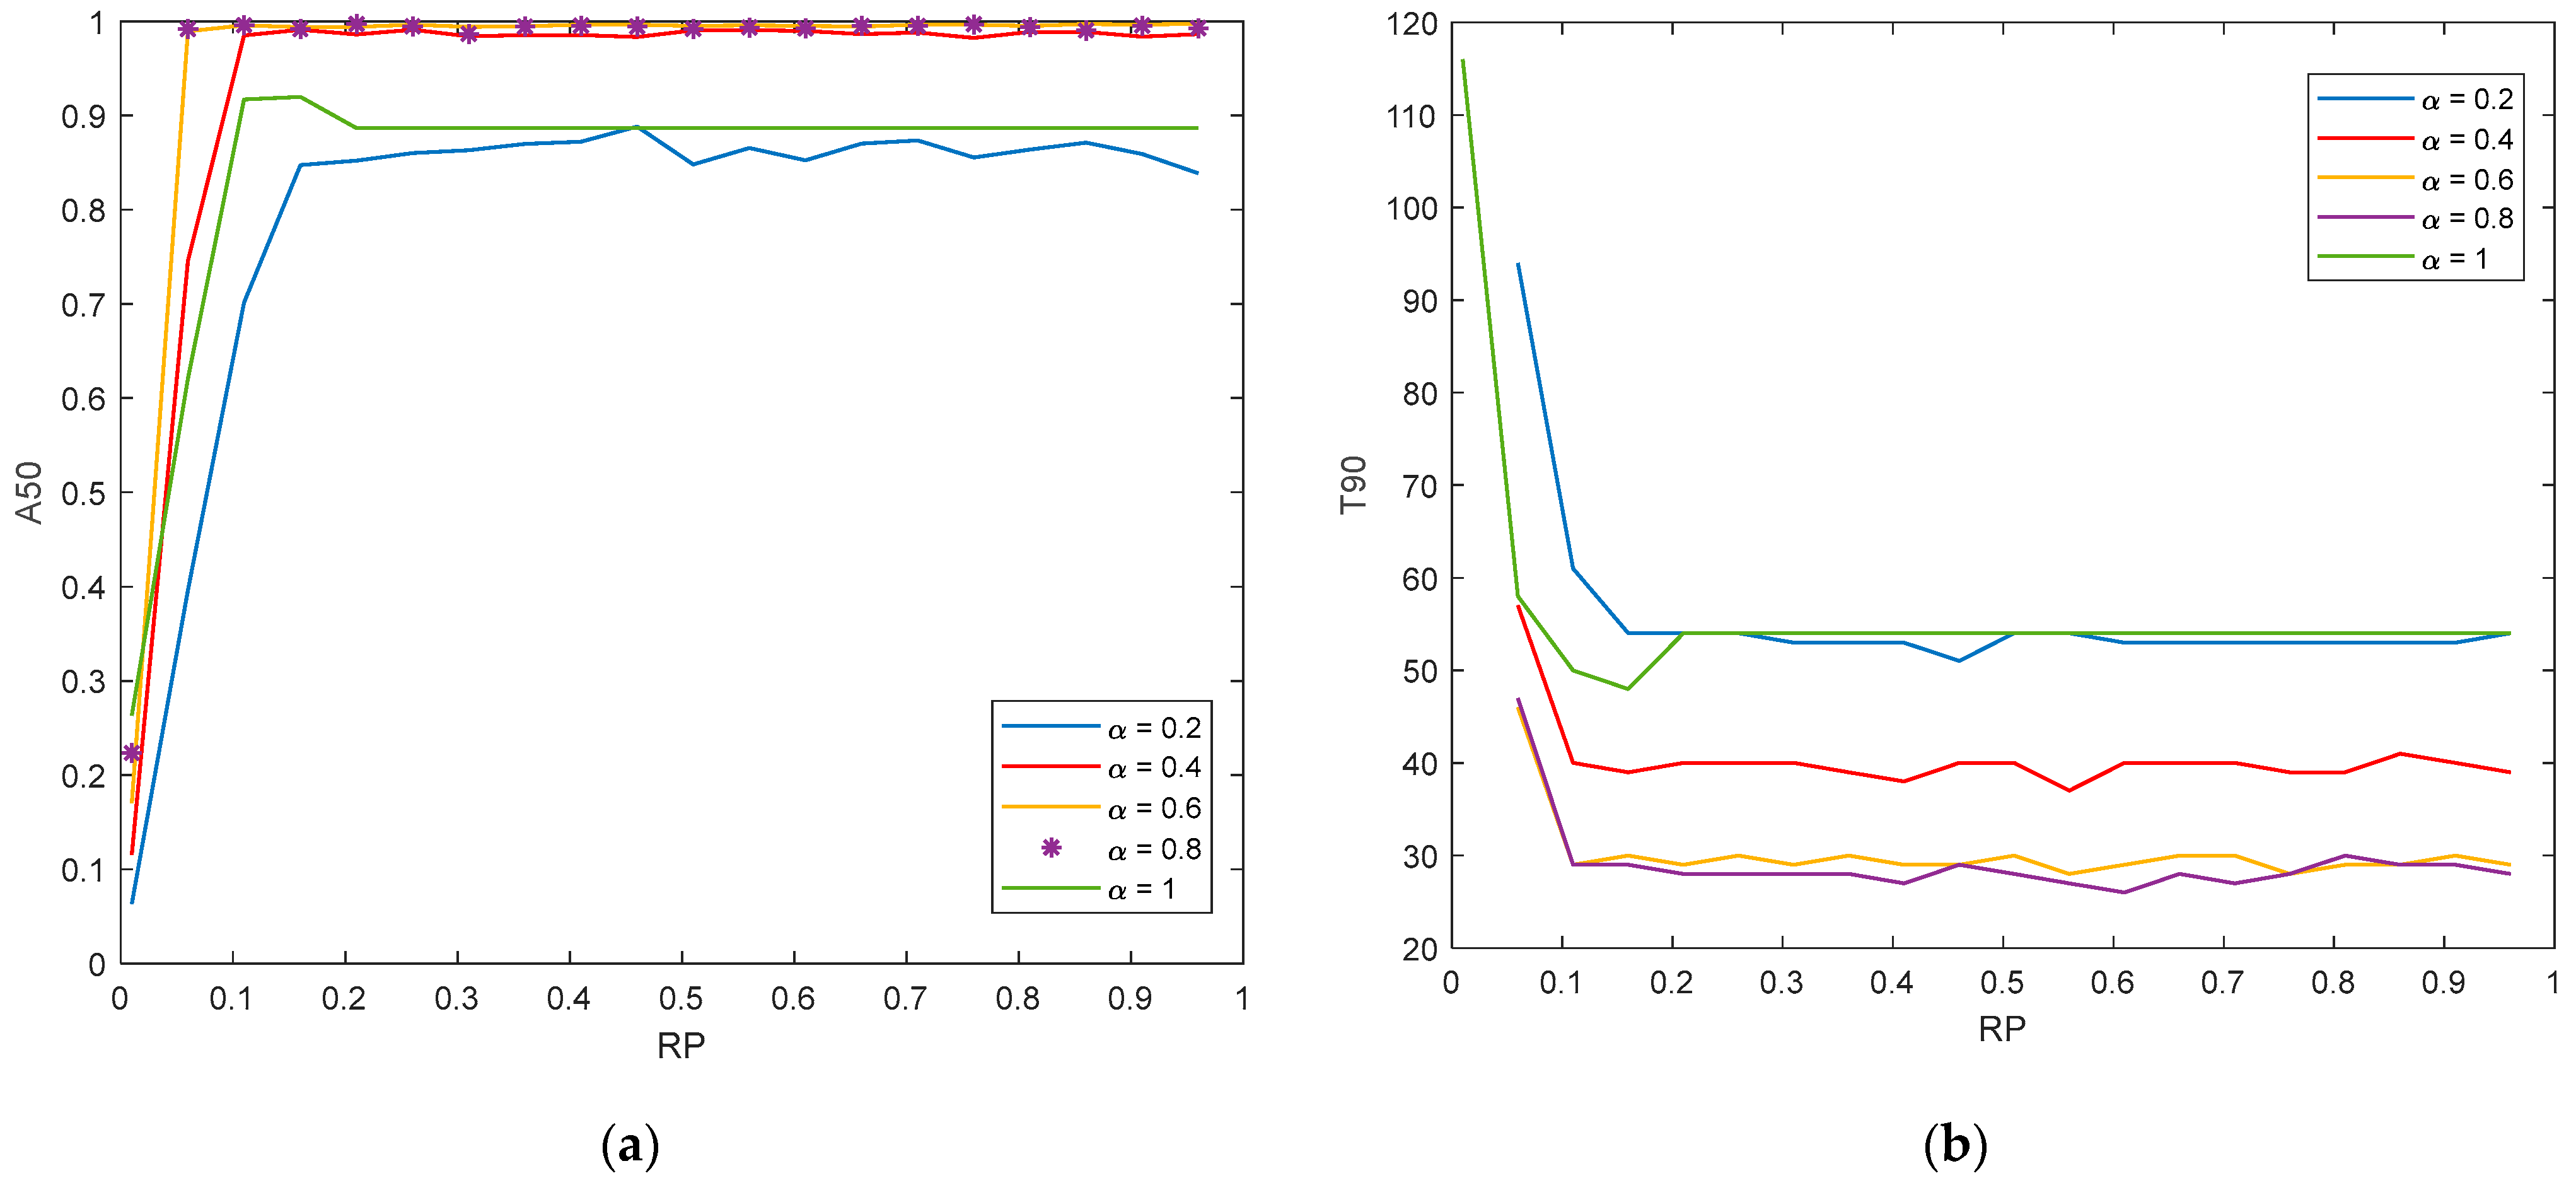
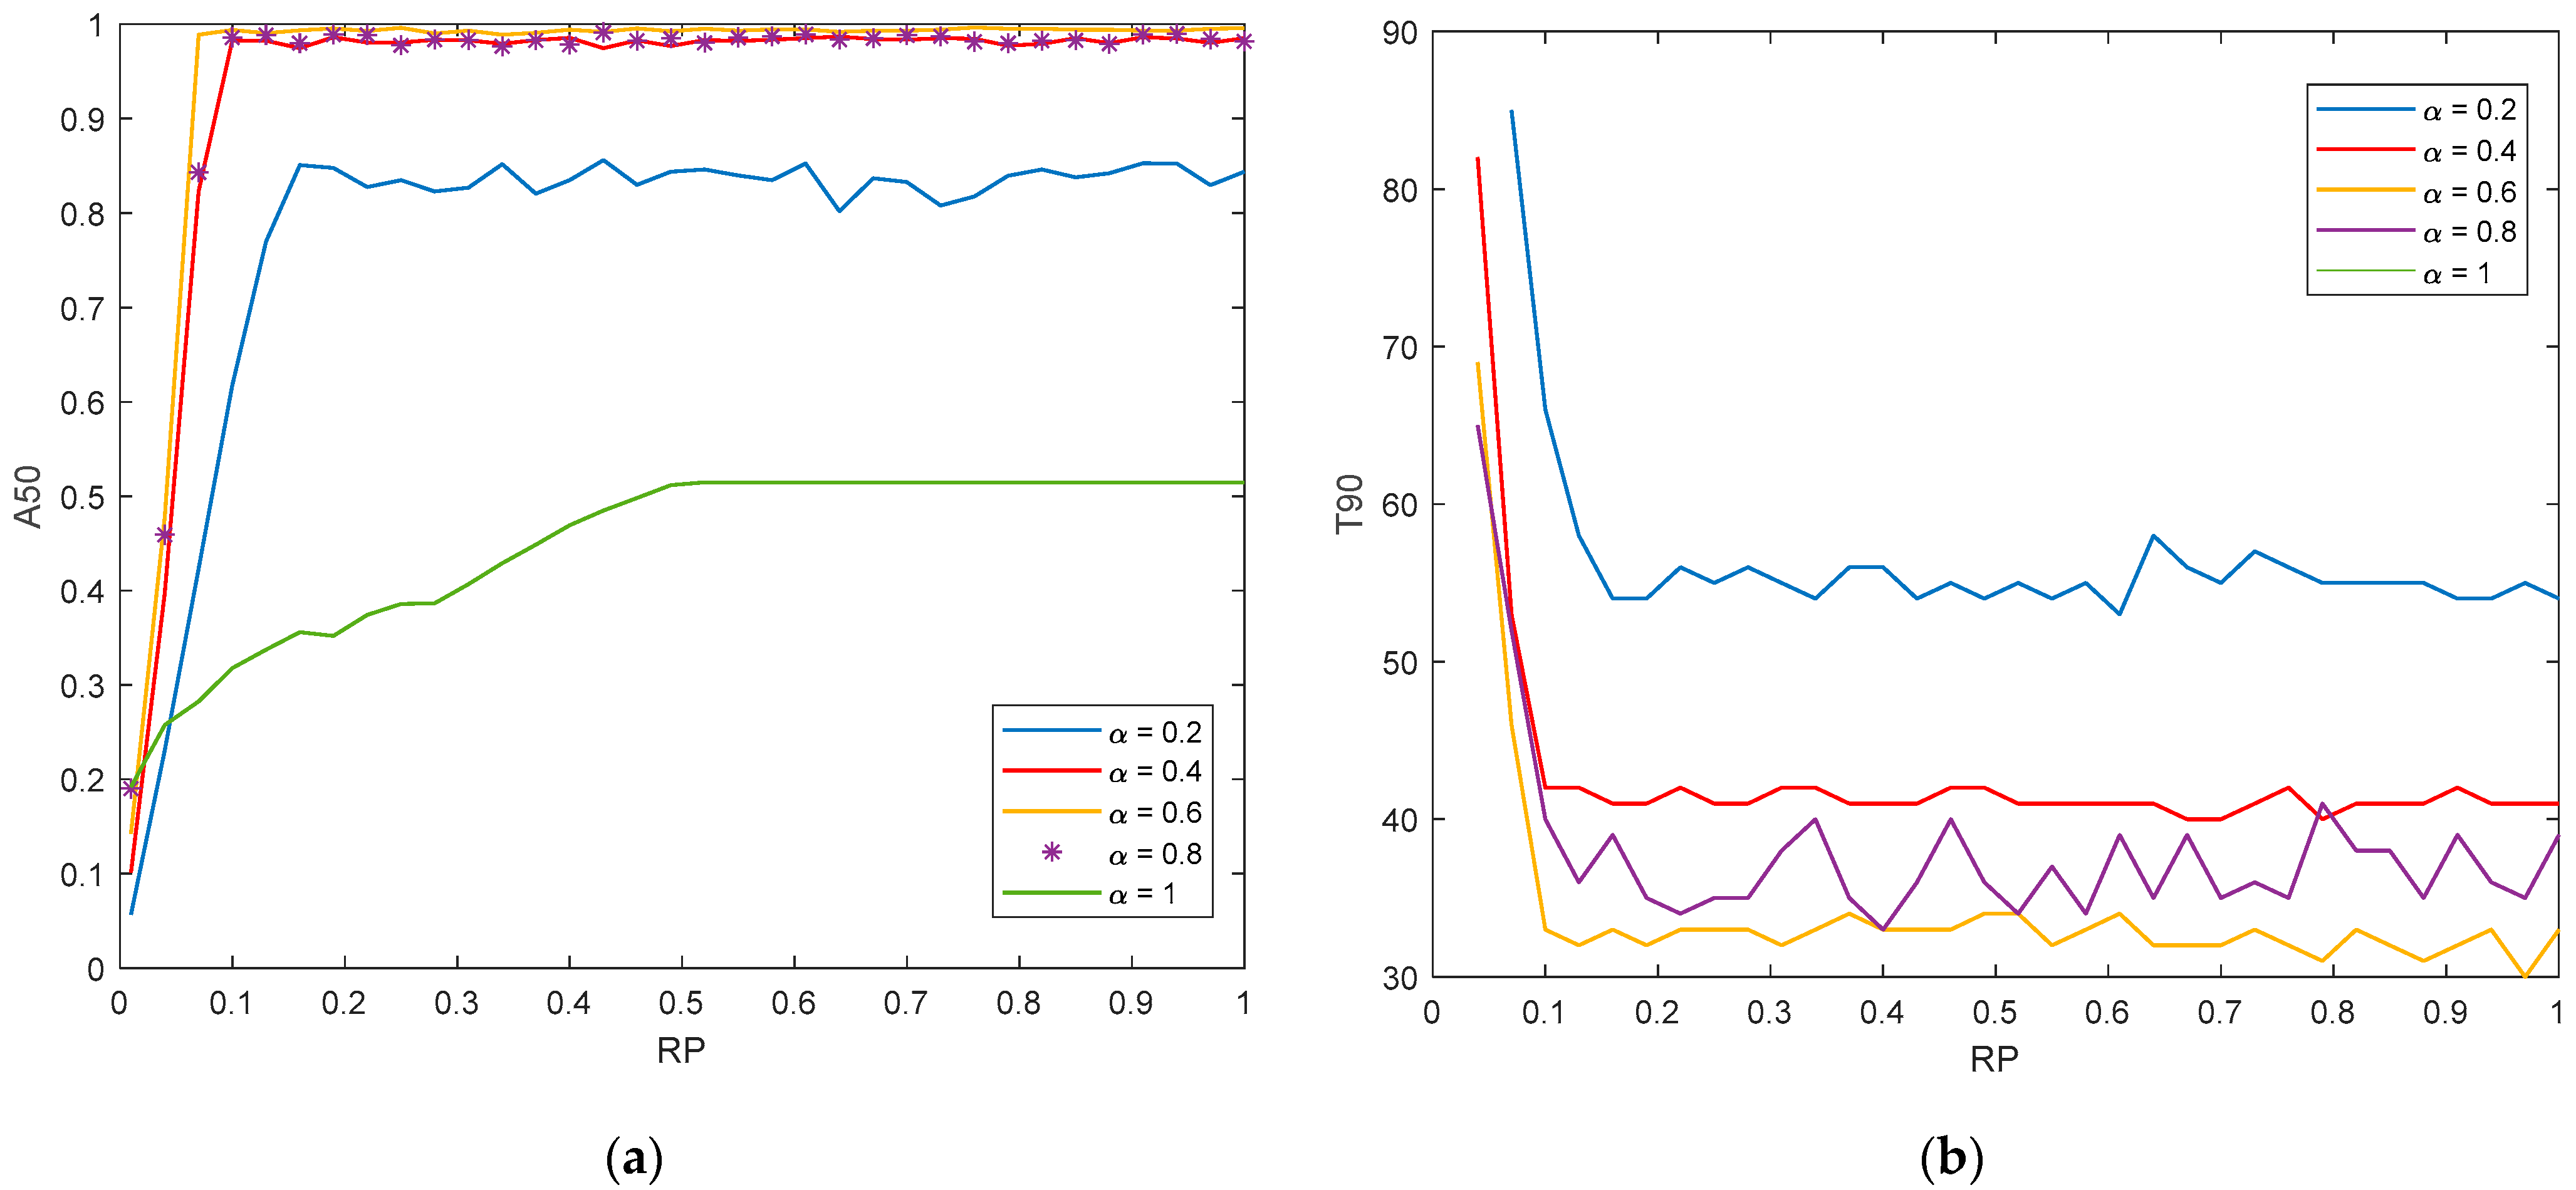
3.3. System Resilience Metrics

To quantitatively assess the resiliency of the networked system, this work uses two metrics called recovery level at time 50, A50, and 90% recovery time, T90. A50 is the ratio of the number of recovered nodes to the total number of nodes at time step 50. T90 is the time when 90% of the nodes in the original network are active after healing. If the number of inactive nodes at time 90 forms more than 5% of the system’s nodes, T90 will be infinity, which indicates that the system will never be able to recover to this level. The results of A50 and T90 for different certainty levels and recovery potential are presented in Figure 9 with P kept fixed at a value of 0.01. For all the cases in Figure 9a, the dependence of A50 on RP is consistent. As the RP values increase, the recovery levels at time 50 also rise; however, RP has an upper limit, beyond which any further increase in it cannot improve the recovery performance. It can also be observed that the recovery levels increase when α increases; however, there is an anomaly at α = 1. At this specific value, the corresponding recovery level is approximate to the level of α = 0.2. In Figure 9b, the general trend is that higher RP corresponds to lower T90. Additionally, it can be observed that fast recoveries yield from an increase in α. As pointed out in Figure 9a, there is an anomaly at α = 1, where the recovery time T90 is long and almost equal to the time of the case α = 0.2.
To fully capture the resilience characteristics of the system, more simulations are run for the case of P = 0.1 and the representative results are presented in Figure 10. Similar to the results presented in Figure 9a, high RP values lead to high A50 recovery levels. However, lower certainty α leads to worse recovery levels. It can be seen that the system shows good resilience characteristics to some extent after using the proposed dynamic healing mechanism. For instance, when α is 0.2, the system is ~85% recovered. However, for the case of α = 1, one can observe an anomaly presented, since the A50 recovery level is ~50%. The dependence of T90 on RP is demonstrated and presented in Figure 10b with P kept fixed at a value of 0.1. One single case with α = 1 is not visible, since the system fails to recover 90%, even after long simulation times. Additionally, in Figure 10a,b, one can see a lot of rippled curves, and these are considered to be artifacts. Figure 9 and Figure 10 are consistent with the values in Figure 6; higher P values lead to long time recoveries and low recovery levels.

4. Conclusions

In this paper, a simulation framework to evaluate the resilience of networked energy storage systems is proposed. A new dynamic healing mechanism is used to recover energy storage systems against cascading overload failures. We explore the effect of running the cascading failure model and the healing model concurrently. The results show that our model mitigates the cascading failure and fully or partially recovers the network depending on various parameters. Regardless of the number of the initially attacked nodes, the system will restore its functionality almost at the same time. We also observe that when P increases, the model loses the ability to fully recover the system. Additionally, when the recovery potentials are sufficiently high, the road network undergoes recovery that leads to a state where almost all inactive nodes are reactivated. We also find out that there is an upper limit beyond which any further increase in it cannot improve the performance. Another parameter α plays a crucial role in the healing mechanism. When it is increased, the recovering time shortens, but it does not necessarily reduce the maximum number of inactive nodes. Lastly, we evaluate the resilience of the network by using two metrics, A50 and T90. We investigate the dependence of both resiliency metrics on α, P, and RP. The simulations show that as the RP values increase, the recovery levels at time 50 also rise and the T90 values decrease. As for the increase in α, the recovery levels A50 increase and T90 values decrease; however, there is an anomaly at α = 1, where higher P values lead to long time recoveries (T90) and low recovery levels (A50). This works lays the foundation for subsequent studies on optimization of model parameters to enhance the system’s resilience.

Author Contributions

Conceptualization, X.Z., H.H. and W.A.-A.; methodology, X.Z. and W.A.-A.; software, W.A.-A.; validation, X.Z., H.H. and W.A.-A.; investigation, X.Z., H.H. and W.A.-A.; resources, X.Z.; data curation, H.H. and W.A.-A.; writing—original draft preparation, X.Z., H.H. and W.A.-A.; writing—review and editing, X.Z.; visualization, H.H. and W.A.-A.; supervision, X.Z.; project administration, X.Z.; funding acquisition, X.Z. All authors have read and agreed to the published version of the manuscript.

Funding

This research was funded in part by the US Department of the Interior, grant number DWPR-R21AC10075.

Data Availability Statement

Not applicable.

Conflicts of Interest

The authors declare no conflict of interest.

References

  1. AL Shaqsi, A.Z.; Sopian, K.; Al-Hinai, A. Review of Energy Storage Services, Applications, Limitations, and Benefits. Energy Rep. 2020, 6, 288–306. [Google Scholar] [CrossRef]
  2. Nazemi, M.; Moeini-Aghtaie, M.; Fotuhi-Firuzabad, M.; Dehghanian, P. Energy Storage Planning for Enhanced Resilience of Power Distribution Networks Against Earthquakes. IEEE Trans. Sustain. Energy 2020, 11, 795–806. [Google Scholar] [CrossRef]
  3. McNamara, W.; Passell, H.; Montes, M.; Jeffers, R.; Gyuk, I. Seeking Energy Equity through Energy Storage. Electr. J. 2022, 35, 107063. [Google Scholar] [CrossRef]
  4. Liu, J.; Jian, L.; Wang, W.; Qiu, Z.; Zhang, J.; Dastbaz, P. The Role of Energy Storage Systems in Resilience Enhancement of Health Care Centers with Critical Loads. J. Energy Storage 2021, 33, 102086. [Google Scholar] [CrossRef]
  5. Parzen, M.; Neumann, F.; Van Der Weijde, A.H.; Friedrich, D.; Kiprakis, A. Beyond Cost Reduction: Improving the Value of Energy Storage in Electricity Systems. Carbon Neutrality 2022, 1, 26. [Google Scholar] [CrossRef]
  6. U.S. Energy Information Administration. Battery Storage in the United States: An Update on Market Trends (August 2021). Available online: https://www.eia.gov/analysis/studies/electricity/batterystorage/pdf/battery_storage_2021.pdf (accessed on 1 July 2022).
  7. U.S. Energy Information Administration. Annual Energy Outlook 2022, with Projections to 2050. Available online: https://www.eia.gov/outlooks/aeo/pdf/AEO2022_Narrative.pdf (accessed on 1 July 2022).
  8. Stephan, A.; Battke, B.; Beuse, M.D.; Clausdeinken, J.H.; Schmidt, T.S. Limiting the Public Cost of Stationary Battery Deployment by Combining Applications. Nat. Energy 2016, 1, 16079. [Google Scholar] [CrossRef]
  9. Dugan, J.; Mohagheghi, S.; Kroposki, B. Application of Mobile Energy Storage for Enhancing Power Grid Resilience: A Review. Energies 2021, 14, 6476. [Google Scholar] [CrossRef]
  10. Massachusetts Department of Energy Resources. Mobile Energy Storage Study: Emergency Response and Demand Reduction; Massachusetts Department of Energy Resources: Boston, MA, USA, 2020. [Google Scholar]
  11. Hayajneh, H.S.; Bashetty, S.; Salim, M.N.B.; Zhang, X. Techno-Economic Analysis of a Battery Energy Storage System with Combined Stationary and Mobile Applications. In Proceedings of the 2018 IEEE Conference on Technologies for Sustainability (SusTech), Beach, CA, USA, 11–13 November 2018; pp. 1–6. [Google Scholar]
  12. Hayajneh, H.S.; Zhang, X. Logistics Design for Mobile Battery Energy Storage Systems. Energies 2020, 13, 1157. [Google Scholar] [CrossRef] [Green Version]
  13. Hayajneh, H.S.; Lainfiesta, M.; Zhang, X. Three Birds One Stone: A Solution to Maximize Renewable Generation, Incentivize Battery Deployment, and Promote Green Transportation. In Proceedings of the 2020 IEEE Power Energy Society Innovative Smart Grid Technologies Conference (ISGT), Washington, DC, USA, 17–20 February 2020; pp. 1–5. [Google Scholar]
  14. Hayajneh, H.S.; Herrera, M.L.; Zhang, X. Design of Combined Stationary and Mobile Battery Energy Storage Systems. PLoS ONE 2021, 16, e0260547. [Google Scholar] [CrossRef]
  15. Mishra, S.; Anderson, K.; Miller, B.; Boyer, K.; Warren, A. Microgrid Resilience: A Holistic Approach for Assessing Threats, Identifying Vulnerabilities, and Designing Corresponding Mitigation Strategies. Appl. Energy 2020, 264, 114726. [Google Scholar] [CrossRef] [Green Version]
  16. Sullivan, J.E.; Kamensky, D. How Cyber-Attacks in Ukraine Show the Vulnerability of the U.S. Power Grid. Electr. J. 2017, 30, 30–35. [Google Scholar] [CrossRef]
  17. Ayeng’o, S.; Schirmer, T.; Kairies, K.-P.; Axelsen, H.; Sauer, D.U. Comparison of Off-Grid Power Supply Systems Using Lead-Acid and Lithium-Ion Batteries. Sol. Energy 2018, 162, 140. [Google Scholar] [CrossRef]
  18. Schäfer, B.; Witthaut, D.; Timme, M.; Latora, V. Dynamically induced cascading failures in power grids. Nat. Commun. 2018, 9, 1975. [Google Scholar] [CrossRef] [PubMed] [Green Version]
  19. Sergiou, C.; Lestas, M.; Antoniou, P.; Liaskos, C.; Pitsillides, A. Complex Systems: A Communication Networks Perspective Towards 6G. IEEE Access 2020, 8, 89007–89030. [Google Scholar] [CrossRef]
  20. Li, Y.; Duan, D.; Hu, G.; Lu, Z. Discovering Hidden Group in Financial Transaction Network Using Hidden Markov Model and Genetic Algorithm. In Proceedings of the 2009 Sixth International Conference on Fuzzy Systems and Knowledge Discovery, Tianjin, China, 14–16 August 2009; Volume 5, pp. 253–258. [Google Scholar] [CrossRef]
  21. Wang, Y.-M.; Chen, B.; Chen, X.-S.; Gao, X.-E. Cascading Failure Model for Command and Control Networks Based on an m-Order Adjacency Matrix. Mob. Inf. Syst. 2018, 2018, e6404136. [Google Scholar] [CrossRef] [Green Version]
  22. Holme, P.; Kim, B.J. Vertex overload breakdown in evolving networks. Phys. Rev. E 2002, 65, 066109. [Google Scholar] [CrossRef] [Green Version]
  23. Carreras, B.; Lynch, V.; Dobson, I.; Newman, D.E. Critical points and transitions in an electric power transmission model for cascading failure blackouts. Chaos Interdiscip. J. Nonlinear Sci. 2002, 12, 985–994. [Google Scholar] [CrossRef]
  24. Zhang, Y.; Arenas, A.; Yağan, O. Cascading failures in interdependent systems under a flow redistribution model. Phys. Rev. E 2018, 97, 022307. [Google Scholar] [CrossRef] [Green Version]
  25. Stippinger, M.; Kertész, J. Enhancing resilience of interdependent networks by healing. Phys. A Stat. Mech. Appl. 2014, 416, 481–487. [Google Scholar] [CrossRef] [Green Version]
  26. Stippinger, M.; Kertész, J. Universality and scaling laws in the cascading failure model with healing. Phys. Rev. E 2018, 98, 042303. [Google Scholar] [CrossRef] [Green Version]
  27. Gallos, L.K.; Fefferman, N.H. Simple and efficient self-healing strategy for damaged complex networks. Phys. Rev. E 2015, 92, 052806. [Google Scholar] [CrossRef] [PubMed] [Green Version]
  28. Al Aqqad, W.; Zhang, X. Modeling command and control systems in wildfire management: Characterization of and design for resiliency. In Proceedings of the 2021 IEEE International Symposium on Technologies for Homeland Security (HST), Boston, MA, USA, 8–9 November 2021; pp. 1–5. [Google Scholar] [CrossRef]
  29. Liu, C.; Li, D.; Fu, B.; Yang, S.; Wang, Y.; Lu, G. Modeling of self-healing against cascading overload failures in complex networks. Europhys. Lett. 2014, 107, 68003. [Google Scholar] [CrossRef]
  30. Pumpuni-Lenss, G.; Blackburn, T.; Garstenauer, A. Resilience in Complex Systems: An Agent-Based Approach. Syst. Eng. 2017, 20, 158–172. [Google Scholar] [CrossRef]
  31. Al-Aqqad, W.; Hayajneh, H.S.; Zhang, X. Dynamics and resiliency of networks with concurrent cascading failure and self-healing. PLoS ONE 2022, 17, e0277490. [Google Scholar] [CrossRef]
  32. Network Data Repository. Minnesota|Road Networks. Available online: https://networkrepository.com/road-minnesota.php (accessed on 9 June 2022).
Figure 1. A conceptual description of the networked energy storage systems model. ESS-WHs house a number of MoBESSs. Each ESS-WH provides a cluster of services and is connected to other ESS-WHs through the road network (dashed lines). Electric trucks ship MoBESSs from an ESS-WH to its demand locations or the neighboring ESS-WHs. The network of ESS-WHs thus becomes an off-grid power system, the resiliency of which is the subject of this study.
Processes 11 00762 g001
Figure 2. Modules involved in the simulation of the ESS-WH network load-based cascading failure and the healing process.
Processes 11 00762 g002
Figure 3. Flowcharts of key processes involved in the simulation. (a) CF; (b) SH; and (c) Main.
Processes 11 00762 g003
Figure 4. The road network of the state of Minnesota was chosen as a case study in this paper. It includes 2640 nodes representing the road intersections and 3302 links representing the roads.
Processes 11 00762 g004
Figure 5. The number of inactive nodes as a function of time under load-based failures with a various number of initially attacked nodes. In all cases, α = 1, P = 0.01, T = 0.05, RP = 0.8.
Processes 11 00762 g005
Figure 6. The number of inactive nodes as a function of time under load-based failures with deferent P values. In all cases, α = 1, RP = 0.8, T = 0.05, number of initial attack nodes = 8.
Processes 11 00762 g006
Figure 7. The number of inactive nodes as a function of time under load-based failures with different recovery potentials. In all cases, α = 1, T = 0.05, P = 0.01, number of initial attack nodes = 8.
Processes 11 00762 g007
Figure 8. The number of inactive nodes as a function of time under load-based failures with different recovery potentials for (a) α = 0.2, (b) α = 0.5, (c) α = 0.8.
Processes 11 00762 g008
Figure 9. The results of (a) recovery levels at time step 50, P = 0.01, and (b) 90% recovery time, P = 0.01, under load-based cascading failures with different certainty levels and various recovery potentials in the Minnesota road network.
Processes 11 00762 g009
Figure 10. The results of (a) recovery levels at time step 50, P = 0.1, (b) 90% recovery time, P = 0.1, under load-based cascading failures with different certainty levels and various recovery potentials in the Minnesota road network.
Processes 11 00762 g010
Table 1. Nomenclature.
SymbolExplanation
Ggraph network
Ntotal number of nodes
Labelslabels of all nodes
Loadsloads of all nodes
atolerance factor
Ccapacities of all nodes
GOgraph object where labels, Loads, and C are fields in it
tmaxmaximum simulation time
Mdemode of attack
attacknumber of initially attacked nodes
Ddisturbance of additional load
G_dmgdamaged graph network
Mnumber of inactive nodes
Nrnnodes that need to be removed
Nldloads that need to be redistributed
LCload-to-capacity ratio
Nodes_Pprioritized nodes
Pportion of the load of each active neighboring node
RPrecovery potential
αcertainty level
Ttriggering level
G_recrecovered graph network
ivinactive nodes
bactive neighboring nodes of iv
blloads of active neighboring nodes
lmean ( P * b l )
ratioratio of the active nodes to the total number of nodes
ESS-WHsenergy storage systems warehouses
MoBESSsmobile battery energy storage systems
Table 2. Module description.
Module Input DataModel ParameterOutput To
1GLabels, Load, a, C2, 3, 4
2GO, tmaxMde, attack, D3
3G_dmg, M, Nrn, Ndl, tmaxNA4
4G_dmg, Nodes_P, tmaxLC, P, RP, α3, 5
51, 2, 3, 4T, tmaxNA
6M, NratioNA
Disclaimer/Publisher’s Note: The statements, opinions and data contained in all publications are solely those of the individual author(s) and contributor(s) and not of MDPI and/or the editor(s). MDPI and/or the editor(s) disclaim responsibility for any injury to people or property resulting from any ideas, methods, instructions or products referred to in the content.

