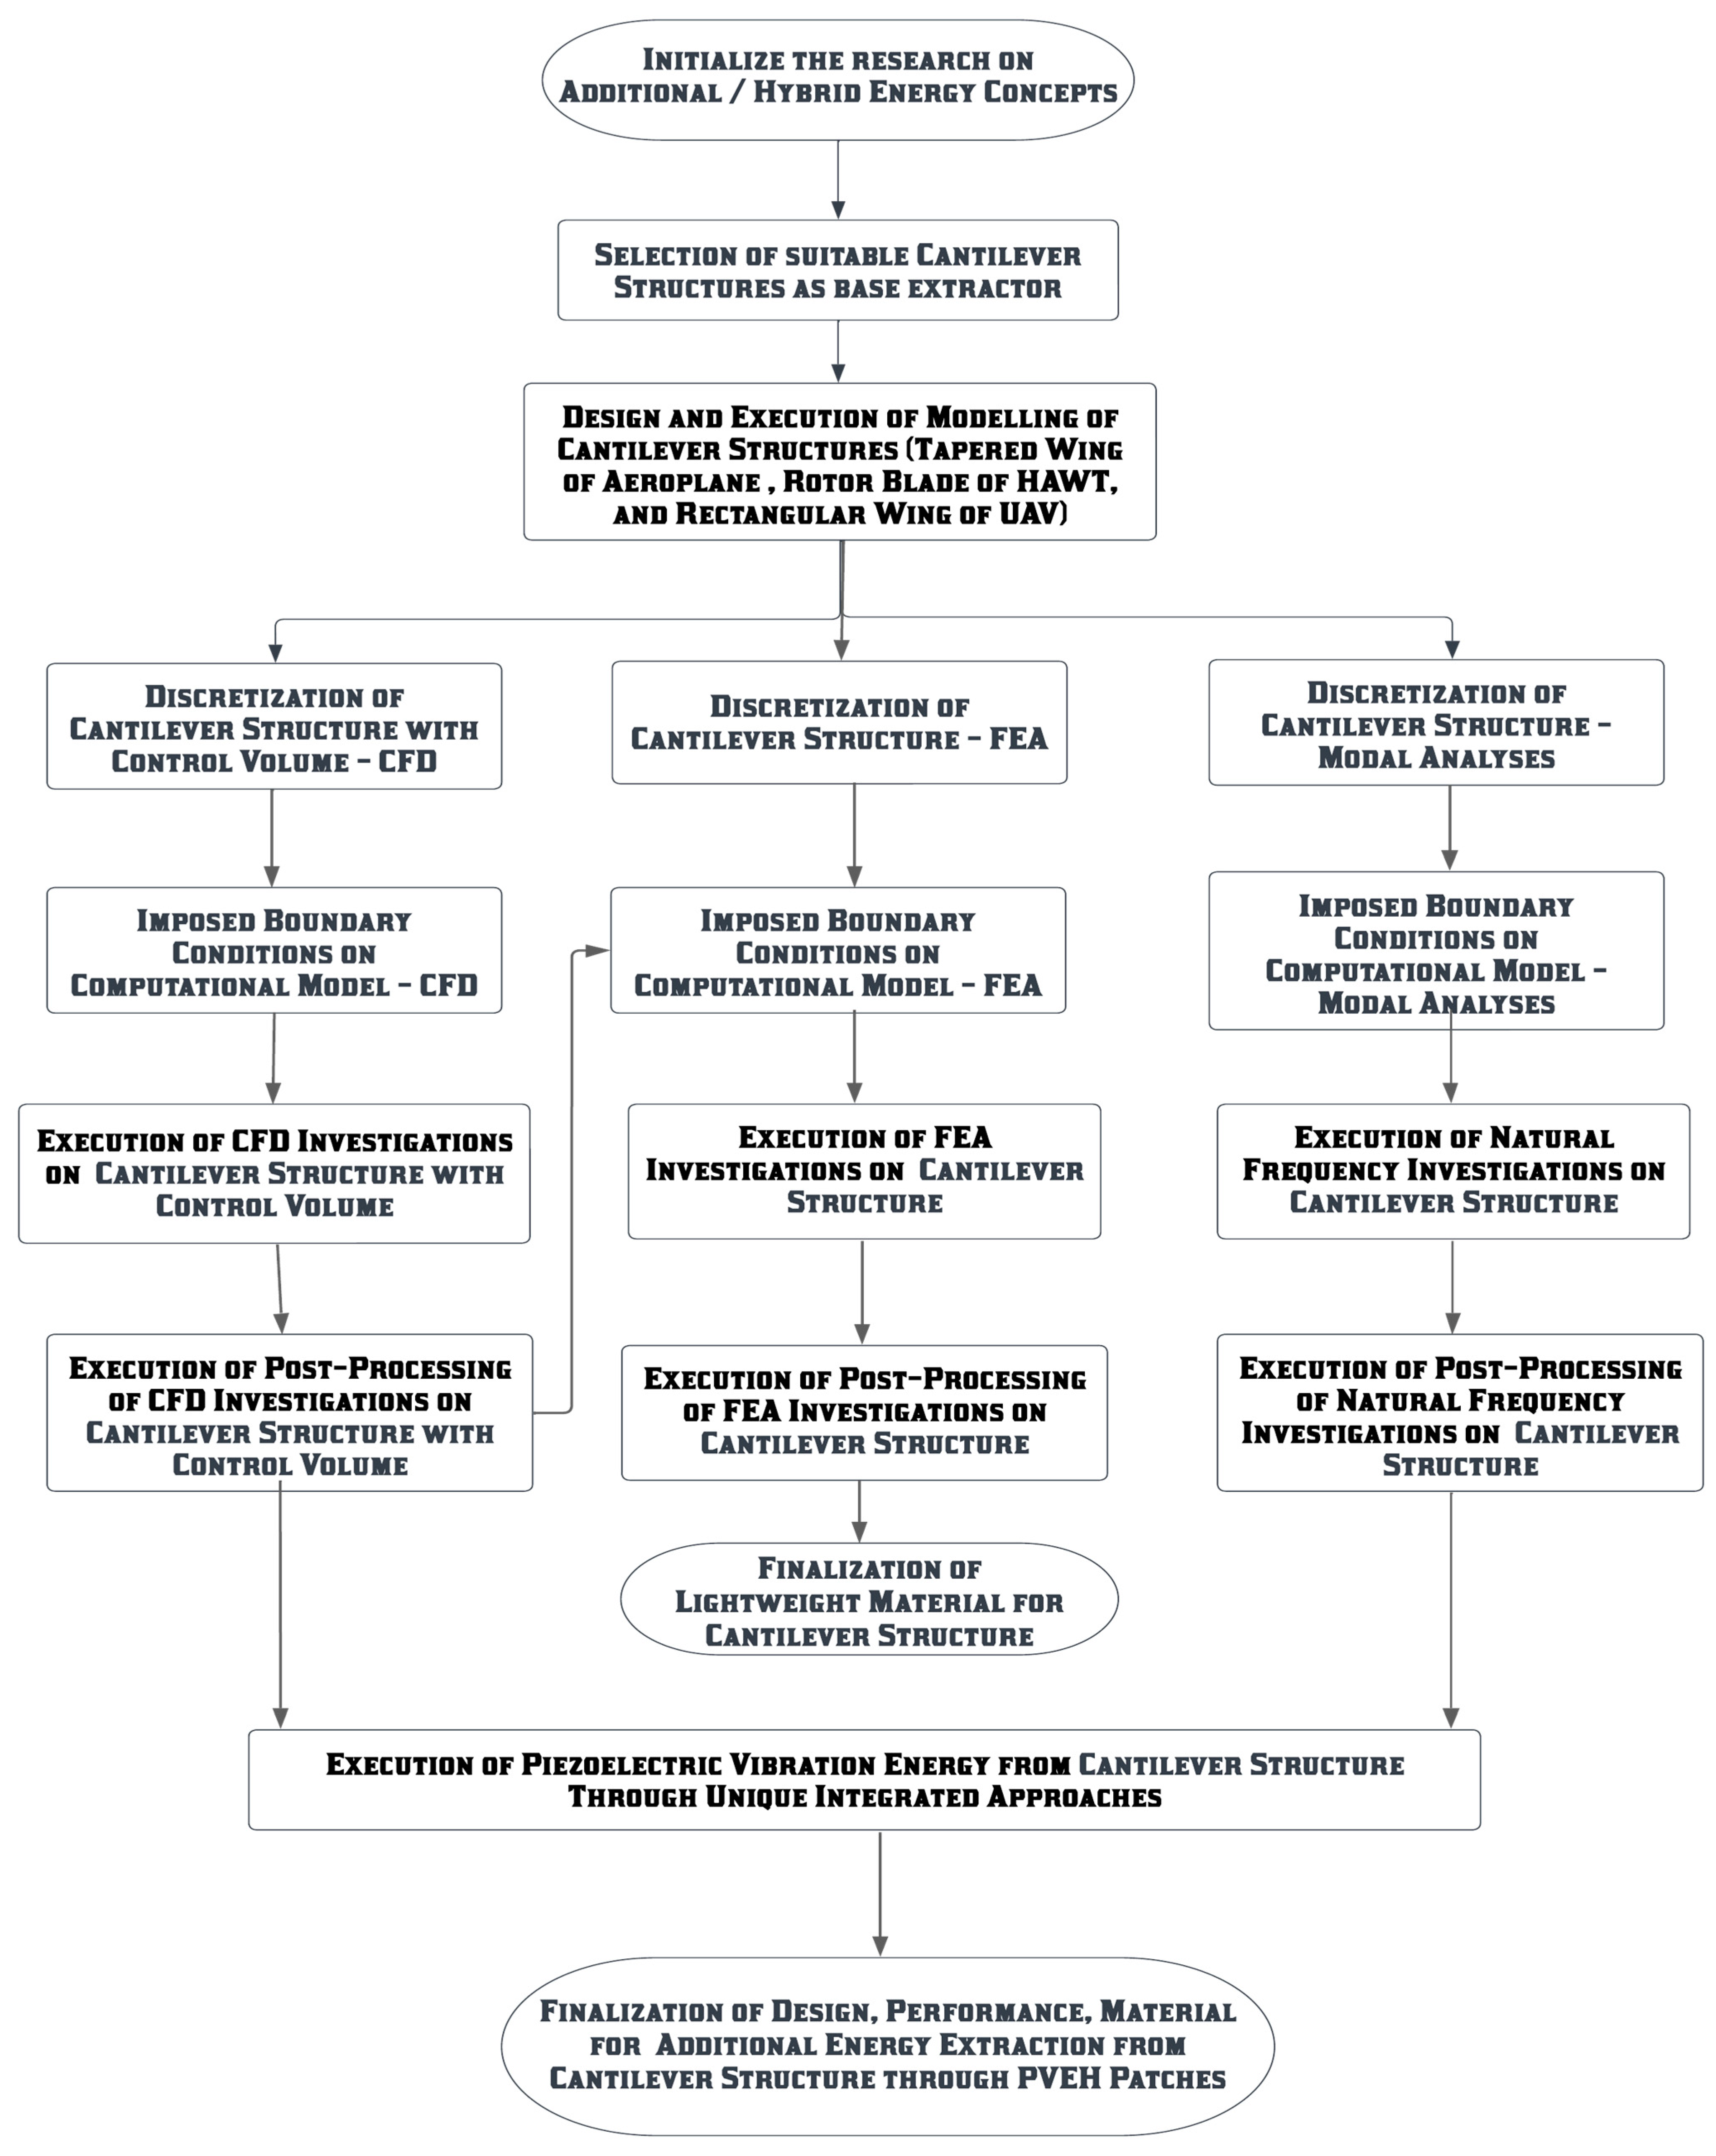
Article

Investigation of Aeroelastic Energy Extraction from Cantilever Structures under Sustained Oscillations

by
Naveen Kumar Kulandaiyappan
1,*,
Bruce Ralphin Rose John
2 and
Vijayanandh Raja
1
1
Department of Aeronautical Engineering, Kumaraguru College of Technology, Coimbatore 641049, Tamil Nadu, India
2
Department of Mechanical Engineering, Anna University Regional Campus, Tirunelveli 627007, Tamil Nadu, India
*
Author to whom correspondence should be addressed.
Processes 2023, 11(3), 830; https://doi.org/10.3390/pr11030830
Submission received: 5 January 2023 / Revised: 23 February 2023 / Accepted: 2 March 2023 / Published: 10 March 2023

Abstract

:
The present article is focused on a detailed computationalinvestigation of energy production capacity of various lightweight materials that are employed with piezoelectric vibration energy harvesters (PVEHs) subjected to various aeroelastic effects. Piezoelectric transducers are primarily employed to capture vibrational energy, which yields predictable and locally storable electrical energy. Higher energy extraction is possible under larger deflections of the structures when they are employed with PVEHs. In order to estimate the largest possible deflection of the structures, the response of them under external perturbations is estimated. An airplane wing consists of tapered planform, an advanced wind turbine blade, and the rectangular wings of an unmanned aerial vehicle (UAV) are considered for the vibrational analysis as the feasibility of achieving larger deflection is high compared with other aerodynamic surfaces. The stated elastic structures are modelled with different lightweight materials such as aluminium alloy, glass fibre-reinforced polymer (GFRP), titanium alloy, carbon fibre-reinforced polymer (CFRP), and Kevlar fibre-reinforced polymer (KFRP). Advanced partly coupled computational simulations are carried out with computational fluid dynamics (CFDs), and structural and vibrational effects to investigate the energy harvesting potential from the perturbations. Based on the outcomes of vibrational analysis, the raw transformable power production capacity of different lightweight materials that are employed with a cantilevered PVEH is estimated. The most suitable combination of material and associated aeroelastic effect which yields a significant amount of raw energy in each application is proposed and discussed with findings.

1. Introduction

The current global energy demands continually insist on energy harvesting from possible aeroelastic phenomena, one of the promising fields of energy harvesting. This is primarily because of the increasing demand for clean energy all over the world [1]. In this article, three different cantilever structures with different lightweight material combinations are taken into consideration for raw energy estimation. Cantilever structures are considered herein because of their potential to deliver considerable deflection as they are subjected to different loading conditions. Cantilevered piezoelectric vibration energy harvesters (PVEHs) are being utilized to their full potential for various engineering fields to date. Following the discovery of piezoelectric materials by Jacques and Pierre Curie, these materials have been developed by many researchers according to their applications and requirements. This research has assisted in overcoming the specific challenges associated with energy demands that are to be addressed in the field of aerospace engineering. In general, four different types of piezoelectric materials are used for the process of energy harvesting, i.e., ceramics, single crystals, polymers, and composites [1,2]. These piezoelectric materials are non-centrosymmetric substances because the positive and negative ions have the tendency to move when they are subjected to a mechanical strain [1,2]. Since the generation of piezoelectric energy depends on material property of the structure in which it is attached, the analysis of different novel lightweight materials could lead to the possibility of additional energy extraction. The three composite materials such as carbon fibre-reinforced polymer (CFRP), glass fibre-reinforced polymer (GFRP), and Kevlarfibre-reinforced polymer (KFRP), are considered in the present work to have more strength-to-weight ratio than the conventional materials that ensure the higher Factor of Safety (FoS) of the structure under adverse loading conditions [3]. In general, active piezoelectric layers are classified into unimorph and bimorph configurations. However, the bimorph configuration is not preferred here because of the poor small displacement outputthat requires additional mechanical magnification and the scaled unimorph cantilevered PVEH is utilized to determine the energy withdrawal levels [3].
The focus of this study is on the energy produced by flutter phenomena on the structural components of PVEH. Power generation in the 0.223 meter-long wing of the UAV is confirmed to be quite high via sophisticated computational simulations and theoretical calculations. Wind turbine blades on the other hand, can generate an acceptable amount of power at the same excitation velocity as medium-sized components such as airplane wings. When looking at all three parts of the structure together, the likelihood of flutter happening at the targeted excitation velocity is lower than average. In this study, a 250 m/s average speed range for civilian aircraft was selected as optimal. The chance of flutter developing in the aircraft wing is higher than in the other two structural elements for an excitation velocity of 75 m/s. It has been shown that composite materials can serve as a solid foundation for increased power generation. Thus, the use of composite materials in aircraft wings is unprecedented and can result in significant benefits.

Literature Survey

Tang et al. [4] successfully demonstrated the presence of limit cycle oscillations (LCO) at low subsonic flow in a two-dimensional cantilevered plate placed in a flow that was uniform and incompressible throughout. The work clearly reported the calculation of structural nonlinearities as well as changes in bending stiffness and mass inertia while the system remains in oscillation. The moderate loosely coupled-based fluid–structure interaction (FSI) method wasused to assess the characteristics of LCO by Rose et al. [5,6]. Balakrishnan et al. [7] presented a methodology to assess the flutter velocities of a flying wing with a high aspect ratio laden with point masses and subjected to inviscid air flow. A high-altitude long-endurance winged unmanned aerial vehicle (UAV) was used to examine the flutter speed variation due to the variation in the number of loads applied to the structure and the number of panels that make up the flying wing. It was concluded that on a constant wingspan the effect of increment in point masses is marginal on the flutter speed.
The numerical investigation carried out by Fazelzadeh et al. [8] illustrated the effects of roll angular velocity, fuselage mass, external storage mass, and their placements on wing flutter in free flight. The wing is represented by a classical beam and incorporates bending–torsion flexibility. Extensive parametric simulations show that the anticipated flutter boundaries are affected by the rigid body roll angular velocity, fuselage mass, and external stores mass and placements.
Kampchen et al. [9] examined a coupled algorithm for simulating fluid–structure interaction using experimental data from a highly elastic rectangular wing model with a supercritical airfoil. The coupled algorithm simultaneously solves the Euler or Navier–Stokes equations and the structural dynamics equations in the time domain and shows good agreement with experimental data.
Hemon et al. [10] established the existence of transient growth of energy for the coupled-mode flutter of an airfoil. Transient growth is exclusively studied numerically, thus making its application to unique FSI problems. The energy amplification for a given beginning state is also observed and the experiments are matched with unsteady airfoil theory-based computer models.Vijayanandh et al. [11] proposed computer model-based systematic methodology and a conceptual design of a fixed wing UAV and validation methodology for the working behaviour of the fixed wing of the UAV.
Stephen [12] proposed a concept of low-power micro-electromechanical systems to harvest energy from the vibrating environment and numerically proved that a highly damped system would extract energy over a wide bandwidth of frequencies. The energy generation is maximum when the frequency of excitation is equal to the undamped natural frequency of the vibrating system.Owens et al. [13] numerically investigated the vibration-based harvester that uses electromagnetic induction for energy conversion by introducing a nonlinear coupling model, where the magnetic flux gradient is dependent on the coil and magnet positioning. The investigation provided the possibility of continuous energy harvesting by broadening the harvester’s frequency response.
Through the concept of flutter mill, Tang et al. [14] proposed an energy harvester which combines the oscillating cantilever plate under aeroelastic forces and a spring mass system and numerically proved that the region in the centre of the plate, where the curvature is at its greatest, is where the fluid exerts the greatest amount of force on the structure.
Dunnmon et al. [15] successfully conducted a power generation experiment on cantilever beam fitted with piezoelectric patches at a velocity lower than the flutter speed of the structure. The system observed 17% of the flow energy from where it is exposed. Moreover, it was demonstrated that small-scale rotary generators with an NACA0015 airfoil cross section fabricated of Al 2024-T6 alloy produces optimum power generation. Wangn et al. [16] successfully proved that the experimental results of energy generated due to flow-induced vibration using piezoelectric patches agree well with the Finite Element Model developed to estimate the generated voltage of the piezoelectric laminate. The experiment followed a resonance-based energy harvesting methodology and generated 0.2 Μw powers under an excitation frequency of 26 Hz and pressure amplitude of 1.196 kPa. An energy harvester generates energy from flow-induced vibrations from aV on Karman Vortex Street, as proposed by Wang et al. [17]; with a volume of 39.7 cubic centimetres it produces an average power of 20 mV when it is subjected to a pressure amplitude of 300 Pa and a frequency of 62 Hz.
Kuhl et al. [18] numerically proposed a concept of bluff body flutter mills where fully coupled direct numerical simulations (DNS) were conducted to examine the local energy dynamics of a flexible cantilevered plate in the wake of a two-dimensional circular cylinder mills and the investigation proved that the DNS provides excellent agreement with earlier experimental results. Mehmooda et al. [19] investigated the effect of load resistors on vortex-induced vibration-based energy harvesters and established that the voltage output continuously increases when increasing the load resistance. Mathematical modelling of the circular cylinder was subjected to vortex-induced vibration studies for a one-to-one validation process and the impacts of varying the energy by altering the governing factors such as the mass ratio, the mechanical damping coefficient, and the Re were listed.
McCarthy et al. [20] comprised the types of flow domains used for the energy harvesting process both theoretically and experimentally and stressed the need for a universally accepted metric for calculating efficiency of an energy harvester and to understand the effects of the realities of the outdoors, including the highly variable and turbulent flow conditions likely to be experienced. The potential of utilizing a piezo aeroelastic energy harvester to scavenge energy from a combination of vibratory base excitations and aerodynamic loading was investigated by Bibo et al. [21]. The investigation provided the correlation between the base excitation and root mean square (RMS) output power generation at self-sustained oscillation due to flutter instability and frequencies much lower than that.
Balaji et al. [22] investigated the computational fluid dynamics (CFDs) analyses on wingtip rotors through advanced computational tools. Focus was especially centred on operating pressure data, imposed turbulence model, type of order of governing equation used, and coupler for pressure and velocity data.
Optimization of a cantilevered PVEH’s active electrode area to maximum output power was attempted by Sijun et al. [23], with experimental data they proposed that when 44% of the cantilever’s surface is electrode metal, output power is maximum.
Wang et al. [24] proposed analytical techniques to calculate energy collected by an energy harvester in a hybrid UAV. Results from this study lend credence to the integrated engineering method proposed for estimating renewable energy via PVEH patches.
Vijayanandh et al. investigated the response of various composite/conventional alloy structures through FSI analyses by one-way coupling between the CFD investigations and FEA investigations under fixed supports, remote displacement supports, and uniform pressure distribution load [25,26,27,28,29]. Madasamy et al. [30] proposed a reviewing methodology to conclude 2D airfoils cross sections for a 1 kW horizontal axis wind turbine blade. Furthermore, it was numerically proved that a well-designed GFRPs wind turbine blade is very efficient compared with conventional alloys. Exergy production studies were carried out on computationally modelled wind turbine blades fabricated of various lightweight composite materials with PVEH patches. The estimated exergy efficiency of the wind turbine system is 39% and that of a wind turbine blade with PVEH patches is 28% [31]. Internal utilization of energy harvested by piezoelectricity on an unmanned amphibious system during its operation is proposed [32,33]. To generate secondary electricity, an unmanned underwater vehicle was fitted with PVEH patches over the blades of the propeller.
The computational hydrodynamic and vibrational analyses were carried out for various lightweight materials and solutions to finalize optimum PVEH patch area and suitable lightweight material for the specific application was proposed [34]. Mode shapes, energy extraction, density of lightweight materials, and volume of the structures affect the modal investigations [33,34]. The effect of natural frequencies on various structures was tested through base and advanced computational tools [35,36].
The solution methodologies of this current article follow the numerical simulation approach as a primary source. In this approach, the simulation work is broken down into three stages: the conceptual design of the cantilever structures, the estimation of natural frequency using modal analysis and finally, flow analysis on the cantilever structures to predict the pressure force acting on the cantilever structures region. The geometrical values of the cantilever structures, the frequency of the stimulation, and the material response are taken as the primary inference criteria for this study. The analytical approach was employed to estimate the power extraction per cycle from external perturbations in the aircraft. In this approach, major input parameters such as the natural frequency of the cantilever structures and the pressure force acting on the cantilever structures due to fluid interaction were predicted from numerical simulation and imported into the expression of the power generated by the harvester. Estimating the force and displacement acting on cantilever structures subject to FSI can be performed with the use of one-way coupling FSI. The Modal analysis tool found in ANSYS Workbench 16.2 was used to estimate natural frequencies of the various materials, and these estimates were then used to calculate the first five-mode forms. The power generations on the cantilever constructions for various materials are determined with the assistance of cantilevered PVEH, which uses theoretical calculations of the ideal active piezoelectric layer area formula. The detailed processes involved in the development of additional/hybrid energy extractions from various complicated cantilever structures are revealed in Figure 1.

2. Methodologies

Advanced coupled engineering methodologies are extensively utilized in this investigation. Advanced computational approaches and validated analytical methods are coupled to determine the extracted electrical energy from the cantilever structures. This chapter explains the problem formulations followed for the computational approaches.

2.1. Proposed Designs

All the shortlisted cantilevered components were modelled after considering a variety of characteristics and aredepicted pictorially in Figure 2, Figure 3 and Figure 4. The wing of the airplane, which can be seen in Figure 2, is fabricated of components that are solid the whole way through. Figure 3 depicts a hollow wind turbine blade, and Figure 4 depicts the rectangular wing of the medium-range UAV.

2.1.1. Design Processes Involved in Aircraft Wing

The wing of the airplane is an important part of this attempt. An analytical method wasutilized in this study to determine the design of a wing for an aircraft that has an average endurance and flies at medium altitudes. Information regarding the historical connection between a fixedwing aircraft’s overall take-off weight and the payload weight is compiled in Figure 2. The important relationship for the design of the wing can be found in Equation (1).
The historical relationship between payload weight to overall weightis revealed in Figure 1.
W Pl airplane W O airplane = 0.33
Based on the results of comparative evaluations, wing loading for this airplane is taken as 100 kg/m2 [13]. Therefore, W S airplane = 100   kg m 2 . The typical mathematical representations of planform area of a tapered airplane wing are expressed in Equations (2) and (3).
S Taper Wing = W O airplane [ W S ] airplane
S Taper Wing = 454.55 100   S Taper Wing = 4.5455   m 2 S Taper Wing = b Taper Wing × ( C Wing root + C Wing tip 2 )
To determine the further primary design parameters such as wingspan, root chord, and tip chord, Equations (4) and (5) are used.
AR Taper Wing = 2 × b Taper Wing C Wing root + C Wing tip
b Taper Wing = S Taper Wing × AR Taper Wing
b Taper Wing = 4.5455 × 8 6   m  
According to the literature review, λ = 0.6 is better suited for providing low drag with high lift at positive angle of attack, hence λ = 0.6 is adopted in this study. The typical mathematical expression of taper ratio of this airplane wing is presented in Equation (6).
Taper   ratio   ( λ ) = C Wing tip C Wing root
From Equation (3),
C Wing root = ( 4.5455 × 2 ) ( 6 × 1.6 ) = 0.95   m
From Equation (6),
C Wing tip = 0.6 × C Wing root 0.6 × 0.95 = 0.57   m
With the support of Equations (1)–(8), the primary design parameters of the aircraft wing were calculated and thereafter the needful secondary design parameters were estimated. In this study, a high wing structure is proposed for high stability; therefore, the wingspan and taper ratio is crucial in calculating chord at any span wise position.
C Wing ¯ = 2 3 × C Wing root × 1 + λ + λ 2 1 + λ = 0.775834 m
The mean aerodynamic chord (MAC)’s ‘y’ placement on either side of the wing is
y MAC = b 6 ( 1 + 2 × λ 1 + λ ) = 1.375   m
Equation (9) is used to compute the chord length design values for various portions of the wingspan.
C C Wing root = 1 [ 2 ( 1 λ ) y b ]
From Equation (9)
C 25 % = 0.855   m   ;   C 50 % = 0.76   m   ;   C 75 % = 0.665   m   ;   C 100 % = 0.57   m  
From Equation (10), the sweep angle of the wing was obtained.
Λ LE = tan 1 ( 2 × d Wing Tip b Taper Wing ) = 4.5 °
The backward sweep is intended to increase stability, thus this effort also finishes the calculation of the sweep angle at four separate portions from root to tip of this tapered wing. Lift coefficients (CL) and Re are critical when designing aerofoils for fixed-wing aircraft. To compute the necessary aerofoil for the determined wing parameters, the conventional method of computing is followed. The CL for the aircraft wing is determined with the help of thrust in Equation (11).
T = V Forward 2 2 × ρ × C L × S Taper Wing
C L = 0.9605
After careful analysis and examination, the NACA 6412 was found to be superior to other aerofoils in terms of both the amount of drag it produces and the amount of power it generates. Figure 3 depicts the final model of the airplane wing, which was created using the calculations provided earlier.

2.1.2. Design Processes Involved in Wind Turbine Blade

The geometrical parameters of the imposed wind turbine blade were decided with the assistance of standard analytical relationships, as presented in Equations (12)–(15). For estimating the wind turbine blade design, the design parameters and working environment of a 1 kW wind turbine was taken into consideration. The generalized equation for mechanical power generation of wind turbine is revealed in Equation (12). Moreover, it was assessed that the diameter of the horizontal axis wind turbine blade is 4.2 m.
P Mech . Power   of   HAWT = 0.5 × ρ × C p × π × R 2 × ( V Max a ) 3
R = 7000 ( 0.5 × 1.2256 × 0.593 × 10.25 × 10.25 × 10.25 ) = 4.2   m
Ratio of tip speed, intake angle, and length of the chord of a wind turbine blade can be found in Equations (13)–(15), respectively. Generally, omega is the rotational speed of the rotor in radians/second (assumed as maximum rotational speed as 17.5), R is the rotor radius in ‘m’, and V Max a is the wind speed in meters/second at the height of the blade hub.
λ r = ω R V Max a
λ r = ( 17.5 × 4.2 ) 10.25 = 7.171
ϕ = ( 2 3 ) × ( 1 λ r )
ϕ 0.093   or   5.3285 °
C = 8 π r B C L ( 1 cos ϕ )
( 8 × 22 × 4.2 ) ( 7 × 3 × 0.57795 ) × ( 1 0.995679 ) = 0.263   m  
where B is the blade number, and CL is coefficient of lift at different angle of attack (α) in which the angle is at the maximum value of the lift-drag coefficient ratio. Theoretically, the maximum lift coefficient is 0.57795. As long as it has a tipspeed ratio between 6 and 200, it can be considered asa high-speed wind turbine. The wind turbine blade shown in Figure 4 is modelled considering all the above-calculated parameters.

2.1.3. Processes Involved in the Design of an Unmanned Aerial Vehicle Wing

The wing of the UAV serves as the component that acts as the foundation. In this study, rather than making assumptions or depending on models that havebeen utilized in the past, an analytical method was employed to estimate the wing design for long-endurance high-altitude unmanned aerial vehicles. UAV with a payload capacity of 300 g was considered for the design parameter calculations. As a consequence of compiling the historical relationship between the overall take-off weight and payload weight of fixed wing UAVs, a new relationship was generated. The Equation (16) offers a practical link for the wing that is more ideally suited.
W Pl UAV W O UAV = 0.285
300 W O UAV = 0.285 W O UAV = 1052.6   g 1.05   kg
Based on comparative evaluations, a wing loading of 50 kg/m2 is chosen for this low-loading wing design [13]. Therefore, W S = 25   kg m 2 . After selecting the wing loading and take-off weight, the wing surface area is calculated as follows:
S Rectangular Wing = W O UAV W S UAV
All the known parameters are substituted in Equation (17), the planform of UAV’s rectangular wing was obtained as 0.042   m 2 . Equation (18) expresses the relationship between the planform area of the wingspan and chord length.
S Rectangular Wing = b Rectangular Wing × C Wing root
Given that the Aspect Ratio (expressed in Equation (19)) is the primary design relationship between chord length and wing planform area, the AR is selected to be 5.
AR Rectangular Wing = b Rectangular Wing 2 S Rectangular Wing
Root chord is equal to
0.042 = 0.458 × C Rectangular Wing root   C Rectangular Wing root = 0.0917 0.1   m
Lift coefficient and Reynolds number are vital in selecting theaerofoil cross section for fixed wing UAV. Equation (20) provides the relationship between thrust force and coefficient of lift of small UAVs.
T UAV = V Forward 2 2 × ρ × C L × S Rectangular Wing
C L = ( 9.81 × 1.05 × 2 × 1.5 ) ( 27.7778 × 27.7778 × 1.2256 × 0.042 )   C L = 0.778
The comparative evaluations of various aerofoil coefficients of lift versus coefficients of drag were calculated, and for its minimal drag and high power generation, NACA 0012 is preferred for the UAV’s wing design. The rectangular wing of UAV was modelled in CATIA with the help of calculated design data and the final design is revealed in Figure 5.

2.2. Discretization Process

Since the working environment of this work was close to the resonance frequency, significant care must be taken in the process of computing. In this form of simulation, more attention is required for the discretization process. Therefore, a top-down approach was taken for both the CFD and the FSI investigations. Figure 6 illustrates the discretized structure of an airplane wing, which can be utilized for vibrational modelling and the examination of fluid–structure interaction. Figure 7 illustrates the grid structure that forms the wind turbine blade for both finite element analyses. Curvature with afinemesh facility was utilized in both the CFD and the FSI investigations.
The wing of the unmanned aerial vehicle has a mesh structure, which can be seen in Figure 8. Because of the presence of sub structural members, the advanced mesh facility wasattempted. As a result, the mesh process includes the addition of face refinement in addition to the implementation of curvature and inflation setups.
Because of the presence of an external control volume as well as the operational nature of the volume, the discretization process for the CFD simulation needs to be handled with increased caution. This computational fluid dynamics analysis makes use of three different types of facilities: proximity, curvature, and inflation at aerodynamic components. Proximity is used for the representations of area variations in the control volume. The curvature facility is employed for the representation of the curved profile of the aerodynamic components. Inflation is focused to capture flow separation over the boundary layer separation point. Figure 8 depicts the usual view of the discretized structure of the UAV’s wing for structural and vibrational investigations. Additionally, the whole control volume UAV’s wing with external control volume is typically revealed in Figure 9, which has been imposed in CFD investigations.

2.3. Boundary Conditions

The data for the initial conditions are presented in Figure 10, which also includes a wall, an inlet, and an exit. Additionally, a wind turbine is depicted quite accurately to reflect the fluid structure interaction’s behaviour. Because of the working nature of these cantilever structures, the following preliminary criteria were provided: an intake that is determined by velocity was used, an exit that is determined by atmospheric pressure was provided, a no-slip condition was provided over the surface of the wind turbine blade or wing, and a free-slip condition was provided over the outer wall. In all the CFD analyses, the estimated excitation velocity of 82.8 m per second was provided as an input. At the outlet phase, the atmospheric pressure of 1 bar was specified. Because the potential for the formation of turbulence is rather strong in the presence in all these components that were short-listed, a turbulence model with two equations was selected, and as a result, the k-turbulence model was applied to the CFD simulations.
In FSI-based advanced numerical simulations, both the input conditions, which include things such as velocity inlet and pressure outlet, and the boundary conditions, which include things such as turbulence models and the provision of FSI regions, wereused. The CFD analysis is provided conditions that are based on the excitation velocity since this work is primarily concerned with flutter and the structural effects that it has. The flow being analysed is an incompressible one, and since the presence of an aerodynamic shape can cause a very small amount of turbulence formation, an eddy flow was used. Additionally, because of the complexity of flutter, second-order derivatives wereutilized, and a SIMPLE scheme-based couplingwasimposed between velocity and pressure data.
In addition to the CFD settings, the structural circumstances, which include the mechanical characteristics of variety of materials, stresses, and supports, are important factors to be considered for performing this integrative simulation. In this study, four distinct materials such as Al-Alloy, Ti-Alloy, GFRP, and KFRP were chosen for the proceedings because of the numerous applications these materials holdin the field of aeronautical engineering. However, it can be difficult to ascertain the mechanical properties of GFRP and KFRP. On the other hand, representations of the mechanical properties of current alloys are easily available. In light of this, the prepreg-based qualities were incorporated into this study, which also makes use of epoxy resins as a matrix representation. The interface region is the one that receives the fixed support, whereas the FSI regions are the ones that have fluid pressures applied to them.
It is necessary to conduct free vibrational analyses in order to provide an accurate estimate of the power that is produced owing to the flutter effect. As a result, modal analyses are performed on the various materials that were shortlisted. The mass properties of the material, the geometrical qualities of the physical models (wing and wind turbine blade), and the support conditions are the significant parameters in the modal analysis. The lengths of the airplane wing, UAV’s wing, and wind turbine bladeweretaken as 3 m, 0.223 m, and 4.5 m, respectively. In addition to these fundamental geometrical features, the chord length, camber location, and densities of the constituent materials were all given as inputs in the calculations of the mass matrix when performing a FEA-based modal analysis. Conditions of support comparable to those employed in the FSI analysis are applied, and Figure 11 depicts the wing in its entirety.

2.4. Governing Equations Involved in the CFD Simulation

The nature of the analysis is determined to be an incompressible flow after considering the velocity at the entrance, which is dependent on the excitation environment. Therefore, the primary equations that govern this incompressible flow were extracted from the literature survey [37,38]. Computational procedures involved in CFD and FSI computations are:
  • Step1: Geometry selection: selectionof airfoil, the span of the wing, etc.;
  • Step2: Final design of the cantilever structure;
  • Step3: Domain Extraction: in external flow analysis, the domain extraction is a prime one that provides an acceptable solution;
  • Step4: Discretization and grid convergence studies;
  • Step5: Application of physical and synthetic boundary conditions: excitation velocity inlet, free-slip condition is assumed in the external domain, the no-slip condition is assumed in the FSI region, and finally the pressure outlet;
  • Step6: Integrated one-way coupling FSI analysis in ANSYS Workbench 16.2: estimation of pressure variation, estimation of drag force, and structural parameter variations.

2.5. Governing Equations—Modal Analysis

In the FEA stress analysis, the governing differential equation is a motion equation, it embodies Newton’s Law for force and acceleration as revealed in Equations (21) and (22).
. σ + F = ρ u ¨
Static analysis reduces this to the following:
. σ + F = 0
To carry out a 3D static analysis, the force balance equations in all three directions are important. Equations (23)–(25) comprise of force balance equations that play amajor role in structural computations.
Force balance in X-direction
σ x x + τ x y y + τ x z z +   F x = 0
Force balance in Y-direction
τ x y x + σ y y + τ y z z +   F y = 0
Force balance in Z-direction
τ x z x + τ y z y + σ z z +   F z = 0
For 3D dynamic analysis, the force balance equations in all three directions are important. Equations (26)–(28) comprise of force balance equations that plays the major role in structural computations.
Force balance in X-direction
σ x x + τ x y y + τ x z z +   F x = ρ 2 u x t 2
Force balance in Y-direction
τ x y x + σ y y + τ y z z +   F y = ρ 2 u y t 2
Force balance in Z-direction
τ x z x + τ y z y + σ z z +   F z = ρ 2 u z t 2
Naturally, all these equations may be reduced to a two-dimensional form by omitting certain terms. The Galerkin algorithm is multiplied by test functions, integrates, employs part-to-part integration, and incorporates boundary conditions. Finite element method (FEM) equations may be derived from this weak form, which provides formulae for the matrices of stiffness and forces. In static analysis, Equation (29) is employed:
[ K ] { u } = { F }
The following is the shape it takes for dynamic analysis that are mathematically revealed in Equations (30) and (31).
[ M D ] { u ¨ } + [ C D ] { u · } + [ K D ] { u } = { F }
[ M D ] { u ¨ } + [ K D ] { u } = [ 0 ]
The constitutive equation (Hooke’s principle for the case of linear elastic materials) used to determine displacement, strain, and a stress are expressed in Equation (32).
{ σ } = [ D ] { ε }
Galerkin’s methodology can be replaced with the Rayleigh–Ritz method if the process begins with a potential energy functional rather than the aforementioned differential equations. This method aims to keep the function as simple as possible. The ultimate product, however, is the same in both techniques. Equivalent element formulations for 1D beam/bar elements may be generated directly from basic elasticity equations. Computational procedures involved in modal analyses are:
  • Step1: Geometry selection: selection of airfoil, the span of the wing, etc.;
  • Step2: Selection of Materials: aluminium alloy, GFRP, titanium alloy, and KFRP, and CFRP;
  • Step3: Final design of the cantilever structure;
  • Step4: Discretization and grid convergence study;
  • Step5: Modal Analysis in ANSYS Workbench: estimation of 5 fundamental mode shapes.

2.6. Grid Independent Studies

The requirement for grid independence research in this endeavour is an unavoidable one since the primary outcome of these comparative investigations is wholly dependent upon more advanced computational simulations. Grid independence studies areperformed here in two different ways, which are the grid convergence test on aerodynamic pressure and the grid convergence test on natural frequency. Both studies focused on the convergence of the grid on natural frequency. Figure 12 shows the six mesh cases that were used for the first grid convergence test on the rectangular wing of the UAV. Under the first test, the fine curvature mesh type (case-1), the fine proximity mesh type (case-2), the fine proximity and curvature mesh type (case-3), the fine curvature with multi-zone mesh type (case-4), the fine proximity with multi-zone mesh type (case-5), and the fine curvature with inflation mesh type (case-6) were imposed. From Figure 12, mesh case-4 was picked as a suitable grid approach for reliable outcome production under CFD investigation. Figure 13 shows the five mesh cases that were used for the second grid convergence test on the KFRP wind turbine blade. As a similar as the base ideology of first grid convergence test, the second grid convergence test was organized, wherein five cases (case-1 to case-5) played the major role. From Figure 13, mesh case-2 was picked as suitable grid approach for reliable outcome production under free vibration-based investigation.

2.7. Validations for Computational Approach

2.7.1. FEA-Based Validation on Displacement—Validation—I

Validations were used to confirm the acceptability of attainment of computational outcomes. In this work, the conventional approach-based analytical methods are imposed for the validations on the computational attainments such as displacement, which is the result of FSI computation, natural frequency, which is the outcome of the vibrational analysis. The major platform used for this first validation is the airplane wing tip. The initial and boundary conditions are: F 1 = 0 ; m 1 = P × l ; F 2 = P ; m 2 = 0 ; L = 3 m; average chord = 955.61 mm = 0.95561 m; average thickness = 190.1765 mm = 0.1901765 m; average pressure = 446.2 Pa; area of the wing surface = 5.5435 m2; E = 71 GPa; and P = 446.2 × 5.5435 = 2473.5097 N.
I = b × ( t ) 3 12 = 0.95561 × ( 0.1901765 ) 3 12 = 1.083574905044204 × 10 8 m 4
F 1 = 0 ;   m 1 = 2473.5097 × 3 = 7420.5291   N ;   F 2 = 2473.5097   N ;   m 2 = 0
{ F 1 m 1 F 2 m 2 } = EI L Span 3 × [ 12 6 L Span 12 6 L Span 6 L Span 4 L Span 2 6 L Span 2 LL Span 2 12 6 L Span 12 6 L Span 6 L 2 L Span 2 6 L Span 4 L 2 ] { y 1 θ 1 y 2 θ 2 }
{ 0 7420.5291 2473.5097   0 } = EI L 3 × [ 12 1.338 12 1.338 1.338 0.198916 1.338 0.005 12 1.338 12 1.338 1.338 0.099458 1.338 0.198916 ] { y 1 θ 1 y 2 θ 2 }
The length of the first element is equal to 3 m, and the boundary conditions are, y 1 =   θ 1 = 0 ;   y 2 = ? .
By applying the boundary conditions
y 2 = P × L Span 3 12 EI 2473.5097 × 3 3 71 × 0.95561 × ( 0.1901765 ) 3
The maximum deflection is y 2 = 0.00014311   m .

2.7.2. Validation of Modal Analysis Based on Conventional Approach—Validation—II

Through the conventional approach, the second validation is executed, which deals the first natural frequency of the aluminium alloy-based airplane wing. The input conditions used for this validation are: L Span = 3 m; average thickness at tip = 0.140918 m; density = 2700 kg/m3; wing volume = 0.34706 m3; wing Area = 5.5435 m2; and E = 71 GPa;
First   Natural   Frequency = 3.515625 × Et 2 12 × ρ × L Span 4
The last outcome obtained from the conventional approach (Equation (34)) based natural frequency is 22.463 Hz. The computational free vibrational outcome obtained from the ANSYS modal tool is revealed in Figure 14.

2.7.3. Validation of Modal Analysis Based on FEA Approach—Validation—III

The third validation comprises of comparative attainments between FEM outcome and computational outcome.
[ M D ] [ u ] λ + [ K D ] [ u ] = [ 0 ]
In contrast, the equation for static problems is:
[ K D ] [ u ] = [ 0 ]
When all terms with a time derivative are set to zero, Equation (36) is derived. To implement the FEA-based investigation on the natural frequency of the objects, the important design inputs such as moment of inertia, thickness at tip (0.140918 m), and chord length at tip (0.56566 m) are estimated.
I x = π 4 × AB 3 = π 4 × Chord   at   tip 2 × ( Thickness   at   tip 2 ) 3
I x = = 0.00007766128202602834   m 4
( ρ A L Span 420 × [ 156 22 L S p a n 54 13 L S p a n 22 L S p a n 4 L S p a n 2 13 L 3 L S p a n 2 54 13 L S p a n 156 22 L S p a n 13 L S p a n 3 L S p a n 2 22 L S p a n 4 L S p a n 2 ] [ ω 2 ] + EI L S p a n 3 × [ 12 6 L Span 12 6 L Span 6 L Span 4 L Span 2 6 L Span 2 L S p a n 2 12 6 L S p a n 12 6 L S p a n 6 L S p a n 2 L S p a n 2 6 L S p a n 4 L S p a n 2 ] ) { y 1 θ 1 y 2 θ 2 } = { 0 }
106.91 × 54 × y 2 × ω 2 204220.41 × 12 × y 2 = 0
ω 2 = 424.490819   20.6032   Hz
Table 1, Table 2 and Table 3 contain the final outcomes of validations and its error percentages, in which the displacement and natural frequencies of airplane wing are estimated through various engineering approaches and compared among them. Error percentage between computational results and validation results are well within the acceptable limit; therefore, the imposed computational procedures and their results can be considered as validated.

3. Results and Discussion

The objective of this section is to determine the material that provides a high energy extraction rate, the aerodynamic pressures that are placed on the cantilevered structures, and as a result, the impacted fluid load. In addition, the free vibrations of the structures and their respective displacements are alsoto be determined.

3.1. CFD Results

The computer simulations are carried out with the assistance of the boundary conditions as previously described. Figure 15, Figure 16 and Figure 17 respectively exhibit the results of the computational fluid dynamics simulation, aero-structural analysis, and free vibration. The variations in aerodynamic pressure on an airplane wing are depicted in Figure 15a. The aerodynamic pressure that the wind turbine blade is experiencing is illustrated in Figure 15b. The total deformation is calculated by combining the pressure distribution with the input conditions. The phases involved in the FSI approach are precisely the same as the stages described in the sections that came before this one. The pressure variation that the UAV wing experiences is depicted in Figure 15c.

3.2. Aero-Structural Results

In aero-structural modelling, the parameters of displacements, equivalent stress, and normal stress stand out as the important parameters to be captured. The global deformations found for aluminium alloy are illustrated in Figure 16a, with the highest deformation happening at the free end of the airplane wing with a value of 0.1325 mm. In Table 1 and Table 2, the deformations and stress output parameters for a variety of materials are presented. The overall deformations of Kevlar are illustrated in Figure 16b, with the largest deformation happening at the free end of the wind turbine blade with a value of 12.467 mm. Figure 16b shows the overall deformations of Kevlar. The entire information, including the overall deformation and stresses, can be found in Table 4 and Table 5. Figure 16c illustrates the global deformations of GFRP, with the free end of the UAV’s wing exhibiting the greatest amount of deformation (with a value of 0.059 mm).
Comparing the results provided an understanding that GFRP can deflect within its endurance limit for all the cases, and thereby it is a more suitable power extraction base material with a high lifetime.

3.3. Modal Analysis

The most significant results of this modal simulation are natural frequencies with reference to the geometries of modes. The literature survey suggests that the first five modes of rotors can be relied upon; hence, those same five modes were selected for this energy estimation. The optimal mode form among the five and the effects it has are the focus of the final computation.

3.3.1. Airplane Wing

The modal analysis of an airplane wing is computed for five different lightweight materials using the typical initial and boundary conditions mentioned previously. Figure 11 presents the conclusive findings of vibrational tests conducted on samples of all the lightweight materials. Figure 17a depicts the changes in total deformation of an aluminium alloy airplane wing under a constant boundary condition during the first mode shape excitation. In Figure 17b, the total deformation of the GFRP airplane wing under a constant boundary condition is illustrated for each of the aircraft’s natural frequencies. Figure 17c depicts the vibrational and summative structural results of using CFRP. There are five mode shapes that are predicted for all the materials. These mode shapes are modelled in the configuration of an airplane wing to analyse the reaction of the cantilever structure, and complete results are exhibited in Figure 18 and Figure 19. From Figure 18 and Figure 19, it is clearly understood that the free vibrations are highly induced by composite materials than lightweight alloys. The maximum allowable induced free vibration by alloy is 250 Hz and the maximum allowable induced free vibration by composite is 350 Hz. The difference between these two lightweight materials is 100 Hz, so composites are good for PVEH-based additional energy extraction.

3.3.2. Modal Analysis—Wind Turbine Blade

The steps involved in the modal analysis of the wind turbine blade are similar to the steps involved in the modal analysis of the aircraft wing. Variations in displacement in the wind turbine blade at the second mode shape for titanium alloy are predicted using modal analysis and displayed in Figure 20a. Figure 20b presents the structural deflections of the third mode shape of the wind turbine blade assigned withthe GFRP property. Figure 20c shows the total deformation variations in the single wind turbine blade with KFRP’s material property at the fourth mode shape. Finally, the comprehensive vibrational results are revealed in Figure 21 and Figure 22.

3.3.3. Modal Analysis—UAV Wing

The steps in the modal analysis of the UAV’s fixed wing are the same as in the modal analysis of the aircraft wing. The deformations of third mode shapes are shown in Figure 23a for a wing with the GFRP property, and in Figure 23b for a wing with the KFRP property. Figure 23c is for a wing with the CFRP property of UAV’s wing. The comprehensive vibrational results are revealed in Figure 24 and Figure 25.

4. Energy Extractions through Piezoelectric Energy Harvester—Proposed Calculations

Analytical Equations (38) and (39) are the noteworthy sources, which can provide the energy extraction through PVEH patches loaded on any structures. In this estimation, it is assumed that the PVEH obeys Euler–Bernoulli beam theory and is homogenous; stress and strain acting on the surface were well within the elastic limit [23].
P 0 = B ( x 5 36 Lx 4 6 + 5 L 2 x 3 12 L 3 x 3 2 + L 4 x 4 )
where
B = d 31 2 F 0 2 ω 0 2 18 H WL 2 ( h + H ) 4 ρ 1 + j ω 0 ε r ε 0 ρ

4.1. Experimental Validations of PVEH Power—Validation—IV

After the successful validation of vibrational outcomes, the CFD outcomes and energy development procedures need to be validated. This section deals with the validation study of this important approach, in which the experimental correlation study was inspired from theexperimental work by J. A. Dunnmon et al. [15]. For this validation, a separate design wasdeveloped, as shown in Figure 26. After modelling, the pressure variation on the base model is computed with the help of ANSYS Fluent and the result is presented in Figure 27. Finally, the vibrational outcome of base object is revealed in Figure 28.
Based on Equations (38) and (39), electrical developments were validated with experimental outcomes [15] and thereby the comprehensive results were compared for further validation. The experimental result of developed electrical power was 2.5 mW and the results of developed electrical power through this proposed approach is 2.58 mW. With the help of known conventional calculation, the error percentage was calculated. The obtained error percentage is 3.1% and it falls within the acceptable range; therefore, the proposed approach that combined computational and analytical methods can provide reliable outcomes [39,40,41,42,43,44,45].

4.2. Energy Extraction on Tapered Wing of Airplane

The structural, vibrational, and design data derived for airplane wing are: piezoelectric material constant (d31) =0.12, force (F0) = 247.891 N, natural frequency (W0) = 22.137 Hz, width of the wing (W) = 0.95424 m, length of the piezoelectric layer (L) = 3 m, thickness of the wing (h) = 0.3 m, thickness of the piezoelectric layer (H) = 0.01 m, density of the material = 2700 kg/m3; electrode length (x) = 1.32 m, and density (ρ) of Al-alloy = 2700 kg/m3; Ti alloy = 4510 kg/m3; GFRP = 1800 kg/m3; and Kevlar = 1470 kg/m3. The cantilever structure has the maximum power extraction potential at x = 0.44 L [23]. Therefore, the picked platforms are confirmed to execute the calculations, in this regard the proposed ideology is pictorially revealed in Figure 29. With the help of Equations (38) and (39), the estimated power generation for the tapered airplane wing with various materials are listed in Figure 30, Figure 31, Figure 32 and Figure 33 for the implementations of PVEH patches on wing with the attachment coverage of 100%, 75%, 50%, and 25% of the wingspan, respectively.

4.3. Energy Extraction on Wind Turbine Blade

The structural, vibrational, and design data derived under wind turbine blade are: piezoelectric material constant (d31) = 0.12, force (F0) = 1245.3 N, natural frequency (W0) = 9.3713 Hz, width of the blade (W) = 0.47517 m, length of the piezoelectric layer (L) = 4.2 m, thickness of the blade (h) = 0.178836 m, thickness of the piezoelectric (H) = 0.00596 m, and electrode length (x) = 1.848 m. The cantilever structure has the maximum power extraction potential at x = 0.44 L [23]. Therefore, the picked platforms are confirmed to execute the calculations, in this regard the proposed ideology is pictorially revealed in Figure 34. With the help of Equations (38) and (39), the estimated power generation for wind turbine blade with various materials are listed in Figure 35, Figure 36, Figure 37 and Figure 38 for the implementations of PVEH patches on the blade with the attachment coverage of 100%, 75%, 50%, and 25% of the blade span, respectively.

4.4. Energy Extraction on UAV’s Rectangular Wing

The structural, vibrational, and design data derived for UAV wing are: piezoelectric material constant (d31) = 0.12, force (F0) = 10,023.2 N, natural frequency (W0) = 207.02 Hz, width of the wing (W) = 0.1 m, length of the piezoelectric layer (L) = 0.223 m, thickness of the wing (h) = 0.0103261 m, thickness of the piezoelectric (H) = 0.0003442 m, and electrode length (x) = 0.09812 m. The cantilever structure has the maximum power extraction potential at x = 0.44 L [23]. Therefore, the picked platforms are confirmed to execute the calculations, in this regard the proposed ideology is pictorially revealed in Figure 39. With the help of the Equations (38) and (39), the power generations estimated for the rectangular wing of UAV with various materials are listed in Figure 40, Figure 41, Figure 42 and Figure 43 for the wing with the implementation of PVEH patches on the wing with the attachment coverage of 100%, 75%, 50%, and 25% of the wing span, respectively.
The power generated due to flutter phenomena on the PVEH attached structural components is the primary scope of this research. The advanced computational simulations and theoretical computations confirmed that the power generation is quite high in the UAV’s wing with a length of 0.223 m at excitation velocity. However, in the case of medium-size components such as an aircraft wing, wind turbine blades generate a power level of acceptable range at the same excitation velocity. While comparing all three structural components, the possibility of flutter occurrence at the short-listed excitation velocity is below average. In this work, the civilian aircraft wing was short-listed, and its average speed range is 250 m/s. Comparatively, the flutter occurring probability is higher in the Aircraft wing than the other two structural elements for the excitation velocity of 75 m/s. Moreover, composite materials can provide a good platform for higher energy extraction. Therefore, the composite materials-based aircraft wing construction is incomparable and has the potential to provide enormous advantages.

5. Conclusions

The principal platforms for this study are represented here by airplanes with tapering wings, wind turbine blades, and the rectangular wings of UAVs. CATIA is utilized to generate models of these three types of platforms. The ANSYS Workbench modal tool simulates the natural frequencies and mode shapes for a variety of materials, including aluminum alloy, titanium alloy, GFRP, CFRP, and KFRP. Pressure variations on the selected cantilever structures were analysed with the help of ANSYS Fluent. Importing the simulation data into the analytical module and then analysing the power generation allows for the further evaluation of the theoretical power extraction for the various cantilever structures for the materials that were chosen for further consideration. As mentioned earlier, important parameters which decide the energy production of PVEHs are the amplitude of oscillations, and the frequency of the structures they are fitted with. Hence, the flutter study on the mentioned platforms was conducted.
Considering the case of platforms with maximum PVEH imposition for high energy extraction, it is observed that maximum piezoelectric energy generation can be achieved in aircraft wings if they are fabricated of aluminium alloy, and aircraft wings with KFRP produce only 22% less energy and CFRP produce 14% less energy compared with KFRP. In the case of wind turbine blade, it is observed that maximum piezoelectric energy generation is achieved if they are fabricated of KFRP and the second highest piezoelectric energy is produced by aluminium alloy with 27% less energy than the KFRP wind turbine blade, and following that is the CFRP wind turbine blade with 46% less energy than aluminium alloy. From Figure 35, it is noted that maximum piezoelectric energy generation on UAV’s rectangular wing is achieved if they are fabricated of aluminium alloy, the KFRP UAV wing provides the second highest possible power extraction with 23% lessthan the dominant aluminium alloy, and the CFRP UAV wing provides 29% less energy than the KFRP UAV wing.
Considering the case of platforms with maximum PVEH imposition for high energy extraction, it is observed that maximum piezoelectric energy generation can be achieved in aircraft wings if they are fabricated of aluminium alloy, aircraft wings with KFRP produce only 22% less energy, and CFRP produce 14% less energy compared with KFRP. In the case of wind turbine blade, it is observed that maximum piezoelectric energy generation is achieved if they are fabricated of KFRP, and the second highest piezoelectric energy is produced by aluminium alloy with 27% less energy than the KFRP wind turbine blade, following that is CFRP wind turbine blade with 46% less energy than aluminium alloy. From Figure 35, it is noted that maximum piezoelectric energy generation on UAV’s rectangular wing is achieved if they fabricated of aluminium alloy and KFRP UAV wing provides the second highest possible power extraction with 23% less energy than the dominant aluminium alloy the and CFRP UAV wing provides 29% less energy than the KFRP UAV wing.
Based on integrative considerations, the KFRP-based platforms are recommended as a preferable option for energy extractions under an adverse structural and vibrational environment. The properties such as high fracture toughness, lightweight, etc., of KFRP supersedes the marginal difference exists in the energy production compared with the conventional materials as the most suitable material for energy extraction with PVEH patches specifically under external perturbations.
The coupled computational investigation (CFD, FSI, and energy availability estimations) and its validated approaches provides wider opportunity of energy harvesting research in structures under a vibrating and oscillating environment. This numerical investigation methodology can be extended for cantilevered structures such as vertical axis wind turbine blades, UAV rotor blades, hydro turbine blades, etc., to look for additional clean energy resources. The extension of experimental investigation on the discussed structural environment with different piezoelectric materials such as film transducers, macro-fibre composite patches, etc., will be a massive improvement on the search for additional green energy.

Author Contributions

Conceptualization, N.K.K. and B.R.R.J.; methodology, N.K.K. and B.R.R.J.; software, N.K.K. and V.R.; validation, N.K.K., V.R. and B.R.R.J.; formal analysis, N.K.K. and B.R.R.J.; investigation, N.K.K. and B.R.R.J.; resources, N.K.K.; data curation, N.K.K. and B.R.R.J.; writing—original draft preparation, N.K.K. and V.R.; writing—review and editing, N.K.K., B.R.R.J. and V.R.; visualization, N.K.K. and B.R.R.J.; supervision, B.R.R.J.; project administration, B.R.R.J.; funding acquisition, N.K.K. All authors have read and agreed to the published version of the manuscript.

Funding

This research received no external funding.

Data Availability Statement

Not applicable.

Acknowledgments

The Aircraft Design and Analyses (ADA) Laboratory at the Department of Aeronautical Engineering at Kumaraguru College of Technology (KCT) in Coimbatore, Tamil Nadu, India, contributed these computing resources. Consequently, the authors of this article appreciate this help and support that was provided by ADA, KCT.

Conflicts of Interest

The authors declare no conflict of interest.

Abbreviations

AbbreviationsExpansions
CFDComputational fluid dynamics
CFRPCarbon fibre-reinforced polymer
DNSDirect numerical simulation
FSIFluid–structure interaction
FEAFinite element analysis
GFRPGlass fibre-reinforced polymer
GPSGlobal positioning system
HAWTHorizontal axis wind turbine
KFRPKevlar fibre-reinforced polymer
LCOLimit cycle oscillations
LELeading edge
MACMean aerodynamic chord
NACANational advisory committee for aeronautics
ODEOrdinary differential equation
PDEPartial differential equation
PVEHPiezoelectric vibration energy harvesters
UAVUnmanned aerial vehicle
UDUni-directional
USUnmanned amphibious system
UUVUnmanned underwater vehicle
VTOLVertical take-off and landing

Nomenclature

ParameterExplanations
AR Rectangular Wing Aspect ratio of rectangular wing
AR Taper Wing Aspect ratio of tapered wing
b Taper Wing Wingspan of tapered wing
C Chord length of wing at various sections
C L Coefficient of lit
C Rectangular Wing root Root chord of rectangular wing
C p Coefficient of pressure
C Wing root Root chord of tapered wing
C Wing tip Tip chord of tapered wing
C Wing ¯ Mean aerodynamic chord
d Wing Tip Reference distance at wingtip of tapered wing
P Mech . Power of HAWT Mechanical power requirement of HAWT
R Radius of HAWT’s blade
S Taper Wing Planform area of tapered wing
S Rectangular Wing Planform area of rectangular wing
T Thrust force
T UAV Thrust requirement by the UAV’s propulsion system
V Max a Maximum velocity of atmospheric air
V Forward Forward velocity of aircraft
y MAC Location of MAC in “y” direction
W Pl airplane Payload weight of the shortlisted airplane
Overall weight of the shortlisted airplane
W S airplane Wing loading of the shortlisted airplane
W Pl UAV Payload weight of the shortlisted fixed wing UAV
W O UAV Overall weight of the shortlisted fixed wing UAV
Λ L E Taper angle of leading edge
ρDensity of the atmospheric air
λ r Tip speed ratio of HAWT blade
ω rotational speed of the rotor in radians/second (assumed as maximum rotational speed as 17.5)
ϕ I n f l o w Inflow of angle
βPitch angle
α A Angle of attack

References

  1. Duck, F. Piezoelectricity: An historical sketch. BMUS Bull. 2000, 8, 7–8. [Google Scholar] [CrossRef]
  2. Duck, F. ‘The electrical expansion of quartz’ by Jacques and Pierre curie. Ultrasound 2009, 17, 197–203. [Google Scholar] [CrossRef]
  3. Bai, R.-X.; Bai, H.; Wang, M. Numerical analysis for the interlayer toughening of piezoelectric smart composite plate. Polym. Polym. Compos. 2014, 22, 193–202. [Google Scholar] [CrossRef]
  4. Tang, D.; Dowell, E.H. Limit cycle oscillations of two-dimensional panels in low subsonic flow. Int. J. Non-Linear Mech. 2002, 37, 1199–1209. [Google Scholar] [CrossRef]
  5. Rose, J.B.R.; Jinu, G. Influence of aeroelastic flow induced oscillations on fatigue life of an airplane wing structure. Int. J. Model. Identif. Control 2016, 25, 199. [Google Scholar] [CrossRef]
  6. John, B.R.R.; Sivathanu, B.U.; Vijaya, B.B.J. Computational investigation on the effects of two-way wing morphing strategy in the critical Mach number. J. Aerosp. Technol. Manag. 2018, 10, e1318. [Google Scholar] [CrossRef]
  7. Balakrishnan, A.; Tuffaha, A.M.; Patino, I.; Melnikov, O. Flutter analysis of an articulated high aspect ratio wing in subsonic airflow. J. Frankl. Inst. 2014, 351, 4230–4250. [Google Scholar] [CrossRef]
  8. Fazelzadeh, S.A.; Ghasemi, A.H.; Mazidi, A. Aeroelastic analysis of unrestrained aircraft wing with external stores under roll maneuver. Int. J. Acoust. Vib. 2016, 21, 327–333. [Google Scholar] [CrossRef]
  9. Kämpchen, M.; Dafnis, A.; Reimerdes, H.-G.; Britten, G.; Ballmann, J. Dynamic aero-structural response of an elastic wing model. J. Fluids Struct. 2003, 18, 63–77. [Google Scholar] [CrossRef]
  10. Hémon, P.; de Langre, E.; Schmid, P. Experimental evidence of transient growth of energy before airfoil flutter. J. Fluids Struct. 2006, 22, 391–400. [Google Scholar] [CrossRef]
  11. Vijayanandh, R.; Senthilkumar, S.; Rajkumar, R.; Kumar, A.; Kumar, J.D.; Kumar, K.K.; Prakash, R.A. Conceptual design and computational investigations of fixed wing unmanned aerial vehicle for medium-range applications. In Autonomous and Connected Heavy Vehicle Technology; Academic Press: Cambridge, MA, USA, 2022; pp. 353–374. [Google Scholar] [CrossRef]
  12. Stephen, N. On energy harvesting from ambient vibration. J. Sound Vib. 2006, 293, 409–425. [Google Scholar] [CrossRef] [Green Version]
  13. Owens, B.A.; Mann, B. Linear and nonlinear electromagnetic coupling models in vibration-based energy harvesting. J. Sound Vib. 2012, 331, 922–937. [Google Scholar] [CrossRef]
  14. Tang, L.; Païdoussis, M.P.; Jiang, J. Cantilevered flexible plates in axial flow: Energy transfer and the concept of flutter-mill. J. Sound Vib. 2009, 326, 263–276. [Google Scholar] [CrossRef]
  15. Dunnmon, J.; Stanton, S.; Mann, B.; Dowell, E. Power extraction from aeroelastic limit cycle oscillations. J. Fluids Struct. 2011, 27, 1182–1198. [Google Scholar] [CrossRef]
  16. Wang, D.-A.; Ko, H.-H. Piezoelectric energy harvesting from flow-induced vibration. J. Micromech. Microeng. 2010, 20, 025019. [Google Scholar] [CrossRef]
  17. Wang, D.-A.; Chiu, C.-Y.; Pham, H.-T. Electromagnetic energy harvesting from vibrations induced by Kármán vortex street. Mechatronics 2012, 22, 746–756. [Google Scholar] [CrossRef]
  18. Kuhl, J.; DesJardin, P. Power production locality of bluff body flutter mills using fully coupled 2D direct numerical simulation. J. Fluids Struct. 2012, 28, 456–472. [Google Scholar] [CrossRef]
  19. Mehmood, A.; Abdelkefi, A.; Hajj, M.; Nayfeh, A.; Akhtar, I.; Nuhait, A. Piezoelectric energy harvesting from vortex-induced vibrations of circular cylinder. J. Sound Vib. 2013, 332, 4656–4667. [Google Scholar] [CrossRef]
  20. McCarthy, J.; Watkins, S.; Deivasigamani, A.; John, S. Fluttering energy harvesters in the wind: A review. J. Sound Vib. 2016, 361, 355–377. [Google Scholar] [CrossRef]
  21. Bibo, A.; Daqaq, M.F. Energy harvesting under combined aerodynamic and base excitations. J. Sound Vib. 2013, 332, 5086–5102. [Google Scholar] [CrossRef]
  22. Balaji, S.S.; Raja, V.; Raji, A.P.; Madasamy, S.K.; Kulandaiyappan, N.K.; Gnanasekaran, R.K.; Kandasamy, S.; Rajapandi, R.; Nagarajan, N.; Kannan, S.D.; et al. Conceptual design and comparative power generations on unmanned aerial vehicle’s wing with rotors using CFD. In Proceedings of the AIAA SCITECH 2022 Forum, San Diego, CA, USA, 3–7 January 2022. [Google Scholar] [CrossRef]
  23. Du, S.; Jia, Y.; Seshia, A. Maximizing output power in a cantilevered piezoelectric vibration energy harvester by electrode design. J. Phys. Conf. Ser. 2015, 660, 012114. [Google Scholar] [CrossRef]
  24. Wang, Y.; Kumar, L.; Raja, V.; Al-Bonsrulah, H.A.Z.; Kulandaiyappan, N.K.; Tharmendra, A.A.; Marimuthu, N.; Al-Bahrani, M. Design and innovative integrated engineering approaches based investigation of hybrid renewable energized drone for long endurance applications. Sustainability 2022, 14, 16173. [Google Scholar] [CrossRef]
  25. Ramesh, M.; Vijayanandh, R.; Jagadeeshwaran, P.; Deviparameswari, K.; Meenakshi, S.; Asher, P.K.; Vaidegi, R.; Antonitta, B.F. Impact behavioral studies on various composite materials using fluid-structure interaction (FSI). Mater. Today Proc. 2021, 51, 1134–1140. [Google Scholar] [CrossRef]
  26. Vijayanandh, R.; Kumar, M.S.; Naveenkumar, K.; Kumar, G.R.; Kumar, R.N. Design Optimization of Advanced Multi-Rotor Unmanned Aircraft System Using FSI, Innovative Design, Analysis and Development Practices in Aerospace and Automotive Engineering (I-DAD 2018), Lecture Notes in Mechanical Engineering; Springer: Singapore, 2018. [Google Scholar] [CrossRef]
  27. Naveen, K.K.; Vijayanandh, R.; Bruce, R.R.J.; Swathi, V.; Narmatha, R.; Venkatesan, K. Research on structural behavior of composite materials on different cantilever structures using FSI. Int. J. Eng. Adv. Technol. 2019, 8, 1075–1086. [Google Scholar] [CrossRef]
  28. Vijayanandh, R.; Naveen, K.K.; Senthil, K.M.; Raj, K.G.; Naveen, K.R.; Ahilla, B.L. Material optimization of high speed micro aerial vehicle using FSI simulation. Procedia Comput. Sci. 2018, 133, 2–9. [Google Scholar] [CrossRef]
  29. Raja, V.; Samy, M.; Nachimuthu, K.; Sathyamoorthy, S.; Krishnasamy, D.; Raji, A.P.; Gnanasekaran, R.K.; Madasamy, S.K.; Kulandaiyappan, N.K.; Mathaiyan, V.; et al. Material optimizations on UAV’s axial flow compressor blade by using FSI Approach. In Proceedings of the AIAA SCITECH 2022 Forum, San Diego, CA, USA, 3–7 January 2022. [Google Scholar] [CrossRef]
  30. Madasamy, S.K.; Raja, V.; Al-Bonsrulah, H.A.Z.; Al-Bahrani, M. Design, development, and multi-disciplinary investigations of aerodynamic, structural, energy, and exergy factors on 1 kW horizontal Axis wind turbine. Int. J. Low-Carbon Technol. 2022, 17, 1292–1318. [Google Scholar] [CrossRef]
  31. Raja, V.; Al-Bonsrulah, H.A.Z.; Raji, A.P.; Madasamy, S.K.; Ramaiah, M.; Gnanasekaran, R.K.; Kulandaiyappan, N.K.; Al-Bahrani, M. Design and multi-disciplinary computational investigations on PVEH patches attached horizontal axis hybrid wind turbine system for additional energy extraction in HALE UAVs. IET Renew. Power Gener. 2022, 17, 617–643. [Google Scholar] [CrossRef]
  32. Raja, V.; Murugesan, R.; Rajendran, P.; Palaniappan, S.; Al-Bonsrulah, H.A.Z.; Jayaram, D.K.; Al-Bahrani, M. Multi-domain based computational investigations on advanced unmanned amphibious system for surveillances in international marine borders. Aerospace 2022, 9, 652. [Google Scholar] [CrossRef]
  33. Raja, V.; Solaiappan, S.K.; Kumar, L.; Marimuthu, A.; Gnanasekaran, R.K.; Choi, Y. Design and computational analyses of nature inspired unmanned amphibious vehicle for deep sea mining. Minerals 2022, 12, 342. [Google Scholar] [CrossRef]
  34. Vijayanandh, R.; Naveen, K.K.; Raj, K.G.; Arul, P.R.; Raffik, R. PVEH Based Electrical Energy Creation in Marine Propeller through Computational Hydrodynamic and Vibrational Simulations, Transition in Energy Sector: Scope, Challenges, and Future Opportunities; Central West Publishing: Orange, NSW, Australia, 2022; Chapter 3; pp. 53–84. ISBN 978-1-922617-28-6. [Google Scholar]
  35. Rajagurunathan, M.; Raj Kumar, G.; Vijayanandh, R.; Vishnu, V.; Rakesh Kumar, C.; Mohamed Bak, K. The design optimization of the circular piezoelectric bimorph actuators using FEA. Int. J. Mech. Prod. Eng. Res. Dev. 2018, 8, 410–422. [Google Scholar]
  36. Kumar, K.N.; Rajkumar, R.; Vijayanandh, R.; Kumar, G.R.; Jagadeeshwaran, P.; Kumar, M.S.; Prakash, R.A. Numerical investigation of resonance on aircraft wing by using advanced computational methodologies. AIP Conf. Proc. 2022, 2446, 180001. [Google Scholar] [CrossRef]
  37. Kumar, K.N.; Meenakshi, S.; Deviparameswari, K.; Vaidegi, R.; Nandhagopal, R.; Ramesh, M.; Vijayanandh, R. Investigation of energy generation on large rotary wing unmanned aerial vehicle’s propeller using coupled engineering approaches, advances in environment engineering and management. In Advances in Environment Engineering and Management; Springer: Cham, Switzerland, 2021; pp. 209–224. [Google Scholar] [CrossRef]
  38. Kulandaiyaappan, N.K. Optimization of high payload unmanned aerial vehicle’s propellers based on energy formation by using computational vibrational analyses. In Proceedings of the AIAA Propulsion and Energy 2021 Forum, Virtual Event, 9–11 August 2021. [Google Scholar] [CrossRef]
  39. Barrero-Gil, A.; Pindado, S.; Avila, S.G. Extracting energy from Vortex-Induced Vibrations: A parametric study. Appl. Math. Model. 2012, 36, 3153–3160. [Google Scholar] [CrossRef] [Green Version]
  40. Abbasi, A. Application of piezoelectric materials in smart roads and MEMS, PMPG power generation with transverse mode thin film PZT. Int. J. Electr. Comput. Eng. 2013, 3, 857–862. [Google Scholar] [CrossRef] [Green Version]
  41. Anton, S.R.; Sodano, H.A. A review of power harvesting using piezoelectric materials (2003–2006). Smart Mater. Struct. 2007, 16, R1. [Google Scholar] [CrossRef]
  42. Mitcheson, P.D.; Yeatman, E.M.; Rao, G.K.; Holmes, A.S.; Green, T.C. Energy harvesting from human and machine motion for wireless electronic devices. Proc. IEEE 2008, 96, 1457–1486. [Google Scholar] [CrossRef] [Green Version]
  43. Beeby, S.P.; Tudor, M.J.; White, N.M. Energy harvesting vibration sources for microsystems applications. Meas. Sci. Technol. 2006, 17, R175–R195. [Google Scholar] [CrossRef] [Green Version]
  44. Stewart, M.; Weaver, P.M.; Cain, M. Charge redistribution in piezoelectric energy harvesters. Appl. Phys. Lett. 2012, 100, 073901. [Google Scholar] [CrossRef]
  45. Rayegani, A.; Saberian, M.; Delshad, Z.; Liang, J.; Sadiq, M.; Nazar, A.M.; Mohsan, S.A.H.; Khan, M.A. Recent advances in self-powered wearable sensors based on piezoelectric and triboelectric nanogenerators. Biosensors 2022, 13, 37. [Google Scholar] [CrossRef]
Figure 1. Procedures involved in this proposed approach for the additional/hybrid energy extraction concepts.
Processes 11 00830 g001
Figure 2. Comprehensive historical relationship between payload and overall weights of relevant aircraft.
Processes 11 00830 g002
Figure 3. Design draft of airplane wing.
Processes 11 00830 g003
Figure 4. Design draft of wind turbine blade.
Processes 11 00830 g004
Figure 5. Design draft of UAV’s wing.
Processes 11 00830 g005
Figure 6. Discretized structure of an aircraft wing for aero-structural simulation.
Processes 11 00830 g006
Figure 7. Discretized structure of a wind turbine.
Processes 11 00830 g007
Figure 8. Discretized structure of a small UAV’s wing for structural and vibrational investigations.
Processes 11 00830 g008
Figure 9. Discretized structure of a small UAV’s wing for CFD investigations. (a) A typical top view of entire discretized structure. (b) A typical zoomed view of discretized structure of UAV’s wing.
Processes 11 00830 g009
Figure 10. Initial naming conditions of an airplane wing, CFD Analysis. (a) A systematic representation of imposed naming on entire CFD domain. (b) A systematic projection of imposed naming on airplane wing–zoomed view.
Processes 11 00830 g010
Figure 11. Structural boundary conditions of aircraft wing, finite element and modal analyses.
Processes 11 00830 g011
Figure 12. Grid convergence test1 (aerodynamic pressure on UAV-wing in kPa).
Processes 11 00830 g012
Figure 13. Grid convergence test 2: natural frequency of KFRPwind turbine blade.
Processes 11 00830 g013
Figure 14. Computational vibrational modal analysis results: Al-alloywing.
Processes 11 00830 g014
Figure 15. Pressure variations over the airplane wing, wind turbine blade and UAV wing respectively. (a) A typical isometric view of pressure variations on airplane wing. (b) A typical isometric view of pressure variations on wind turbine. (c) A typical isometric view of pressure variations on UAV wing.
Processes 11 00830 g015
Figure 16. Deformed structures of Al-alloy, Kevlar, and GFRP respectively–structural outcomes. (a) Structural displacements of airplane wing. (b) Structural displacement of wind turbine blade. (c) Structural displacement of UAV wing.
Processes 11 00830 g016
Figure 17. Deformed structures of Al-alloy, GFRP, and CFRP respectively—vibrational outcomes. (a) Vibrational displacements of airplane wing imposed with Al-alloy. (b) Vibrational displacements of airplane wing imposed with GFRP. (c) Vibrational displacements of airplane wing imposed with CFRP.
Processes 11 00830 g017
Figure 18. Comprehensive details of linear mode shapes versus natural frequencies for different alloys—Airplane Wing.
Processes 11 00830 g018
Figure 19. Comprehensive details of linear mode shapes versus natural frequencies for different composites—Airplane Wing.
Processes 11 00830 g019
Figure 20. Deformed structures of titanium alloys, GFRP, and KFRP, respectively. (a) Vibrational displacements of wind turbine blade imposed with Titanium-alloy. (b) Vibrational displacements of wind turbine blade imposed with GFRP. (c) Vibrational displacements of wind turbine blade imposed with KFRP.
Processes 11 00830 g020
Figure 21. Comprehensive details of linear mode shapes versus natural frequencies for different alloys—Wind Turbine Blade.
Processes 11 00830 g021
Figure 22. Comprehensive details of linear mode shapes versus natural frequencies for different composites—Wind Turbine Blade.
Processes 11 00830 g022
Figure 23. Deformed structures of GFRP, KFRP, and CFRP, respectively. (a) Vibrational displacements of UAV wing imposed with GFRP. (b) Vibrational displacements of UAV wing imposed with KFRP. (c) Vibrational displacements of UAV wing imposed with CFRP.
Processes 11 00830 g023
Figure 24. Comprehensive details of linear mode shapes versus natural frequencies for different alloys—UAV Wing.
Processes 11 00830 g024
Figure 25. Comprehensive details of linear mode shapes versus natural frequencies for different composites—UAV Wing.
Processes 11 00830 g025
Figure 26. Design of base platform for experimental validations.
Processes 11 00830 g026
Figure 27. Pressure variations on base aircraft wing model for experimental validation.
Processes 11 00830 g027
Figure 28. Vibrational outcomes of base aircraft wing for experimental validation.
Processes 11 00830 g028
Figure 29. A typical view of an airplane wing with piezoelectric patches.
Processes 11 00830 g029
Figure 30. Power (P0) in W with 100% attachment coverage—airplane wing.
Processes 11 00830 g030
Figure 31. Power (P0) in W with 75% attachment coverage—airplane wing.
Processes 11 00830 g031
Figure 32. Power (P0) in W with 50% attachment coverage—airplane wing.
Processes 11 00830 g032
Figure 33. Power (P0) in W with 25% attachment coverage—airplane wing.
Processes 11 00830 g033
Figure 34. A typical view of a wind turbine blade with piezoelectric layer.
Processes 11 00830 g034
Figure 35. Power (P0) in W with 100% attachment coverage—wind turbine blade.
Processes 11 00830 g035
Figure 36. Power (P0) in W with 75% attachment coverage—wind turbine blade.
Processes 11 00830 g036
Figure 37. Power (P0) in W with 50% attachment coverage—wind turbine blade.
Processes 11 00830 g037
Figure 38. Power (P0) in W with 25% attachment coverage—wind turbine blade.
Processes 11 00830 g038
Figure 39. A typical view of a UAV wing with piezoelectric patch.
Processes 11 00830 g039
Figure 40. Power (P0) in W with 100% attachment coverage-UAV wing.
Processes 11 00830 g040
Figure 41. Power (P0) in W with 75% attachment coverage-UAV wing.
Processes 11 00830 g041
Figure 42. Power (P0) in W with 50% attachment coverage-UAV wing.
Processes 11 00830 g042
Figure 43. Power (P0) in W with 25% attachment coverage-UAV wing.
Processes 11 00830 g043
Table 1. Comparative analysis of validations.
Validation on Displacement Analysis (mm)—Airplane Wing
Computational FSI-Based DisplacementAnalytical FEA-Based DisplacementError Percentage
0.13250.143117.413
Table 2. Validation of Modal Analysis (Natural frequency) (Hz).
Computational Free Vibrational ResultsConventional Approach-Based Natural FrequencyError Percentage
22.13722.4631.45
Table 3. Comparative analysis of validations.
Validation of Modal Analysis (Natural Frequency) (Hz)—1
Analytical FEM-Based Natural FrequencyComputational Free Vibrational ResultsError Percentage
20.603222.1376.93
Validation of Modal Analysis (Natural frequency) (Hz)—2
Conventional Approach-Based Natural FrequencyAnalytical FEM-Based Natural FrequencyError Percentage
22.46320.60328.3
Table 4. Comparative FSI results of various composite materials.
Structural ParametersGFRPKFRPCFRP
Airplane wingDisplacement (mm)0.17150.1230.1325
Stress (MPa)0.3450.3560.346
Wind Turbine BladeDisplacement (mm)16.19912.46711.683
Stress (MPa)11.38811.37111.441
UAV wingDisplacement (mm)0.059430.0425660.045853
Stress (MPa)1.39631.39141.4878
Table 5. Comparative FSI results of aerospace alloys.
Structural ParametersAl-AlloyTi-Alloy
Airplane wingDisplacement (mm)0.130.096
Stress (MPa)0.3460.362
Wind Turbine BladeDisplacement (mm)12.2919.0786
Stress (MPa)11.37111.366
UAV wingDisplacement (mm)0.0455060.033491
Stress (MPa)1.37471.38
Disclaimer/Publisher’s Note: The statements, opinions and data contained in all publications are solely those of the individual author(s) and contributor(s) and not of MDPI and/or the editor(s). MDPI and/or the editor(s) disclaim responsibility for any injury to people or property resulting from any ideas, methods, instructions or products referred to in the content.

