Article

Prioritization and Optimal Location of Hydrogen Fueling Stations in Seoul: Using Multi-Standard Decision-Making and ILP Optimization

Department of Industrial Engineering, College of Science & Technology, Dankook University, Cheonan 31116, Republic of Korea
*
Author to whom correspondence should be addressed.
Processes 2023, 11(3), 831; https://doi.org/10.3390/pr11030831
Submission received: 8 February 2023 / Revised: 28 February 2023 / Accepted: 6 March 2023 / Published: 10 March 2023
(This article belongs to the Section Energy Systems)

Abstract

:
Thus far, the adoption of hydrogen fuel cell vehicles (HCEVs) has been hampered by the lack of hydrogen fueling infrastructure. This study aimed to determine the optimal location and prioritization of hydrogen fueling stations (HFSs) in Seoul by utilizing a multi-standard decision-making approach and optimization method. HFS candidate sites were evaluated with respect to relevant laws and regulations. Key factors such as safety, economy, convenience, and demand for HCEVs were considered. Data were obtained through a survey of experts in the fields of HCEV and fuel cells, and the Analytic Hierarchy Process method was applied to prioritize candidate sites. The optimal quantity and placement of HFSs was then obtained using optimization software, based on the acceptable travel time from intersections of popular roads in Seoul. Our findings suggest that compliance with legal safety regulations is the most important factor when constructing HFSs. Furthermore, sensitivity analysis revealed that the hydrogen supply cost currently holds the same weight as other elements. The study highlights the importance of utilizing a multi-standard decision-making approach and optimization methods when determining the optimal location and prioritization of HFSs and can help develop a systematic plan for the nationwide construction of HFSs in South Korea.

1. Introduction

Global warming is driving the world towards reducing its consumption of fossil fuels. The importance of hydrogen as an energy source is also growing, owing to the adoption of renewable energy generation technologies and the enforcement of regulations aimed at curbing carbon dioxide and nitrogen oxide emissions from energy sources such as natural gas, liquefied petroleum gas, and biogas [1,2,3]. In particular, the significance of hydrogen charging infrastructure is increasing as the world’s production of fossil-fuel-powered vehicles is supposed to cease before 2035, and the transition to electric vehicles or hydrogen cell electric vehicles (HCEVs) accelerates.
The global market for hydrogen fueling infrastructure is in its nascent stage, and owing to the high initial investment costs, a systematic building approach is imperative. In the United States, governmental bodies have devised and implemented a quantization approach to construct a blueprint for building hydrogen fueling infrastructure [4]. Similarly, in Korea, hydrogen industry-related organizations continue to propose comparable initiatives to the government. However, owing to the authorities’ lack of enthusiasm and the immature hydrogen sector for general customers, the need to establish a technique for developing hydrogen fueling stations (HFSs) infrastructure is low [4]. Consequently, there is a pressing need to develop a strategy for constructing an appropriate HFS infrastructure to bolster sales of next-generation HCEVs.
Boo et al. [5] have forecasted the number of HCEVs to be delivered in 2020, 2025, 2030, 2035, and 2040, as well as the number of HFSs that will be required in each city, county, and district in Korea. They have predicted the demand for hydrogen electric cars based on a 0.2% penetration rate in 2020 and a 4.1% penetration rate in 2030 [5]. Furthermore, the demand for hydrogen was assessed by city, county, and district based on the number of cars in each area, and the required base number of HFSs per city, county, and district was computed [5].
To anticipate the demand for hydrogen electric cars, Lawrence and Lawton’s market diffusion model was used, with the starting market characteristics and diffusion rate parameters being the key factors in this model [6].
Lee [7] selected Seoul as a case study target area and proposed a strategy to install HFSs by region based on the number of HFSs forecast by Boo et al. [5]. He suggested using dynamic planning and geographic information systems to select candidate sites for HFSs that are the farthest away from existing HFSs, and to limit candidate sites for HFSs to existing gas stations, LPG fueling stations, and CNG fueling stations [7]. The gap between HFSs was calculated based on the travel time between the existing HFS and HFS candidates, and this criterion was used to prioritize HFS candidates located far from the existing HFS, with consumer convenience being a key consideration [7].
Park et al. [8] conducted a survey on locations in Seoul and metropolitan cities where LPG and HFSs can be built concurrently, while meeting current domestic HCSHFS requirements. Their findings revealed that only six out of Seoul’s 72 LPG charging/fueling stations meet the criteria for concurrent HCSHFS construction. As there is limited available land in the metropolitan city’s downtown area, the authors recommended the implementation of a multi-layered and packed HFS [8].
Melendez and Milbrandt [9] conducted a study on the forecasting and construction of hydrogen demand infrastructure based on regional characteristics, and proposed strategically deploying HFSs in major cities in the United States, where many people live in densely populated regions and are receptive to HCEVs. They identified New York City and Los Angeles as the optimal introduction locations for HFSs and included eight more cities in the second stage of the proposal (2016–2019): Chicago, San Francisco, Philadelphia, Boston, Detroit, Dallas, Atlanta, and Seattle, with plans to construct a total of 3945 HFSs in these areas [9]. The first proposal of deploying HFSs in large cities with dense populations offers the advantage of reducing construction costs while simultaneously increasing the supply scope [9].
Stephens-Romero et al. [10] proposed a model in which regional customers of hydrogen–electric cars determine the ideal quantity and placement of HFSs based on economic efficiency and convenience. They selected Irvine, California as the target location for their case study and designed an affordable HFS that allows HCEV owners in the region to construct a minimum HFS within a defined travel time [10]. Furthermore, the authors identified environmental implications such as greenhouse gas emissions from HFS implementation [10].
The California Hydrogen Infrastructure Tool (CHIT) plans and presents general HFS construction directions for areas in need of hydrogen infrastructure and also evaluates the relative necessity of hydrogen infrastructure via Gap Analysis of current hydrogen infrastructure and future markets [11]. CHIT presented a model that uses optimization techniques and geographic information systems to determine the optimal number and location of HFSs based on traffic volume, demand for HFSs, site analysis of HFSs, travel time to HFSs, and analysis results [11].
Traditional facility placement selection models, such as P-median [12], Set Covering [13], and Maximum Covering [14], seek to identify the ideal site that best meets the needs of the surrounding nodes [11,15]. In contrast, Hodgson [16] noted that in the case of facilities where people buy products or services on the spur of the moment, it is appropriate to examine route-based traffic flowing through the place rather than the demand at nodes around the facility. This comprises LPG and CNG fueling stations as well as gas stations on important highways and arterial routes. In the case of highway gasoline fueling facilities, it is preferable to choose a location that fulfills the largest traffic volume passing through the area rather than a place that optimizes the demand for nearby traffic nodes [16]. Hodgson created the Flow Capacity Location Model (FCLM), a place selection model that is dependent on traffic volume on the route that passes through the location [16]. However, the FCLM model faces a critical issue when optimizing the location of the HFSs [17,18,19,20]. When fueling a hydrogen fuel cell car once, mileage cannot be considered. This is because the FCLM concept is intended to meet the maximum traffic volume flowing through the facility regardless of the vehicle’s maximum range of travel [21].
By incorporating the notion of the maximum mileage of the vehicle into the FCLM, the Flow Refueling Placement Model (FRLM), which is a fueling station location selection model, was suggested in response to the constraints of this FCLM model [19]. The FRLM model created an intuitive linear mathematical model by considering the difficult-to-modify concept of the maximum range of hydrogen fuel cell cars as an external variable [16]. Various extended FRLM models have been presented [18,22,23,24,25,26]. Nonetheless, most of these studies are limited in that they are models that maximize their placement in terms of bias throughout supply and demand [15].
Some studies, such as Wang et al. [27], have proposed a generalized model that can select the optimal location while considering consumer benefits as well as supplier costs; however, it does not adequately reflect the characteristics of HFSs, such as hydrogen supply methods or compliance with laws and regulations.
Previous studies primarily focused on estimating the number of HFSs required to build a hydrogen economy, but this study determined the priority of building HFSs by developing a multi-standard decision-making method that considered major evaluation indicators such as safety, economy, convenience, and demand for HCEVs [11,15,26]. Candidates for new HFSs in Seoul were identified, and the priority of establishing HFS candidates in Seoul was determined through a multi-standard comprehensive evaluation of HFS candidates in Seoul.
Furthermore, the convenience of hydrogen electric car owners was examined by selecting important road crossings in Seoul and evaluating the trip time from major intersections to candidate locations for HFSs. A model was provided using the optimization approach to estimate the ideal location and number of HFSs where the trip time from the intersection of the main highways in Seoul to the HFSs can be achieved within a fixed amount of time.
The primary goal of this research is to create a tool that can create a strategy for constructing an HFS in Seoul, as well as to secure quantification and analysis techniques for constructing an HFS that consider Seoul’s population, traffic volume, number of vehicles, location, and regulations. In particular, the priority for constructing HFSs will be chosen based on the regional demand for hydrogen electric cars in the early phases of the hydrogen economy, considering Seoul’s population, traffic volume, and vehicle count.
Furthermore, the ideal construction foundation and location of HFSs were chosen based on economic efficiency and convenience of use for places that do not infringe building and gas rules. To prioritize the development of HFSs for candidate sites for new sites, a tool and analytical approach were created.

2. Materials and Methods

2.1. Analytic Hierarchy Process

The Analytic Hierarchy Process (AHP) was employed in this study to prioritize the construction of HFSs. Saaty pioneered the stratification analysis in the 1970s. AHP is a multi-criteria decision-making (MCDM) approach that selects or prioritizes options by hierarchically categorizing numerous variables to assess the value of each feature (factor) [28]. In recent times, AHP has been adopted by government budget projects, public institutions, universities, and research institutes as an ideal strategy for multi-standard or multi-factor decision-making that involves non-quantitative aspects [28].
AHP employs expert group surveys to evaluate the value of evaluation indicators, and the pairwise comparison approach is used to establish the relative importance of the two evaluation indicators [28]. Table 1 presents Saaty’s nine-step pairwise comparison scale.
The step-by-step application technique of AHP consists of four steps, with the first stage deriving crucial characteristics or qualities for the thorough examination of options through expert brainstorming [28]. In the second step, a hierarchical structure of the assessment elements is developed [28]. The assessment elements have a structure that hierarchically produces profoundly connected aspects. The findings of the paired comparison of the respondents received by the survey are verified to be consistent in the third step, and the weights of the assessment elements are computed using the paired comparison results [28]. In Step 4, the total score of each alternative is computed, and the priority of the alternatives is determined by the total score of each alternative [28].

Evaluation for Consistency

Consistency evaluation was used to determine if the pairwise comparison of survey respondents yielded consistent findings. The following symbols are used to describe the consistency evaluation process.
W i = Weight   of   evaluation   index   i , a i j = relative   importance   of   j   compared   to   the   evaluation   index   i , W = ( w 1 , w 2 ,   , w n ) A = matrix   a i j , λ = an   eigenvalue   of   A
The following are the prerequisites for A to be consistent, according to Saaty [29]:
A     W = λ     W
As both sides of Equation (1) are difficult to match perfectly, the following equation is used to compute λ m a x , which provides an approximation of λ .
A     W = λ m a x     W
The following symbols were used to express the consistency ratio, which represents the consistency of the pair-to-pair comparison of the survey respondents.
C I = Consistency   Index , R I = Random   Consistency   Index , C R =   Consistency   Ratio
The following equations are then used to compute CI, RI, and CR.
C I = ( λ m a x n ) / ( n 1 )
R I = 1.98 × n / ( n 1 )
C R = C I / R I
Taha states that if the CR of Equation (5) is less than 0.1, the respondents’ appraisal is assessed to be consistent, whereas if the CR is less than 0.2, the evaluation of consistency is judged to be within an acceptable level [30].

2.2. Integer Linear Programming

Integer Linear Programming (ILP) is a widely used mathematical optimization technique that is commonly used for solving location selection problems. ILP is a mathematical optimization technique that involves minimizing or maximizing a linear objective function subject to a set of linear constraints, where the decision variables are required to be integers. In the context of location selection, the decision variables represent the location of the facility or service, and the objective function represents the cost or profit associated with the location.
The ILP model can be solved using a variety of software packages such as CPLEX, Gurobi, and SCIP. The solution to the ILP model provides the optimal location selection that minimizes the total cost or maximizes the profit, subject to the constraints. The benefits of using ILP for location selection are numerous. First, it provides a rigorous and systematic approach to location selection that takes into account multiple factors and constraints. Second, it allows decision-makers to evaluate a variety of scenarios and trade-offs, and to select the location that best meets their objectives. Third, it can be applied to a wide range of location selection problems, such as facility location, warehouse location, and retail store location.
In this study, the problem of choosing the best foundation and location for an HFS was formalized as an ILP problem under the condition that it can arrive at candidates for the HFS within a given travel time from all major intersections. The installation of a fire station at the lowest possible construction cost falls under the category of set covering problems. Specifically, the problem of determining the best base and location for an HFS can be compared to that of determining the base and location of a fire station such that a fire engine can be dispatched within a specified travel time at the lowest possible cost in the event of a fire. The following symbols were used to formalize as an ILP problem the problem of determining the optimal construction base and location of an HFS under the condition that it can arrive within a given travel time from all the major intersections in Seoul.
x j =   Existing   or   new   candidate   site   for   HFS ,           j = 1 ,   2 ,   ,   n , t i j =   Major   intersection   travel   time   from   i   to   candidate   HFS   j ,     i = 1 ,   2 ,   ,   m , t = Allowed   travel   time
The ILP problem of 7 determining the optimal construction base and location of HFSs that can arrive within a given travel time was then formulated as:
M i n i m i z e           z = j = 1 n x j  
s u b j e c t   t o           j = 1 n Y i j × x j 1 ,   i = 1 ,   2 ,   3 ,   ,   m
Y i j = { 1 ,   if   the   travel   time   ( t i j )   from   intersection   i   to   candidate   site   j   is   within   the   allowed   travel   time   ( t ) , 0 , otherwise ,
x j = { 1 ,             when   the   exist   station   j   is   selected 0 ,       o t h e r w i s e
Both the variable j representing the candidate site of the HFS and the variable Y i j representing whether the travel time from the intersection i to the candidate site of the HFS is within the allowed travel time are represented by a binary variable with a value of 0 or 1. The first constraint is that the travel time from intersection i to at least one candidate site for a HFS must be within the allowed travel time.
The objective function determines the best locations for HFSs while simultaneously decreasing the total cost by reducing the total number of HFSs placed.

3. Results and Discussion

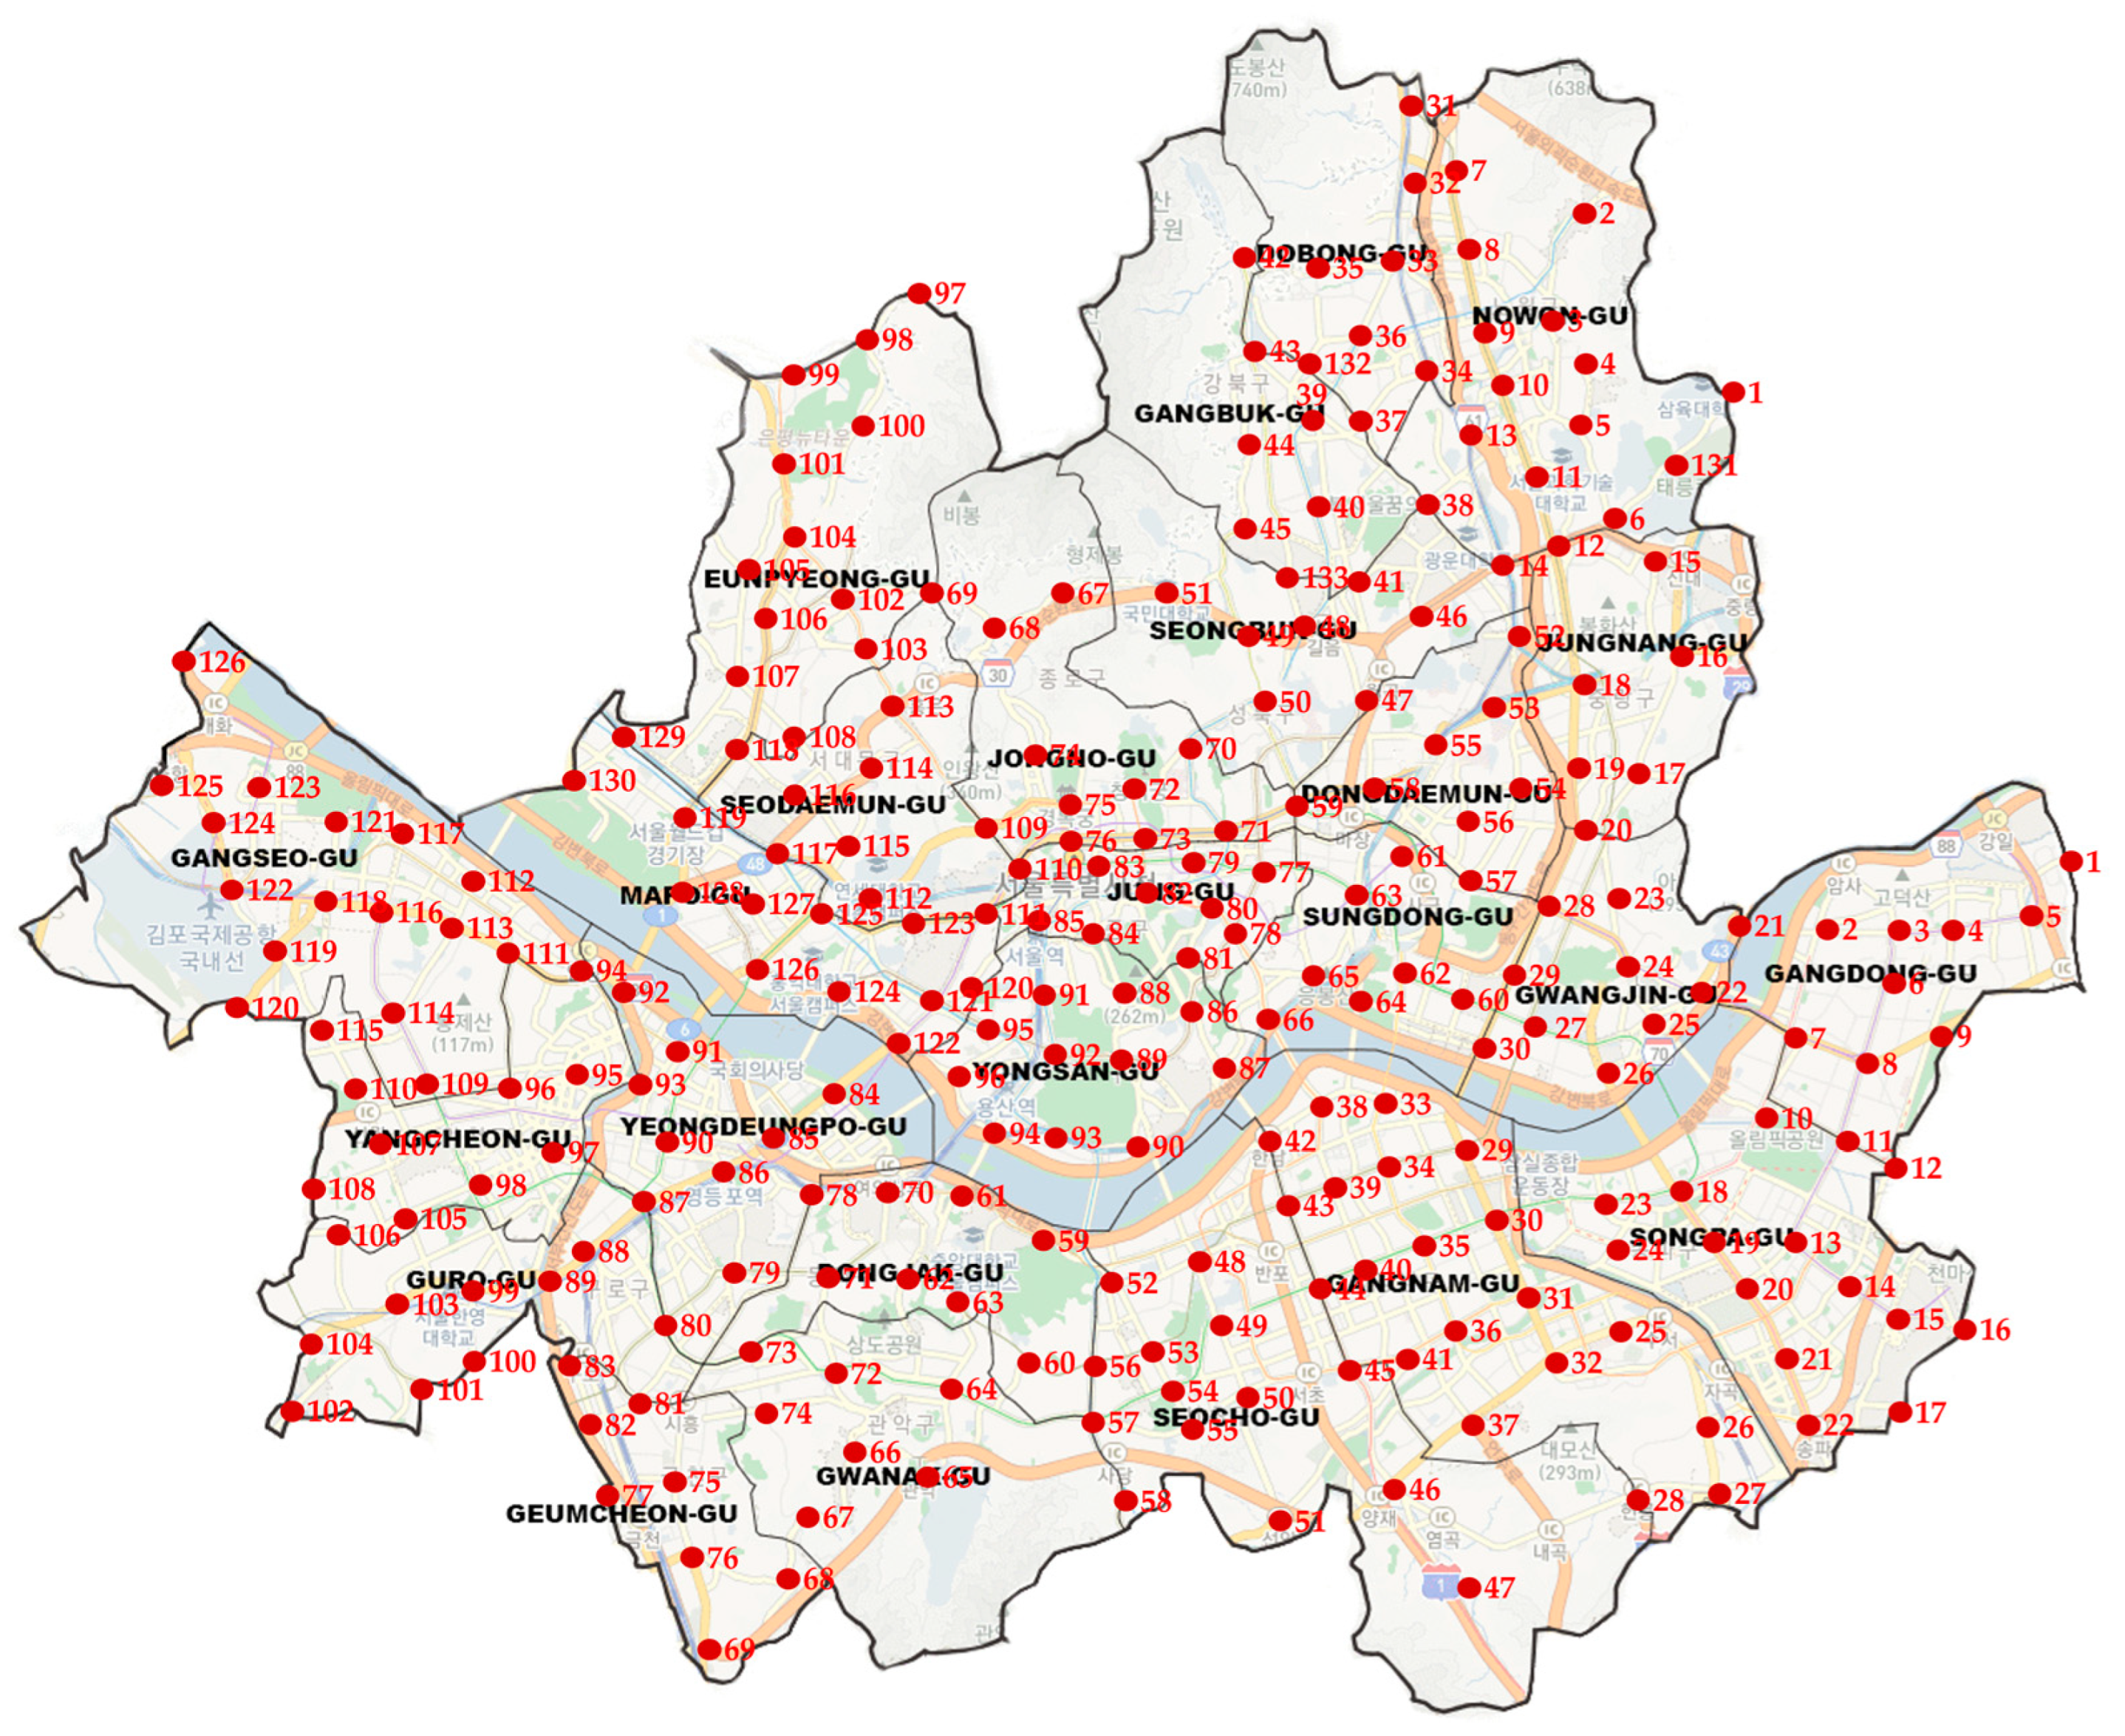
3.1. Selection of Research Regions

This study focused on the best site analysis of HFSs based on regional information, utilizing Seoul, Korea as the location for the case study. Seoul is South Korea’s capital and the hub of politics, economy, industry, society, culture, and transportation. Seoul is located at the heart of the Korean Peninsula and is separated into two districts surrounding the Hangang River: south and north. It is divided into 25 regions (gu), and Table 2 lists the statistics of the HFSs per Seoul region [31].
In 2022, the area of Seoul was 605 km2, which is approximately 0.6% of the national land area of 100,432 km2 in Korea. The population of Seoul is around 9.66 million, which is 18.8% of the national population of 51.43 million. As of December 2022, the number of registered passenger vehicles in Seoul is approximately 3.19 million, representing 12.5% of the total number of passenger cars in the country, i.e., approximately 25.55 million, which indicates that the number of passenger vehicles in Seoul is lower than the national average. As of December 2022, the total number of registered electric cars in the country was 390,403 [31].

3.2. Current Status of HFSs

According to the construction form, HFSs can be classified as single, side-building, complex, or fusion fueling stations. A side-by-side fueling station is a type of fueling station that utilizes hydrogen and other energy sources along road boundaries, whereas a stand-alone fueling station solely functions as an HFS. A “convergence fueling station” is, according to the Korean government, any installation and operation of a HFS at one business location that uses energy sources like compressed natural gas and liquefied petroleum gas, or any installation and operation of a manufactured HFS.
Currently, there are eight HFSs in Seoul that can be used to refuel privately owned HCEVs. The HFS constructed in Yangjae-dong is a concentrated HFS that uses by-product hydrogen, whereas the HFS constructed in Sangam-dong is a dispersed HFS that creates hydrogen by altering landfill gas (LFG).
However, given the restrictions imposed by the rules, there are few locations in Seoul where HFSs can be built. Therefore, convergence HFSs are being developed as viable alternatives. Convergence HFS construction has the drawback of requiring a business proposal from an existing operator, and is more expensive. However, there is a disadvantage to building a convergence HFS in that it requires a business proposal to the current operator and costs more than a specific amount of rebuilding. Furthermore, because the bulk of LPG and CNG fueling stations are in remote locations, HFSs are less accessible to HCEV owners. There are currently no LPG fueling stations in Mapo-gu, Yongsan-gu, Jongno-gu, or Jung-gu, and none in Dongdaemun-gu, Dongjak-gu, Seodaemun-gu, Yeongdeungpo-gu, Yongsan-gu, or Jongno-gu. Owing to issues with protective facilities, such as military installations and cultural properties, Yongsan-gu and Jongno-gu have no LPG or CNG fueling stations.

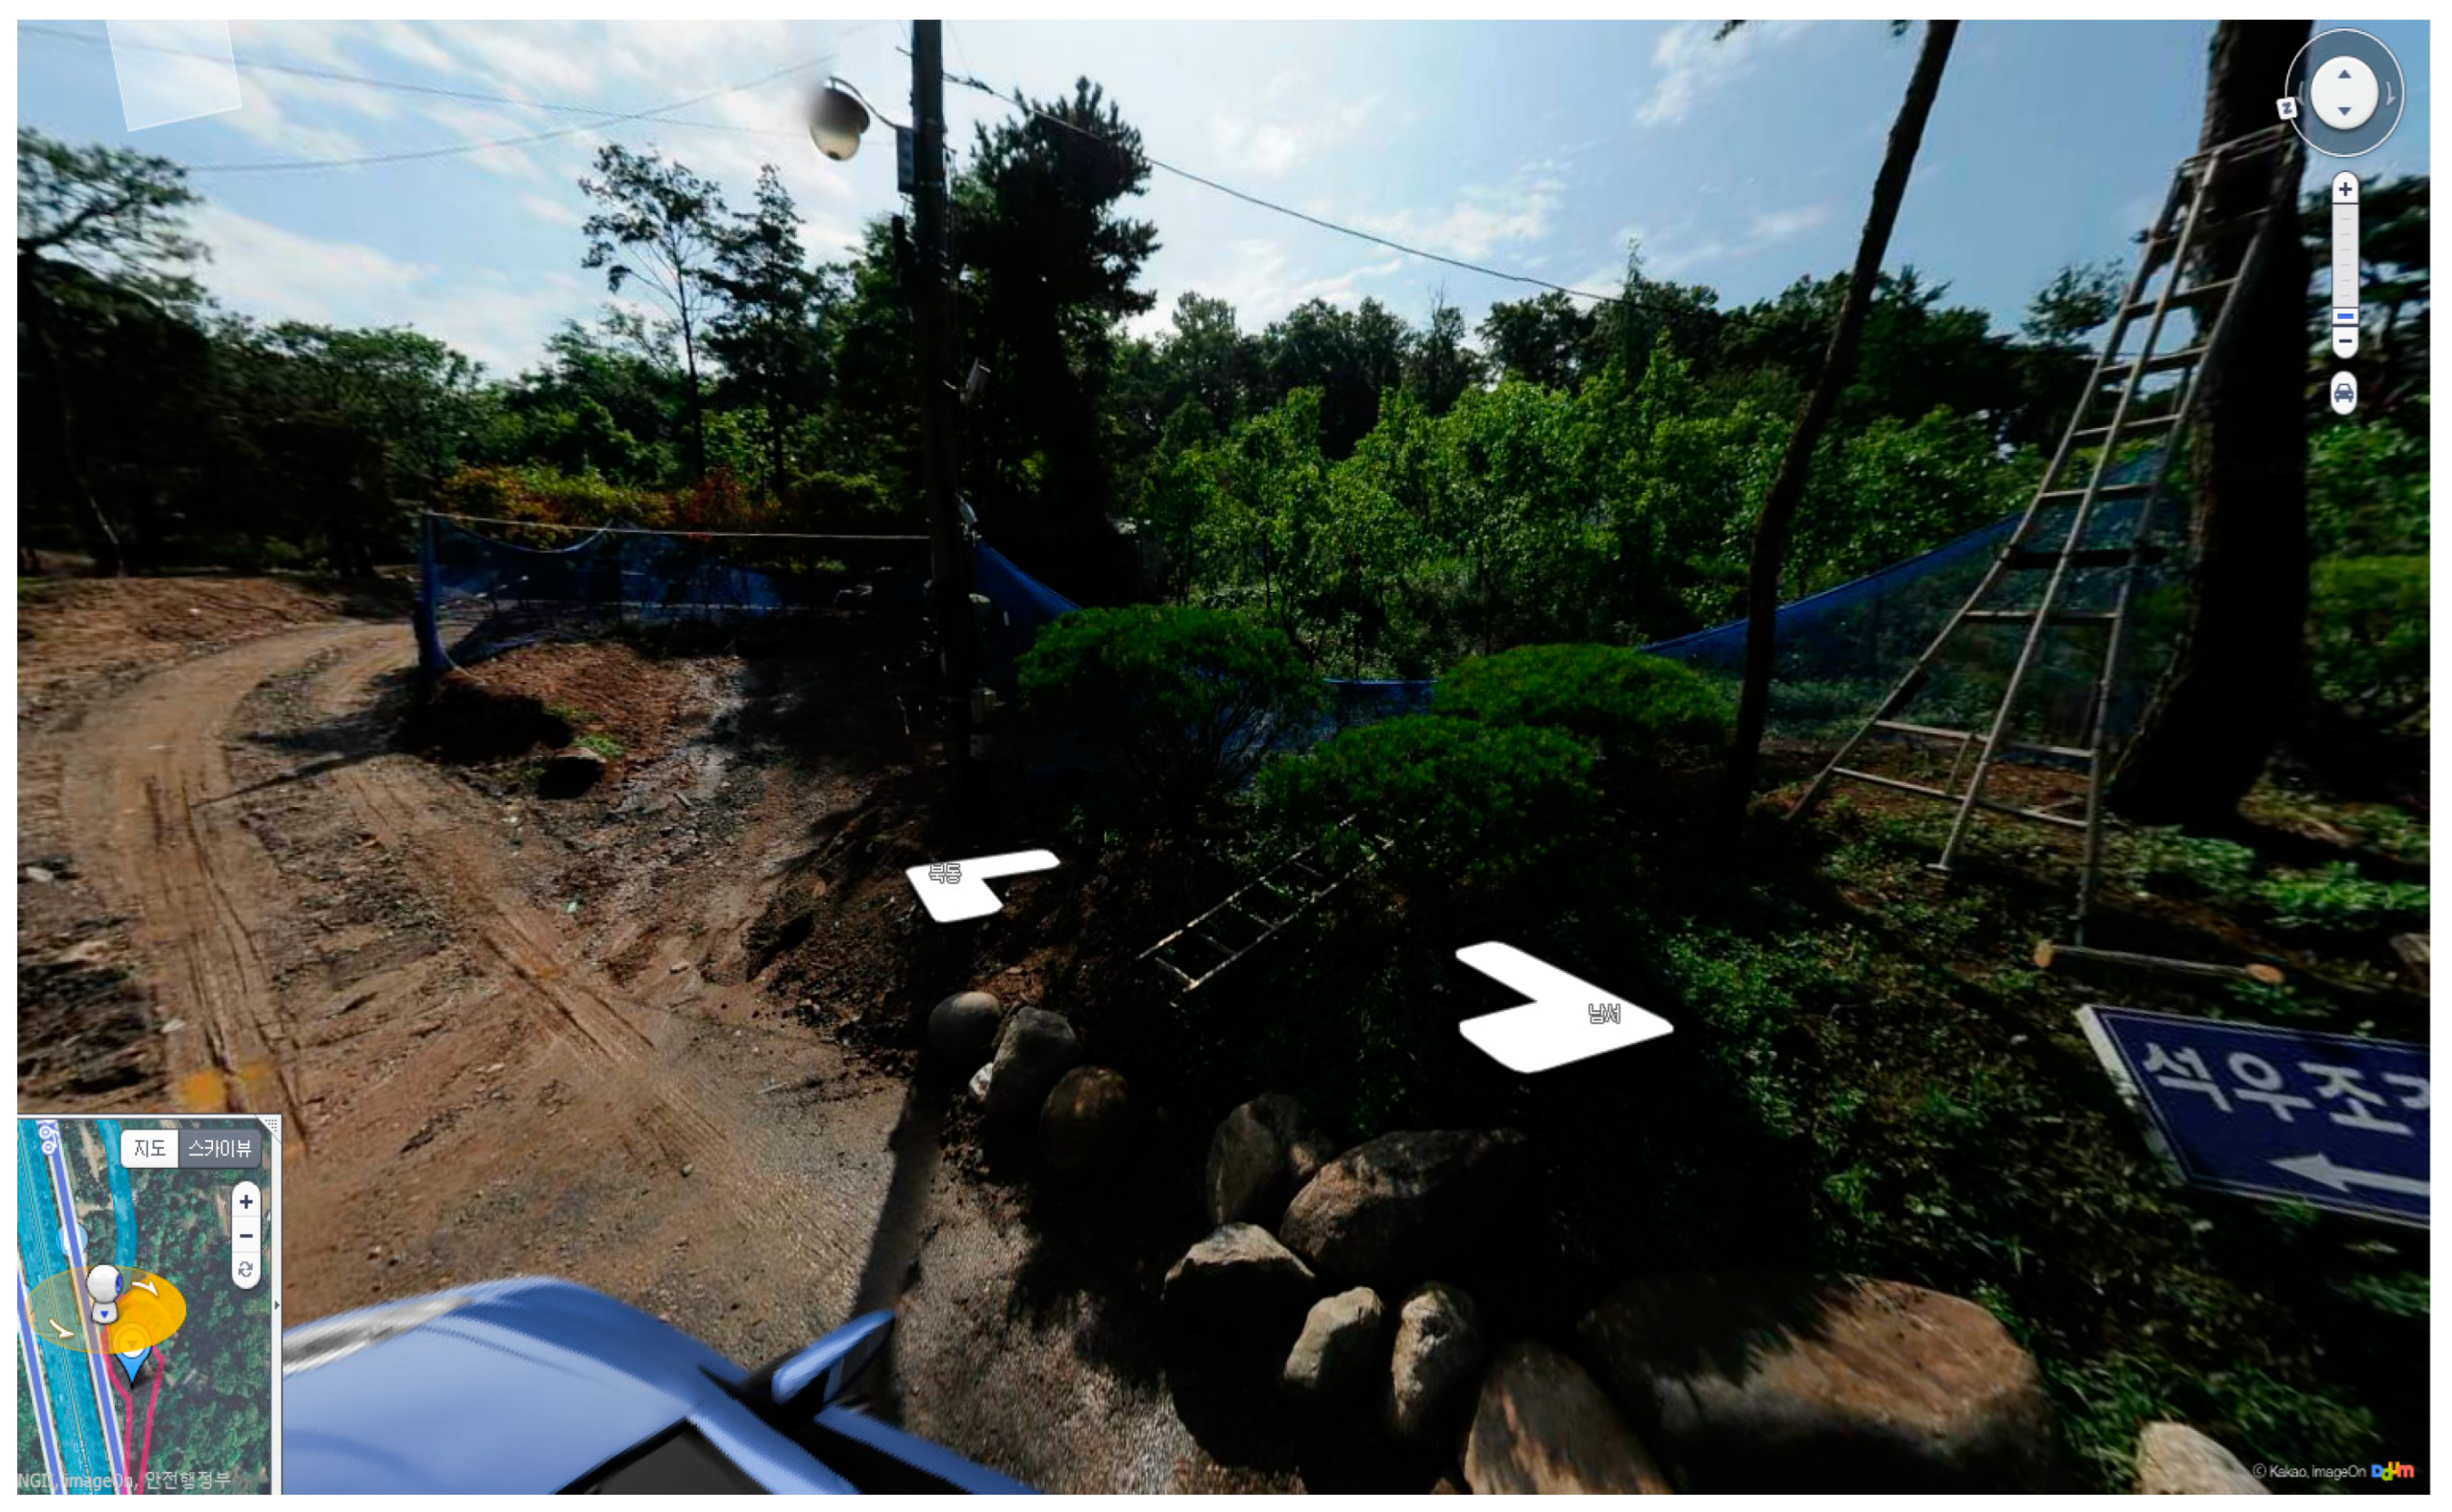
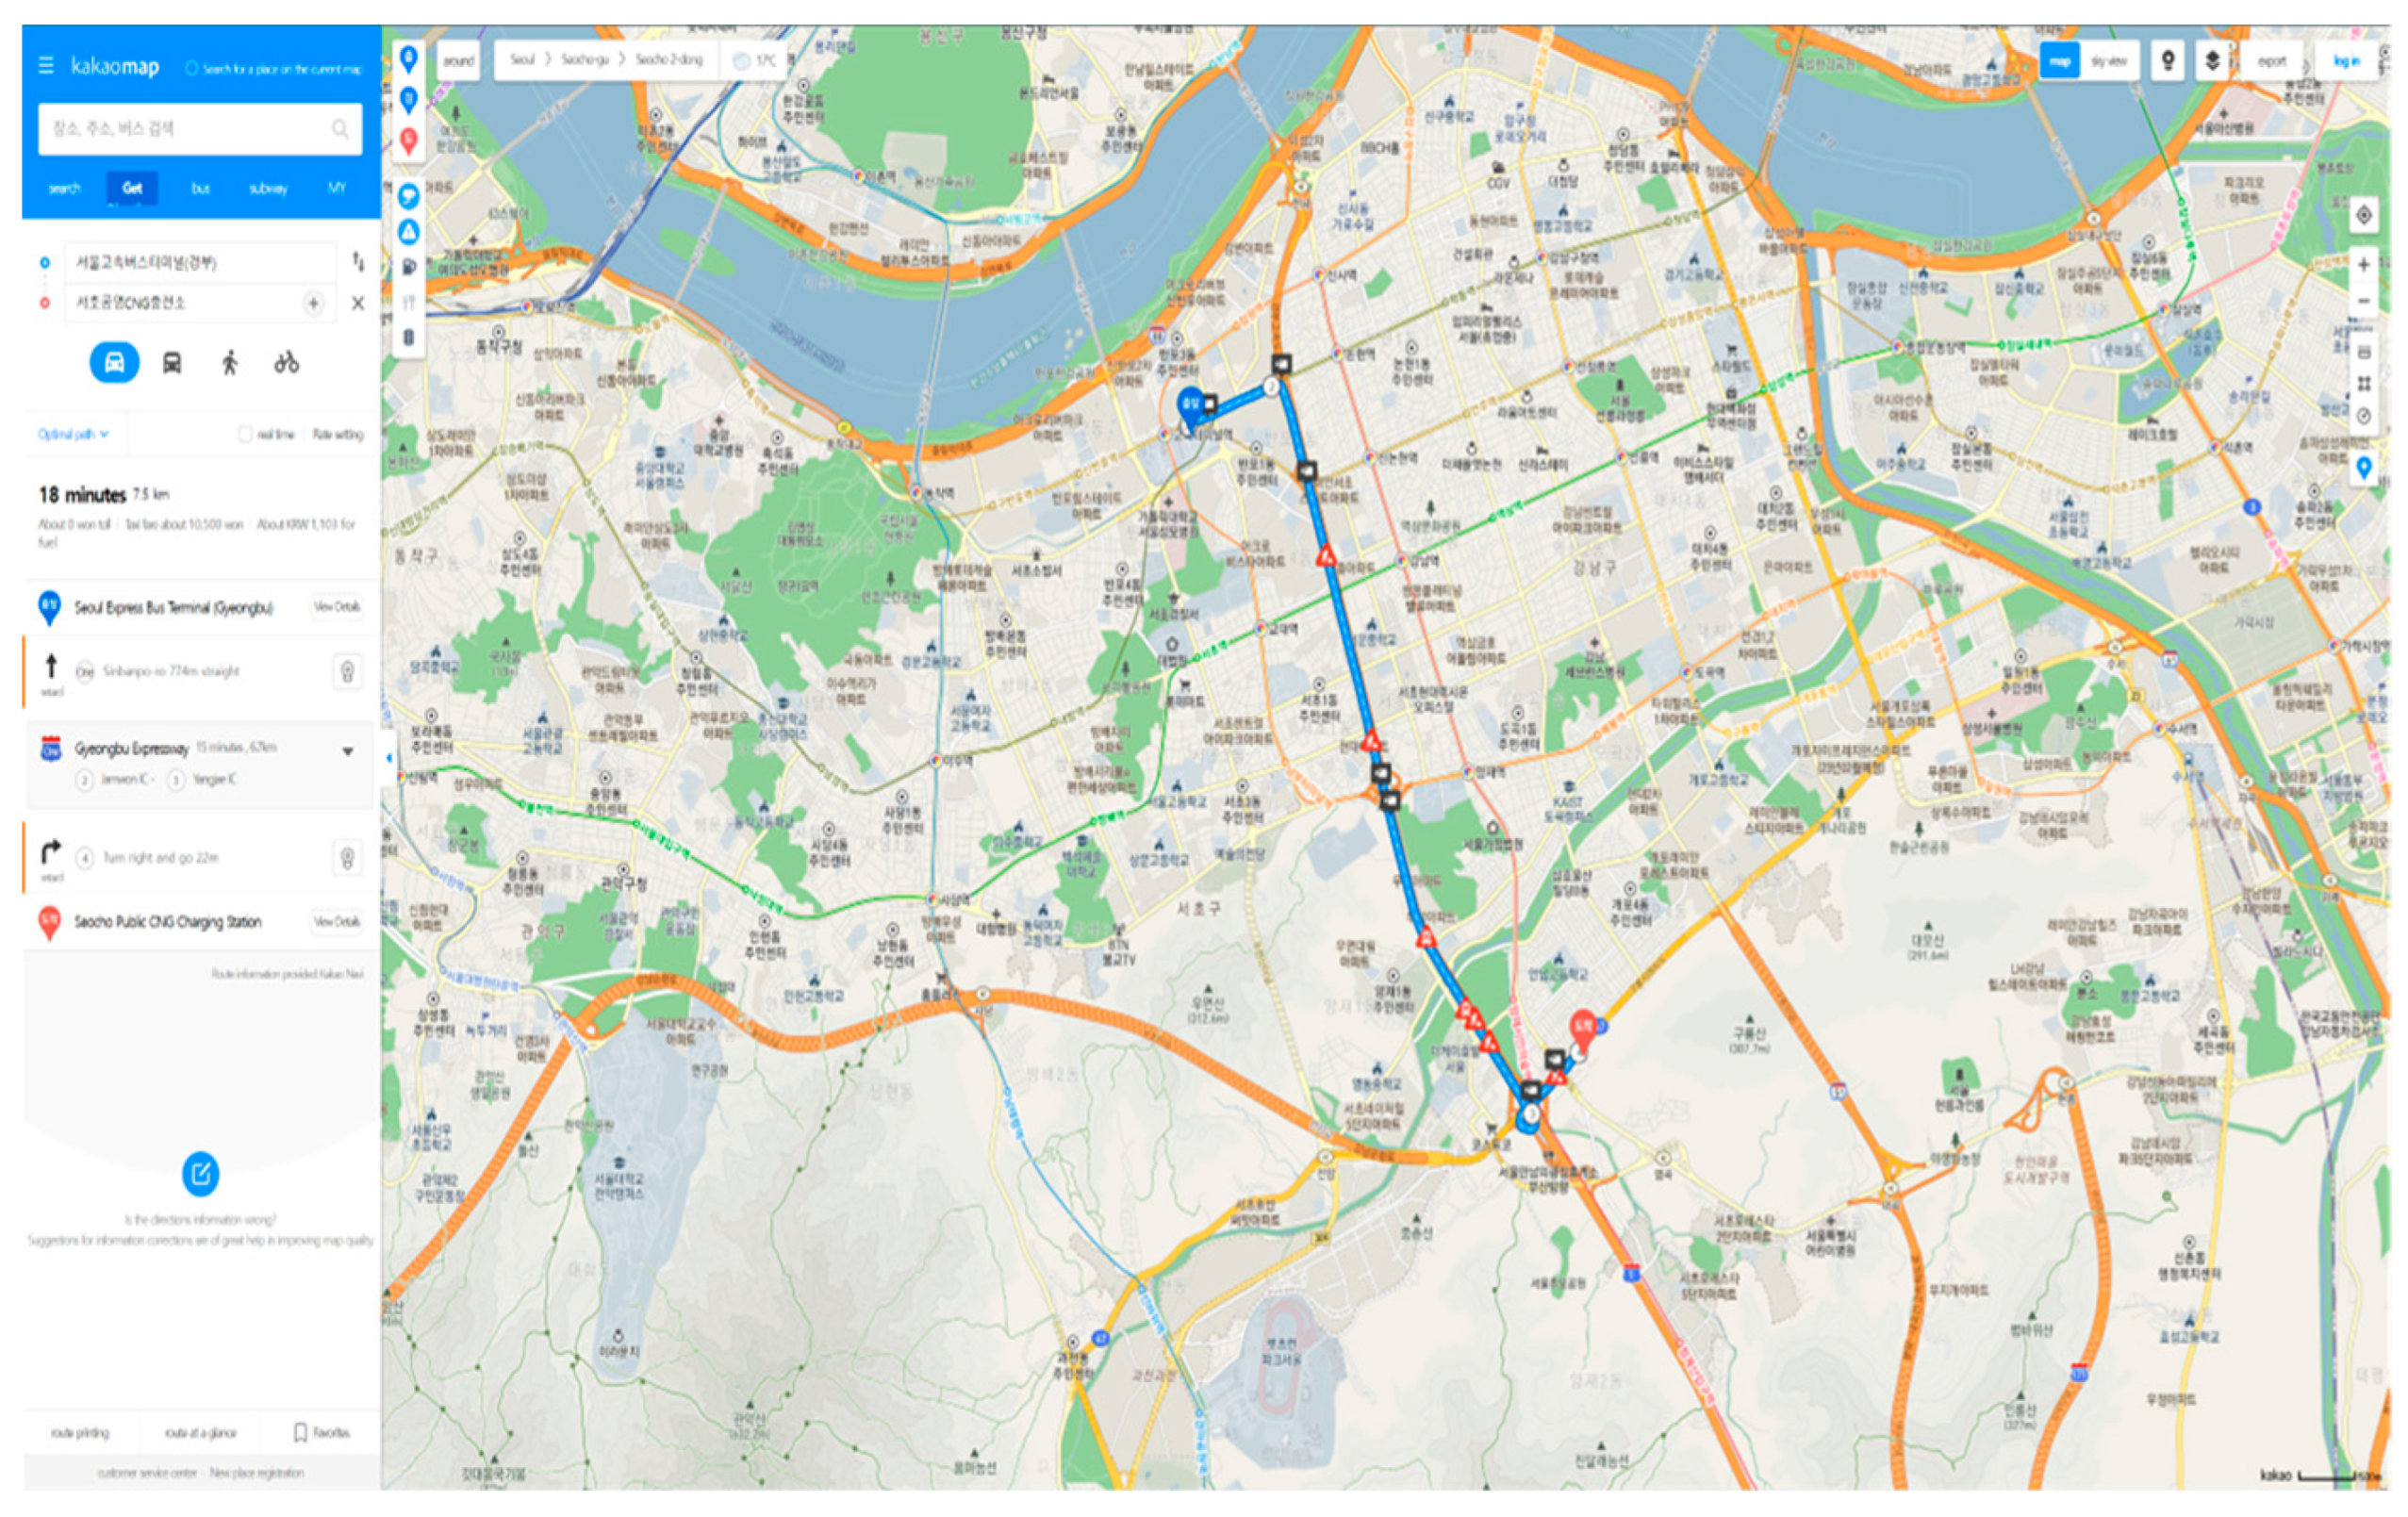
3.3. Analysis of a New HFS Location

In Korea, HFSs are governed by the High Pressure Gas Act, Building Act, and School Health Act, and they are subject to stricter regulations than LPG or CNG fueling stations. As the ordinance of the Seoul Metropolitan Government allows the establishment of HFSs in industrial and green areas, this study investigated the location of new HFSs in Seoul to secure the location of HFSs as much as possible. HFSs were based on sites other than those of current LPG and CNG fueling stations, and potential sites were categorized into five tiers through inquiry and analysis. A cadastral map was used during the preliminary stage. The cadastral map was utilized in the preliminary stage to discriminate between locations suitable for the construction of HFSs in industrial and green regions. Candidate sites with an E-class site size of 1540 m2 or less were selected in the first stage, D-class sites near protective institutions such as hospitals, schools, children’s facilities, and railways in the second stage, and C-class sites where civil engineering work was unfeasible in the third stage. Step 4 identifies locations that can create HFSs using large-scale civil engineering as B, and step 5 identifies classes that can develop HFSs using basic construction as A. The judgment data collected and analyzed using Seoul Open Lab’s QGIS map are shown in Figure 1a,b and the road-view feature of the Kakao map in Figure 2.
Table 3 lists the specific separation distance criteria based on various amenities for the construction of HFSs [32].
The HFS Candidate was calculated using Seoul Open Lab (https://openlab.eseoul.go.kr/, accessed on 8 February 2023) data and Daum map sky view, road view, area, and distance measurements, with the scale set to 1:10 m.
The Seoul Real Estate Information Inquiry System (https://kras.seoul.go.kr/, accessed on 8 February 2023) was used to collect data on the land registry site area, building area, land use plan, and official land price. Based on these data, a rating evaluation based on the special criteria, separation distance between the main protective facilities, and maximum area of 780 m2 after the special application was undertaken.
The travel time between prospective sites for HFSs and regional (by district) sub-centers was used to determine market accessibility, and districts without distinct sub-centers chose the point with the largest floating population. The travel time between the candidate site of the HFS and the non-core or existing HFS was calculated using the “finding path” function on the following map three times between 10 a.m. and 16 p.m. from Monday to Friday. Figure 3 depicts an estimate of the trip time between two locations using the map shown below.
The traffic volume of potential HFS locations was gathered by searching for the location of each site in the 2021 Seoul Metropolitan Government Traffic Survey data, which were released in March 2022, and the map below. The 2022 Seoul Metropolitan Government Traffic Survey Data were searched for the closest traffic aggregation point at each location, the address of the nearest branch was confirmed, and the total daily average traffic volume data for each branch were utilized. The e-country indicator ‘Registration status as of the end of December 2022 (by kind and usage)’ was used to identify vehicle data, and the income level was computed using year-end income data for each year-end settlement city, county, and district in 2022 [31].
A total of 30 candidate sites located in industrial and green areas that met the minimum area and separation distance requirements were selected, as illustrated in Figure 4. It is feasible to establish 38 HFSs in Seoul, which comprises the existing 8 operational HFSs and 30 new HFSs that can be constructed at potential sites.

3.4. AHP Prioritized HFS Construction Analysis

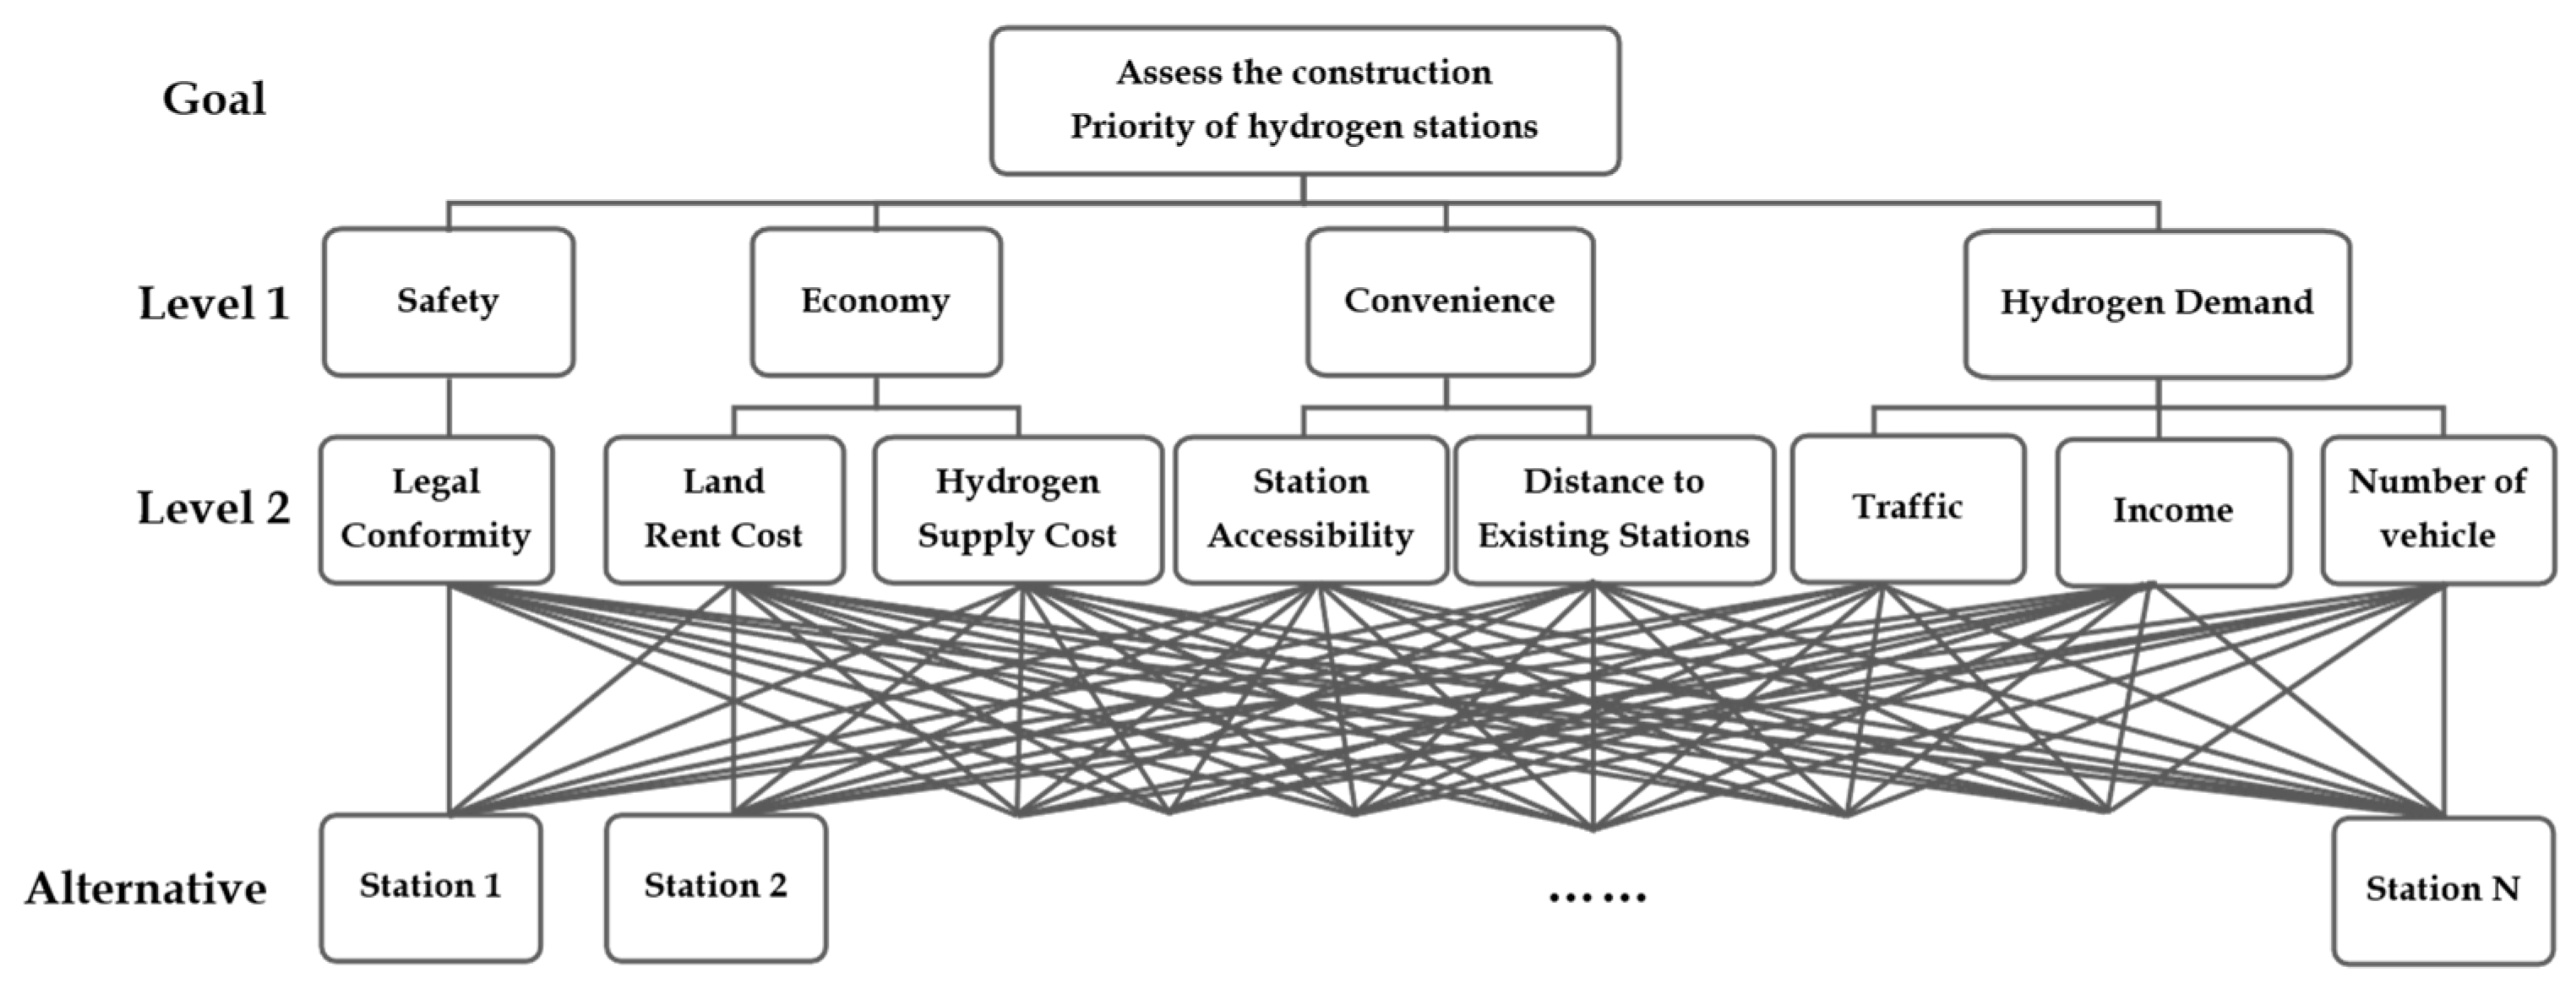
3.4.1. HFS Construction AHP Model

According to this study, the most important considerations in determining the optimal site for HFSs are safety, affordability, convenience, and the magnitude of the market for HCEVs. Compliance with regulations for HFSs serves as a sub-indicator of their safety, while land rent and hydrogen supply costs serve as sub-indicators of their economic viability. The sub-index of convenience of use is market accessibility and the interval between HFSs, and the sub-index of the HCEV market size was set by traffic volume, income level, and number of vehicles. Land rent cost, a sub-indicator of economic viability, was based on the official land price (1000 won/3.3 m2), which was straightforward because it was desirable to utilize real rent for all candidate locations. The hydrogen supply price is the price of byproduct hydrogen delivered from an HFS (unit: won/kg), and when hydrogen is directly generated at an HFS, it is the price of hydrogen production.
Fueling station accessibility, a sub-indicator of convenience, refers to the temporal distance from the center of each region (former) to the fueling station candidate site, whereas the HFS interval refers to the temporal distance from the existing HFS to the candidate site. The daily traffic volume on roadways near candidate locations for HFSs was chosen as a sub-indicator of demand for hydrogen cars, and the monthly income per family in the region (former) to which candidate sites for fueling stations belonged was chosen.
In addition, the number of vehicles was estimated based on the number of vehicles in the area where the candidate fueling station was located, as well as the number of passenger automobiles per family. The AHP model for determining the priority of constructing HFSs is depicted in Figure 5.

3.4.2. AHP Survey

A survey was conducted among specialists in the disciplines of automotives, energy, and hydrogen fuel cells to compute the weight by comparing pairs of evaluation indicators to identify the weight of evaluation indicators connected to the installation of HFSs. A total of 30 people answered the poll, including representatives from research institutions, automakers, universities, and local government officials from the Ministry of the Environment. The weights of the assessment indicators were derived using the findings of a 22-person survey, eliminating the results of an 8-person survey whose replies were inconsistent.
The geometric average value was used to generate the average value for a i j , which indicates the relative significance of two evaluation items i and j through pairwise comparison. Table 4 summarizes the findings of a survey of respondents on Level 1 assessment indicators, such as safety, economy, ease of use, and desire for hydrogen automobiles, while Table 5 summarizes the results of a survey of respondents on Level 2 evaluation indicators.
The evaluation criteria of Level 1 can be determined by computing the average value of each row based on the standardized matrix A, and W is as follows:
W = (w1, w2, w3, w4) = (0.44, 0.20, 0.18, 0.18)
Meanwhile, n = 4 and λ m a x = 4.002, as calculated using Equation (2). Using Equations (3)–(5), CI = 0.0007, RI = 2.64, and CR = 0.0003. The respondents’ judgment of the evaluation criteria of Level 1 was judged to be consistent because the CR was less than or equal to 0.1.
The weight ratios of land rent and hydrogen supply costs using the survey data in Table 6 are 0.31 and 0.69, respectively, while the weight ratios of access to fueling stations and fueling intervals are 0.71 and 0.29, respectively. Furthermore, the weight ratio of cars at the traffic and income levels, which are sub-indicators of hydrogen vehicle demand, were determined to be 0.50, 0.20, and 0.30, respectively, and the respondents’ opinions of the evaluation criteria of Level 2 were all consistent. The total weight of the assessment evaluation criteria in Level 2 may be computed by multiplying the weight of Level 1 by the weight of Level 2. If the total weights for compliance, land rent, hydrogen supply price, fueling station access, fueling station spacing, traffic, income level, and vehicle count are expressed as s1, s2, s3, s4, s5, s6, s7, and s8, respectively, the set of weights S for the evaluation criteria of Level 2 is as follows.
S = (s1, s2, s3, s4, s5, s6, s7, s8) = (0.44, 0.06, 0.14, 0.13, 0.05, 0.09, 0.04, 0.05)

3.4.3. Standardization and Interval Transformation

Table 6 comprises data from important new sites in Seoul that have been examined in accordance with safety legislation by A or B.
Table 7 comprises standardization data data of evaluation of new HFS candidates in Seoul.
Owing to the differences in the assessment indicators, the process of integrating them is required if the evaluation indicators of each option (HFS candidate site) comprise quantitative and qualitative variables (scale). The bipolar approach, which assigns 1 to the minimum and 5 to the maximum, was used to translate the qualitative data into quantitative elements in this study. The process of converting the values of items with distinct measuring units into equivalent scales is known as standardization [29].
This study employed linear transformation to standardize, and the maximum value was used for evaluation indicators with a higher preference, while the lowest value was used for evaluation indicators with a lower preference. Compliance with laws, spacing of existing fueling stations, traffic volume, income level, and number of vehicles show higher preferences among the evaluation indicators for prioritizing the establishment of HFSs, and land rent, hydrogen supply price, and access to fueling stations show lower preferences. The score of each HFS candidate site was computed with 100 points for each evaluation index, and the score of the evaluation index with the higher preference was generated using the reciprocal of the evaluation index.
When x i j and r i j are expressed as the evaluation value and evaluation score of the i-th evaluation element of the fueling station j, the connection between x i j and r i j is as follows:
r i j = x i j / m a x   x i j ,   F o r   m a x i m u m   p r e f e r e n c e ,
r i j = m i n   x i j / x i j ,   F o r   m i n i m u m   p r e f e r e n c e .

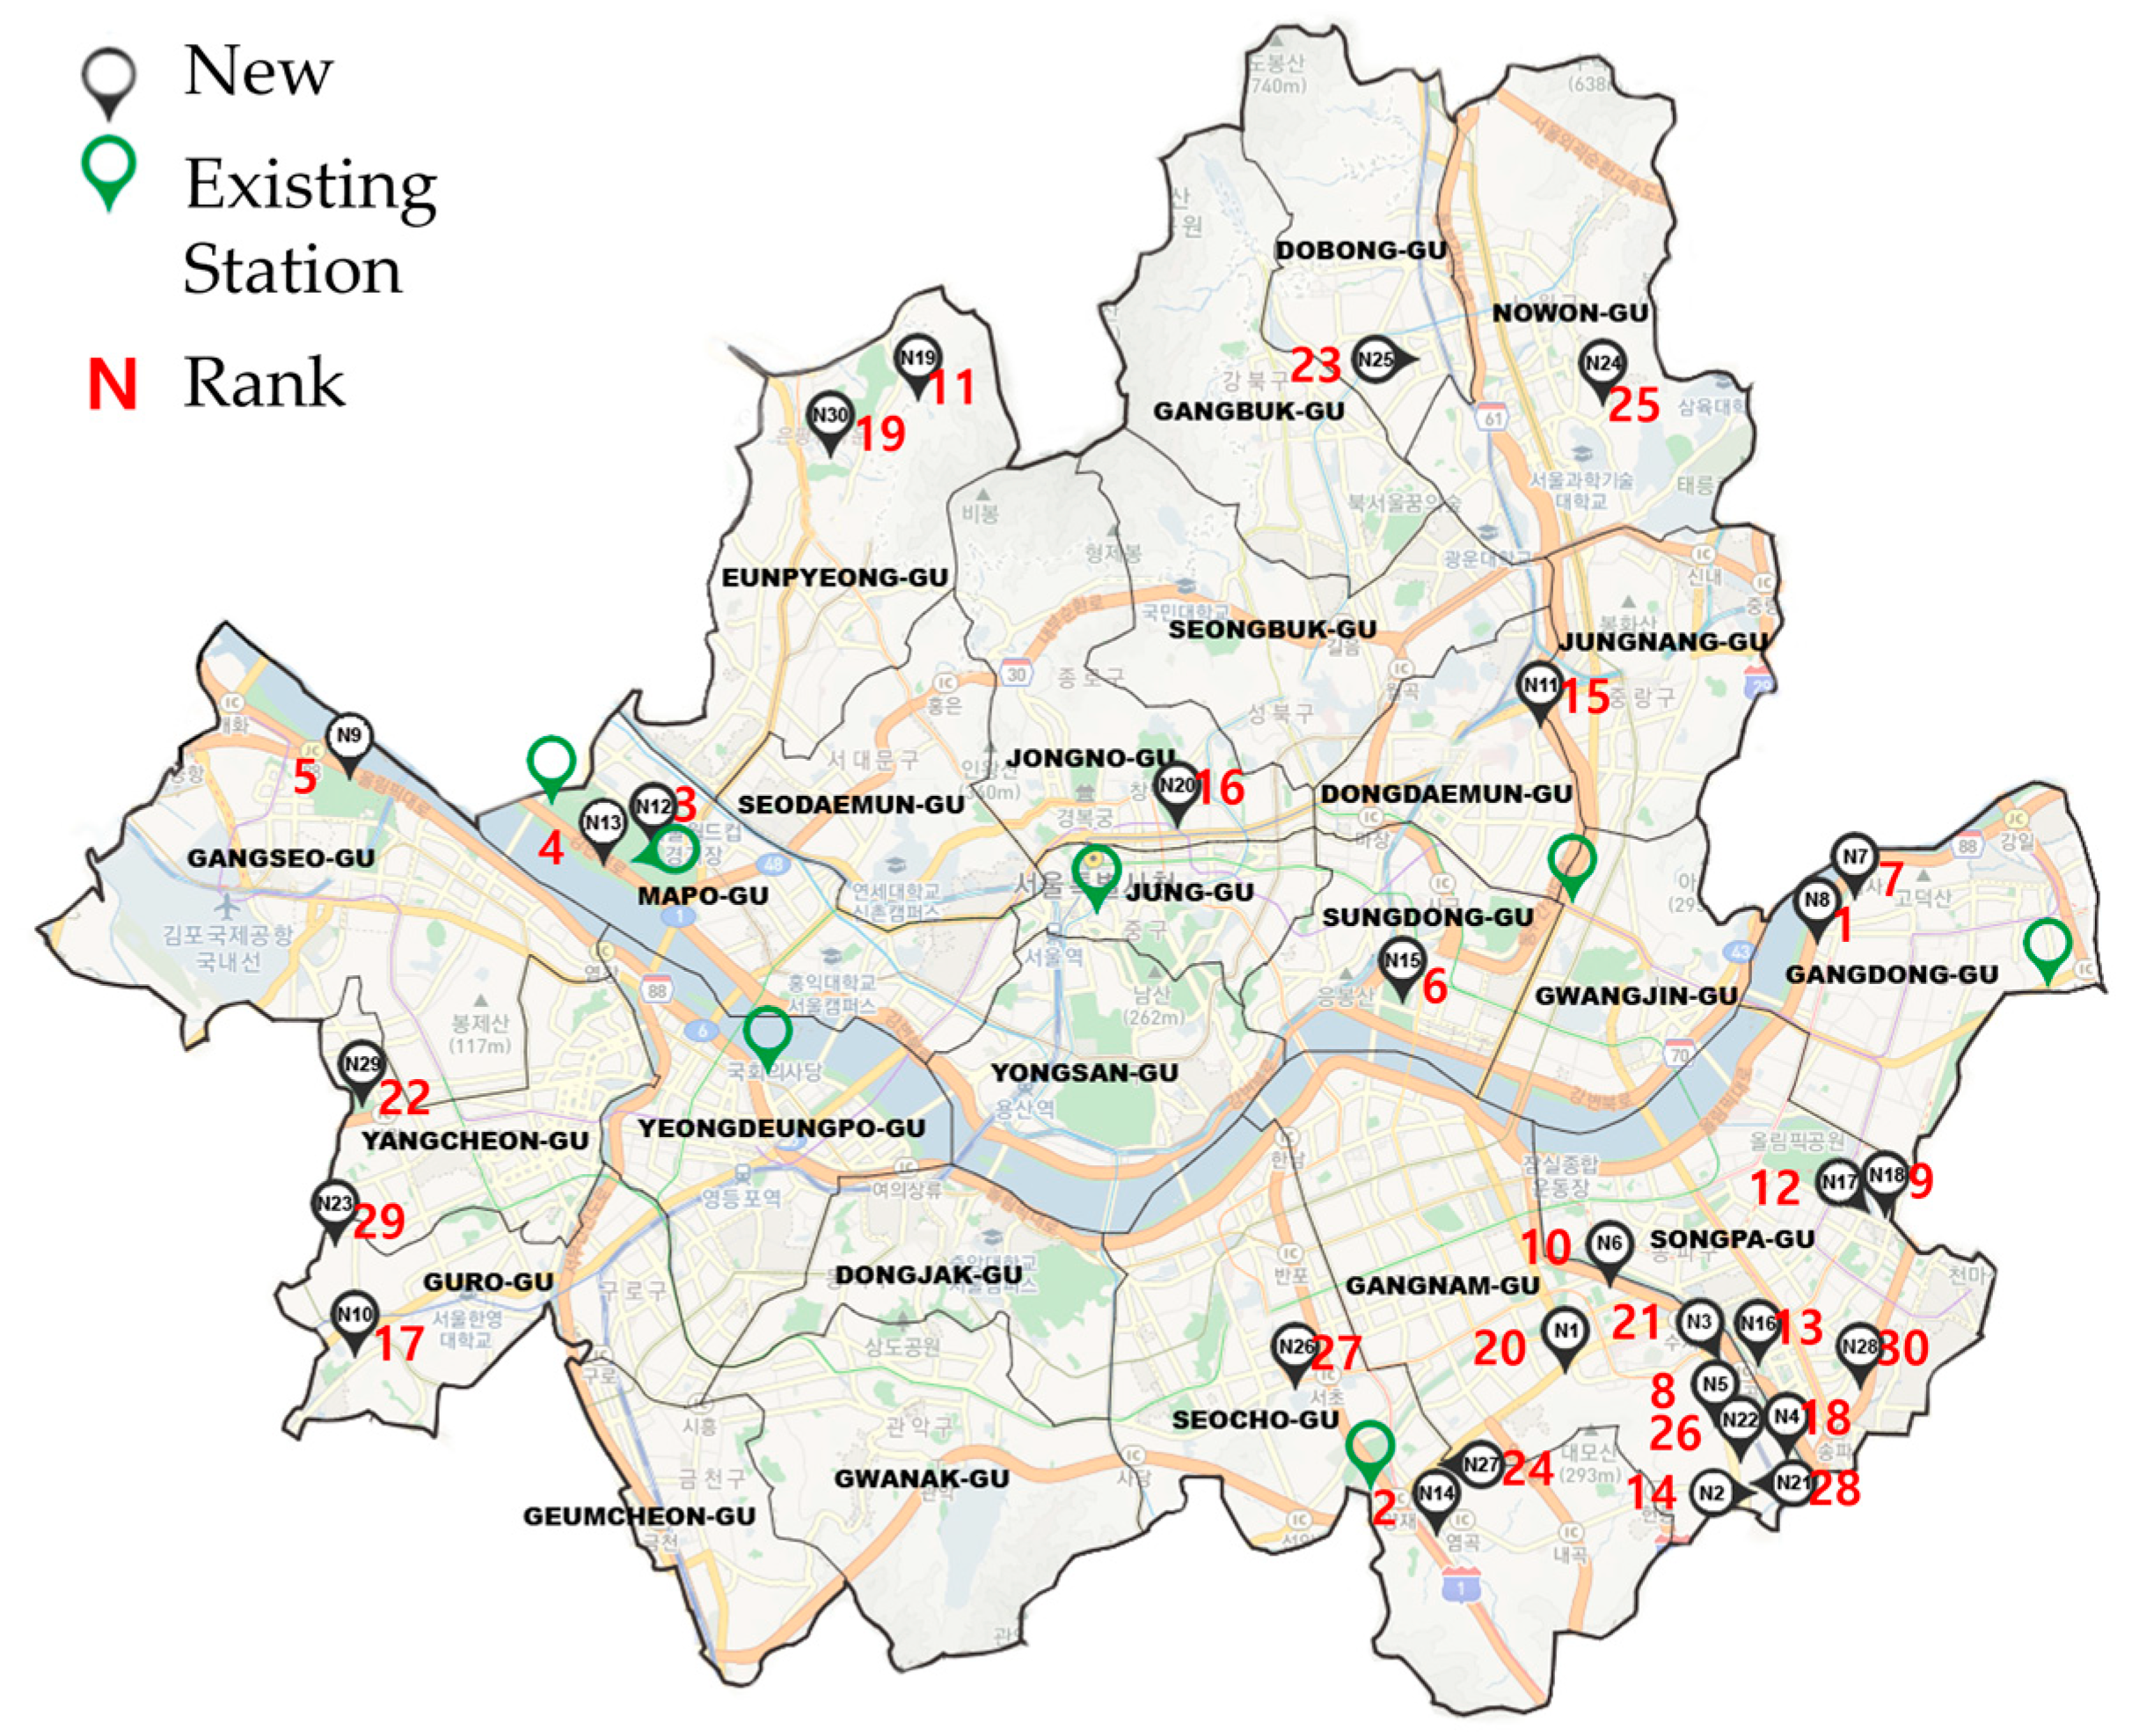
3.4.4. Results of AHP Analysis

The weighted average of the scores, multiplied by the weighted average of each detailed assessment index acquired at Level 2, was used to obtain the total score for each alternative.
Data in Table 8 indicates that seven of the top ten HFS candidates with high total evaluation scores were located south of the Hangang River, while the other three were located north of the Hangang River. This shows that there are relatively few new sites north of the Hangang River where HFSs can be built.
According to the total evaluation score, the priority of establishing candidate sites for HFSs is shown in this study for each candidate site. Here, the circled number denotes the number of candidate locations for HFSs, whereas the red number denotes the importance of establishing locations for HFSs. The priorities and locations of the new sites are shown in Figure 6.

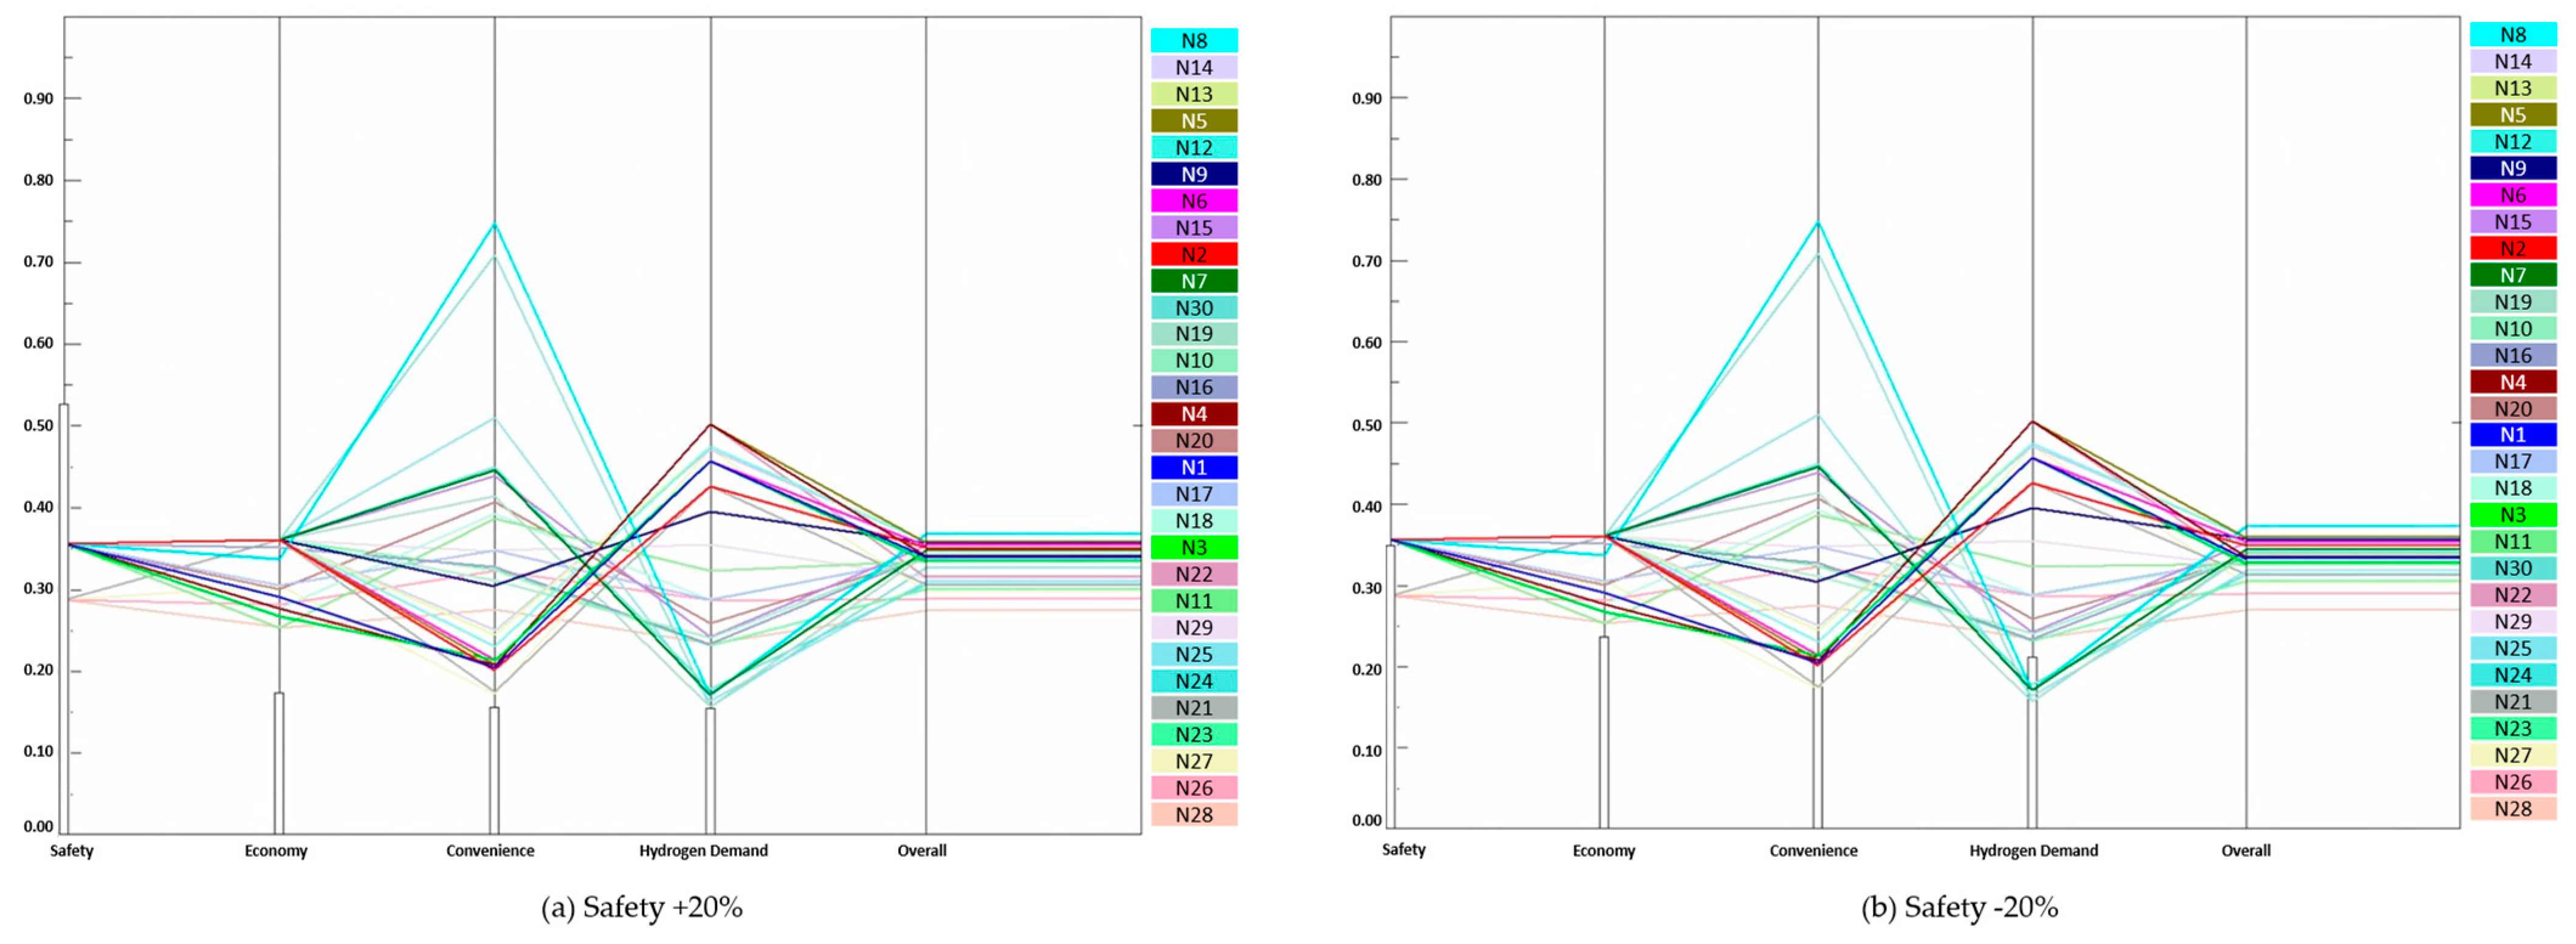
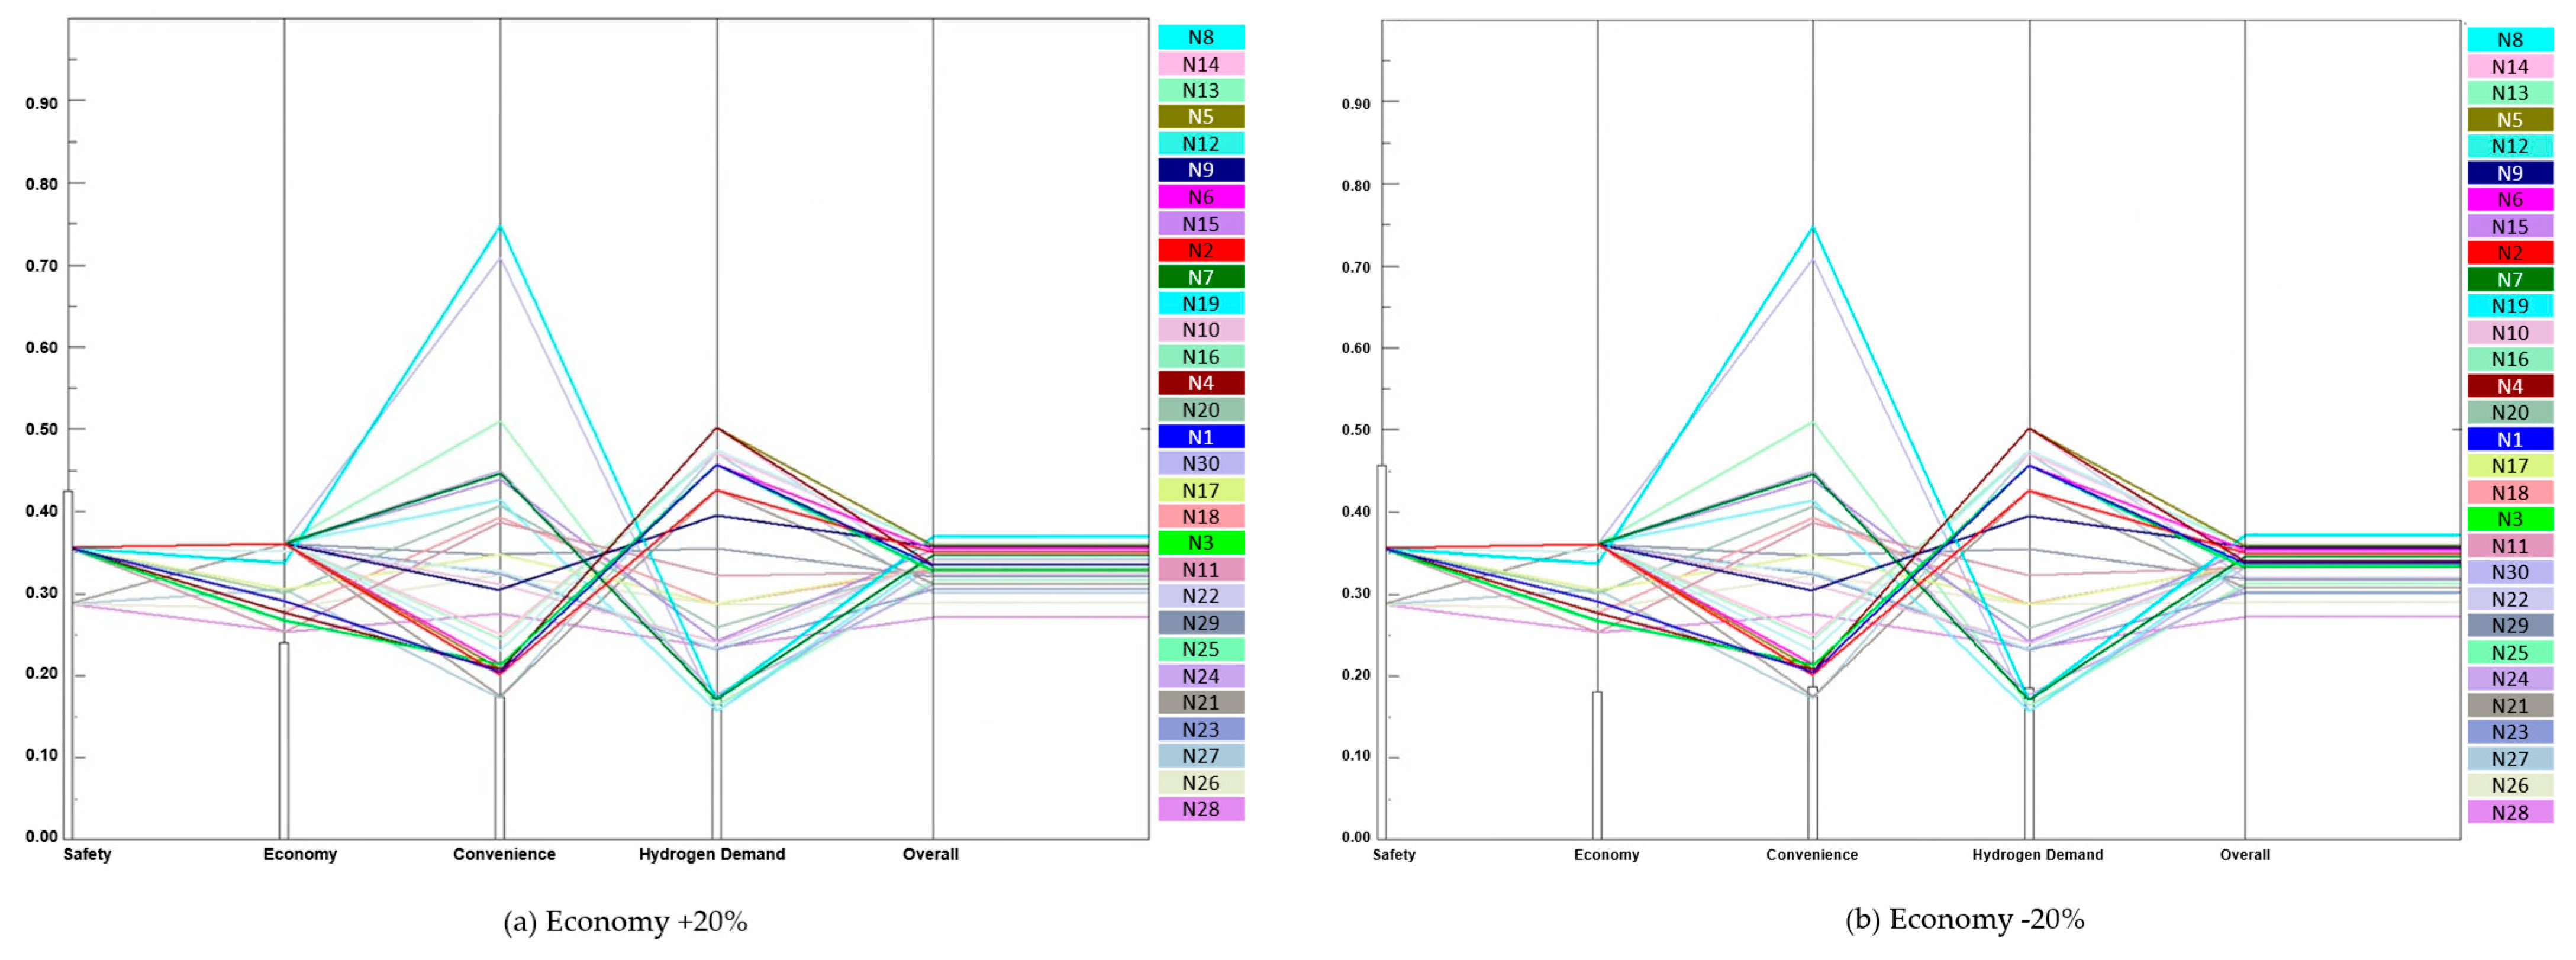
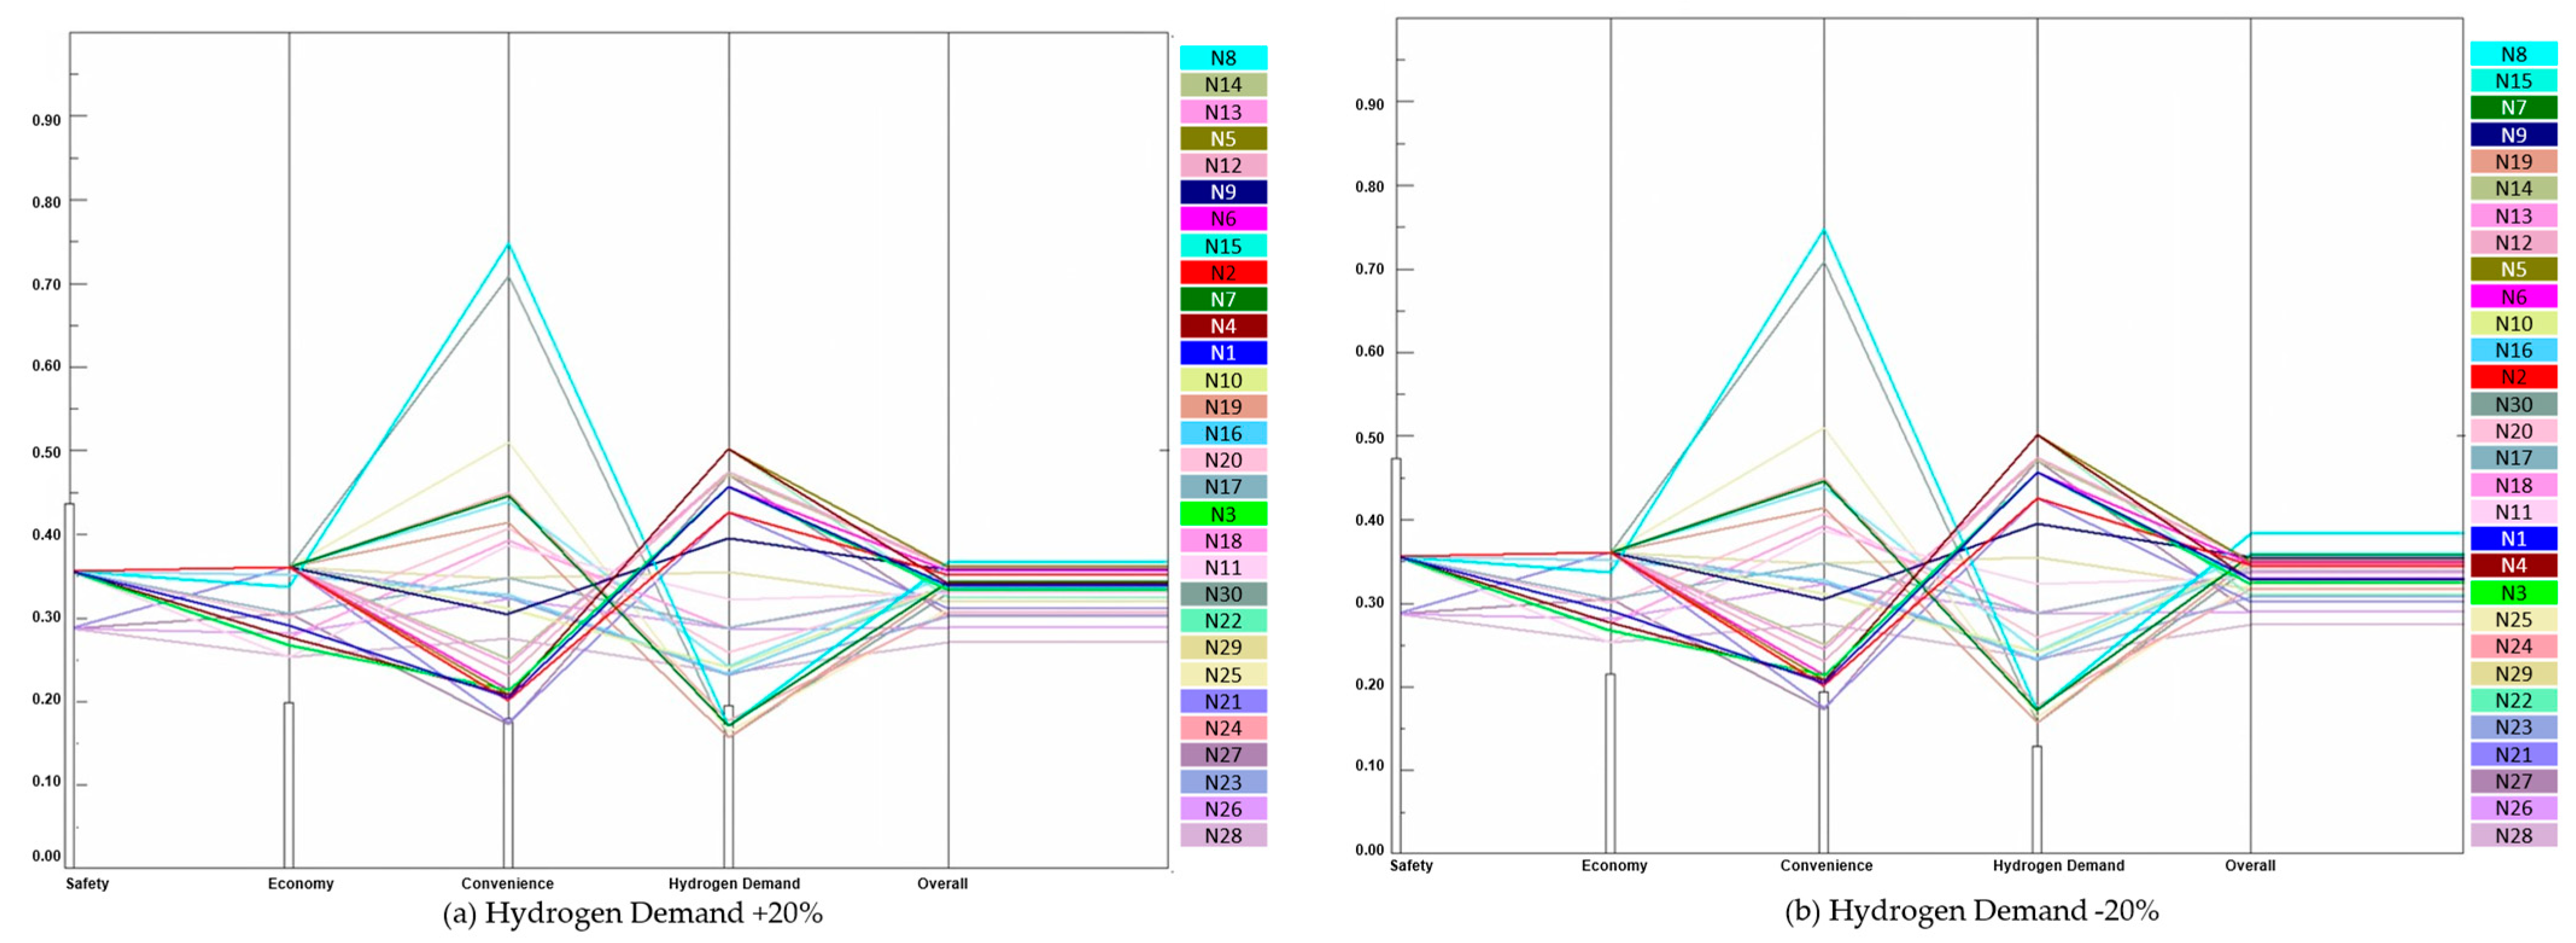
3.4.5. Performing Sensitivity Analysis on AHP Results

The final prioritization of alternatives is heavily reliant on the allocation of weights to the primary criteria. Minor variations in the relative weights of these criteria can cause substantial alterations in the final ranking. As these weights are often based on subjective judgments, it is crucial to assess the stability of the ranking under diverse criteria weights. Sensitivity analysis enables this evaluation by utilizing scenarios that reflect diverse views on the relative importance of the criteria. By modifying the weights of individual criteria, we can observe the resultant changes in the priorities and ranking of the alternatives, providing insights into the stability of the ranking. In cases where the ranking is highly sensitive to small changes in the criteria weights, a careful review of the weights is recommended. Furthermore, incorporating additional decision criteria can improve the discrimination potential of the present set of criteria.
The Expert Choice 11 software was employed to evaluate changes in local priority weights of subjective factors. Sensitivity analysis was conducted using the performance graph analysis method. The performance graph displays the performance of alternatives to changes in all parameters. To analyze the performance sensitivity of the alternative, Figure 7, Figure 8, Figure 9 and Figure 10 were used when the main criteria of Level 1 increased and decreased by 20%.
Table 9 and Table 10 present the changes in the weight of criteria in Level 1 and Level 2 during that time. The analysis reveals that although the ranking changes when there is a 20% increase or decrease, it is due to the same evaluation score and location of candidate sites clustered in Gangnam-gu.
The hydrogen production technology of HFS used in this study is by-product hydrogen, which is provided at the same supply price. However, constructing an on-site charging station [33] that uses methane reforming and water electrolysis production methods [34,35] may result in different hydrogen supply prices for each candidate HFS, which could change the ranking. Therefore, it is advisable to keep track of and manage rankings using updated data.

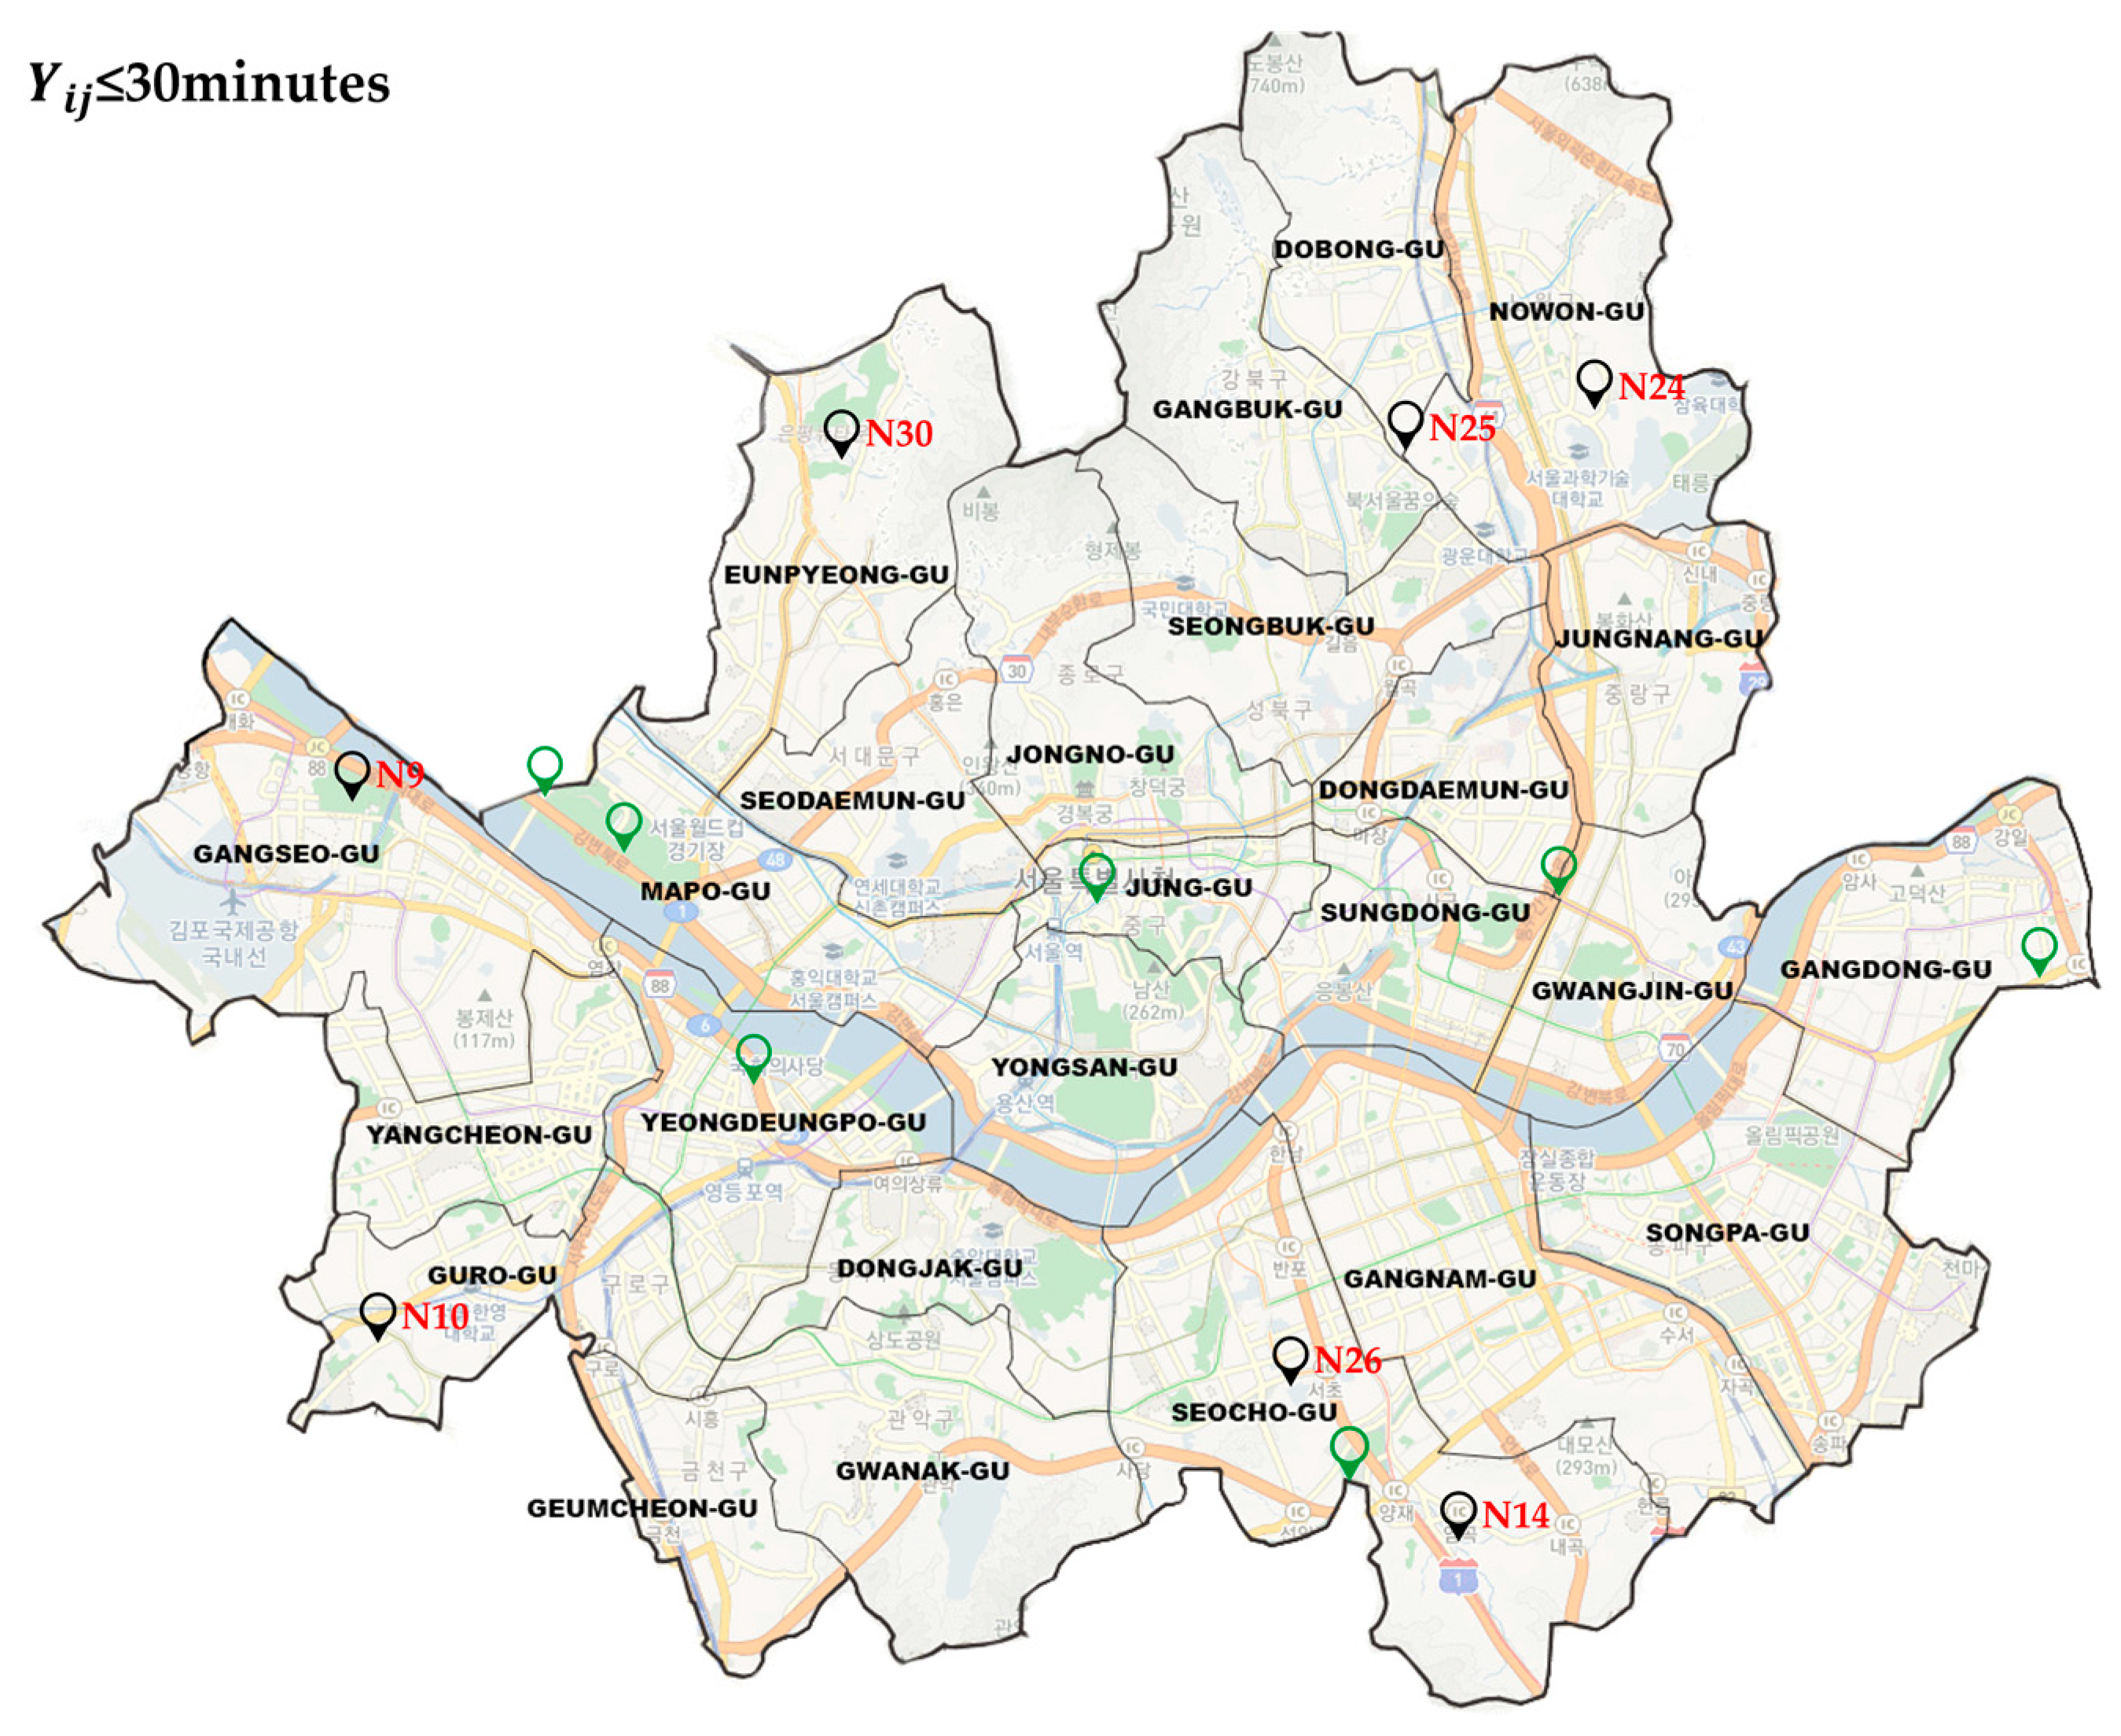
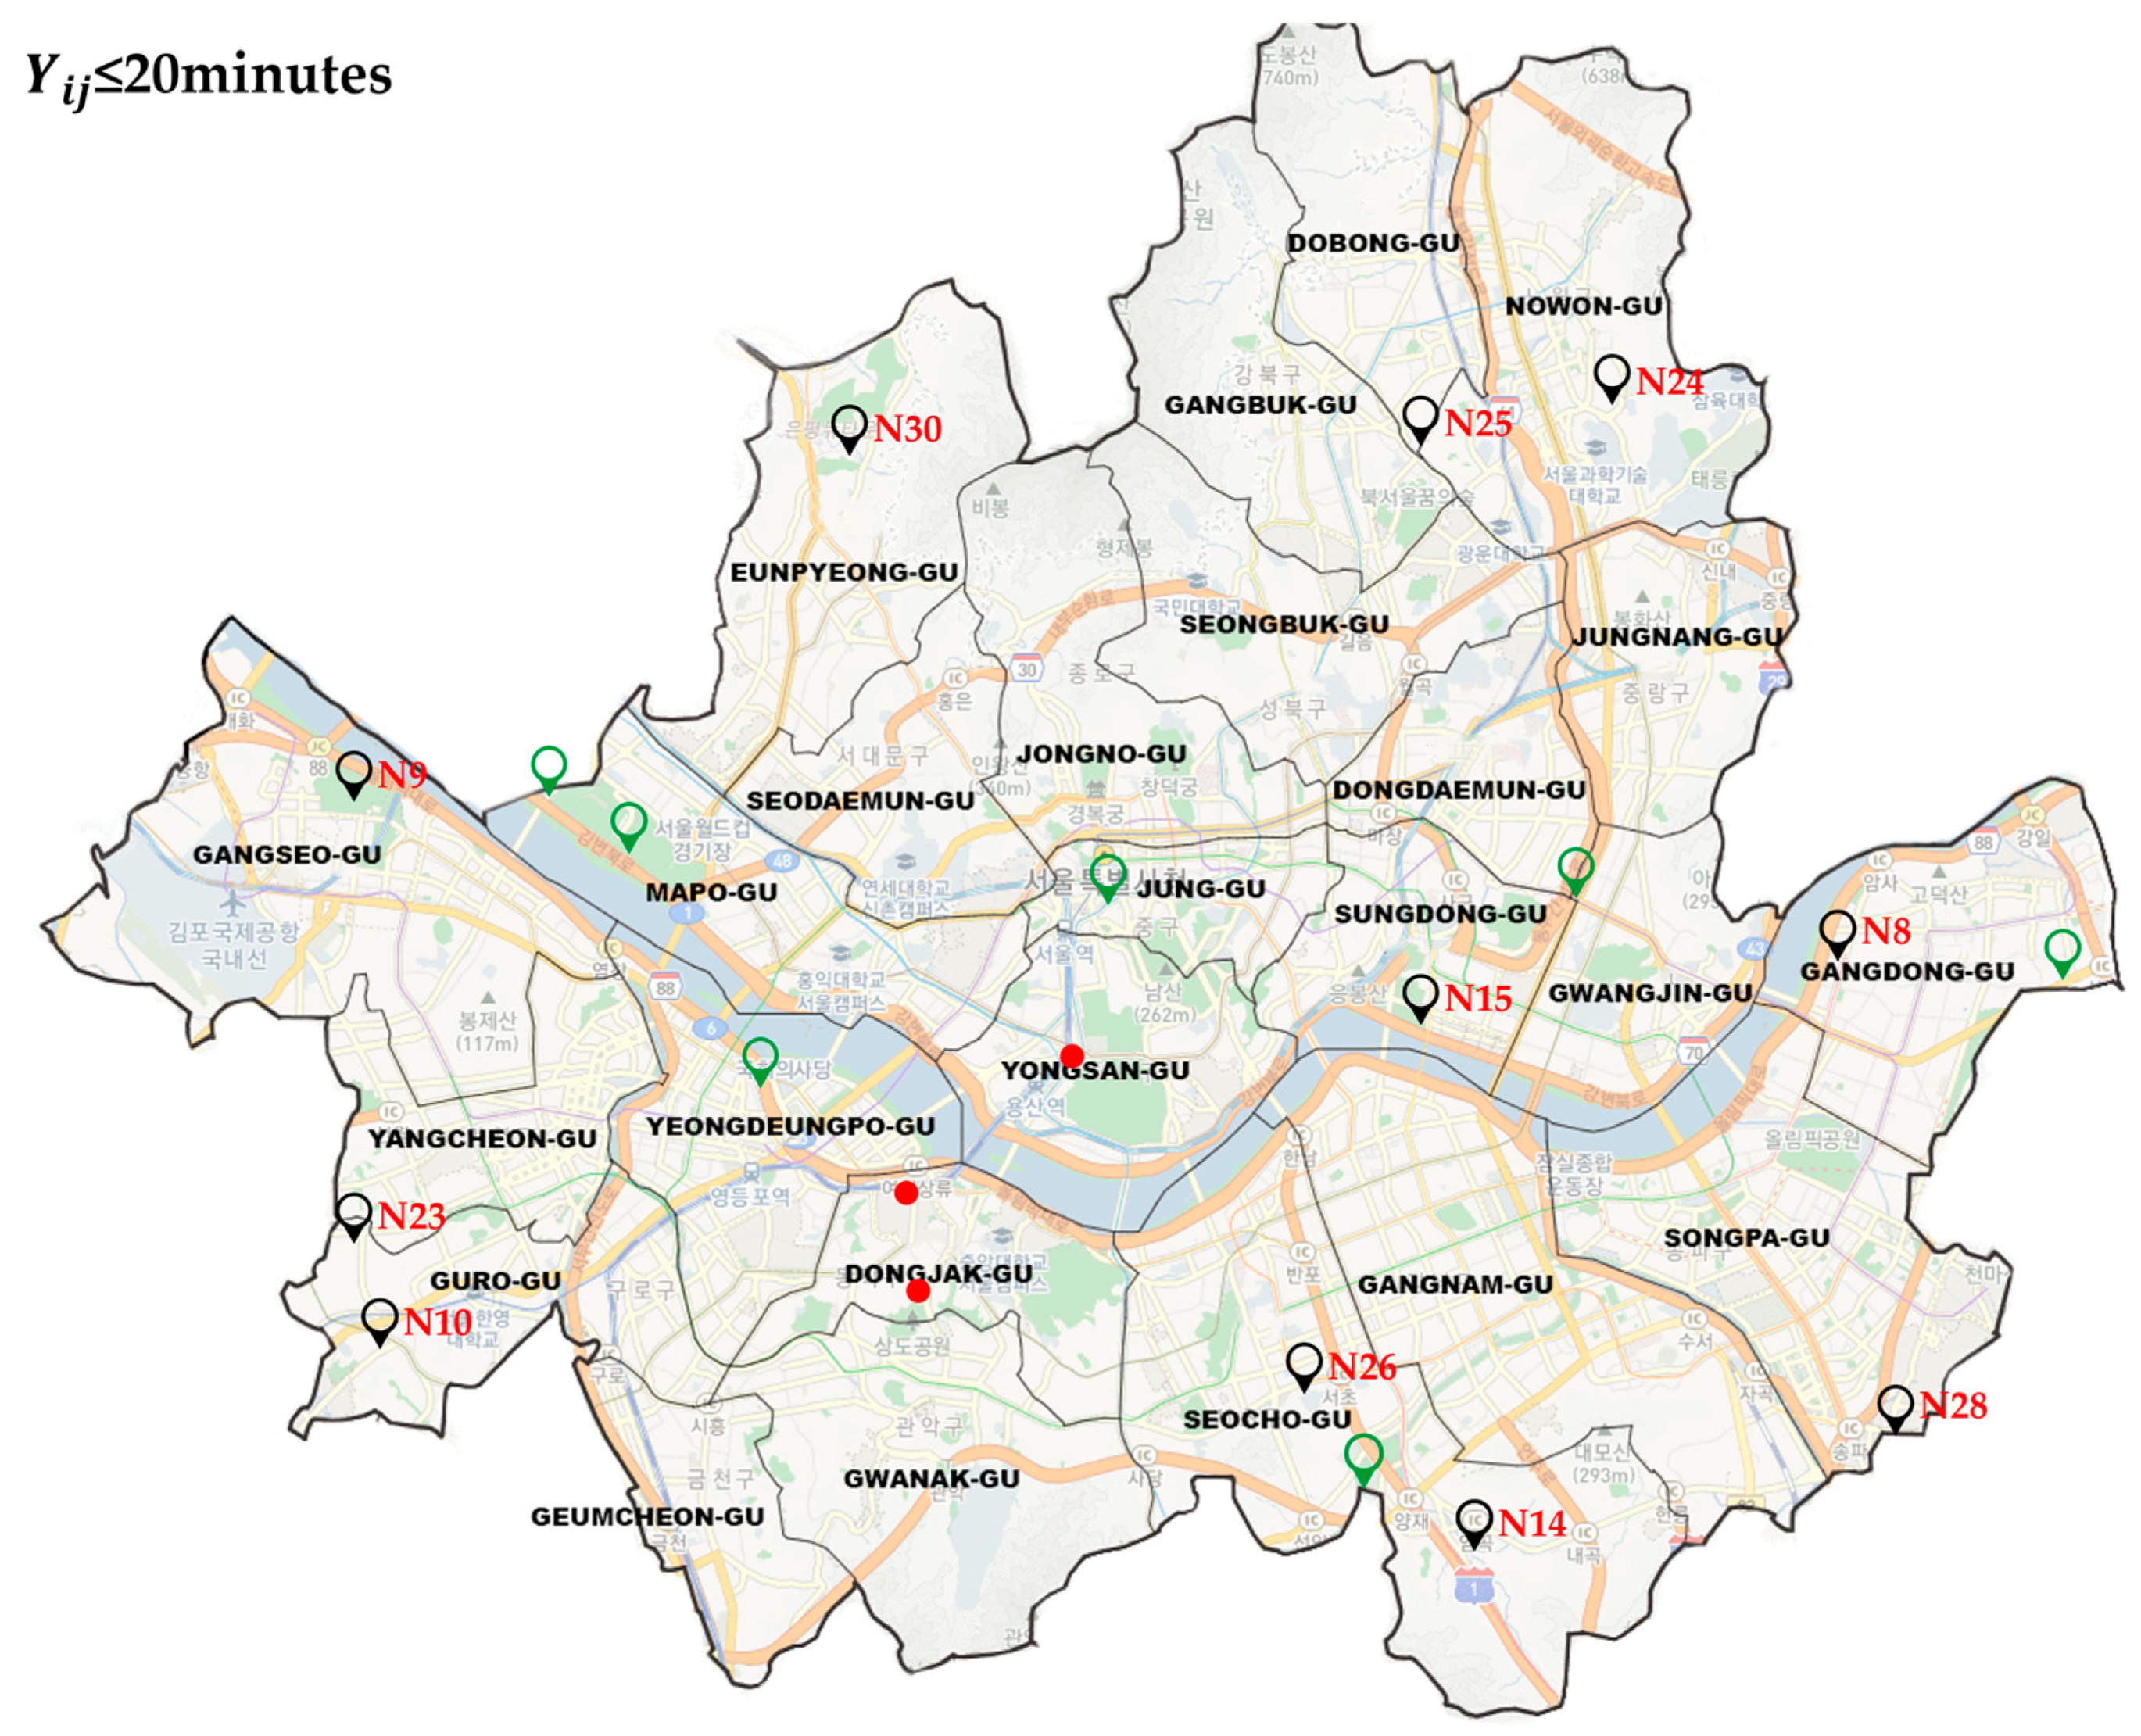
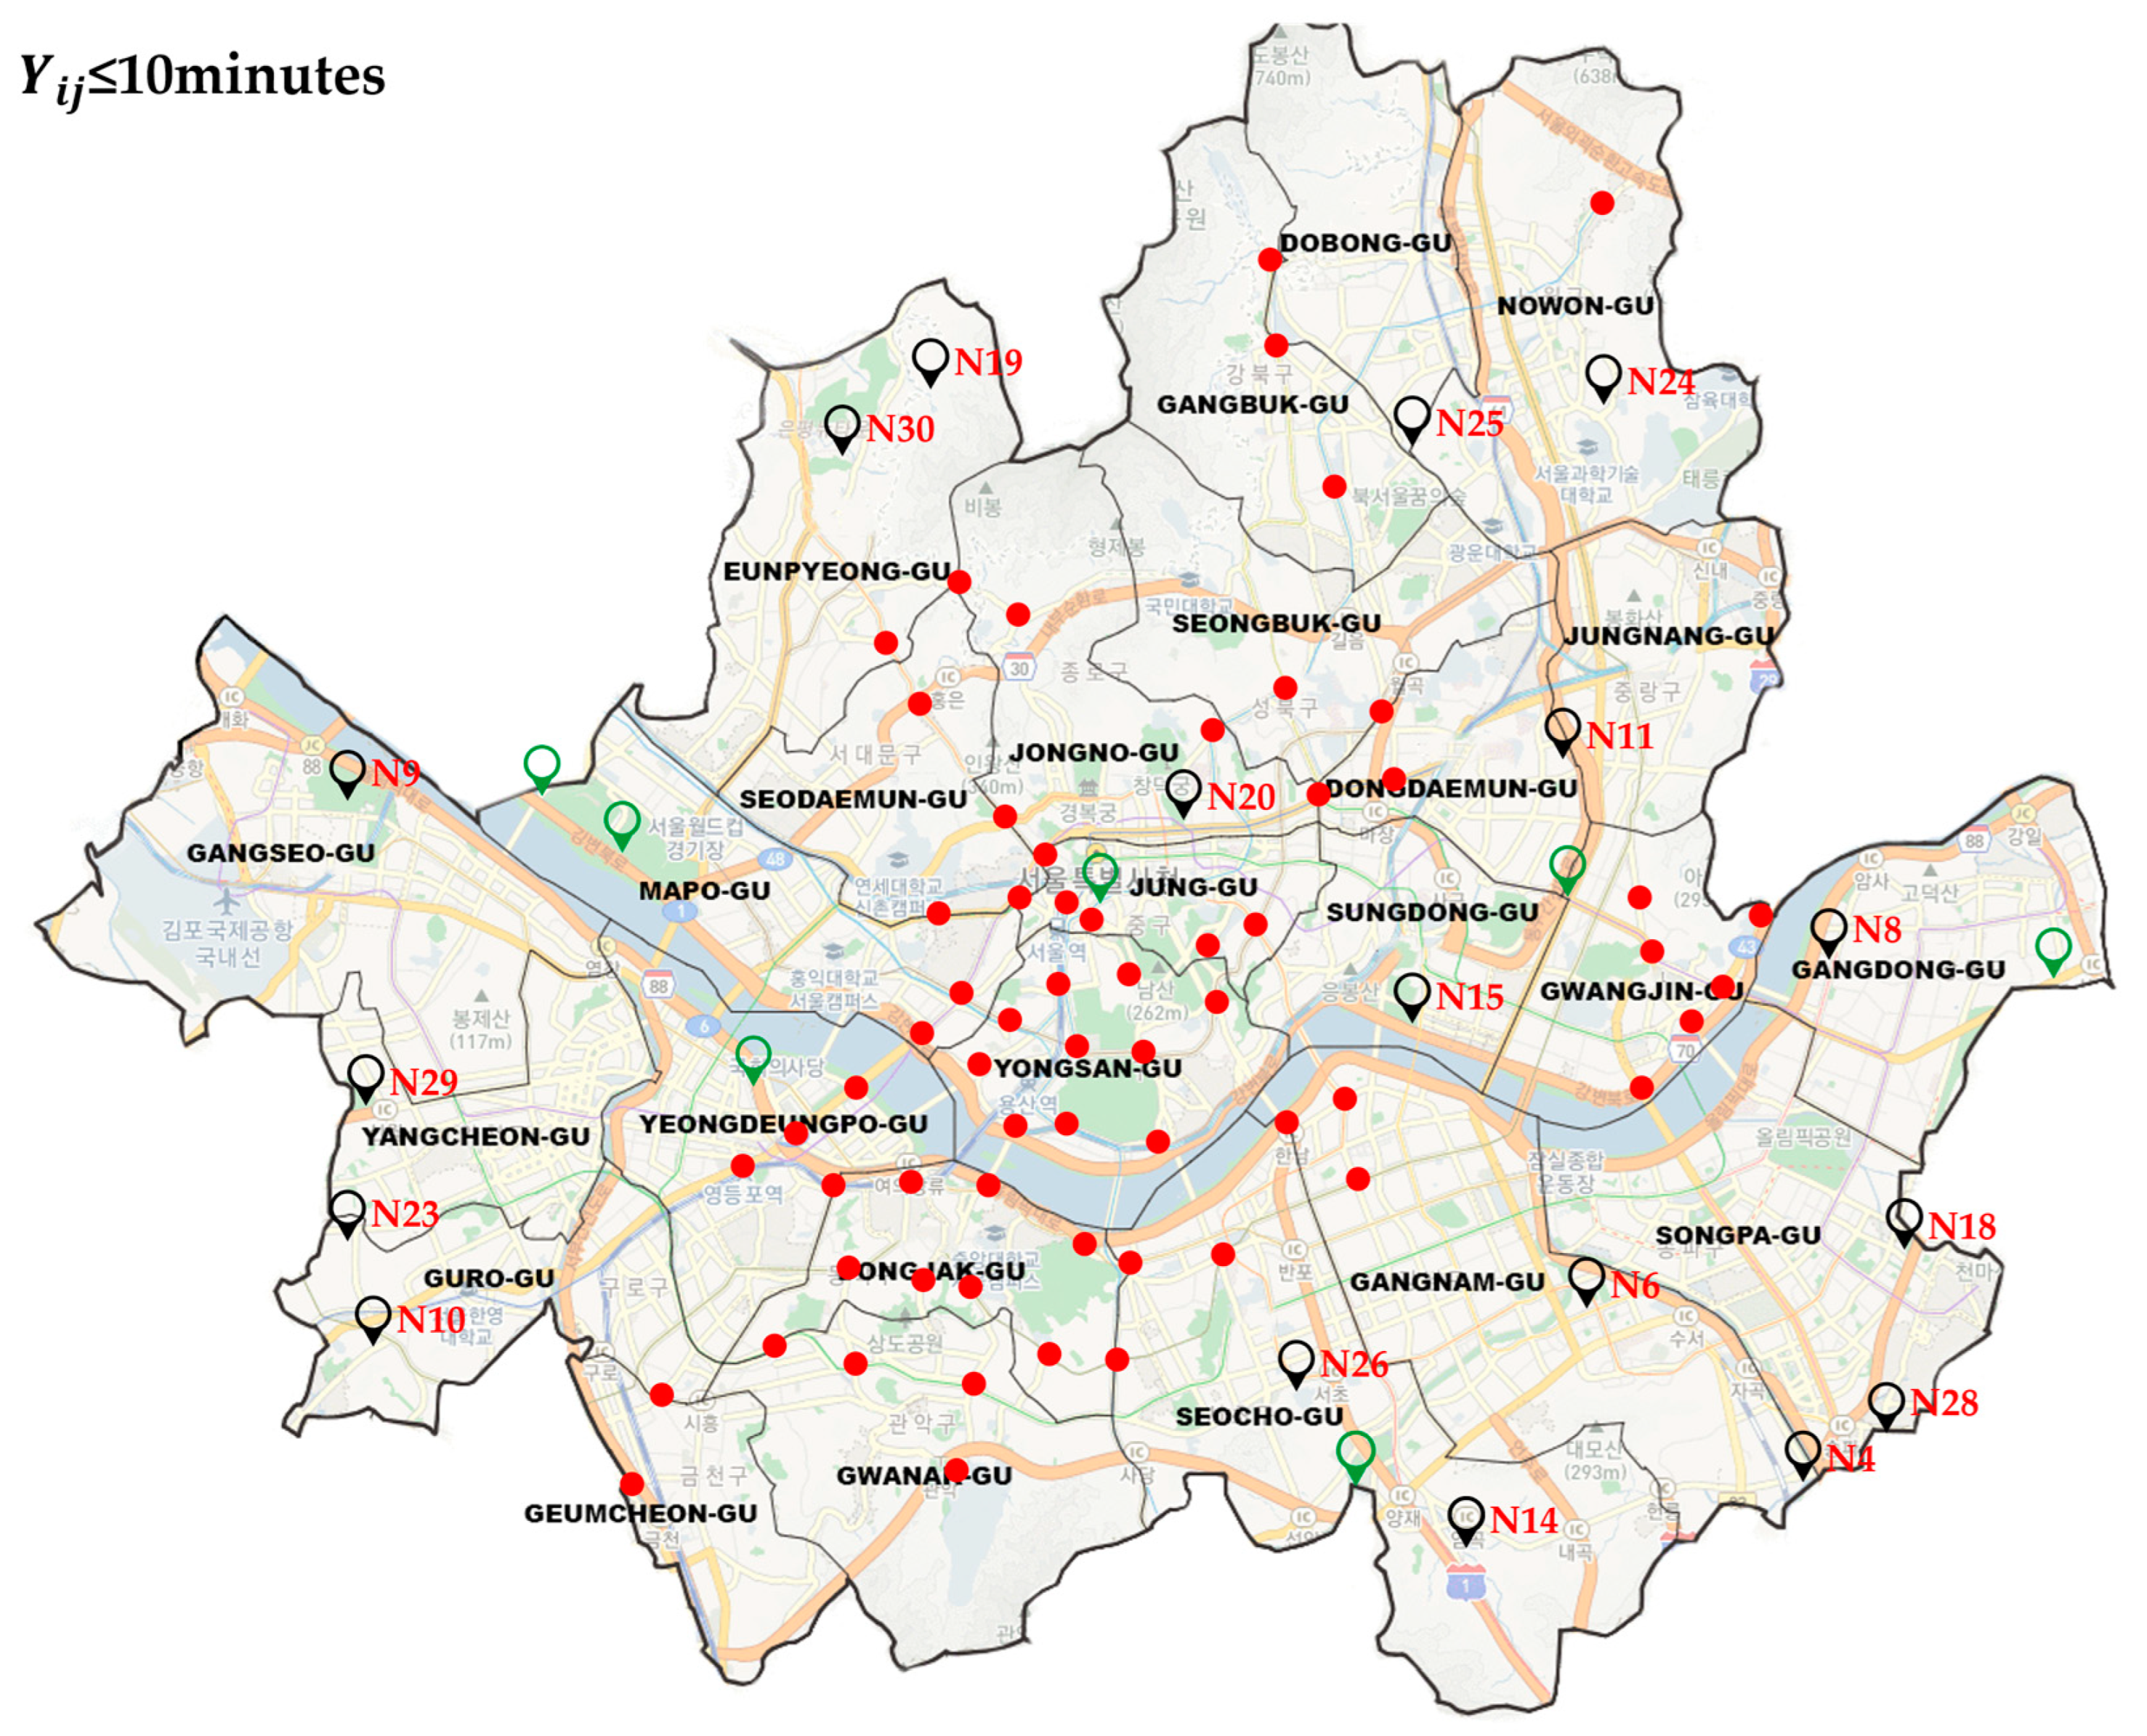
3.5. Determination of Optimal Number and Location of HFS

In this study, 259 intersections on major roads in Seoul were selected to investigate the travel time from intersections to candidate sites for HFSs. The main intersections of Seoul subject to the survey were 133 north of the Hangang River and 126 south of the Hangang River. Figure 11 shows the location of the main intersections of Seoul.
Python was used to derive the optimal solution to the problem of minimizing the total construction cost of the hydrogen station under the constraint that the travel time from the main intersection to the HFS candidate site was within the allowed travel time.
The minimum number of HFS constructions and locations when the allowed travel time from the intersection of major roads in Seoul to the HFS candidate site is 30, 20, and 10 min are shown in Figure 12, Figure 13 and Figure 14, respectively.
Figure 12 shows that when the allowed travel time (t) is within 30 min, a total of 15 priority locations determined by AHP are required, and seven additional stations need to be built, in addition to the eight existing stations.
Figure 13 shows that when the allowed travel time (t) is within 20 min, a total of 19 priority locations determined by AHP are required, and 11 additional stations need to be built in addition to the eight existing stations.
Figure 14 shows that when the allowed travel time (t) is within 10 min, a total of 26 priority locations determined by AHP are required, and 18 additional stations need to be built in addition to the eight existing stations.
The points marked with red dots on the map indicate that no nearby HFS candidates can be reached within 10 min of the allowed travel time.

4. Conclusions

HFSs are considered essential for the future of the hydrogen economy, particularly in the transport sector. The principal aim of this study was to determine the priority of constructing an HFS using the stratified analysis method, a multi-standard decision-making technique, while comprehensively considering crucial evaluation indicators such as safety, economy, convenience, and demand for HCEVs. To establish an HFS network that can be charged within 30 min with minimal construction costs, a model was proposed to determine the optimal location and number of HFSs under constraints that meet the travel time from the intersection of major roads in Seoul to the candidate site.
The study showed that compliance with legal safety is the most significant factor in the construction of HFSs. This is because HFSs cannot be built near collective facilities or locations with large floating populations because of the risk of explosion. Furthermore, the hydrogen supply cost, a sub-criteria of the Convenience Criteria, is currently the same, and despite its high weight, we passed the sensitivity analysis. When constructing an on-site charging station that can produce and supply at the same time, the hydrogen supply price changes depending on the supplier. Thus, the priority may change when the market expands in the future. Furthermore, if a HFS is constructed based on the distance priority from the existing HFS, the traffic flow information between the branch and the existing HFSs must be updated.
In the future, it is necessary to apply and implement these techniques nationwide by referring to the research results obtained in Seoul. Considering that some regions may not have data on the detailed indicators used in this study, it is vital to select detailed indicators suitable for each area. The nationwide development plan for hydrogen charging stations should prioritize selecting strategic sales areas for HFSs, and areas where the number of people or HCEVs is expected to be low should be established later.
This study is important because it provides fundamental data necessary to evaluate the economic feasibility of investing in hydrogen infrastructure in the initial stages of investment in the hydrogen economy. Therefore, it is desirable to establish a systematic hydrogen charging station construction plan by conducting an investment analysis of the nationwide HFS construction plan in connection with the nationwide sales strategy of HCEVs.

Author Contributions

Conceptualization: K.R.K. and J.H.C.; Data curation: K.R.K.; Formal analysis: K.R.K.; Methodology: K.R.K. and J.H.C.; Writing—original draft: K.R.K.; Project administration: J.H.C.; Writing-review and editing: K.R.K. and J.H.C. All authors have read and agreed to the published version of the manuscript.

Funding

This research received no external funding.

Institutional Review Board Statement

Not applicable.

Informed Consent Statement

Not applicable.

Data Availability Statement

Not applicable.

Conflicts of Interest

The authors declare no conflict of interest.

References

  1. Zhang, W.; Xu, Y.; Jiang, L.; Streets, D.G.; Wang, C. Direct and spillover effects of new-type urbanization on CO2 emissions from central heating sector and EKC analyses: Evidence from 144 cities in China. Resour. Conserv. Recycl. 2023, 192, 106913. [Google Scholar] [CrossRef]
  2. Zhang, W.; Xu, Y.; Wang, C.; Streets, D.G. Assessment of the driving factors of CO2 mitigation costs of household biogas systems in China: A LMDI decomposition with cost analysis model. Renew. Energy 2022, 181, 978–989. [Google Scholar] [CrossRef]
  3. Xu, Y.; Zhang, W.; Huo, T.; Streets, D.G.; Wang, C. Investigating the spatio-temporal influences of urbanization and other socioeconomic factors on city-level industrial NOx emissions: A case study in China. Environ. Impact Assess. Rev. 2023, 99, 106998. [Google Scholar] [CrossRef]
  4. Gim, B.; Boo, K.J.; Cho, S.M. A transportation model approach for constructing the cost effective central hydrogen supply system in Korea. Int. J. Hydrog. Energy 2012, 37, 1162–1172. [Google Scholar] [CrossRef]
  5. Boo, K.J.; Cho, S.M.; Gim, B. A Study on the Foundation for the Realization of the Future Hydrogen Economy; Korea Energy Economics Institute: DaeJeon City, Republic of Korea, 2009; Volume 9–13, pp. 1–235. [Google Scholar]
  6. Lawrence, K.D.; Lawton, W.H. Application of Diffusion Model: Some Empirical Results in New Product Forecasting; Wind, Y., Mahajan, V., Cardozo, R., Eds.; Lexington Books: Lexington, MA, USA, 1981. [Google Scholar]
  7. Lee, T.G. A Construction Plan of Hydrogen Fueling Stations on Intra-City Using Geographic Information System. Master’s Thesis, Dankook University, Yongin City, Republic of Korea, 2012. [Google Scholar]
  8. Park, J.; Huh, Y.; Kang, S. A Study on Site to Build Hydrogen Multi Energy Filling Station in Domestic LPG Station. Trans. Korean Hydrog. New Energy Soc. 2017, 28, 642–648. [Google Scholar] [CrossRef]
  9. Melendez, M.; Milbrandt, A. Analysis of the Hydrogen Infrastructure Needed to Enable Commercial Introduction of Hydrogen-Fueled Vehicles; National Renewable Energy Lab.: Golden, CO, USA, 2005.
  10. Stephens-Romero, S.D.; Brown, T.M.; Kang, J.E.; Recker, W.W.; Samuelsen, G.S. Systematic planning to optimize investments in hydrogen infrastructure deployment. Int. J. Hydrog. Energy 2010, 35, 4652–4667. [Google Scholar] [CrossRef] [Green Version]
  11. Greene, D.L.; Ogden, J.M.; Lin, Z. Challenges in the designing, planning and deployment of hydrogen refueling infrastructure for fuel cell electric vehicles. ETransportation 2020, 6, 100086. [Google Scholar] [CrossRef]
  12. Hakimi, S.L. Optimum locations of switching centers and the absolute centers and medians of a graph. Oper. Res. 1964, 12, 450–459. [Google Scholar] [CrossRef]
  13. Garfinkel, R.S.; Nemhauser, G.L. Optimal set covering: A survey. Perspect. Optim. 1972, 1972, 164–183. [Google Scholar]
  14. Church, R.; ReVelle, C. The maximal covering location problem. Papers of the Regional Science Association; Springer: Berlin/Heidelberg, Germany, 1974; Volume 32, pp. 101–118. [Google Scholar]
  15. Lin, R.-H.; Ye, Z.-Z.; Wu, B.-D. A review of hydrogen station location models. Int. J. Hydrog. Energy 2020, 45, 20176–20183. [Google Scholar] [CrossRef]
  16. Hodgson, M.J. A flow-capturing location-allocation model. Geogr. Anal. 1990, 22, 270–279. [Google Scholar] [CrossRef]
  17. Kuby, M.; Lim, S. Location of Alternative-Fuel Stations Using the Flow-Refueling Location Model and Dispersion of Candidate Sites on Arcs. Netw. Spat. Econ. 2007, 7, 129–152. [Google Scholar] [CrossRef]
  18. Upchurch, C.; Kuby, M. Comparing the p-median and flow-refueling models for locating alternative-fuel stations. J. Transp. Geogr. 2010, 18, 750–758. [Google Scholar] [CrossRef]
  19. Kuby, M.; Lim, S. The flow-refueling location problem for alternative-fuel vehicles. Socio-Econ. Plan. Sci. 2005, 39, 125–145. [Google Scholar] [CrossRef]
  20. Capar, I.; Kuby, M. An efficient formulation of the flow refueling location model for alternative-fuel stations. IIE Trans. 2012, 44, 622–636. [Google Scholar] [CrossRef]
  21. Lim, S.; Kuby, M. Heuristic algorithms for siting alternative-fuel stations using the Flow-Refueling Location Model. Eur. J. Oper. Res. 2010, 204, 51–61. [Google Scholar] [CrossRef]
  22. Kim, J.-G.; Kuby, M. The deviation-flow refueling location model for optimizing a network of refueling stations. Int. J. Hydrog. Energy 2012, 37, 5406–5420. [Google Scholar] [CrossRef]
  23. MirHassani, S.A.; Ebrazi, R. A flexible reformulation of the refueling station location problem. Transp. Sci. 2013, 47, 617–628. [Google Scholar] [CrossRef]
  24. Chung, S.H.; Kwon, C. Multi-period planning for electric car charging station locations: A case of Korean Expressways. Eur. J. Oper. Res. 2015, 242, 677–687. [Google Scholar] [CrossRef]
  25. Hosseini, M.; MirHassani, S.A.; Hooshmand, F. Deviation-flow refueling location problem with capacitated facilities: Model and algorithm. Transp. Res. Part D Transp. Environ. 2017, 54, 269–281. [Google Scholar] [CrossRef]
  26. He, J.; Yang, H.; Tang, T.Q.; Huang, H.J. An optimal charging station location model with the consideration of electric vehicle’s driving range. Transp. Res. Part C Emerg. Technol. 2018, 86, 641–654. [Google Scholar] [CrossRef]
  27. Wang, Y.-W.; Wang, C.-R. Locating passenger vehicle refueling stations. Transp. Res. Part E Logist. Transp. Rev. 2010, 46, 791–801. [Google Scholar] [CrossRef]
  28. Saaty, T.L. The Analytic Hierarchy Process; Mcgraw Hill: New York, NY, USA, 1980; Volume 70, pp. 1–287. [Google Scholar]
  29. Saaty, T.L. Priority setting in complex problems. IEEE Trans. Eng. Manag. 1983, 30, 140–155. [Google Scholar] [CrossRef]
  30. Taha, H.A. Operations Research: An Introduction, 9th ed.; Pearson Education India: Noida, India, 2013; Volume 2013, pp. 1–848. [Google Scholar]
  31. Seoul Open Data Square. Available online: https://data.seoul.go.kr/ (accessed on 8 February 2023).
  32. Monthly Hydrogen Economy. Available online: https://www.h2news.kr/news/article_print.html?no=7335 (accessed on 8 February 2023).
  33. Khzouz, M.; Gkanas, E.I.; Shao, J.; Sher, F.; Beherskyi, D.; El-Kharouf, A.; Qubeissi, M. Al Life Cycle Costing Analysis: Tools and Applications for Determining Hydrogen Production Cost for Fuel Cell Vehicle Technology. Energies 2020, 13, 3783. [Google Scholar] [CrossRef]
  34. Al-Shara, N.K.; Sher, F.; Yaqoob, A.; Chen, G.Z. Electrochemical investigation of novel reference electrode Ni/Ni(OH)2 in comparison with silver and platinum inert quasi-reference electrodes for electrolysis in eutectic molten hydroxide. Int. J. Hydrog. Energy 2019, 44, 27224–27236. [Google Scholar] [CrossRef]
  35. Al-Shara, N.K.; Sher, F.; Iqbal, S.Z.; Curnick, O.; Chen, G.Z. Design and optimization of electrochemical cell potential for hydrogen gas production. J. Energy Chem. 2021, 52, 421–427. [Google Scholar] [CrossRef]
Figure 1. (a) Map of special-purpose areas in Seoul (b) Areas wherein regulations permit the construction of HFSs in Seoul.
Processes 11 00831 g001
Figure 2. Function of Kakao Map Road View.
Processes 11 00831 g002
Figure 3. Example of estimating the travel time between two points (candidate point—sub central point in region).
Processes 11 00831 g003
Figure 4. Locations of new HFS candidates and existing stations in Seoul (the points labeled N1 to N30 represent the minimum requirement for safety law satisfaction, denoting a rating of B or A. Compliance with these standards is essential for ensuring the safety and well-being of individuals, preventing accidents, and mitigating potential risks).
Processes 11 00831 g004
Figure 5. AHP Model of the Construction Priority for HFSs.
Processes 11 00831 g005
Figure 6. Ranking of HFS candidates in Seoul by AHP analysis.
Processes 11 00831 g006
Figure 7. Performance sensitivity of HFS candidates rankings when Safety is (a) increased and (b) decreased by 20%.
Processes 11 00831 g007
Figure 8. Performance sensitivity of HFS candidates ranking when Economy is (a) increased and (b) decreased by 20%.
Processes 11 00831 g008
Figure 9. Performance sensitivity of HFS candidates ranking when Convenience is (a) increased and (b) decreased by 20%.
Processes 11 00831 g009
Figure 10. Performance sensitivity of HFS candidates ranking when Hydrogen Demand is (a) increased and (b) decreased by 20%.
Processes 11 00831 g010
Figure 11. Locations of the intersection points on the main streets in Seoul.
Processes 11 00831 g011
Figure 12. Minimum number of Hydrogen stations in Seoul for t = 30.
Processes 11 00831 g012
Figure 13. Minimum number of Hydrogen stations in Seoul for t = 20.
Processes 11 00831 g013
Figure 14. Minimum number of Hydrogen stations in Seoul for t = 10.
Processes 11 00831 g014
Table 1. Saaty’s nine-step pairwise comparison scale.
Descriptive EvaluationQuantification
extreme9 (9:1)
very strong7 (8:2)
strong5 (7:3)
moderate3 (6:4)
equal1 (5:5)
Table 2. Hydrogen Station data of Seoul by regions.
District
(gu)
PopulationHouseholdLand Area (km2)VehiclesPassenger CarEVHCEVAverage Salary Income (Million Won)
Gangnam534,103232,77740247,356226,34312,1761963.55
Gangdong464,037202,16925152,865133,02712942043.27
Gangbuk297,702144,3132475,25263,165514242.2
Gangseo574,638273,69741206,968178,73017771323.15
Gwanak501,226283,62330118,694102,859777632.68
Gwangjin351,252169,2911798,64483,994623472.59
Guro418,418183,65520147,448124,83737991592.86
Geumcheon242,818119,5831391,39874,340561362.84
Nowon508,014217,54035152,518134,851896632.48
Dobong313,989138,3562195,73481,651639262.2
Dongdaemun353,601169,8731499,13083,552659542.82
Dongjak390,432185,77316106,29595,087726923.08
Mapo375,585180,08424121,739105,62010871433.1
Seodaemun319,554145,7971890,13579,213670853.49
Seocho408,451167,74947176,437156,01534972453.73
Seongdong288,234133,30517105,50491,3001461513.04
Seongbuk441,984197,08225122,686107,410926632.77
Songpa664,514284,85334250,031213,37019911893.09
Yangcheon444,010181,18717151,651132,101998862.76
Yeongdeungpo398,085188,83225144,662120,95623881594.29
Yongsan233,284109,8052275,51266,949975633.73
Eunpyeong470,602213,87630134,245117,2439011062.43
Jongno152,21172,5242450,10541,333612724.48
Jung130,78563,1391059,35148,604968384.14
Jungnang390,140187,41319115,74896,362778472.46
Seoul9,667,6694,446,2966053,190,1082,758,91241,69324433.09
Korea51,430,01823,716,980100,43225,556,06620,999,380390,40329,6893.2
Table 3. Minimum Separation Distance for building HFSs.
Types of FacilitiesSeparation DistanceNotion
Equipment inspection1 m-
Safe explosion4.5 m-
School’s borders200 m-
Residential facilities25 mApartments, villas, houses under 19 households.
Playgrounds, Hospital, Daycare centers, and kindergartens50 m-
railway30 mSubway entrance, including outside of the station building
Table 4. Pairwise comparison results on the Level 1 evaluation criteria (i:j is a pairwise comparison between criteria.).
NumberSafety:
Economy
Safety:
Convenience
Safety:
Hydrogen Demand
Economy:
Convenience
Economy:
Hydrogen Demand
Convenience:
Hydrogen Demand
10.211750.33
20.1450.33750.33
3579350.33
4755130.33
55770.330.331
67990.20.21
70.3335770.33
830.140.20.140.25
93310.3311
103550.330.331
110.20.20.210.331
12777551
13999331
1477510.330.33
159990.330.331
16535113
179990.215
189770.20.21
19557331
200.20.1430.3335
210.330.330.33113
220.20.330.2311
Geometric mean2.0442.5452.5851.0801.0641.020
Table 5. Pairwise comparison results on the Level 2 evaluation criteria.
NumberLand Rent Cost:
Hydrogen
Supply Cost
Station Accessibility:
Distance to
Existing Station
Traffic:
Income
Traffic:
Number of
Vehicles
Income:
Number of
Vehicles
10.250.1410.14
20.14770.330.11
30.143510.33
40.20.20.3313
50.25155
60.2510.330.33
750.33155
80.2550.140.11
90.331551
100.20.14550.33
110.33110.331
1277550.33
130.333770.33
1453551
150.145310.2
16370.3313
1715710.14
180.27553
190.335551
200.25530.33
211770.20.14
220.330.33533
Geometric mean0.4392.4992.5781.5870.730
Table 6. Raw Data of evaluation of new HFS candidates in Seoul.
Station
Number
Legal
Conformity
Land
Rent Cost
(won/3.3 m2)
Hydrogen
Supply Cost
(won/kg)
Station
Accessibility
(Minutes)
Distance to
Existing Station
(Minutes)
Traffic
(Vehicles)
Income
(10,000 Won/month)
Number of
Vehicle
(EV Vehicles)
N1A1090880015988,63835512,176
N2A5318800211466,46335512,176
N3A13678800181388,63835512,176
N4A126088001914116,95635512,176
N5A57088002014116,95635512,176
N6A4168800181388,63835512,176
N7A590880082530,6793271294
N8A770880042830,6793271294
N9A245880098174,4913151777
N10A1278800193054,7322863799
N11A163488001128146,317282659
N12A2808800114237,9563101087
N13A31588001311237,9563101087
N14A2288800104192,3163733497
N15A650880082478,9893041461
N16A7108800101667,2733091991
N17A99088001122102,6283091991
N18A12708800922102,6283091991
N19A230880092542,373243901
N20A1020880092469,224448612
N21B1758800231266,46335512,176
N22B17588002014116,95635512,176
N23B1098800142548,1172863799
N24B45880093160,341248896
N25B376880083553,892220639
N26B120088008668,0573733497
N27B9928800154192,3163733497
N28B16908800152067,2733091991
N29B50588001632166,143276998
N30B624880042242,373243901
Table 7. Standardization data of evaluation of new HFS candidates in Seoul.
Station
Number
Legal
Conformity
Land
Rent Cost
(won/3.3 m2)
Hydrogen
Supply Cost
(won/kg)
Station
Accessibility
(Minutes)
Distance to
Existing Station
(Minutes)
Traffic
(Vehicles)
Income
(10,000 Won/month)
Number of
Vehicle
(EV Vehicles)
N11006210027263779100
N210010010019402879100
N31004910022373779100
N41005310021404979100
N510010010020404979100
N610010010022373779100
N71001001005071137311
N81008710010080137311
N91001001004423737015
N101001001002186236431
N1110041100368061635
N121001001003611100699
N131001001003131100699
N141001001004011818329
N151001001005069336812
N16100951004046286916
N17100681003663436916
N18100531004463436916
N19100100100447118547
N20100661004469291005
N218010010017342879100
N228010010020404979100
N23801001002971206431
N2480100100448925557
N25801001005010023495
N2680561005017298329
N2780681002711818329
N2880401002757286916
N2980100100259170628
N30801001001006318547
Table 8. Total scores of new HFS candidates in Seoul.
RankStation
Number
Location Criteria HangangLegal
Conformity
Land
Rent Cost
Hydrogen
Supply Cost
Station
Accessibility
Distance to
Existing Station
TrafficIncomeNumber of
Vehicle
Total
Score
1N8South100741001008013731184.0
2N14South100100100401181832981.8
3N13North100100100313110069981.8
4N12North100100100361110069981.5
5N5South100991002040497910081.2
6N9South100100100442373701581.1
7N6South1001001002237377910080.3
8N15North10087100506933681279.5
9N2South1001001001940287910079.2
10N7South10096100507113731178.4
11N4South100451002140497910078.0
12N19North10010010044711854777.5
13N20North10055100446929100577.4
14N1South100521002726377910077.4
15N10South100100100218623643177.2
16N11North1003510036806163577.1
17N18South10045100446343691677.1
18N17South10057100366343691676.8
19N3South100411002237377910076.8
20N16South10080100404628691676.4
21N30North8091100100631854774.9
22N22South801001002040497910072.4
23N29South8010010025917062872.2
24N25North80100100501002349571.0
25N24North8010010044892555770.3
26N21South801001001734287910069.9
27N27South8057100271181832968.7
28N23South80100100297120643168.4
29N26South8047100501729832966.7
30N28South8033100275728691663.7
Table 9. Weights of Level 1 criteria when performing sensitivity analysis.
CriteriaSensitivitySafetyEconomyConvenienceHydrogen DemandTotal
Safety+20%0.5280.1690.1520.1511.000
−20%0.3520.2320.2090.2071.000
Economy+20%0.4200.2400.1710.1691.000
−20%0.4640.1600.1890.1871.000
Convenience+20%0.4220.1910.2160.1711.000
−20%0.4620.2080.1440.1861.000
Hydrogen demand+20%0.4220.1910.1710.2161.000
−20%0.4620.2080.1860.1441.000
Table 10. Weights of Level 2 criteria when performing sensitivity analysis.
CriteriaSensitivityLegal ConformityLand Rent CostHydrogen
Supply Cost
Station
Accessibility
Distance to
Existing Station
TrafficIncomeNumber of
Vehicle
Safety+20%0.530.050.120.110.040.080.030.04
−20%0.350.070.160.150.060.100.040.06
Economy+20%0.420.070.170.120.050.080.030.05
−20%0.460.050.110.130.050.090.040.06
Convenience+20%0.420.060.130.150.060.090.040.05
−20%0.460.060.140.100.040.090.040.06
Hydrogen demand+20%0.420.060.130.120.050.110.040.06
−20%0.460.060.140.130.050.070.030.04
Disclaimer/Publisher’s Note: The statements, opinions and data contained in all publications are solely those of the individual author(s) and contributor(s) and not of MDPI and/or the editor(s). MDPI and/or the editor(s) disclaim responsibility for any injury to people or property resulting from any ideas, methods, instructions or products referred to in the content.

