Article

Electrochemical Aptasensor Based on ZnO-Au Nanocomposites for the Determination of Ochratoxin A in Wine and Beer

1
Key Laboratory of Shaanxi Administration of Traditional Chinese Medicine for TCM Compatibility, Shaanxi University of Chinese Medicine, Xi’an 712046, China
2
College of Food Science and Technology, Northwest University, Xi’an 710069, China
*
Authors to whom correspondence should be addressed.
Processes 2023, 11(3), 864; https://doi.org/10.3390/pr11030864
Submission received: 21 February 2023 / Revised: 11 March 2023 / Accepted: 12 March 2023 / Published: 14 March 2023

Abstract

:
Ochratoxin A (OTA) is positively correlated with an increased risk of developing cancer in nephrotoxic and hepatotoxic patients. Therefore, it is of great significance for the highly sensitive, highly selective, and timely detection of OTA. We described here an electrochemical aptasensor for OTA analysis, which took advantage of the favorable properties of gold nanoparticles (AuNPs) functionalized zinc oxide (ZnO) composites and the intercalative binding between methylene blue (MB) and nucleic acid. There were two label-free aptamers: one to capture OTA and another serving as complementary DNA (cDNA), enabling connection to the ZnO-Au composite’s immobilized electrode. Once OTA was present, the aptamer could capture OTA and detach from the electrode interface, thus, preventing MB from accessing electrode surface for efficient electron transfer; a decreased peak current was monitored by differential pulse voltammetry. The aptasensor presented nice analytical performance for OTA detection in the range of 0.1–30,000 pg·mL−1, with a detection limit of 0.05 pg·mL−1. Moreover, the developed biosensor could be applied to actual sample (wine and beer) analysis.

Graphical Abstract

1. Introduction

As a mycotoxin, Ochratoxin A is produced by Aspergillus and Penicillium under suitable conditions and was first discovered in South Africa in 1965 [1]. Mycotoxins are mainly Ochratoxin A, Ochratoxin B, and Ochratoxin C, among which OTA is most commonly detected and has the highest toxicity [2]. The primary sources of OTA are food commodities such as cereal grains (corn), dairy products, coffee beans, raisins, wine, fruits, vegetables (garlic, yam, potatoes, onions, and tomatoes), and spices [3]. Moreover, OTA is difficult to completely remove in food storage and processing due to its strong thermal and chemical stability. Human ingestion of OTA-infected food may produce renal toxicity, hepatotoxicity, teratogenicity, and immunotoxicity. In order to reduce the adverse effects of OTA on human body, the Food Safety Organization of China has set strict limit standards for OTA content in food [4]: wine (≤2 μg·kg−1); grain and its products, beans, roasted coffee beans and roasted coffee (≤5 μg·kg−1); soluble coffee (≤10 μg·kg−1). Thus, the timely detection of OTA is of great significance. Currently, the main methods used to detect OTA are fluorimetric-visual assay [5], chromatography-tandem mass spectrometry [1], high performance liquid chromatography-fluorescence [6], enzyme linked immunosorbent assay [7], and electrochemical method [8]. Most sensors are time-consuming and rely on expensive equipment, professional technicians, and complex pretreatment processes, and are not suitable for field diagnosis of mycotoxins. Fortunately, electrochemical sensors, with the merits of being highly sensitive, easy to operate, and easy to miniaturize, have broad application prospects for the rapid detection of food contaminants.
Bioactive and bioactive free-based electrochemical sensors have been used to detect estrogens, glucose, toxins, and pathogenic bacteria in food. The mechanism of an electrochemical sensor is mainly composed of two parts: (1) Recognition by interaction with the analyte; (2) Transduction, that is, when the interaction is converted into a readable signal [9]. The recognition or sensing element must be sensitive and specific to the detected object. An electrochemical biosensor takes a bioactive unit (such as an enzyme, antibody, nucleic acid, aptamer, etc.) as the recognition element, combined with a chemical and physical conversion element (such as an electrode), and has high selectivity and sensitivity to the specific analyte [9]. Compared with non-bioactive sensors, biosensors have the advantage of high selectivity due to the existence of specific recognition elements. Moreover, biosensors play a key role in the detection of biomolecules or their metabolites, and could achieve high sensitivity, high accuracy, rapid, semi-automatic, and fully automated analysis.
As mentioned above, sensitivity is one of the crucial analytical properties of biosensors. How to promote the sensitivity of biosensors remains a problem worth studying. The researchers mainly used featured materials [10], unique nucleic acid structure [8], nucleic acid amplification [11], and other signal amplification strategies to improve the sensitivity of the sensor. Among these strategies, novel materials have been extensively applied to sensing systems due to their excellent performance. There are commonly-used, in-sensor novel materials including carbon-based materials, conducting polymers, covalent organic frameworks, metal-organic frameworks, and metal oxides [12,13,14,15,16]. Although most materials, especially nanostructured materials, have high specific surface areas that provide more binding sites, their electrical conductivity is poor. The defects of a single material can be overcome by the combination of two or more materials. At the present stage, transition metal oxides are cost-effective and abundant materials, and can form composites with noble metals that display excellent selectivity when coupled to biorecognition elements [17]. Zinc oxide (ZnO) has broad prospects in energy conversion and storage, photoelectricity, and environmental remediation [18]. Bio-acceptable 0D and 1D ZnO nanostructures, as sensors and assay platforms, have offered biomolecular selectivity and sensitivity for cancer diagnosis and treatment and are going to emerge as breakthrough candidates for the medical field [19]. Das et al. [20] researched the interaction of a fluorescent ZnO-Au nanocomposite with deoxyribonucleic acid. The result indicated that the designed ZnO-Au can be used as a fluorescent probe for nanomaterial-based DNA-binding study and to distinguish, skillfully, between single-stranded DNA and double-stranded DNA. ZnO-Au nanocomposites were also prepared for high-performance supercapacitors [21]. The nanocomposites can be considered to be the most promising materials for the next generation of supercapacitors due to their high specific capacitance and good cycle stability. Yao et al. [22] synthesized powdered ZnO-Au nanocomposites through a facile and controlled method. The ZnO-Au nanocomposites exhibited excellent photocatalytic stability and can be reusable as photocatalysts.
Aptamers (mainly DNA and RNA) are screened from nucleotide libraries through the in vitro technology of exponential enrichment ligand phylogeny and have high specificity for target molecules such as ions, antibiotics, proteins, and even the whole cell [23]. Aptamers have become a promising molecular recognition tool in biosensors due to their essential characteristics of small size, low cost, high sensitivity, high selectivity and high stability [24]. Although aptamers labeled by various functional groups or electroactive molecules are also easily synthesized, labeling techniques will reduce the affinity of the aptamers and increase the economic cost. Zhao et al. [25] utilized two aptamers labeled with electroactive molecules to determinate patulin and OTA, respectively. Patulin and OTA can be quantified at a linearity range of 10−9–0.1 μg·mL−1. Compared to labeled aptamers, label-free aptamers with sandwich structure presented higher affinity for the target. For example, the simultaneous use of two DNA aptamers for capturing thrombin is a very powerful way to enhance the selectivity of sensing systems [26]. However, sandwich structure requires two aptamers to bind to different sites, which is a complex and time-consuming operation. Therefore, researchers pay attention to the development of label-free sensors based on targets-induced chain displacement.
With an effort to develop targets-induced, chain-displacement-based analysis, we designed a highly sensitive aptasensor reliant on flower ZnO-Au composites and methylene blue interaction with nucleic acid. In the presence of OTA, the original double-stranded DNA on the electrode surface becomes single-stranded DNA, affecting the binding of electroactive molecules with nucleic acids. We showed an application of targets-induced chain displacement assay to the detection of OTA in wine and beer samples.

2. Experimental Section

2.1. Reagents

The main following reagents were used as received (all reagent grade): Zinc nitrate (Zn(NO3)2·6H2O, ≥99.0%, Shanghai Aibi Chemical Reagent Co., Ltd. Shanghai, China); Chloroauric acid (HAuCl4·4H2O, 99%, Shanghai Chemical Reagent Co., Ltd. Shanghai, China); Tris(hydroxymethyl)aminomethane (Tris-HCl, >99.9%, Shanghai Sangon Bioengineering Co., Ltd. Shanghai, China); Methylene blue trihydrate (MB, Tianjin Kermel Chemical Reagent Co., Ltd. Tianjin, China); 6-mercapto-1-hexanol (MCH, 97%), Tris-(2-carboxyethyl) phosphine hydrochloride (TCEP, ≥98.0%) and Perfluorosulfonic acid-PTFE copolymer (Nafion, 5%) were obtained from Sigma Aldrich Shanghai Co., Ltd (Shanghai, China); Ethylenediaminetetraacetic acid (EDTA, 99.5%), Ochratoxin A (OTA, 98%), Zearalenone (ZEA), Patulin (PAT), and Deoxynivalenol were purchased from Shanghai Aladdin Biochemical Technology Co., Ltd (Shanghai, China).
TE buffer (pH = 8) mainly consisted of 10 mM Tris-HCl and 1 mM EDTA. Ultrapure water (UP > 18.25 MΩ.cm@25 °C) was obtained from an ultrapure water machine system and used throughout the experiments. Complementary DNA (cDNA, 5′-SH-(CH2)6-T-40-T-CAC CCA CAC CCG ATC CTC AGC-3′), aptamer-OTA (aptamer, 5′-TGA GGA TCG GGT GTG GGT GGC GTA AAG GGA GCA TCG GAC A-3′), BHQ2-aptamer-OTA, and Cy3-cDNA were purchased from Takara Biotechnology (Beijing) Co., Ltd. (Beijing, China).

2.2. Apparatus

Scanning electron microscopy (SEM) was used to characterized the morphology, layered structure, and size of ZnO-Au composites. SEM images were obtained using a SU8010 instrument produced by Nippon Corporation, Japan. Samples were suspended in ultrapure water and dispersed onto square, single-polished silicon wafers (3 × 3 mm) at a thickness of 0.725 mm.
Fourier transform infrared spectrometer (FTIR, TENSOR27, Brooke, Germany) was used to characterize functional groups on the surface of samples in the range of 400–4000 cm−1. Powder samples were mixed well with KBr and pressed into coin-shaped pellets for testing.
UV-visible absorption spectrum (UV-vis) was measured with an Agilent Cary-100 spectrophotometer (Agilent technology, America) at room temperature.
X ray powder diffractometer (XRD, D8 ADVANCE, Brooke, Karlsruhe, Germany) data was recorded using graphite-monochromatic Cu-Kα radiation. Powder samples were scanned with a 2-Theta range from 20 to 80 degree at a step width of 0.05 degree.
X-ray photoelectron spectroscopy (XPS, Ulvac-Phi, Kanagawa, Japan) was carried out on a PHI 5000 Versaprobe III spectrometer with the calibrated C1s peak of 284.8 eV. The samples preparation process was the same as SEM.
Fluorescence intensities were recorded on a F-4500 spectrofluorimeter (Hitachi, Japan). The emission spectra were recorded within the wavelength range of 500–640 nm upon excitation at 490 nm.
Electrochemical measurements (electrochemical impedance spectroscopy, EIS, and differential pulse voltammetry, DPV) were carried out on a CHI 660D electrochemical workstation (Shanghai Chenhua Instrument Co., Ltd., Shanghai, China) using a three-electrode electroanalysis system. The three-electrode system consisted of a working electrode (glassy carbon electrode, GCE, diameter = 3 mm), reference electrode (saturated silver/silver chloride), and auxiliary electrode (platinum filament). EIS was performed under initial potential of 0.27 V (versus Ag/AgCl) in a frequency range of 100 kHz to 0.1 Hz, with amplitude of 0.005 V and quiet time of 2 s. DPV was also implemented through setting the scan potential range (−0.7 V to 0.1 V versus Ag/AgCl) and sensitivity (1 × 10⁻⁶ A/V), defaulting other parameters such as potential increment of 0.004 V, amplitude of 0.05 V, pulse width of 0.05 s, sample width of 0.0167 s, pulse period of 0.5 s, and quiet time of 2 s.

2.3. Fabrication of Aptasensor

2.3.1. Preparation of Flower-like ZnO-Au Composites

ZnO flower and AuNPs-functionalized ZnO flower were synthesized in an alkaline and acid aqueous solution, respectively, by a modified reported method [27]. In the ZnO flower synthesis process, 10 mL of 0.5 mol·L−1 zinc nitrate aqueous solution was added into 10 mL of 4 mol·L−1 KOH aqueous solution drop by drop under continuous magnetic stirring. The obtained solutions maintained 30 °C for 12 h under continuous magnetic stirring. White ZnO flower could be attained through washing products using ethanol and drying.
In addition, 586 μL of 10 mg·mL−1 chloroauric acid and 1 mL methanol were added into 20 mL ultrapure water. The pH of mixed solution was adjusted to near neutral using 0.01 mol·L−1 NaOH under stirring. 30 mg of ZnO powder was then added to the neutral solution and stirred for 1 h. The total solution was transferred to a stainless-steel autoclave and kept at 120 °C for 1 h. After being slowly cooled down to room temperature, the samples were collected by centrifugation and washed with ethanol and ultrapure water, and then dried to obtain purple–red ZnO-Au composites.

2.3.2. Aptasensor Development

GCE, after being polished via Al2O3 powder with a diameter of 0.05 μm, was immersed in ethanol and water solution for ultrasonic cleaning. The cleaned electrode was dried with nitrogen gas for later use. 1 mg of prepared ZnO-Au composites were uniformly dispersed in 1 mL of ultrapure water to obtain purple suspension (1 mg·mL−1). Then, 6 μL suspension was dripped onto the electrode and dried at room temperature. At last, nafion@ZnO-Au/GCE membrane was formed after 4 μL nafion solution (0.5%) dripped on ZnO-Au composites modified GCE. Here, nafion was used not only as an immobilizing binder that produced uniform composite film, but also a filtering membrane in electroanalytical applications to improve selectivity of the sensor.
The electrode prepared above was used to conduct a series of incubation processes for OTA analysis. Before immobilization, cDNA and aptamer were denatured via heating at 95 °C for 5 min and then ice-cooled for 5 min. First, 6 μL of 1 μmol·L−1 cDNA (including 0.05 mM TCEP in pH = 8.0 TE buffer) was dripped onto the prepared electrode and kept under high humidity at room temperature overnight. Next, the modified surface was rinsed with buffer solution and then passivated with 1 mmol·L−1 MCH in Tris-HCl buffer (pH = 7.4) for 1 h. After washing, 6 μL of 1 μmol·L−1 aptamer was dropped on the above electrode and incubated for 2 h for specific base pairing. After that, the modified electrode was immersed in 20 μmol·L−1 MB solution and maintained for an appropriate time. Finally, the modified electrode was cleaned with Tris-HCl buffer and dried to obtain MB/aptamer/MCH/cDNA/nafion@ZnO-AuNPs/GCE.

2.4. Electrochemical Detection

Differential pulse voltammetry was performed in 10 mL Tris-HCl buffer (pH = 7.4) in a potential range of −0.7 V to 0.1 V (versus Ag/AgCl). Prior to differential pulse voltammetric measurement, the modified electrode was incubated in Tris-HCl buffer containing OTA for an appropriate time. The concentration of OTA was quantified through the reduction peak current of MB.

2.5. Real Sample Analysis

Wine and beer samples, obtained from a local store, were degassed with nitrogen gas before being applied to electrochemical analysis. Testing was performed by spiking OTA into samples at a series of concentrations of 0.1, 1, 100, and 1000 pg·mL−1.

3. Results and Discussion

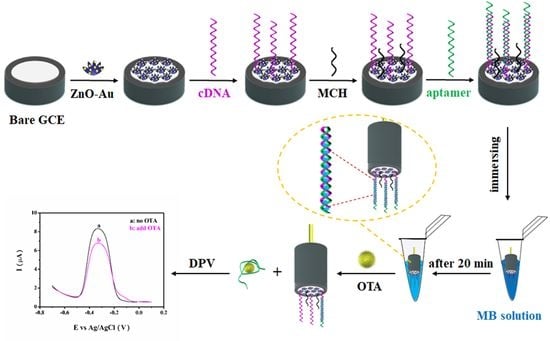
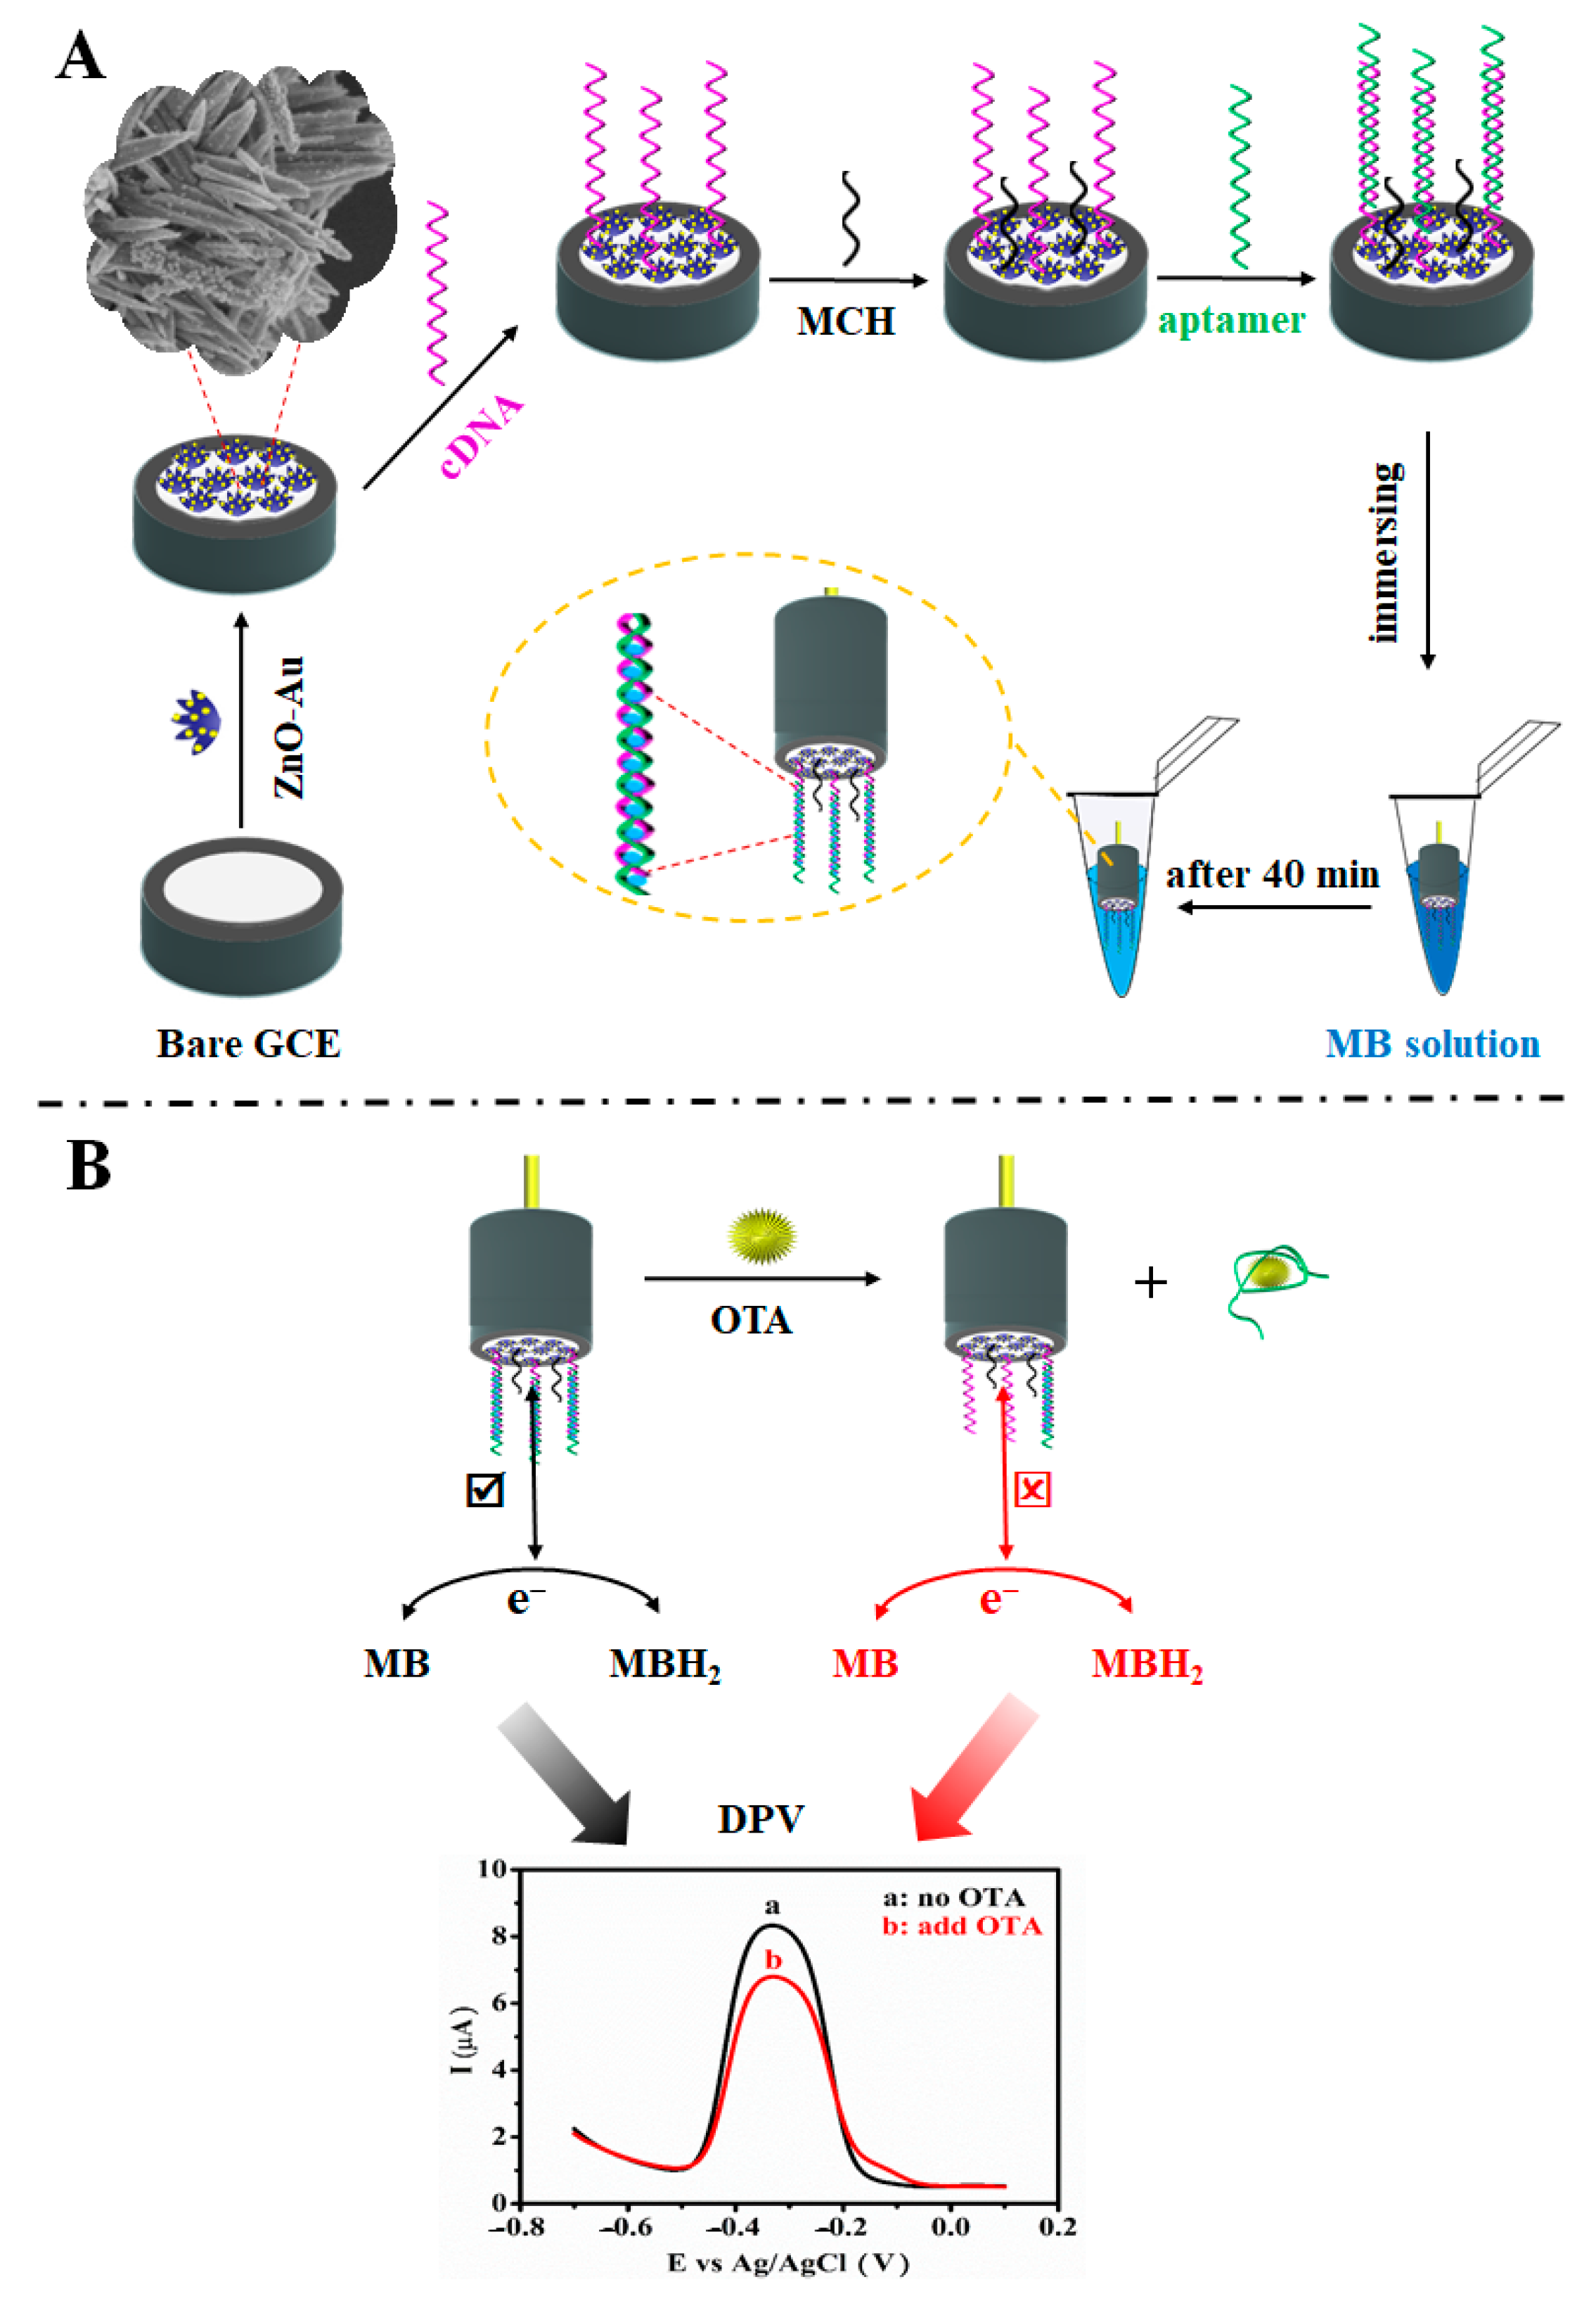
3.1. Principle of the OTA Aptasensor

The OTA aptasensor described herein was used to detect OTA by integrating ZnO-Au composites and nucleic acid interaction with MB. Sulfhydryl-labeled cDNA was linked to a ZnO-Au modified electrode via Au-S covalent bond. Double-strand DNA (dsDNA) was obtained by the complementation of aptamer and single-strand DNA (ssDNA or cDNA). MB attached to dsDNA via intercalative binding to generate high peak current [28], due to the electron transfer of MB/MBH2 (MBH2: reduced state of MB) on electrode sensing surface. Once OTA was present, the aptamer could capture OTA and detach from the electrode interface. Then, the double-strand DNA (dsDNA) was changed to single-strand DNA (ssDNA). In this case, the MB molecules would have detached from the dsDNA and released into the solution, preventing MB/MBH2 from accessing the electrode surface for efficient electron transfer; a weak peak current of MB was obtained. The changes in peak current dependency, with the scan rate before and after the release of MB, further proved that the electrode reaction changed from a surface-controlled process to a diffusion-controlled one (Figure S1). DPV with the scan potential range of −0.7 V to 0.1 V (versus Ag/AgCl) could be used to detect the reduction peak of MB. The entire fabrication and sensing application of the developed biointerface is illustrated in Scheme 1.
Due to aptamer-specific capture OTA, the original dsDNA on the electrode is changed into ssDNA, which affects the binding of MB with nucleic acid. MB is one of the most commonly used cationic dyes and is easily detected via UV-vis. Thus, UV-vis was used to investigate MB in different systems. The aqueous solution of MB had a strong absorption peak at 664 nm, which was assigned to MB monomer (Figure S2). The other acromion at about 613 nm belonged to MB dimer [29]. After intercalating of the MB into DNA (dsDNA or ssDNA), the absorption intensity of the MB monomer was weakened and accompanied by a slight redshift. This effect was attributed to intercalative binding of MB and bases. Both MB and DNA molecules contain unique aromatic structures. When the π electrons of two molecules were combined, the empty π* orbital (MB) was coupled to the π orbital (base), thereby decreasing the required energy for the π−π* electron transition, which resulted in a redshift. At the same time, the empty π* orbital was partially filled with electrons, which reduced the probability of π−π* transition and weakened the absorption intensity [30]. Significantly, compared with the combination of MB and ssDNA, the intercalative binding between MB and dsDNA was stronger than the binding of MB and ssDNA. The principle of the designed aptasensor is based on the target–object induced chain displacement, which leads to the change in the number of electroactive molecules on the sensing interface.

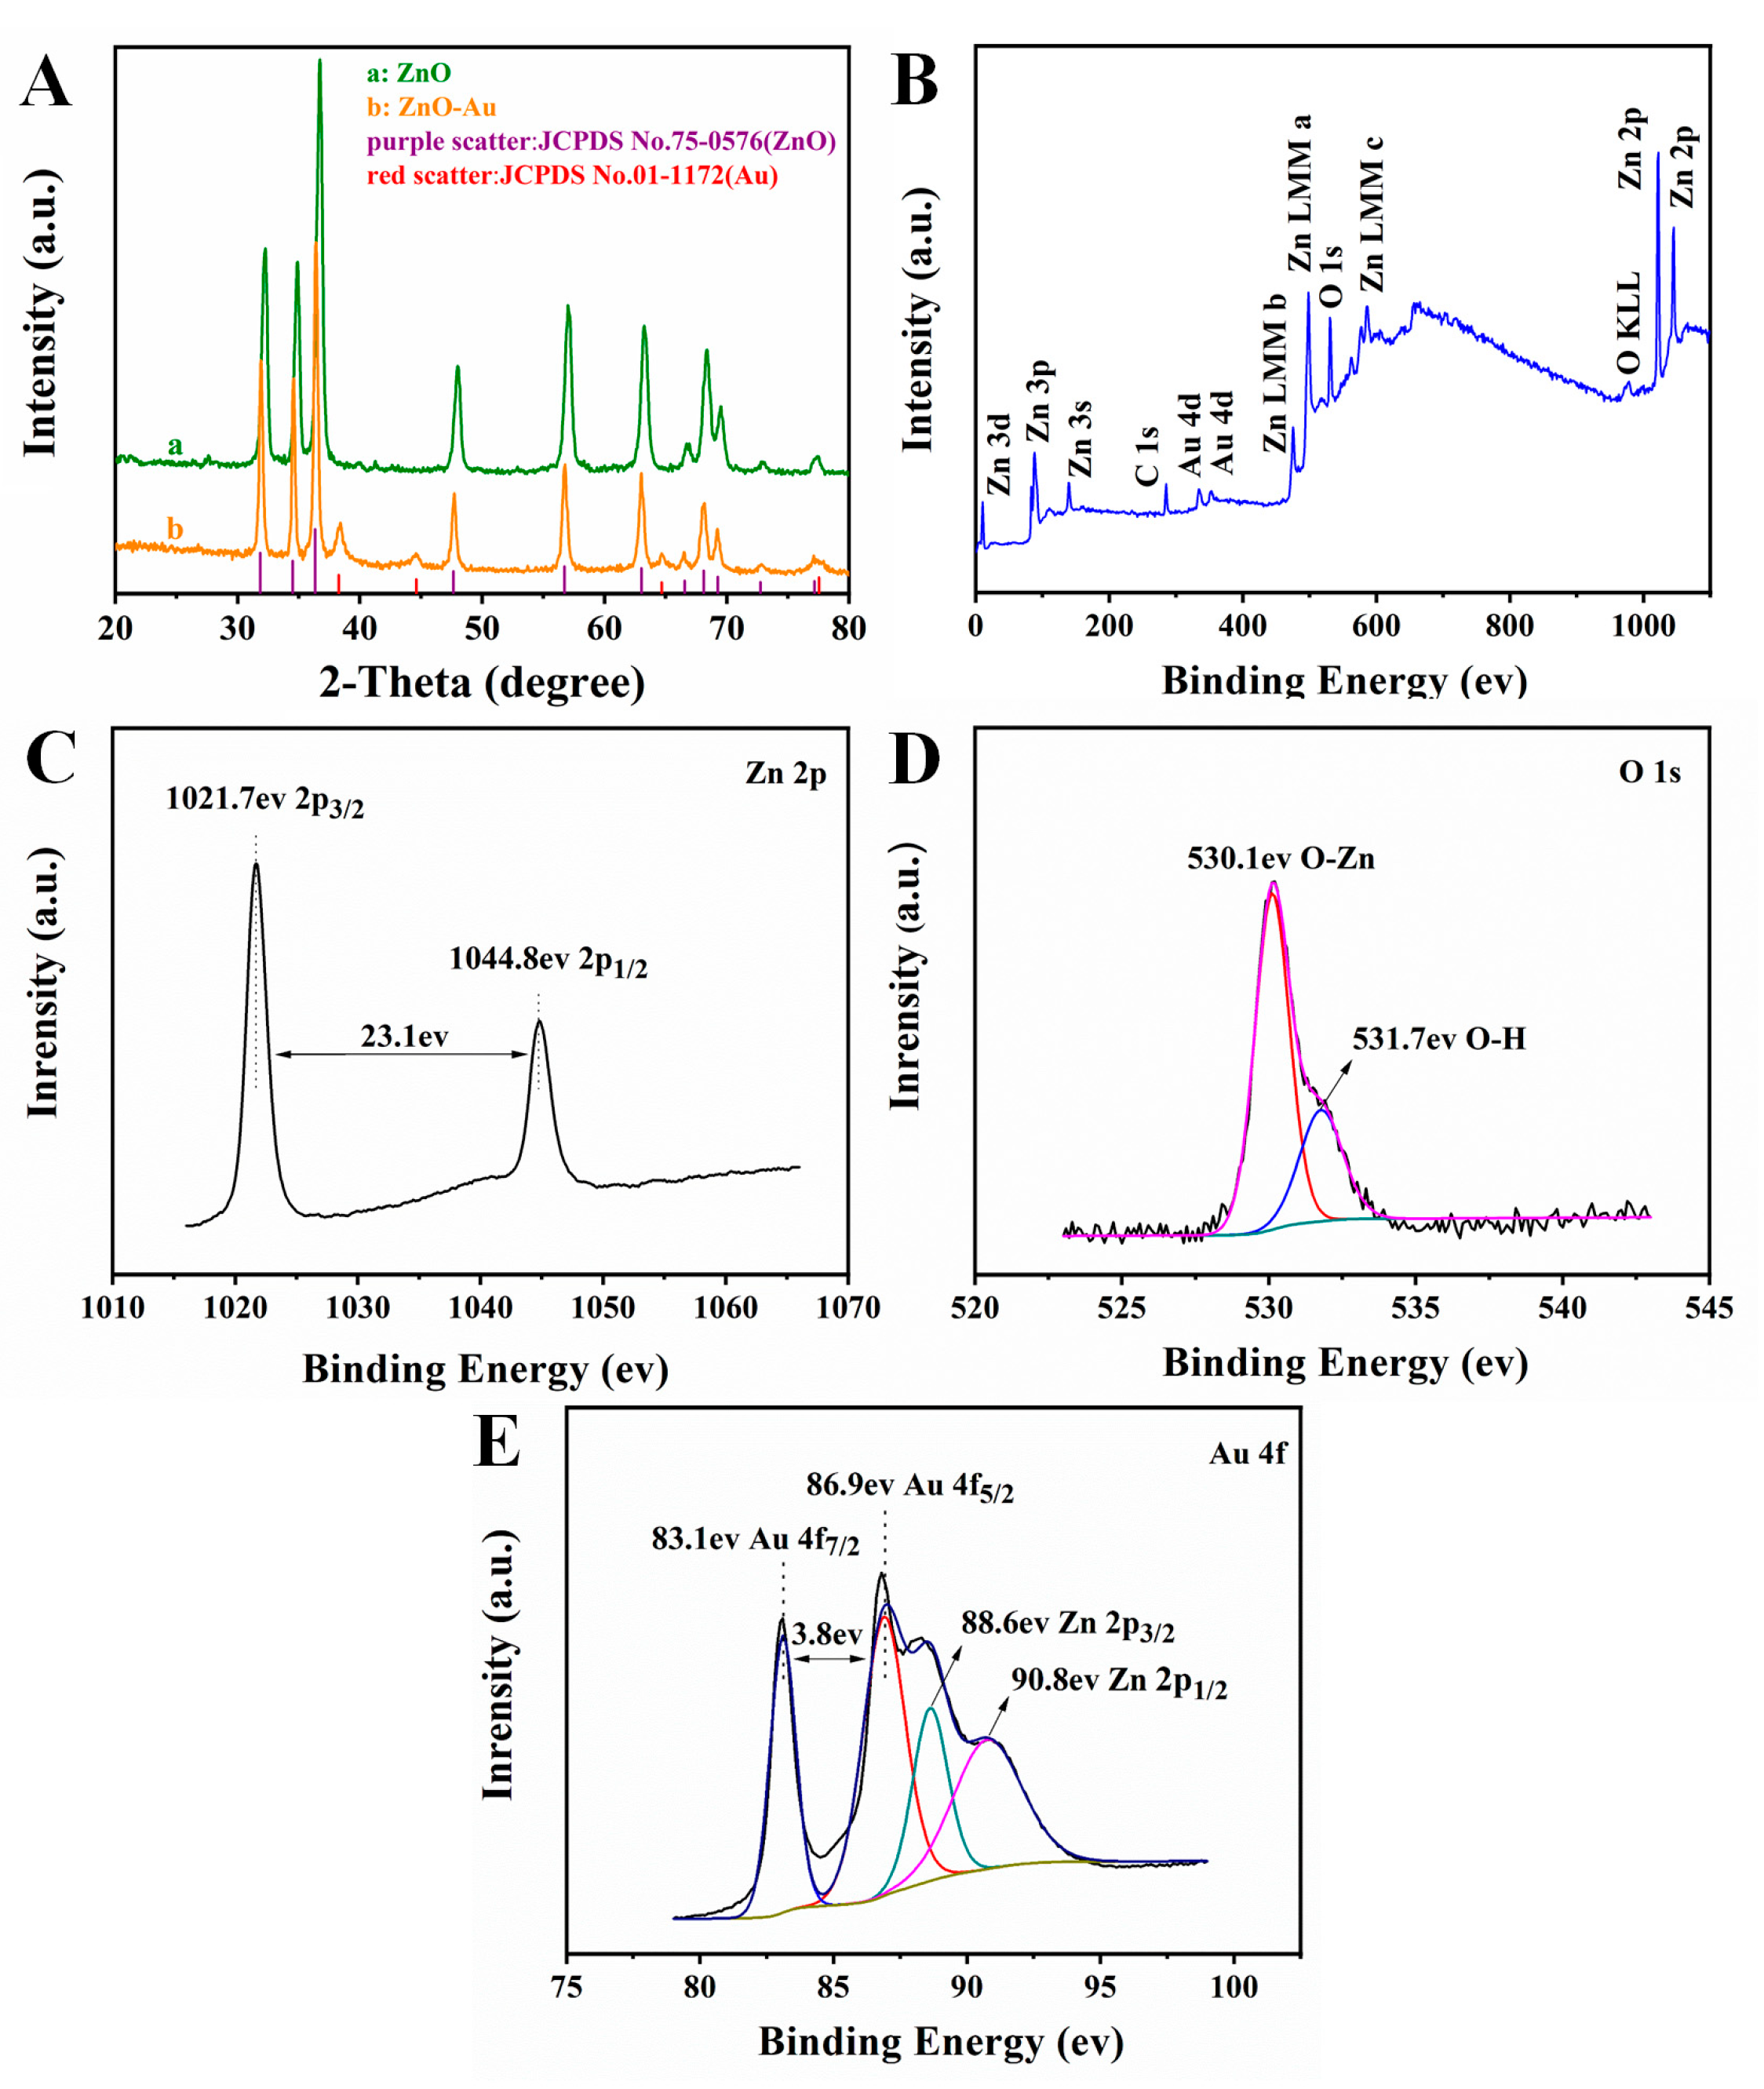
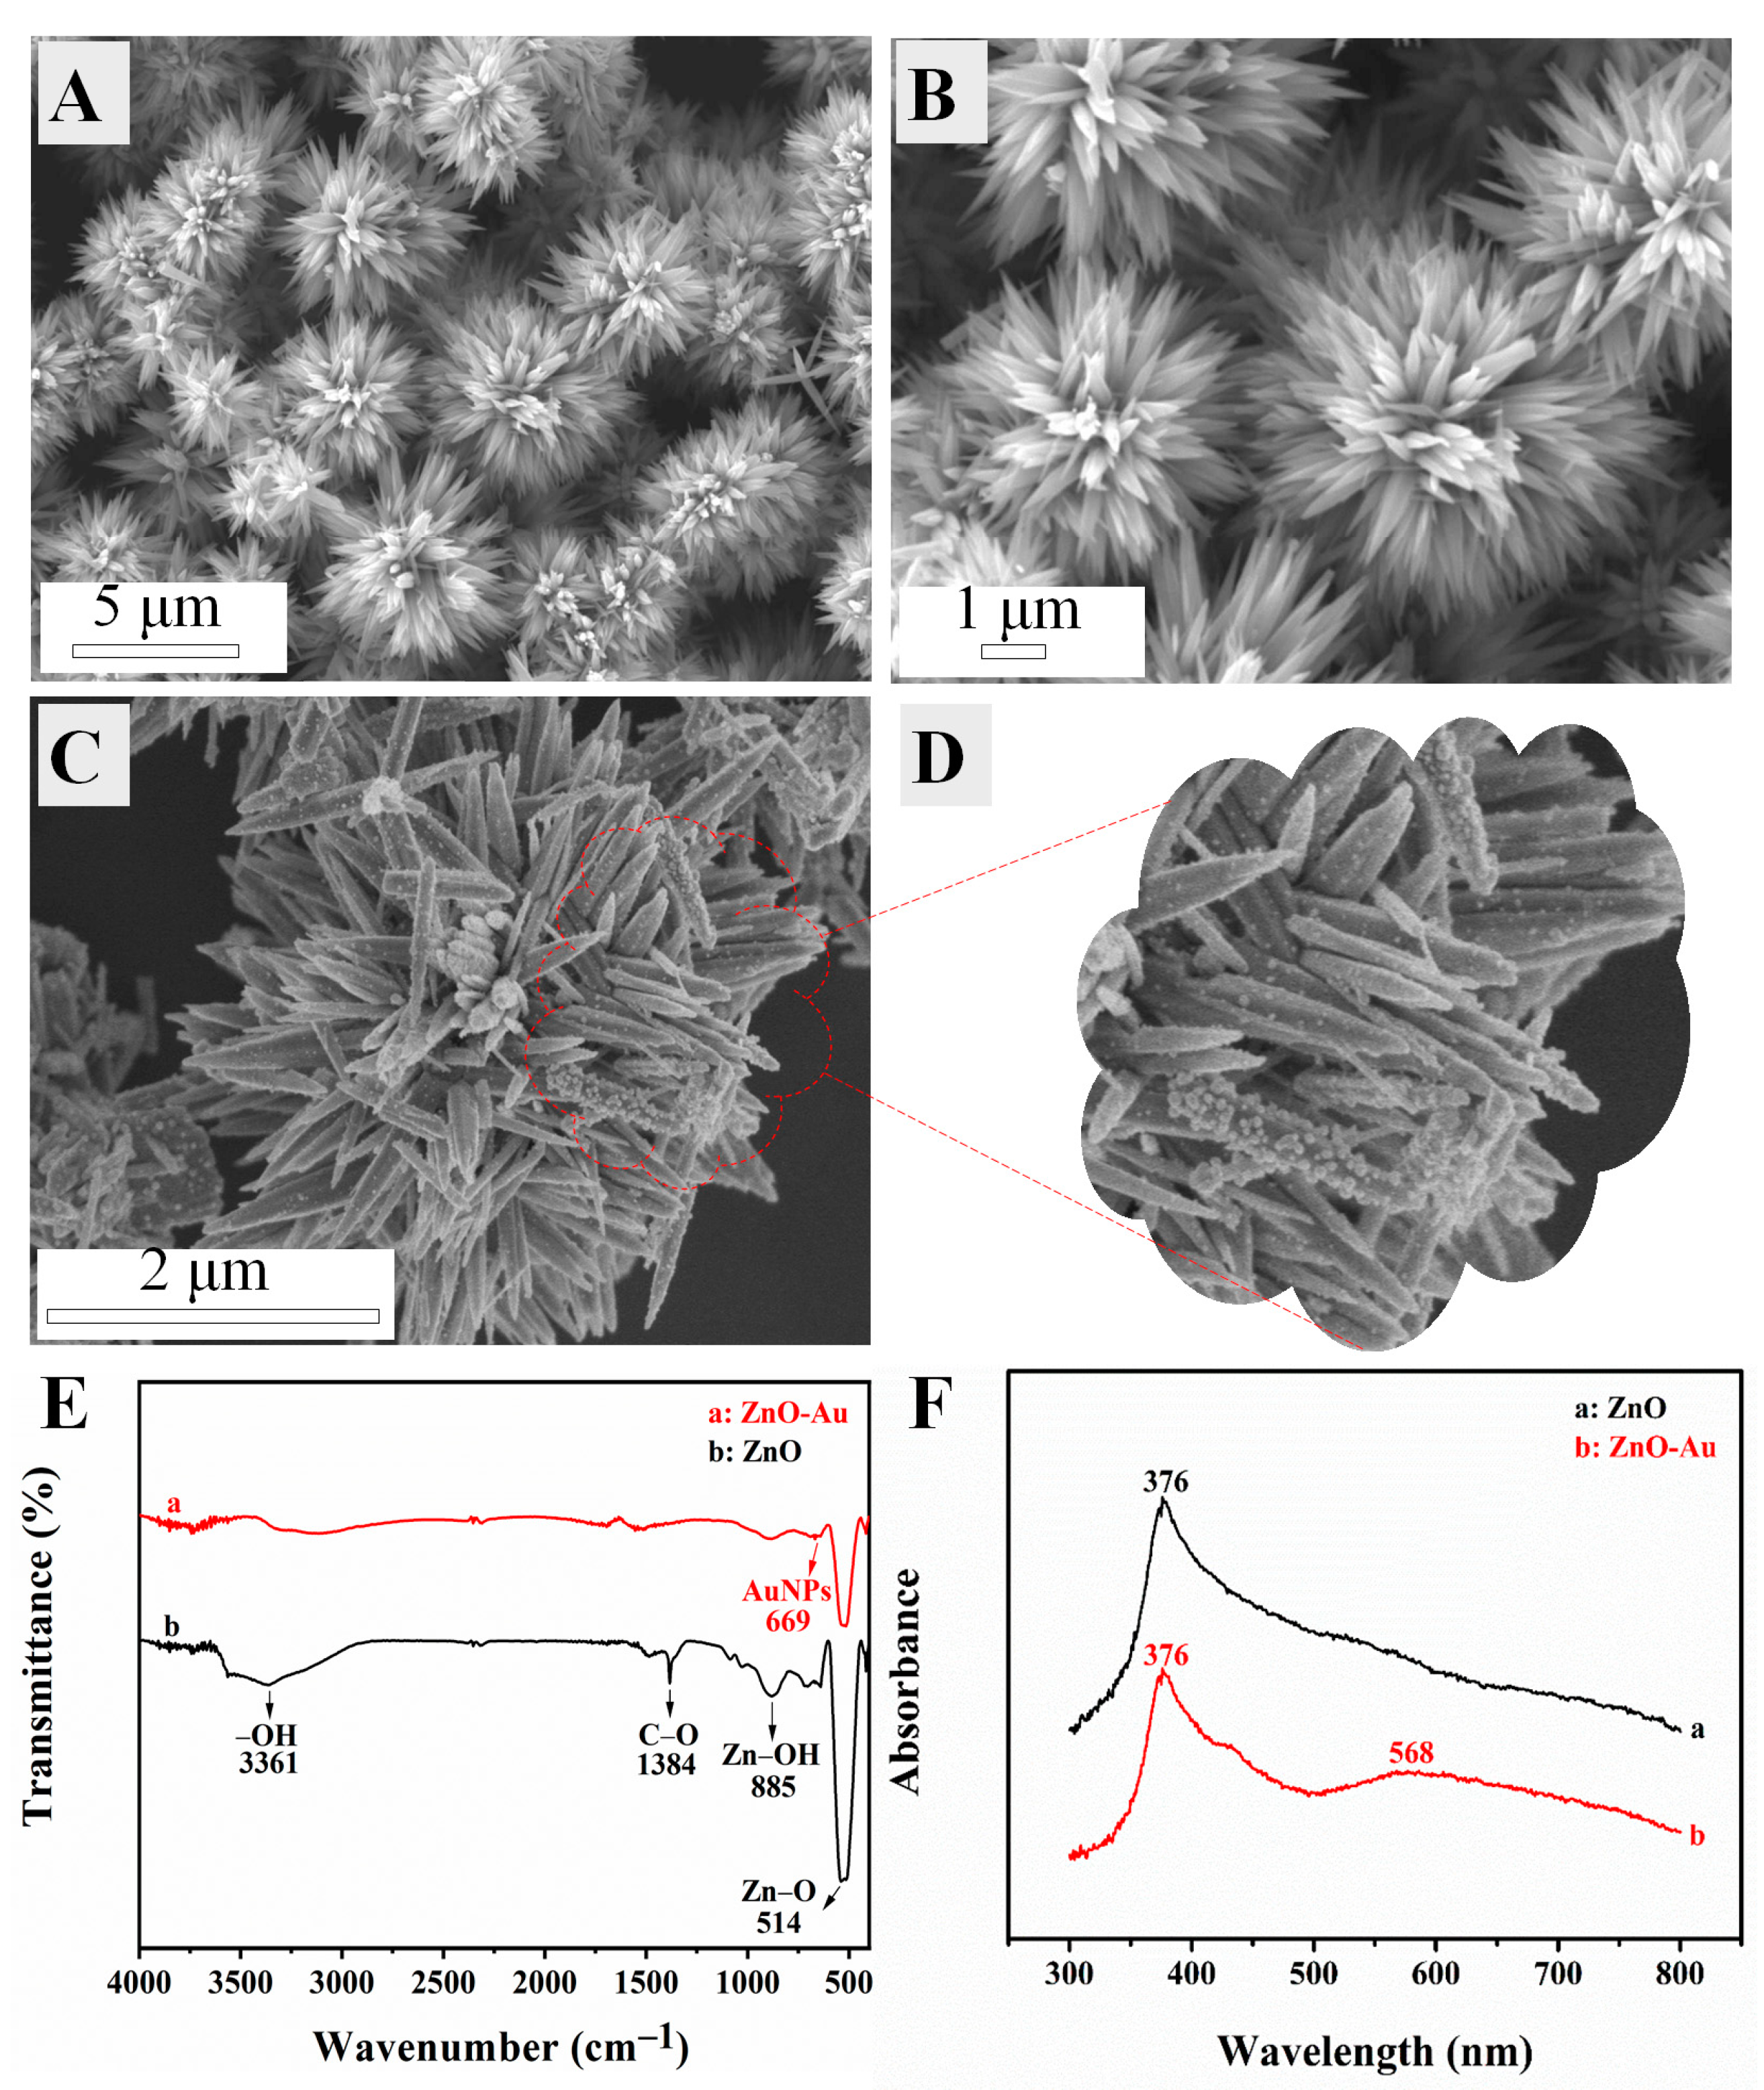
3.2. Characterization of Composites and Modified Electrode

The SEM microstructure of the materials obtained from hydrothermal reaction is presented in Figure 1A–D. The ZnO material was comprised of a great many hierarchical, flower-like structures with an array of oriented, tapered branches (Figure 1A). Each tapered petal with an extremely smooth surface was in the length of 1–2 μm (Figure 1B). The SEM micrographs of ZnO-Au hybrids were shown in Figure 1C,D. The local view of magnified SEM image (Figure 1D) revealed that spherical gold nanoparticles had been successfully attached to ZnO materials. It was obvious that the tapered-branches morphology of ZnO appeared marginally coarsened after the attachment of gold nanoparticles (AuNPs), leading to a decrease in length and width, which could be the corrosion effect of chloroauric acid. Because the surface roughness of materials is positively related to its specific surface area, the obtained ZnO-Au composites provide larger surface area to promote the electron transfer in electrochemical sensing systems.
ZnO flower and ZnO-Au composites were evaluated by FTIR and UV-vis. The FTIR spectra of ZnO and ZnO-Au composites were recorded in Figure 1E. The pure ZnO flower presented a sharp characteristic band at 514 cm−1 from the stretching of Zn-O. The stretching modes of Zn-OH and C-O groups were observed at 885 cm−1 and 1384 cm−1, respectively. The bands at 3361 cm−1 corresponded to the stretching and bending vibrations of the O-H group. The profile of the ZnO-Au NPs displayed a slight peak at 669 cm−1 due to the attachment of AuNPs to ZnO flower [21]. There was a slight change in the peaks, which confirmed the coverage of ZnO by AuNPs. The UV-vis absorption spectra of ZnO flower and ZnO-Au composites were presented (Figure 1F), such as a sharp peak around 376 nm due to the excitonic absorption of ZnO and the broad hump around 568 nm of Au because of the surface plasmon resonance. The main absorption in the composites occurred in ZnO rather than gold, due to the low concentration of AuNPs in the composites as well as the high absorbance of ZnO. Moreover, a slight decrease in the absorption intensity at about 376 nm was observed for the ZnO-Au composites, which indicated the presence of AuNPs on the ZnO surface [31]. The UV-vis results further demonstrated the associative interaction between ZnO flower and AuNPs, which was consistent with the results of the FTIR spectra.
Impedance characterization was used to compare the electrical conductivity of electrode materials using [Fe(CN)6]−3/−4 as a redox probe (Figure S3A). According to Randle theory [32], the electrolytic cell can be simulated to obtain the model circuit including charge-transfer resistance (Rct), Warburg impedance (Zw), solution resistance (Rs), and double-layer capacitance (Cd). In the Nyquist plots, semicircle diameter and straight line corresponds to Rct and Zw, respectively. The Rct values are obviously different during modification of different materials on the electrode surface. It can be seen that the Rct value of 345 Ω for bare GCE showed a high electron transfer behavior between the electrode interface and redox probe. The Rct value of the electrode interface increased to 598 Ω after the modification of ZnO on the GCE, due to relatively poor conductivity of ZnO. The ZnO-Au composites modified GCE presented a lower Rct (448 Ω), when compared with ZnO modified GCE (598 Ω), owing to the strong electrical conductivity of AuNPs. The effective electrode surface areas were also investigated by recording the anodic and cathodic peak currents of different electrodes at a scan rate of 50 mV/s. The effective electrode surface areas in each case were determined based on the Randle–Sevcik equation [33]. The effective surface area of ZnO-Au and ZnO bare GCE were found to be 0.071 cm2 and 0.056 cm2, respectively, compared to 0.034 cm2 for bare GCE. Therefore, ZnO-Au composites/GCE with larger surface area and high electrical conductivity can be used to fabricate electrochemical aptasensors.
XRD patterns for 2-Theta values between 20–80° for ZnO and ZnO-Au samples sintered in air and argon are shown in Figure 2A. The diffraction peaks of ZnO-Au composites were completely consistent with the standard cards of ZnO (JCPDS No. 75-0576) and Au (JCPDS No. 01-1172), which indicated the successful synthesis of ZnO-Au with pure phase products. The XRD patterns of ZnO showed that the peaks at 31.84°, 34.502°, 36.336°, 47.652°, 56.73°, 63.014°, 66.54°, 68.118°, 69.259°, 72.757°, and 77.16° corresponded to the crystal faces of (100), (002), (101), (102), (110), (103), (200), (112), (201), (004), and (202), respectively. Besides, there were diffraction peaks at 38.268°, 44.599°, 64.677°, and 77.547° which, respectively, corresponded to (111), (200), (220), and (311) crystal faces of Au. As far as the (101) plane of ZnO crystals is concerned, it is a nonpolar surface and its surface energy is higher than that of the (100) plane, which means that AuCl4 at an appropriate concentration can be preferentially absorbed on (101) plane-forming Au NPs [34]. Figure 2B showed an XPS full spectrum from ZnO-Au sample, including the binding energy peaks of Zn, O, and Au. The detailed Zn (2p) spectrum (Figure 2C) revealed two peaks, which were assigned to the following groups: 2p1/2 zinc peak at 1044.8 eV and 2p3/2 zinc peak at 1021.7 eV with the separation distance of 23.1 eV, indicating the presence of Zn2+ [27]. Figure 2D is the detailed O (1s) spectrum, which can be decomposed into two peaks located at 530.1 eV and 531.7 eV, respectively, indicating the presence of two different O in the material. The peak at 530.1 eV was attributed to the lattice oxygen of ZnO, while the peak at 531.7 eV belonged to the oxygen of the hydroxyl group (OH) on the surface of ZnO [21]. Figure 2E showed 83.1 eV and 86.9 eV corresponding to Au (4f7/2) and Au (4f5/2), respectively. Notably, the binding energy of Au (4f7/2) showed a negative shift of 0.9 eV compared with 84.0 eV of Au block [35], due to the electron transfer from ZnO to Au [36]. XPS and XRD characterization further confirmed the successful synthesis of ZnO-Au composites for binding to the DNA.
The stepwise modification of the electrochemical aptasensor was characterized using EIS (Figure S3B). Results showed that the EIS of ZnO (curve c) enlarged significantly with a bigger Rct, compared with GCE (curve a). This result suggests that ZnO hinder the charge transfer from the redox probe of [Fe(CN)6]3−/4− to the GCE surface due to the poor conductivity of ZnO. While for the Au–ZnO/GCE (curve b), an obvious decrease of the diameter of the semicircle (1654 Ω) was observed, implying that the existence of AuNPs could improve electrical conductivity and accelerate the electron transfer rate [37]. Previous study has shown that Au NPs formed on oxide supports are catalytically more active for oxidation reactions because of the polarization toward the support caused by Au NPs at the interface [38]. Then, the cDNA was bonded to the electrode by gold-sulfur bonds, leading to the increase of Rct value (2114 Ω) due to the negative charge from the phosphate backbone of nucleic acid [39]. After MCH modification of the electrode the Rct value (2340 Ω) increased, which indicated that the transfer of electroactive ions ([Fe(CN)6]3−/4−) to the electrode interface was impeded. The Rct (3253 Ω) increased upon the complementation of Aptamer and cDNA to form double-stranded DNA. As one active substance, MB (Rct = 2710 Ω) may facilitate the charge transfer [39]. However, after the modified electrode interacted with the OTA, the aptamer carrying OTA detached from the electrode surface and the Rct value was reduced (2534 Ω). This phenomenon may be ascribed to the reduction of steric hindrance effect. It appeared that the changes of EIS demonstrate the success of each modification step.

3.3. Optimization

In order to improve the analytical performance of the electrochemical aptasensor, the incubation time of aptamer/MCH/cDNA/nafion@ZnO-Au/GCE in MB solution and the incubation time of MB/aptamer/MCH/cDNA/nafion@ZnO-Au/GCE in electrolyte containing OTA were investigated. As the incubation time of aptamer/MCH/cDNA/nafion@ZnO-Au/GCE in MB solution increases, the value of ∆I = IOTA − Ino OTA decreases gradually (Figure S4A). Therefore, 40 min was selected as the optical incubation time for the modified electrode in MB solution. Analogously, 20 min was selected as the optimal incubation time for the functional electrode in electrolyte containing OTA (Figure S4B).

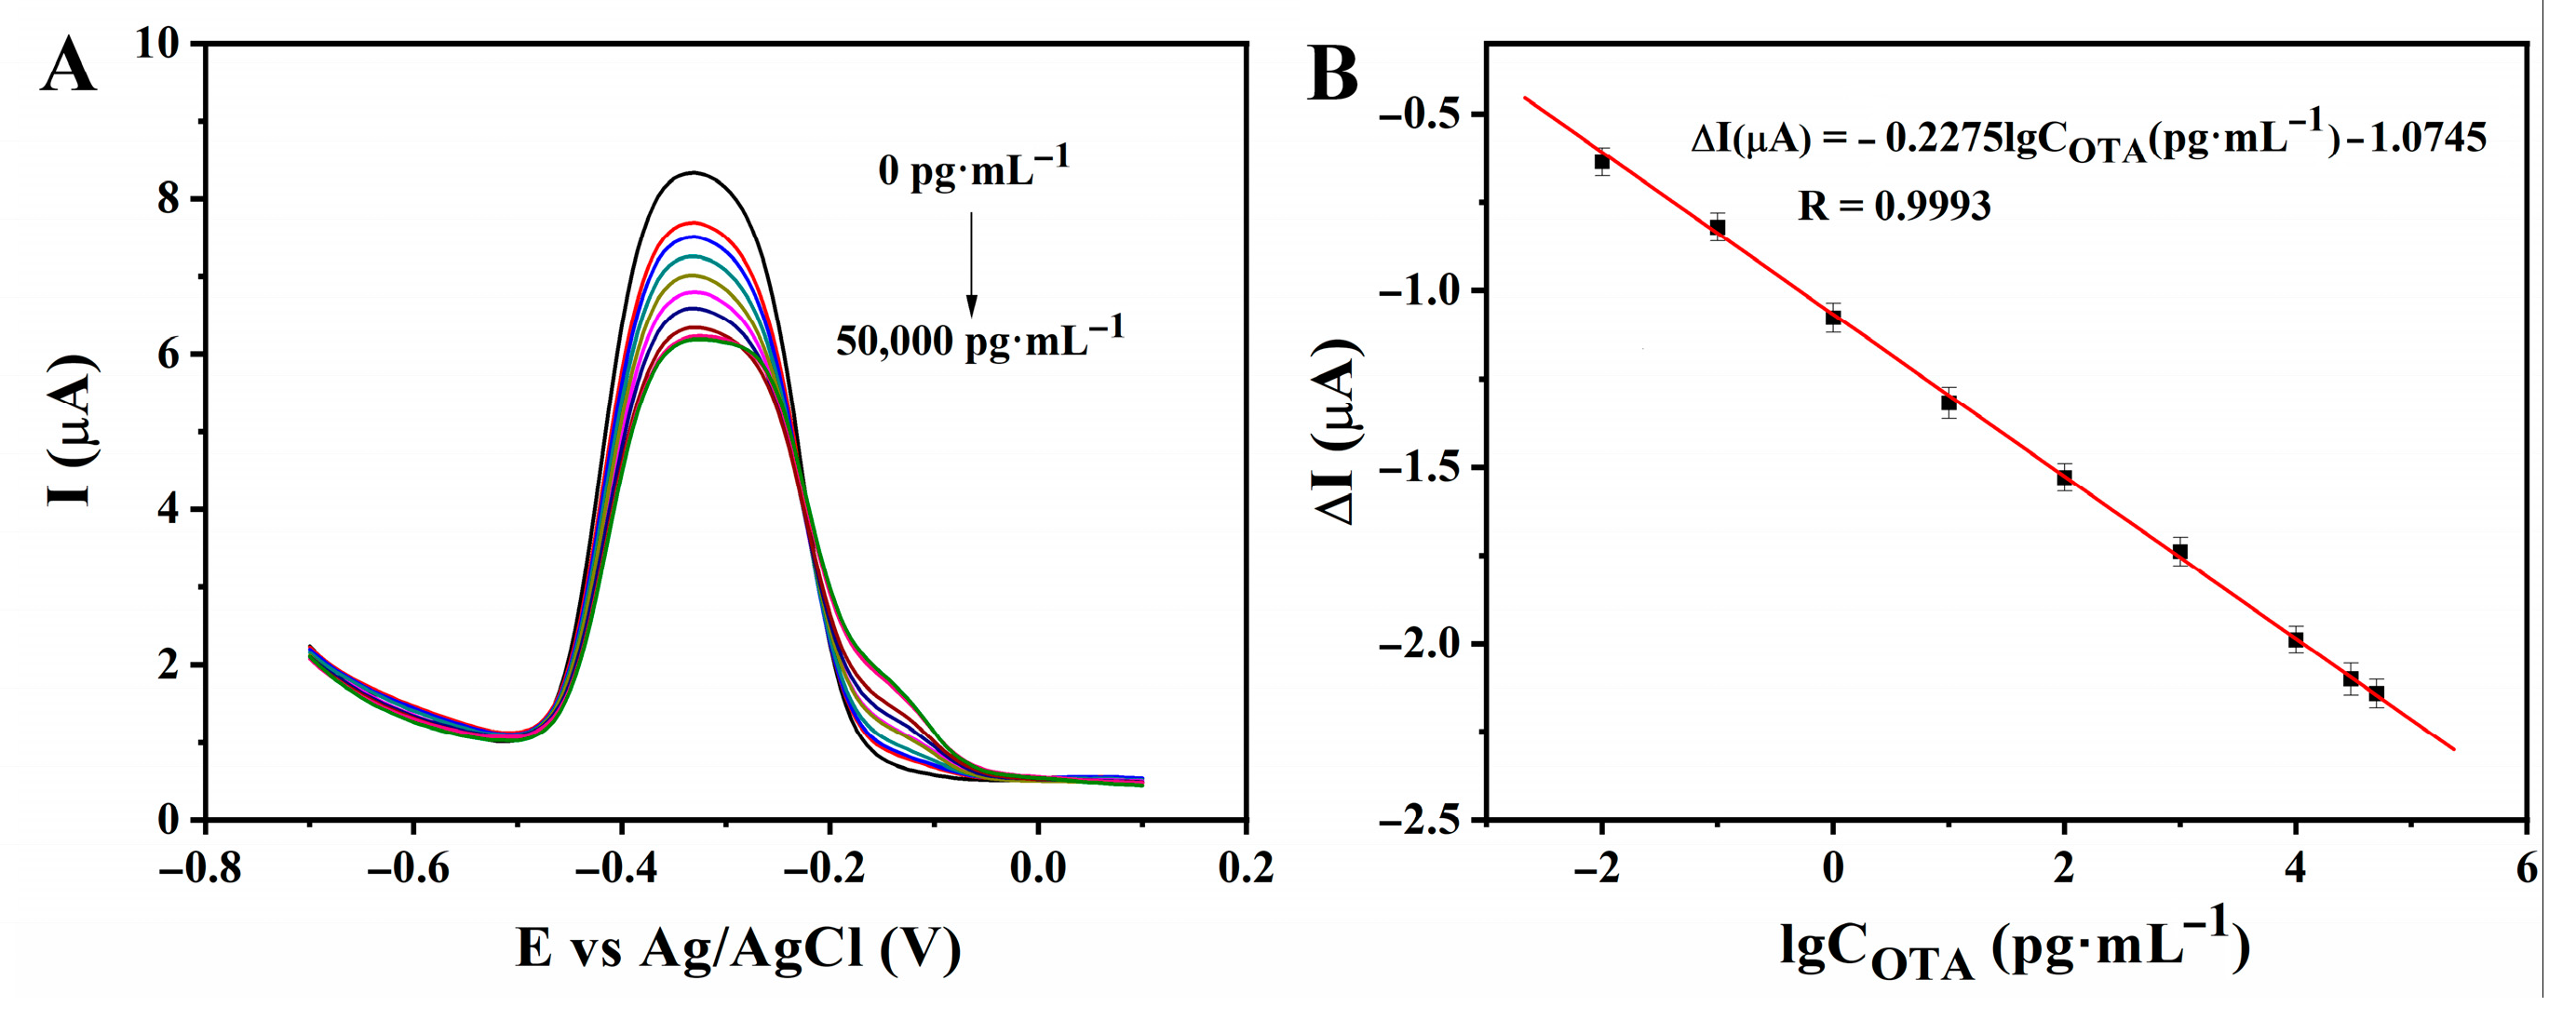
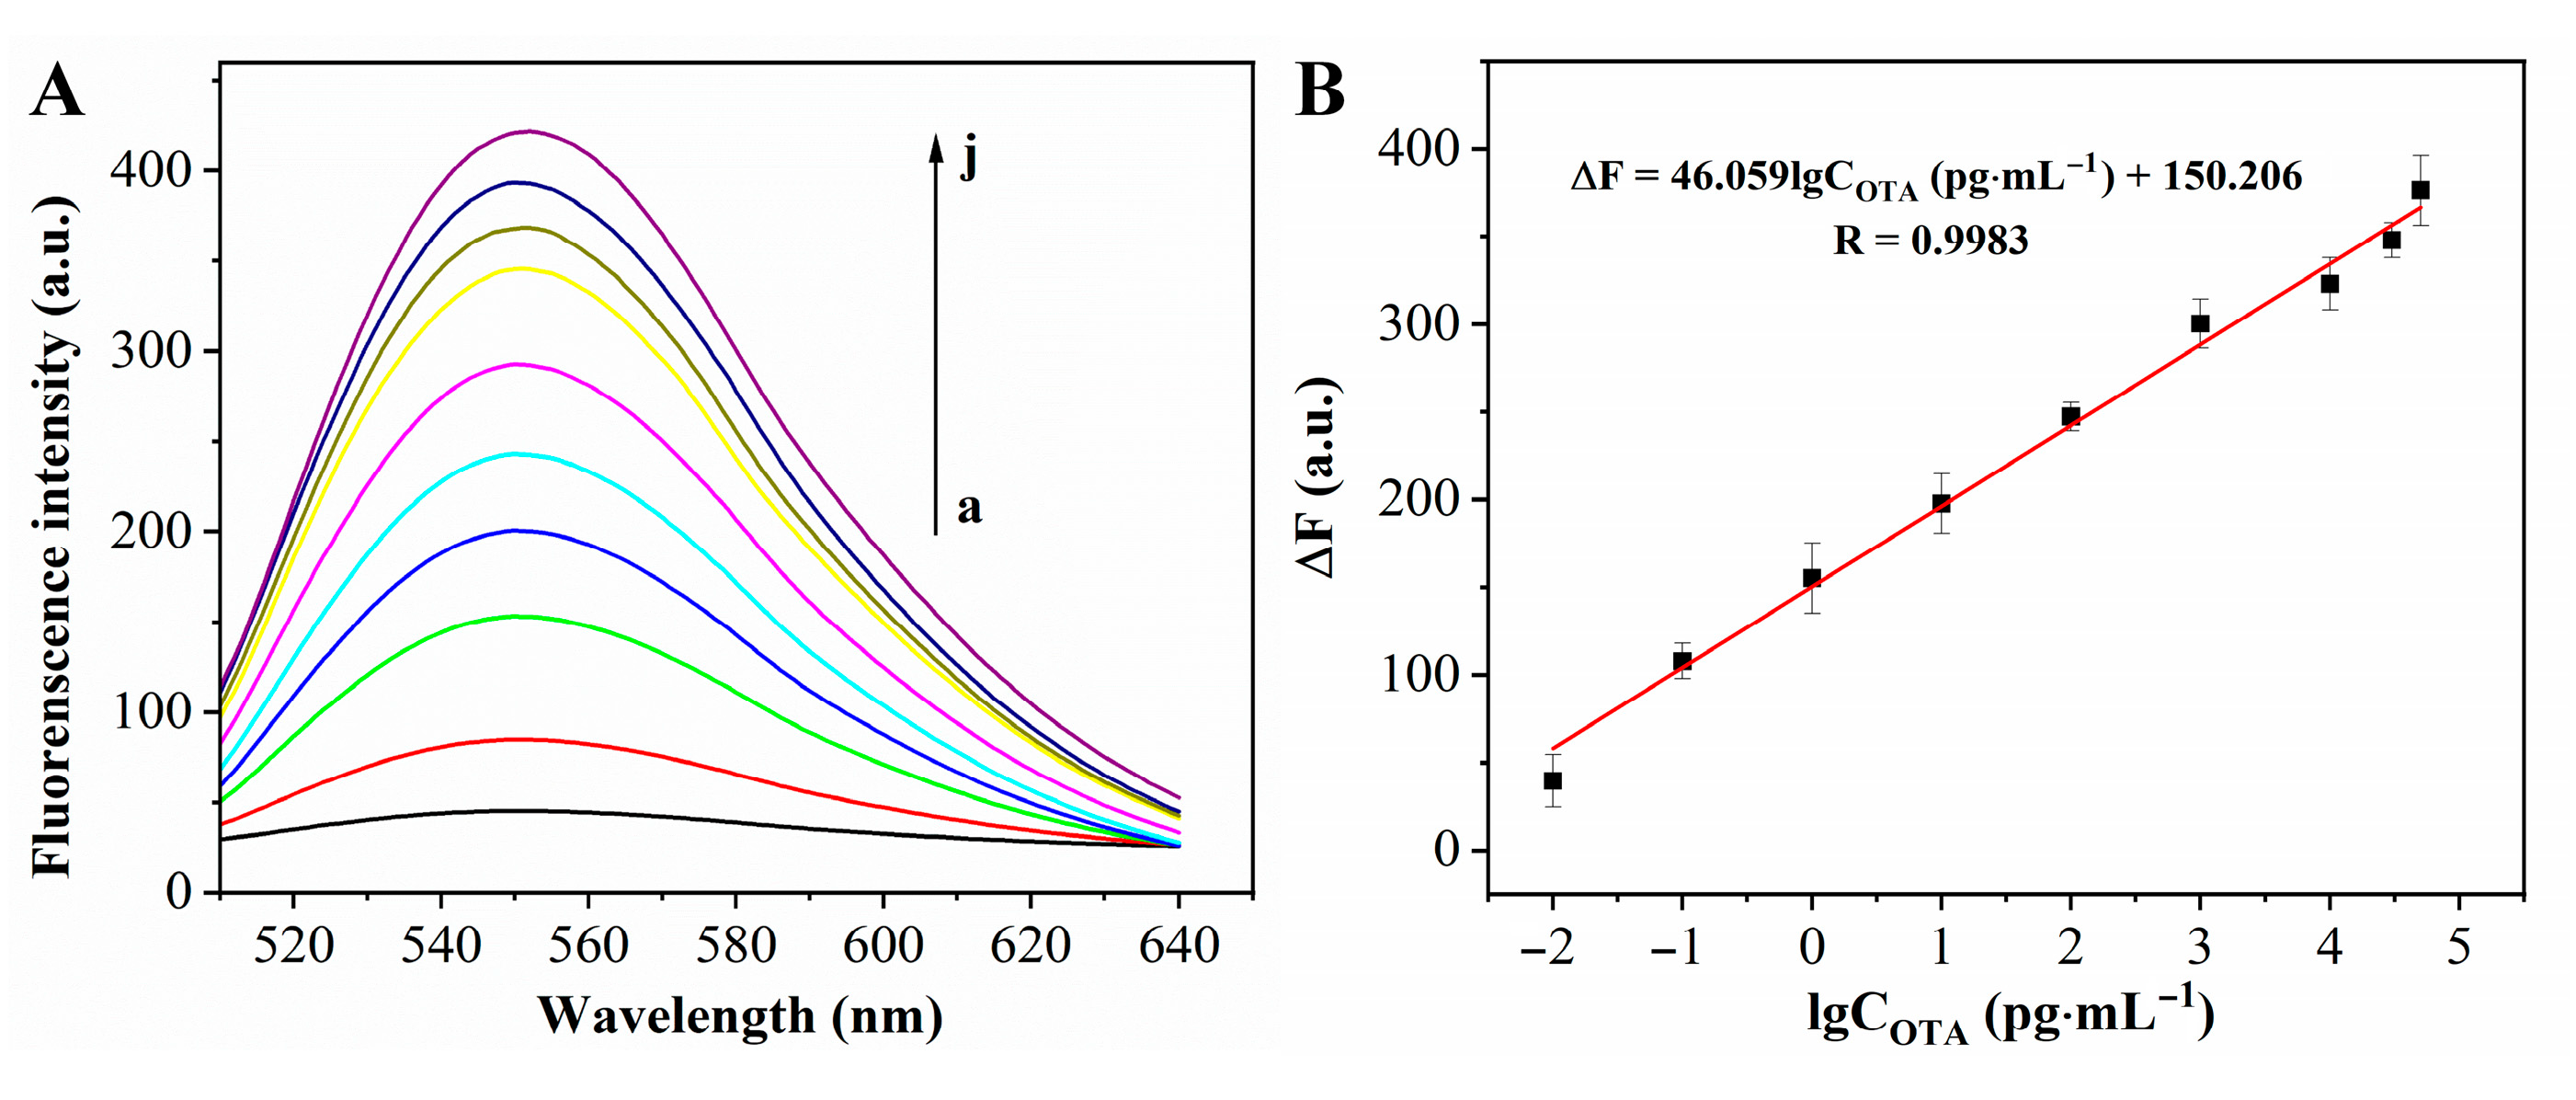
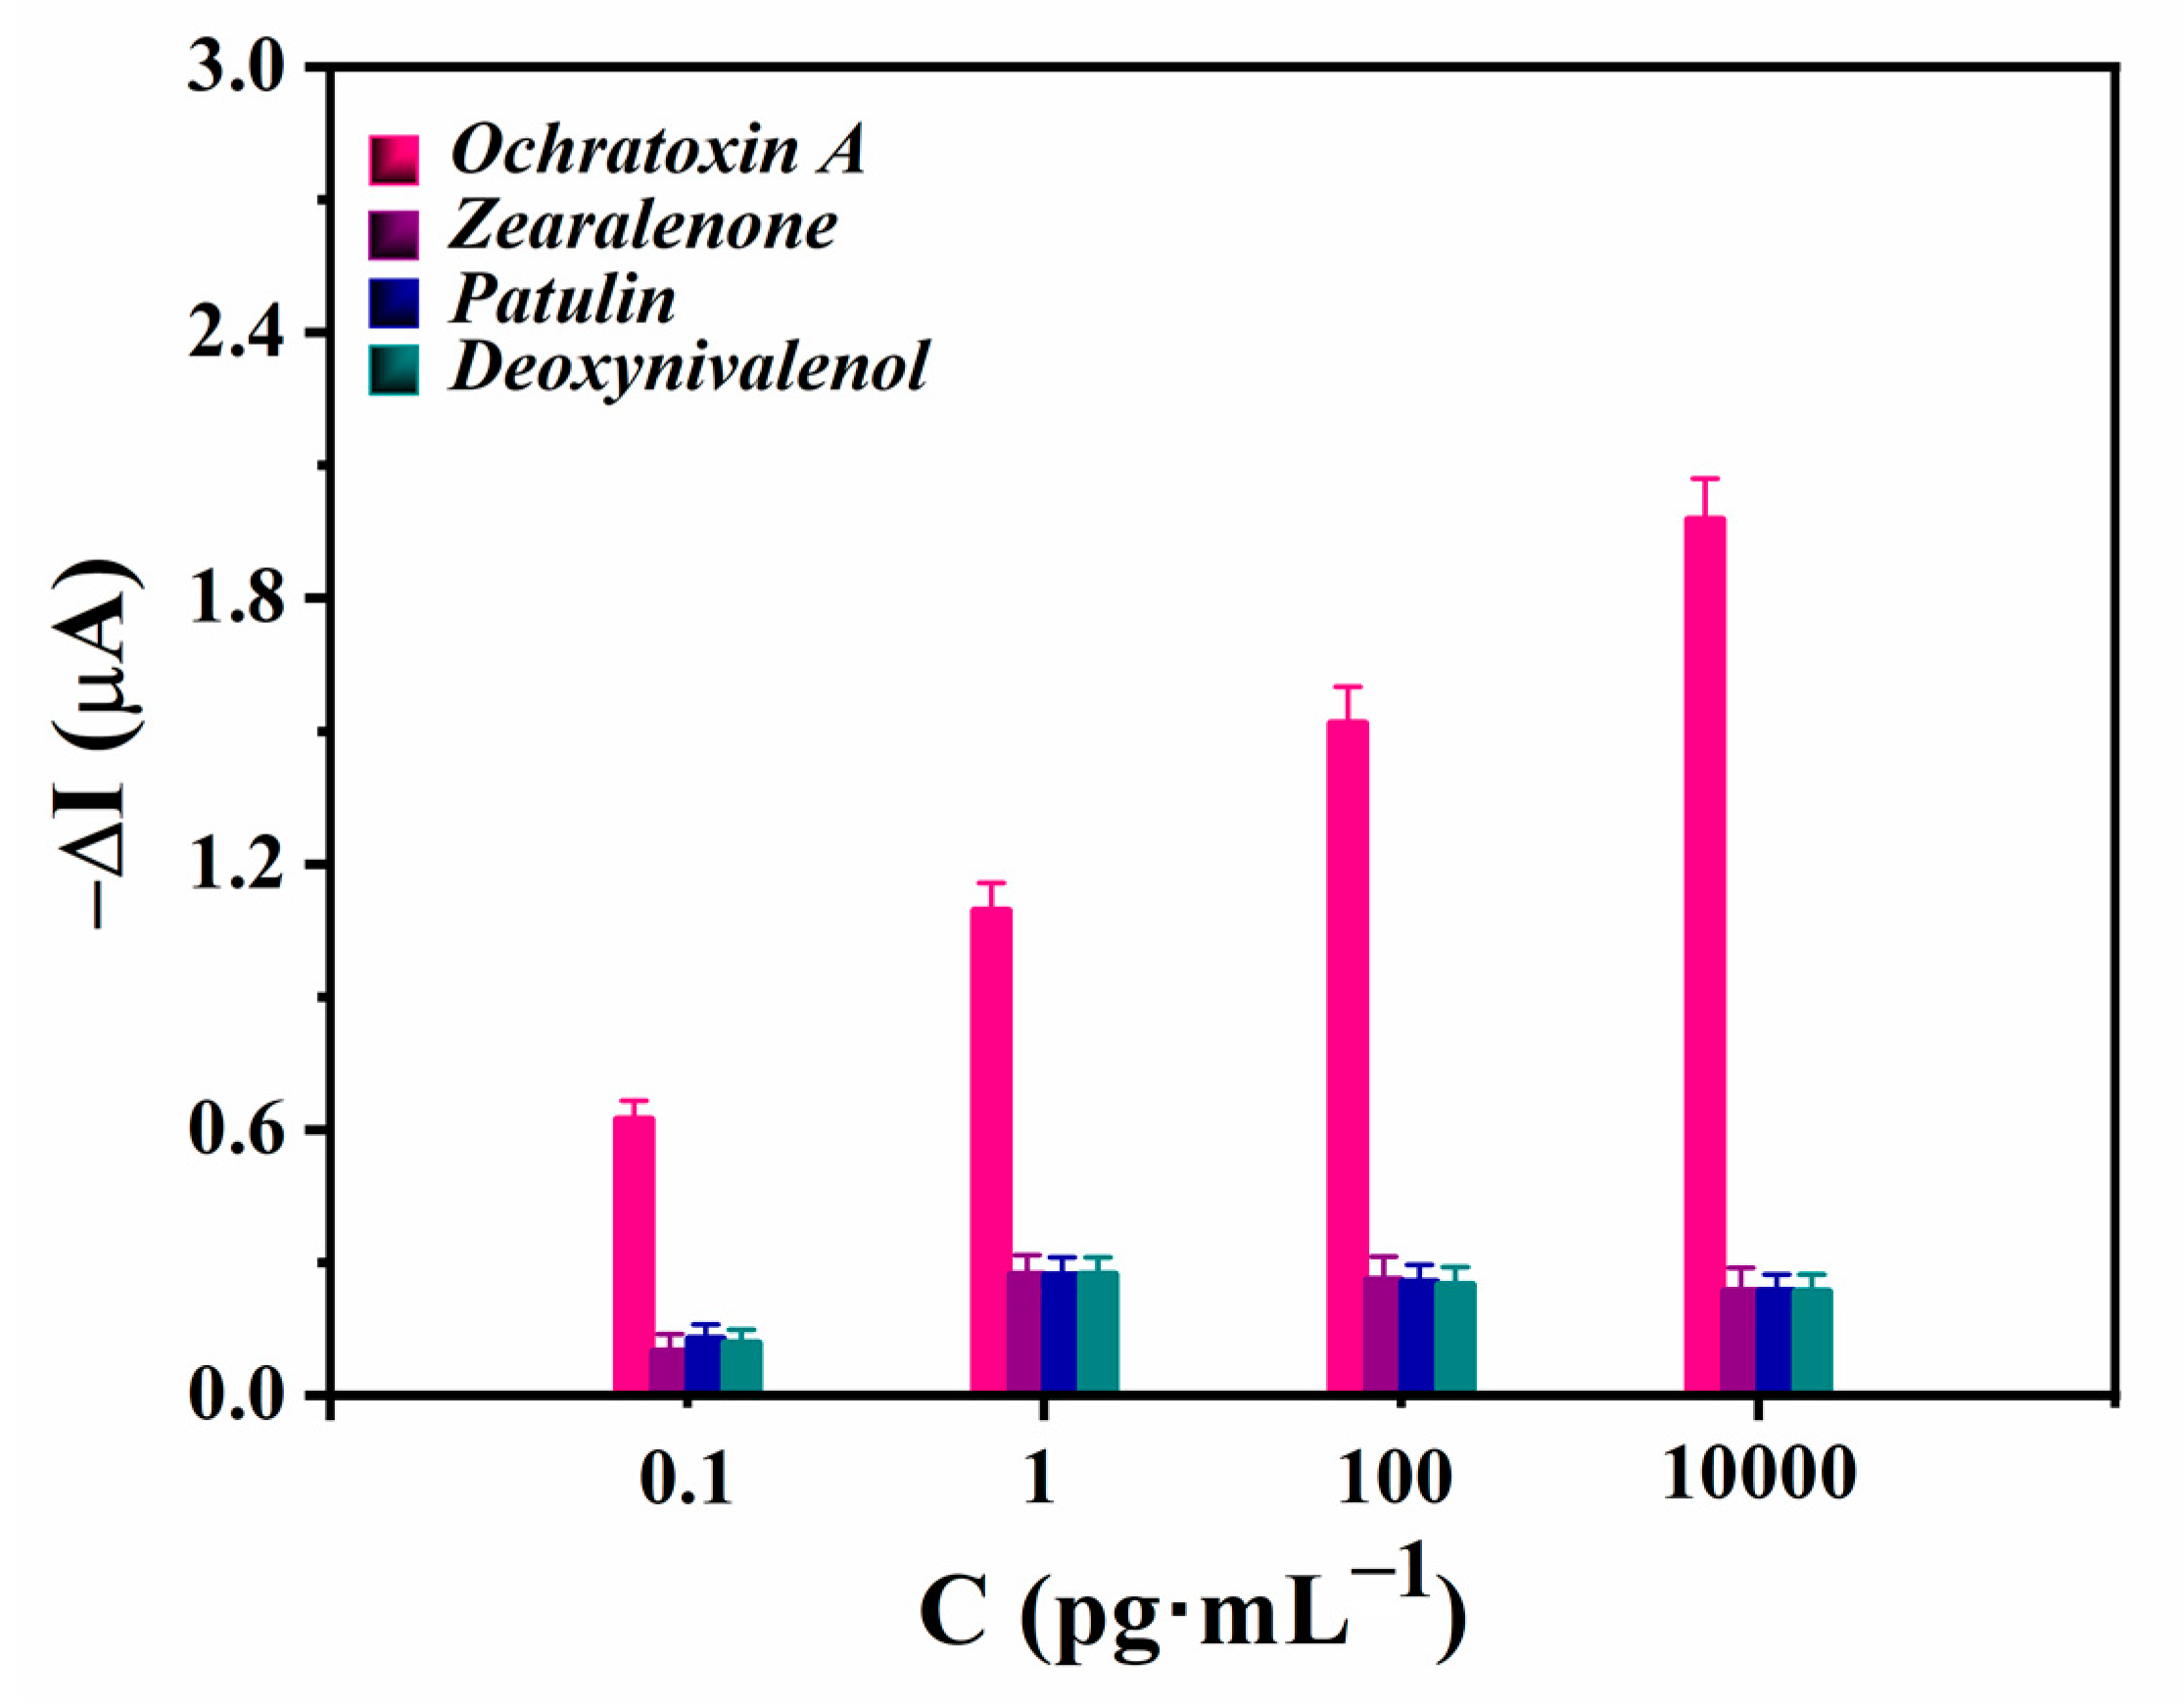
3.4. Analytical Performance

Dynamic Range and Limit of Detection. Under optimized conditions, DPV was used to detect the range of OTA concentrations (0–50,000 pg·mL−1) due to its high sensitivity. In Figure 3A, the reduction peak current of MB gradually decreased as concentration OTA increased. Figure 3B showed a clear linear relationship between ∆I and lgCOTA in the range of 0.1–30,000 pg·mL−1 with a detection limit of 0.05 pg·mL−1 (S/N = 3:1). The linear regression equations were ΔI (μA) = −0.2275lgCOTA(pg·mL−1) − 1.0745, with the regression coefficient of 0.9993. The error percentages for each determination in Figure 3 were in the range of 94.3% to 108.4%. To further verify the proof of concept of the OTA sensing, fluorescence measurements during the capture of OTA by the aptamer and release of the OTA-aptamer conjugates were also designed. The aptamer and cDNA were modified with the BHQ2 quencher and Cy3 fluorophore, respectively. In the absence of OTA, BHQ2-aptamer is quenched by Cy3-cDNA, due to the formation of the double-strand DNA, and the fluorescence is turned off. In the presence of OTA, the BHQ2-aptamer capturing OTA releases from the double-strand DNA, causing the regeneration of fluorescence of the Cy3-cDNA. The fluorescence measurement showed that the fluorescence intensity in the solution increased along with the increasing OTA concentration (Figure 4A). The calibration curve of fluorescence intensity as a function of concentration (0–50,000 pg·mL−1) was plotted. Figure 4B is the linear relationship between the fluorescence intensity and the logarithm of OTA concentration within the range of 20–500 nM (R2 = 0.990). The calculated detection limit was 16.5 nM. The above results further proved the flexibility of the proposed sensing concept and exhibited even better sensing ability for OTA determination.
Compared with other OTA sensors, the analytical performance of the aptasensor was better than other kinds of methods for OTA determination (Table 1). Specially, the excellent sensitivity of the aptasensor was mainly attributed to the superior material utilized and electroactive molecules attached to nucleic acid structure. Some materials have been applied for the detection of OTA, such as carbon nanomaterials, metal-organic framework materials, quantum dots, metal/metal oxide nanomaterials, and upconversion nanomaterials (Table 1). Different types of materials have their own outstanding properties. Among these materials, ZnO-Au composites have outstanding properties with high specific surface area, easy functionalization, physicochemical stability, and high electronic conductivity that enable sensors based on this material to perform highly sensitive OTA analysis.
The specificity is an extremely critical parameter for a designed aptasensor. To evaluate the specificity of the aptasensor, DPV was performed on the electrolyte (including OTA) with interference substances. ZEA, PAT, and DON were selected as interference substances due to reports that they coexist with OTA in food [39]. As shown in Figure 5, there was no significant signal in the presence of low concentration interference (0.1 pg·mL−1). The interference substances (>0.1 pg·mL−1) produced a constant signal background, which may be related to the low nonspecific recognition of the aptamer and the adsorption on the electrode surface. The interference substances (1 pg·mL−1) all produced less than 25% of the OTA signal. High concentrations (100 pg·mL−1 or 10,000 pg·mL−1) of interfering substances produce less than 12% OTA signal. Therefore, we can guarantee that the biosensor is able to detect OTA in the presence of ZEA, PAT, and DON. Stability over time and repeatability are essential factors in the practical application of aptasensors. The functionalized electrodes were stored at 4 °C for 18 days to test the stability of the sensor. The developed biosensor can retain more than 92.6% of the initial response signal, which was probably due to the partial decomposition and conjugation of the aptamers on the electrode surface. In addition, five parallel experiments were performed to detect 1 pg·mL−1 OTA for testing the repeatability of the sensing system. The relative standard deviation (RSD) was 3.8%, indicating the good repeatability of the biosensor. Due to aptamer specific capture OTA, the original dsDNA on the electrode is changed into ssDNA, thereby leading the regeneration of the cDNA linked ZnO-Au modified electrode. After that, the aptamer of the capture probe can once again bind to the cDNA-linked, ZnO-Au modified electrode for reuse. Results showed that the aptasensor only exhibited a slight downward trend in terms of performance after five times of reuse. The relative weak reproducibility and troublesome electron-transfer pathways of electrochemical sensing are still the main drawbacks that should be improved, especially for the application in complex food samples. However, it is expected that further miniaturization, including implantable devices, the functionalization of novel nanomaterials that contain more homogeneously binding sites with high affinity for the targets, as well as the combination of ink printing of nanomaterials, will solve the above challenges.
To evaluate the feasibility of the sensing system, the modified electrode examined OTA in a real sample. We selected wine and beer that are susceptible to OTA infection during actual processing as actual samples. A series of concentrations of OTA (0.1–1000 pg·mL−1) were added to the processed samples for recovery experiments. The results of the recovery experiment are shown in Table 2. The recovery rate measured was in the range of 102.2–110%, and the RSD varied from 22.7% to 4.3%. It was worth noting that the recovery rate in actual samples was above 100%, which may be correlated with the nonspecific adsorption of the matrix. The results proved that this sensor can be used for OTA analysis in wine and beer samples. To further confirm the obtained accuracy and validity, the results were compared to the gold standard HPLC method and ELISA method. The recovery rate spiked samples for HPLC ranged from 98.6% to 103.8%, with an RSD of less than 4.0% (Table S1). Thus, the designed aptasensor enabled the effective quantitative detection of OTA in actual samples.

4. Conclusions

In a nutshell, we designed an electrochemical biosensor reliant on ZnO-Au composites and targets induced the changes in the interaction between methylene blue and nucleic acids. The MB/aptamer/MCH/cDNA/nafion@ZnO-Au modified GCE provides high specific surface area, favorable conductivity, high selectivity, excellent sensitivity, long-term stability, and favorable repeatability. The biosensor has achieved OTA analysis in actual samples. Moreover, applications of this setup are not limited to OTA detection and are expected to be used as a template to detect other toxins.

Supplementary Materials

The following supporting information can be downloaded at: https://www.mdpi.com/article/10.3390/pr11030864/s1, Figure S1: The CV curves at different scanning rates from 10 to 200 mV s−1 for the prepared electrode (A) before and (B) after the release of MB. (C) Plots of peak currents vs. scan rates corresponding to (A). (D) Plots of peak currents vs. square root of scan rates corresponding to (B); Figure S2: UV-visible absorption spectra of MB: (a) 10 μM pure MB, (b) after incubation with 10 μM MB and 0.5 μM dsDNA, (c) after incubation with 10 μM MB and 0.5 μM ssDNA; Figure S3: (A) Electrochemical impedance spectroscopy for bare GCE, ZnO-Au/GCE, and ZnO/GCE (a–c) in 1.0 mM [Fe(CN)6]−3/−4 + 0.1 M KCl solution through applying initial potential of 0.27 V vs Ag/AgCl reference electrode and an amplitude of 5 mV in a frequency range of 10−2–105 Hz. The insertion diagram is an equivalent circuit model of the EIS analysis. (B) Electrochemical impedance spectroscopy after each fabrication step recorded: (a’) ZnO-Au/GCE, (b’) nafion/ZnO-Au/GCE, (c’) cDNA/nafion/ZnO-Au/GCE, (d’) MCH/cDNA/nafion/ZnO-Au/GCE, (e’) OTA/MB/aptamer/(d’), (f’) MB/aptamer/(d’), (g’) aptamer/(d’).; Figure S4: Optimization experiment of (A) incubation time of aptamer/MCH/cDNA/nafion@ZnO-Au/GCE in 20 μM MB and (B) incubation time of MB/aptamer/MCH/cDNA/nafion@ZnO-Au/GCE in 0.1 pg·mL−1 OTA; Table S1: Recovery assay data of electrochemical aptasensor, HPLC and ELISA.

Author Contributions

Writing, investigation, original draft preparation, S.Z.; investigation and discussion, Y.W. revision, supervision, discussion and project administration, T.Y. and Q.S. All authors have read and agreed to the published version of the manuscript.

Funding

This work was financially supported by the National Key Research and Development Program of China (2019YFC1606703, Ministry of Science and Technology of China), the Education Department of Shaanxi Province (22JK0354, Education Department of Shaanxi Province, China), Youth Talent Lift Program of Shaanxi Association for Science and technology (20220320, Education Department of Shaanxi Province, China), Subject Innovation Team of Shaanxi University of Chinese Medicine (2019-YL10, Shaanxi University of Chinese Medicine, China), the Natural Science Foundation of Shaanxi Province (2023-YBSF-245, Shaanxi Science and Technology Department, China).

Data Availability Statement

Not applicable.

Conflicts of Interest

The authors declare no competing financial interest.

References

  1. Li, X.J.; Ma, W.; Ma, Z.Y.; Zhang, Q.H.; Li, H.M. Recent progress in determination of ochratoxin A in foods by chromatographic and mass spectrometry methods. Crit. Rev. Food Sci. Nutr. 2021, 13, 1–32. [Google Scholar] [CrossRef] [PubMed]
  2. Heussner, A.H.; Bingle, L.E.H. Comparative ochratoxin toxicity: A review of the available data. Toxins 2015, 7, 4253–4282. [Google Scholar] [CrossRef] [PubMed] [Green Version]
  3. Singh, A.K.; Lakshmi, G.B.V.S.; Dhiman, T.K.; Kaushik, A.; Solanki, P.R. Bio-Active free direct optical sensing of aflatoxin B1 and ochratoxin A using a manganese oxide nano-system. Front. Nanotechnol. 2021, 2, 621681. [Google Scholar] [CrossRef]
  4. GB 2761-2017; National Standards of the People’s Republic of China. Mycotoxins in Food Limited. Standards Press of China: Beijing, China, 2017.
  5. Alizadeh, N.; Hashemi, J.; Shahdost-Fard, F. Spectrofluorimetric study of the complexation of ochratoxin A and Cu2+: Towards the hybrid fluorimetric sensor and visual detection of ochratoxin A in wheat flour samples from farm to fork. Food Chem. 2021, 350, 129204. [Google Scholar] [CrossRef] [PubMed]
  6. Moez, E.; Noel, D.; Brice, S.; Benjamin, G.; Pascaline, A.; Didier, M. Aptamer assisted ultrafiltration cleanup with high performance liquid chromatography-fluorescence detector for the determination of OTA in green coffee. Food Chem. 2020, 310, 125851. [Google Scholar] [CrossRef]
  7. Liu, X.; Tang, Z.W.; Duan, Z.H.; He, Z.Y.; Shu, M.; Wang, X.X.; Gee, S.J.; Hammock, B.D.; Xu, Y. Nanobody-based enzyme immunoassay for ochratoxin A in cereal with high resistance to matrix interference. Talanta 2017, 164, 154–158. [Google Scholar] [CrossRef] [Green Version]
  8. Yuan, W.; Lu, L.X.; Lu, Y.C.; Xiong, X.; Li, Y.; Cui, X.W.; Liu, Y.J.; Xiong, X.H. Synergistic effects of DNA structure for ultrasensitive detecting OTA in grains. Food Anal. Methods 2021, 14, 2308–2316. [Google Scholar] [CrossRef]
  9. Thévenot, D.R.; Toth, K.; Durst, R.A.; Wilson, G.S. Electrochemical biosensors: Recommended definitions and classification. Biosens. Bioelectron. 2001, 16, 121–131. [Google Scholar] [CrossRef]
  10. Beluomini, M.A.; Silva, J.L.; Sá, A.C.D.; Buffon, E.; Pereira, T.C.; Stradiotto, N.R. Electrochemical sensors based on molecularly imprinted polymer on nanostructured carbon materials: A review. J. Electroanal. Chem. 2019, 840, 343–366. [Google Scholar] [CrossRef]
  11. Sun, X.F.; Chen, H.H.; Wang, S.L.; Zhang, Y.P.; Tian, Y.P.; Zhou, N.D. Electrochemical detection of sequence-specific DNA based on formation of G-quadruplex-hemin through continuous hybridization chain reaction. Anal. Chim. Acta 2018, 1021, 121–128. [Google Scholar] [CrossRef]
  12. Zhao, K.; Quan, X. Carbon-based materials for electrochemical reduction of CO2 to C2+ oxygenates: Recent progress and remaining challenges. ACS Catal. 2021, 11, 2076–2097. [Google Scholar] [CrossRef]
  13. Daviddi, E.; Chen, Z.; Massani, B.B.; Lee, J.; Bentley, C.L.; Unwin, P.R.; Ratcliff, E.L. Nanoscale visualization and multiscale electrochemical analysis of conductive polymer electrodes. ACS Nano 2019, 13, 13271–13284. [Google Scholar] [CrossRef]
  14. Chen, S.B.; Yuan, B.Q.; Liu, G.; Zhang, D.J. Electrochemical sensors based on covalent organic frameworks: A critical review. Front. Chem. 2020, 8, 601044. [Google Scholar] [CrossRef] [PubMed]
  15. Sun, Y.; Li, Y.X.; Wang, N.; Xu, Q.Q.; Xu, L.; Lin, M. Copper-based metal-organic framework for non-enzymatic electrochemical detection of glucose. Electroanalysis 2018, 30, 474–478. [Google Scholar] [CrossRef] [Green Version]
  16. Hu, R.; Zhang, X.; Chi, K.N.; Yang, T.; Yang, Y.H. Bifunctional MOFs-based ratiometric electrochemical sensor for multiplex heavy metal ions. ACS Appl. Mater. Interfaces 2020, 12, 30770–30778. [Google Scholar] [CrossRef] [PubMed]
  17. Sharma, A.; Ahmed, A.; Singh, A.; Oruganti, S.K.; Khosla, A.; Arya, S. Review-recent advances in tin oxide nanomaterials as electrochemical/chemiresistive sensors. J. Electrochem. Soc. 2021, 168, 027505. [Google Scholar] [CrossRef]
  18. Prathap, M.U.A.; Kaur, B.; Srivastava, R. Electrochemical sensor platforms based on nanostructured metal oxides, and zeolite-based materials. Chem. Rec. 2019, 19, 883–907. [Google Scholar] [CrossRef]
  19. Ortiz-Casas, B.; Galdámez-Martínez, A.; Gutiérrez-Flores, J.; Ibañez, A.B.; Panda, P.K.; Santana, G.; Vega, H.A.D.L.; Suar, M.; Rodelo, C.G.; Kaushik, A.; et al. Bio-acceptable 0D and 1D ZnO nanostructures for cancer diagnostics and treatment. Mater. Today 2021, 50, 533–569. [Google Scholar] [CrossRef]
  20. Das, S.; Mukhopadhyay, S.; Chatterjee, S.; Devi, P.S.; Kumar, G.S. Fluorescent ZnO-Au nanocomposite as a probe for elucidating specificity in DNA interaction. ACS Omega 2018, 3, 7494–7507. [Google Scholar] [CrossRef]
  21. Mahajan, H.; Bae, J.; Yun, K. Facile synthesis of ZnO-Au nanocomposites for high-performance supercapacitors. J. Alloys Compd. 2018, 758, 131–139. [Google Scholar] [CrossRef]
  22. Yao, C.J.; Lin, J.M.; Wu, L.; Li, L.Q.; Xu, N.; Sun, J.; Wu, J.D. High visible light photocatalytic activity of ZnO-Au nanocomposites synthesized by a controlled hydrothermal method. Phys. Status Solidi (A) Appl. Mater. Sci. 2021, 218, 2100150. [Google Scholar] [CrossRef]
  23. Ilgu, M.; Nilsen-Hamilton, M. Aptamers in analytics. Analyst 2016, 141, 1551–1568. [Google Scholar] [CrossRef] [Green Version]
  24. Röthlisberger, P.; Hollenstein, M. Aptamer chemistry. Adv. Drug Deliv. Rev. 2018, 134, 3–21. [Google Scholar] [CrossRef]
  25. Zhao, H.Y.; Qiao, X.J.; Zhang, X.L.; Niu, C.; Yue, T.L.; Sheng, Q.L. Simultaneous electrochemical aptasensing of patulin and ochratoxin A in apple juice based on gold nanoparticles decorated black phosphorus nanomaterial. Anal. Bioanal. Chem. 2021, 413, 3131–3140. [Google Scholar] [CrossRef]
  26. Pica, A.; Krauss, I.R.; Parente, V.; Tateishi-Karimata, H.; Nagatoishi, S.; Tsumoto, K.; Sugimoto, N.; Sica, F. Through-bond effects in the ternary complexes of thrombin sandwiched by two DNA aptamers. Nucleic Acids Res. 2017, 45, 461–469. [Google Scholar] [CrossRef] [PubMed] [Green Version]
  27. Wang, X.J.; Wang, W.; Liu, Y.L. Enhanced acetone sensing performance of Au nanoparticles functionalized flower-like ZnO. Sens. Actuators B Chem. 2012, 168, 39–45. [Google Scholar] [CrossRef]
  28. Tabrizi, M.A.; Ferré-Borrull, J.; Marsal, L.F. Remote sensing of Salmonella-specific DNA fragment by using nanoporous alumina modified with the single-strand DNA probe. Sens. Actuators B 2020, 304, 127302. [Google Scholar] [CrossRef]
  29. Mudasir; Wahyuni, E.T.; Tjahjono, D.H.; Yoshioka, N.; Inoue, H. Spectroscopic studies on the thermodynamic and thermal denaturation of the ct-DNA binding of methylene blue. Spectrochim. Acta Part A Mol. Biomol. Spectrosc. 2010, 77, 528–534. [Google Scholar] [CrossRef]
  30. Palinska, A.; Grodzka, A.; Elzanowska, H.; Kepska, B.; Zwierkowska, E.; Achmatowicz, S.; Maj-Zurawska, M. Methylene blue interactions with chromosomal and plasmid DNA on screen-printed carbon electrodes. Electroanalysis 2010, 22, 1306–1313. [Google Scholar] [CrossRef]
  31. Han, N.S.; Kim, D.H.; Lee, J.W.; Kim, J.; Shim, H.S.; Lee, Y.J.; Lee, D.; Song, J.K. Unexpected size effect observed in ZnO-Au composite photocatalysts. ACS Appl. Mater. Interfaces 2016, 8, 1067–1072. [Google Scholar] [CrossRef]
  32. Wang, M.K.; Shen, Y.; Liu, Y.; Wang, T.; Zhao, F.; Liu, B.F.; Dong, S.J. Direct electrochemistry of microperoxidase 11 using carbon nanotube modified electrodes. J. Electroanal. Chem. 2005, 578, 121–127. [Google Scholar] [CrossRef]
  33. Pillai, R.; Preetha, S.; Narasimhamurthy, B.; Lekshmi, I.C. Biosensing of catechol via amperometry using laccase immobilized nickel oxide/graphite modified screen-printed electrodes. Mater. Today Proc. 2022, 62, 5434–5438. [Google Scholar] [CrossRef]
  34. Kochuveedu, S.T.; Oh, J.H.; Do, Y.R.; Kim, D.H. Surface-plasmon-enhanced band emission of ZnO nanoflowers decorated with Au nanoparticles. Chem. Eur. J. 2012, 18, 7467–7472. [Google Scholar] [CrossRef] [PubMed]
  35. Zhang, J.; Liu, X.H.; Wang, L.W.; Yang, T.L.; Guo, X.Z.; Wu, S.H.; Wang, S.R.; Zhang, S.M. Au-functionalized hematite hybrid nanospindles: General synthesis, gas sensing and catalytic properties. J. Phys. Chem. C 2011, 115, 5352–5357. [Google Scholar] [CrossRef]
  36. Liu, X.H.; Zhang, J.; Wang, L.W.; Yang, T.L.; Guo, X.Z.; Wu, S.H.; Wang, S.R. 3D hierarchically porous ZnO structures and their functionalization by Au nanoparticles for gas sensors. J. Mater. Chem. 2011, 21, 349–356. [Google Scholar] [CrossRef]
  37. Fang, L.X.; Huang, K.J.; Zhang, B.L.; Liu, Y.J.; Zhang, Q.Y. A label-free electrochemistry biosensor based flower-like 3-dimensional ZnO superstructures for detection of DNA arrays. New J. Chem. 2014, 38, 5918–5924. [Google Scholar] [CrossRef]
  38. Liu, X.W. Selective growth of Au nanoparticles on (111) facets of Cu2O microcrystals with an enhanced electrocatalytic property. Langmuir 2011, 27, 9100–9104. [Google Scholar] [CrossRef]
  39. Rivas, L.; Mayorga-Martinez, C.C.; Quesada-Gonzalez, D.; Zamora-Gálvez, A.; Escosura-Muñiz, A.D.L.; Merkoçi, A. Label-free impedimetric aptasensor for ochratoxin-A detection using iridium oxide nanoparticles. Anal. Chem. 2015, 87, 5167–5172. [Google Scholar] [CrossRef]
  40. Cao, J.L.; Kong, W.J.; Zhou, S.J.; Yin, L.H.; Wan, L.; Yang, M.H. Molecularly imprinted polymer-based solid phase clean-up for analysis of ochratoxin A in beer, red wine, and grape juice. J. Sep. Sci. 2013, 36, 1291–1297. [Google Scholar] [CrossRef]
  41. Cina, M.; Ponce, M.D.; Martinez, L.D.; Cerutti, S. Development of a novel UHPLC-MS/MS method for the determination of ochratoxin A in tea. Heliyon 2021, 7, e06663. [Google Scholar] [CrossRef]
  42. Cina, M.; Ponce, M.D.V.; Fernandez, L.; Cerutti, S. A green approach for Ochratoxin A determination in coffee infusions. J. Food Comp. Anal. 2022, 114, 104777. [Google Scholar] [CrossRef]
  43. Streit, B.; Czabany, T.; Weingart, G.; Marchetti-Deschmann, M.; Prasad, S. Toolbox for the Extraction and Quantification of Ochratoxin A and Ochratoxin Alpha Applicable for Different Pig and Poultry Matrices. Toxins 2022, 14, 432. [Google Scholar] [CrossRef] [PubMed]
  44. Zhang, B.; Liu, W.T.; Liu, Z.J.; Fu, X.L.; Du, D.L. Establishment of a Chemiluminescence Immunoassay Combined with Immunomagnetic Beads for Rapid Analysis of Ochratoxin A. J. Aoac. Int. 2022, 105, 346–351. [Google Scholar] [CrossRef]
  45. Li, D.Y.; Xia, H.Y.; Sun, Y.Y.; Liu, W.J.; Liu, W.; Yu, J.N.; Jing, G.X.; Zhang, J.; Li, W.S. Colorimetric aptasensor for the sensitive detection of ochratoxin A based on a triple cascade amplification strategy. Anal. Chim. Acta 2022, 1237, 340616. [Google Scholar] [CrossRef] [PubMed]
  46. Wang, H.; Chen, L.; Li, M.; She, Y.X.; Zhu, C.; Yan, M.M. An Alkyne-Mediated SERS Aptasensor for Anti-Interference Ochratoxin A Detection in Real Samples. Foods 2022, 11, 3407. [Google Scholar] [CrossRef]
  47. Wu, S.; Liu, L.; Duan, N.; Wang, W.; Yu, Q.; Wang, Z. A test strip for ochratoxin A based on the use of aptamer-modified fluorescence upconversion nanoparticles. Microchim. Acta 2018, 185, 497. [Google Scholar] [CrossRef]
  48. Liu, M.; Liu, S.; Ma, Y.; Li, B. Construction of a fluorescence biosensor for ochratoxin A based on magnetic beads and exonuclease III-assisted DNA cycling signal amplification. Anal. Methods 2022, 14, 734–740. [Google Scholar] [CrossRef]
  49. Xiao, Y.; Zhang, X.P.; Ma, L.Y.; Fang, H.J.; Yang, H.L.; Zhou, Y. Fluorescence and absorbance dual-mode immunoassay for detecting Ochratoxin A. Spectrochim. Acta A Mol. Biomol. Spectrosc. 2022, 279, 121440. [Google Scholar] [CrossRef]
  50. Li, L.; Liu, X.; He, S.; Cao, H.; Su, B.; Huang, T.; Chen, Q.; Liu, M.; Yang, D.P. Electrochemiluminescence Immunosensor Based on Nanobody and Au/CaCO3 Synthesized Using Waste Eggshells for Ultrasensitive Detection of Ochratoxin A. ACS Omega 2021, 6, 30148–30156. [Google Scholar] [CrossRef] [PubMed]
  51. Liu, C.; Guo, Y.; Luo, F.; Rao, P.; Fu, C.; Wang, S. Homogeneous Electrochemical Method for Ochratoxin A Determination Based on Target Triggered Aptamer Hairpin Switch and Exonuclease III-Assisted Recycling Amplification. Food Anal. Methods 2017, 10, 1982–1990. [Google Scholar] [CrossRef]
  52. Sun, A.L.; Zhang, Y.F.; Sun, G.P.; Wang, X.N.; Tang, D. Homogeneous electrochemical detection of ochratoxin A in foodstuff using aptamer-graphene oxide nanosheets and DNase I-based target recycling reaction. Biosens. Bioelectron. 2017, 89, 659–665. [Google Scholar] [CrossRef] [PubMed]
  53. Tang, J.; Huang, Y.; Cheng, Y.; Huang, L.; Zhuang, J.; Tang, D. Two-dimensional MoS2 as a nano-binder for ssDNA: Ultrasensitive aptamer based amperometric detection of Ochratoxin A. Microchim. Acta 2018, 185, 162. [Google Scholar] [CrossRef] [PubMed]
  54. Wang, X.Y.; Shan, Y.Q.; Gong, M.; Jin, X.; Lv, L.; Jiang, M.; Xu, J. A novel electrochemical sensor for ochratoxin A based on the hairpin aptamer and double report DNA via multiple signal amplification strategy. Sens. Actuators B 2019, 281, 595–601. [Google Scholar] [CrossRef]
  55. Kunene, K.; Weber, M.; Sabela, M.; Voiry, D.; Kanchi, S.; Bisetty, K.; Bechelany, M. Highly-efficient electrochemical label-free immunosensor for the detection of ochratoxin A in coffee samples. Sens. Actuators B 2020, 305, 127438. [Google Scholar] [CrossRef]
  56. Hu, Y.; Xie, H.Y.; Hu, J.Y.; Yang, D.T. Disposable electrochemical aptasensor based on graphene oxide-DNA complex as signal amplifier towards ultrasensitive detection of ochratoxin A. Micromachines 2022, 13, 834. [Google Scholar] [CrossRef]
Scheme 1. Schematic illustration of the fabrication steps: (A) Sensing roadmap; (B) OTA sensing based on ZnO-Au composites/aptamer assembled on GCE.
Processes 11 00864 sch001
Figure 1. (A,B) SEM images of ZnO materials at low and high magnification; (C) SEM images of ZnO-Au composites; (D) Local magnification image of ZnO-Au composites; (E) FTIR spectra and (F) UV-visible absorption spectra of ZnO flowers and ZnO-Au composites.
Processes 11 00864 g001
Figure 2. (A) XRD patterns of ZnO and ZnO-Au; (B) The full XPS spectrum; (CE) Fine spectrum of XPS: Zn region, O region and Au region. The fitted peaks in regions (CE) are performed by Gaussian fitting.
Processes 11 00864 g002
Figure 3. (A) Differential pulse voltammograms of a series of OTA concentrations (0, 0.01, 0.1, 1, 10, 100, 1000, 10,000, 30,000, 50,000 pg·mL−1) using MB/Apt/MCH/cDNA/ZnO-Au/GCE were carried out under optimal conditions. (B) Calibration curve of anodic current (n = 5) obtained from (A) showing a linear range from 0.1 to 30,000 pg·mL−1.
Processes 11 00864 g003
Figure 4. (A) Fluorescence spectra of the OTA-aptamer conjugates with different concentrations of OTA (0, 0.01, 0.1, 1, 10, 100, 1000, 10,000, 30,000, 50,000 pg·mL−1). (B) Calibration curve of ∆F (n = 3) obtained from (A) showing a linear range from 0.1 to 30,000 pg·mL−1.
Processes 11 00864 g004
Figure 5. ΔI values for the selectivity of the Ochratoxin A aptasensor against zearalenone, patulin, and deoxynivalenol for different concentrations.
Processes 11 00864 g005
Table 1. List of the analytical performances of the proposed sensor with other kinds of methods for OTA determination.
Detection MethodMaterialReal SampleLinear Range
(pg·mL−1)
LOD (pg·mL−1)Reference
LCNABeer, wine, and juice1000–50,00025[40]
UHPLC-MS/MSNATea500–70,000,000500[41]
UHPLC-(ESI+)-MS/MSNACoffee beverages300–70,000300[42]
LC-MS/MSNAPig and poultry matrices250–250,0001000 [43]
Chemiluminescence
method
Anti-OTA antibodies-magnetic beadsGrains5–4052.05 [44]
Colorimetric methodG-quadruplex/hemin DNAzymeRice0.404–40.43.5[45]
Surface-enhanced Raman spectroscopyFe3O4 NPsSoybean, grape, and milk40.4–16,16012[46]
Fluorescence methodUCNPsBeer and wheat5000–100,0001860 [47]
Fluorescence methodMagnetic beads- exonucleaseWheat and corn500–75,00028[48]
Fluorescence and absorbance dual-mode immunoassayG-quadruplex-TMBCorn, oats, and rice49–25,00028 [49]
Electrochemiluminescence methodAu-CaCO3 nanocompositesBeer and wheat10–100,0005.7[50]
Electrochemical methodHairpin Aptamer Wheat1000–500,0000.58 [51]
Electrochemical methodAptamer-graphene oxide nanosheetsWheat10–50,0005.6[52]
Electrochemical methodAptamer-MoS2Wine0.5–10000.23 [53]
Electrochemical methodAptamer-Au nanoparticlesNA1–10000.5[54]
Electrochemical methodOTA Antibody-palladium nanoparticlesCoffee500–200096[55]
Electrochemical methodGO-DNA complexOat and rice0.01–10000.005[56]
Electrochemical methodZnO-Au compositesWine & Beer0.1–30,0000.05This work
LC: liquid chromatography. LC-MS/MS: liquid chromatography–triple quadrupole mass spectrometry. UHPLC-(ESI+)-MS/MS: ultra-high-pressure liquid chromatography/electrospray ionization tandem mass spectrometry. UHPLC-MS/MS: ultra-high-pressure liquid chromatography-mass spectrometry. Graphene oxide: GO. UCNPs: Upconversion nanoparticles. NA: not available.
Table 2. Recovery Assay Data.
Spiked OTA (pg·mL−1)Real Sample
(pg·mL−1)
RSD (n = 5)Recovery (n = 5)
Beverage 1Beverage 2Beverage 1Beverage 2Beverage 1Beverage 2
0.10.110.1063.8%2.7%110.0%106.0%
11.0951.053.6%3.5%109.1%104.5%
100105.2106.03.4%4.2%105.2%106.0%
10001022.01057.03.284.3%102.2%105.7%
Beverage 1: wine; Beverage 2: beer. n: number of measurements.
Disclaimer/Publisher’s Note: The statements, opinions and data contained in all publications are solely those of the individual author(s) and contributor(s) and not of MDPI and/or the editor(s). MDPI and/or the editor(s) disclaim responsibility for any injury to people or property resulting from any ideas, methods, instructions or products referred to in the content.

