Article

The Roof-Fall Mechanism and Support-While-Drilling Technology of the Rectangular Roadway with Layered Roofs and Weak Interlayers

State Key Laboratory of Coal Resources and Safe Mining, School of Mines, China University of Mining and Technology, Xuzhou 221116, China
*
Authors to whom correspondence should be addressed.
Processes 2023, 11(4), 1198; https://doi.org/10.3390/pr11041198
Submission received: 24 February 2023 / Revised: 29 March 2023 / Accepted: 10 April 2023 / Published: 13 April 2023

Abstract

:
Studies have confirmed the poor stability of layered roofs with weak interlayers, and it is necessary to study the roof-caving mechanism of such roadways. A model of a weak interlayer was established to study the influence of the layer position and horizontal stress of layered roofs with weak interlayers on the stability of roadway roofs. FLAC3D numerical simulation software was used to study the damage characteristics of weak interlayers and different horizontal stresses on roadway roofs. Based on Proctor’s theory, a maximum caving arch model was proposed to obtain the maximum caving arch height and span range. The pressure measurement coefficient and the vertical displacement change of the roof strata conformed to corresponding linear functions by fitting the pressure measurement coefficient and the maximum vertical displacement. A bolt-while-drilling support method (BWD) was proposed based on team measurement-while-drilling (MWD) to accurately determine the location of weak rock layers and the development range of plastic zones. A maximum caving arch model was proposed to obtain the range of influence of the maximum caving arch and the range of the maximum slope collapse angle. Furthermore, a method of anchor rod support-while-drilling was proposed and tested on-site in Jingu Coal Industry, Guxian County, Shanxi Province, China. According to the site conditions, short anchor cables were used to pass through the weak interlayer of roofs, with a good support effect. The results provide a new method for layered roof support containing weak interlayers.

1. Introduction

Roadway roof-caving control has always been a hot and difficult research topic in roadway support. Roof-caving accidents have a high degree of concealment, suddenness, and high risk. Accidents involving composite roofs with weak interlayers are particularly serious [1,2]. Composite roofs are composed of rock layers with different lithology and mechanical characteristics. They have soft rock, hard rock, and weak intercalation, with obvious layering. The thickness, cohesion, and tensile strength between layers are small, which are prone to delamination and subsidence [3,4,5]. The rectangular roadway bends and deforms towards the free surface under vertical and horizontal stress after the roadway excavation. If the length and preload of the anchor bolt are insufficient, or there is a weak interlayer within the anchorage range, layered roofs will be separated or even collapse [6,7]. According to incomplete statistics, more than 30% of coal seam roadways in China have composite roofs, and this proportion increases with increased mining depth [6,7,8]. The safe and efficient support of composite roofs is the key content of deep-mine-roadway maintenance.
At present, researchers have studied the failure characteristics and scope of layered and weak interlayer roofs and analyzed the relationship between horizontal stress and roof failure.
Numerical simulation and on-site actual phenomena and similar material model tests are used to study the failure mechanism of the layered roof of the coal roadway, where surface layered roofs are damaged by horizontal stress rather than vertical stress [9]. Ref. [10] studies the thickness and location of weak intercalations in roofs. When the thickness of the weak intercalations in the middle of the composite beam is constant, the tensile stress on roofs decreases as the weak intercalations move away from the roof. A span calculation formula is derived, and the separation span is determined as a stability criterion. Physical simulation methods are used to study the mining instability characteristics and failure forms of the weak interlayer in the roof of a coal roadway in different anchoring areas [11]. According to the self-stabilizing process of the sur-rounding rocks of the roadway, the concept of the limit self-stabilizing equilibrium arch is proposed in Ref. [12]. The control object of the surrounding rocks of the roadway is the rock mass within the self-stabilizing equilibrium arch, and the elliptic curve equation of the limited self-stabilizing equilibrium arch is given. Anchor net cable beam support technology is proposed for weak composite roofs [13]. Ref. [14] explains the causes of anchor cable failure in thick and weak roofs and proposes a new method for designing anchor cable parameters. Ref. [15] studied the surrounding rock fracture morphology and roof-fall mechanism of mining roadways with weak-interlayer roofs. The roof-fall control of mining roadways with weak-interlayer roofs should focus on the expansion of the consistent weak-interlayer fracture zone. The stability and deformation failure process of layered roofs are studied based on the discrete element method [16,17,18]. A mechanical model is established for a composite system of rock masses with intercalations to reveal the failure and instability mechanisms of rock masses with intercalations [19,20]. The criteria for determining the stability of rock masses with intercalations are studied to provide a basis for the control design of the stability of layered rock masses. Ref. [21] proposes the mathematical model of the stress–strain behavior of disturbed rock masses concerning its anisotropic properties. An algorithm is proposed for selecting development systems [22]. The actual implementation results of the proposed mathematical model are presented to compile the algorithm. Wide-span openings in horizontally layered jointed rock are analyzed with the distinct element method (DEM) to provide additional insight into rock bolt support mechanisms and force [23]. The befitting support design of various openings in underground chromite mines is assessed in view of the safety and stability of engineering structures [24]. Bieniawski’s geomechanical system is considered for designing a support system.
In summary, researchers studied the stability of complex roadway roofs such as layered roofs and weak intercalations. Support technologies, such as combined support [25,26], are proposed to solve the multiple group problems of surrounding rock control. However, the roadway-roof strata change greatly with deepened coal mining depth and increased surrounding rock pressure, and there are safety accidents in the production process of coal mines.
Based on higher requirements for roadway-roof detection or support, the work took weak-interlayer roofs as the research object. A maximum caving arch model was proposed to obtain the maximum caving arch height and span range. Support-while-drilling technology was proposed based on team detection-while-drilling technology to provide more accurate detection and support for weak-interlayer roof. Field tests were performed in Jingu Coal Industry and the research results can provide a basis for selecting roof support parameters for a roadway with weak interlayers.

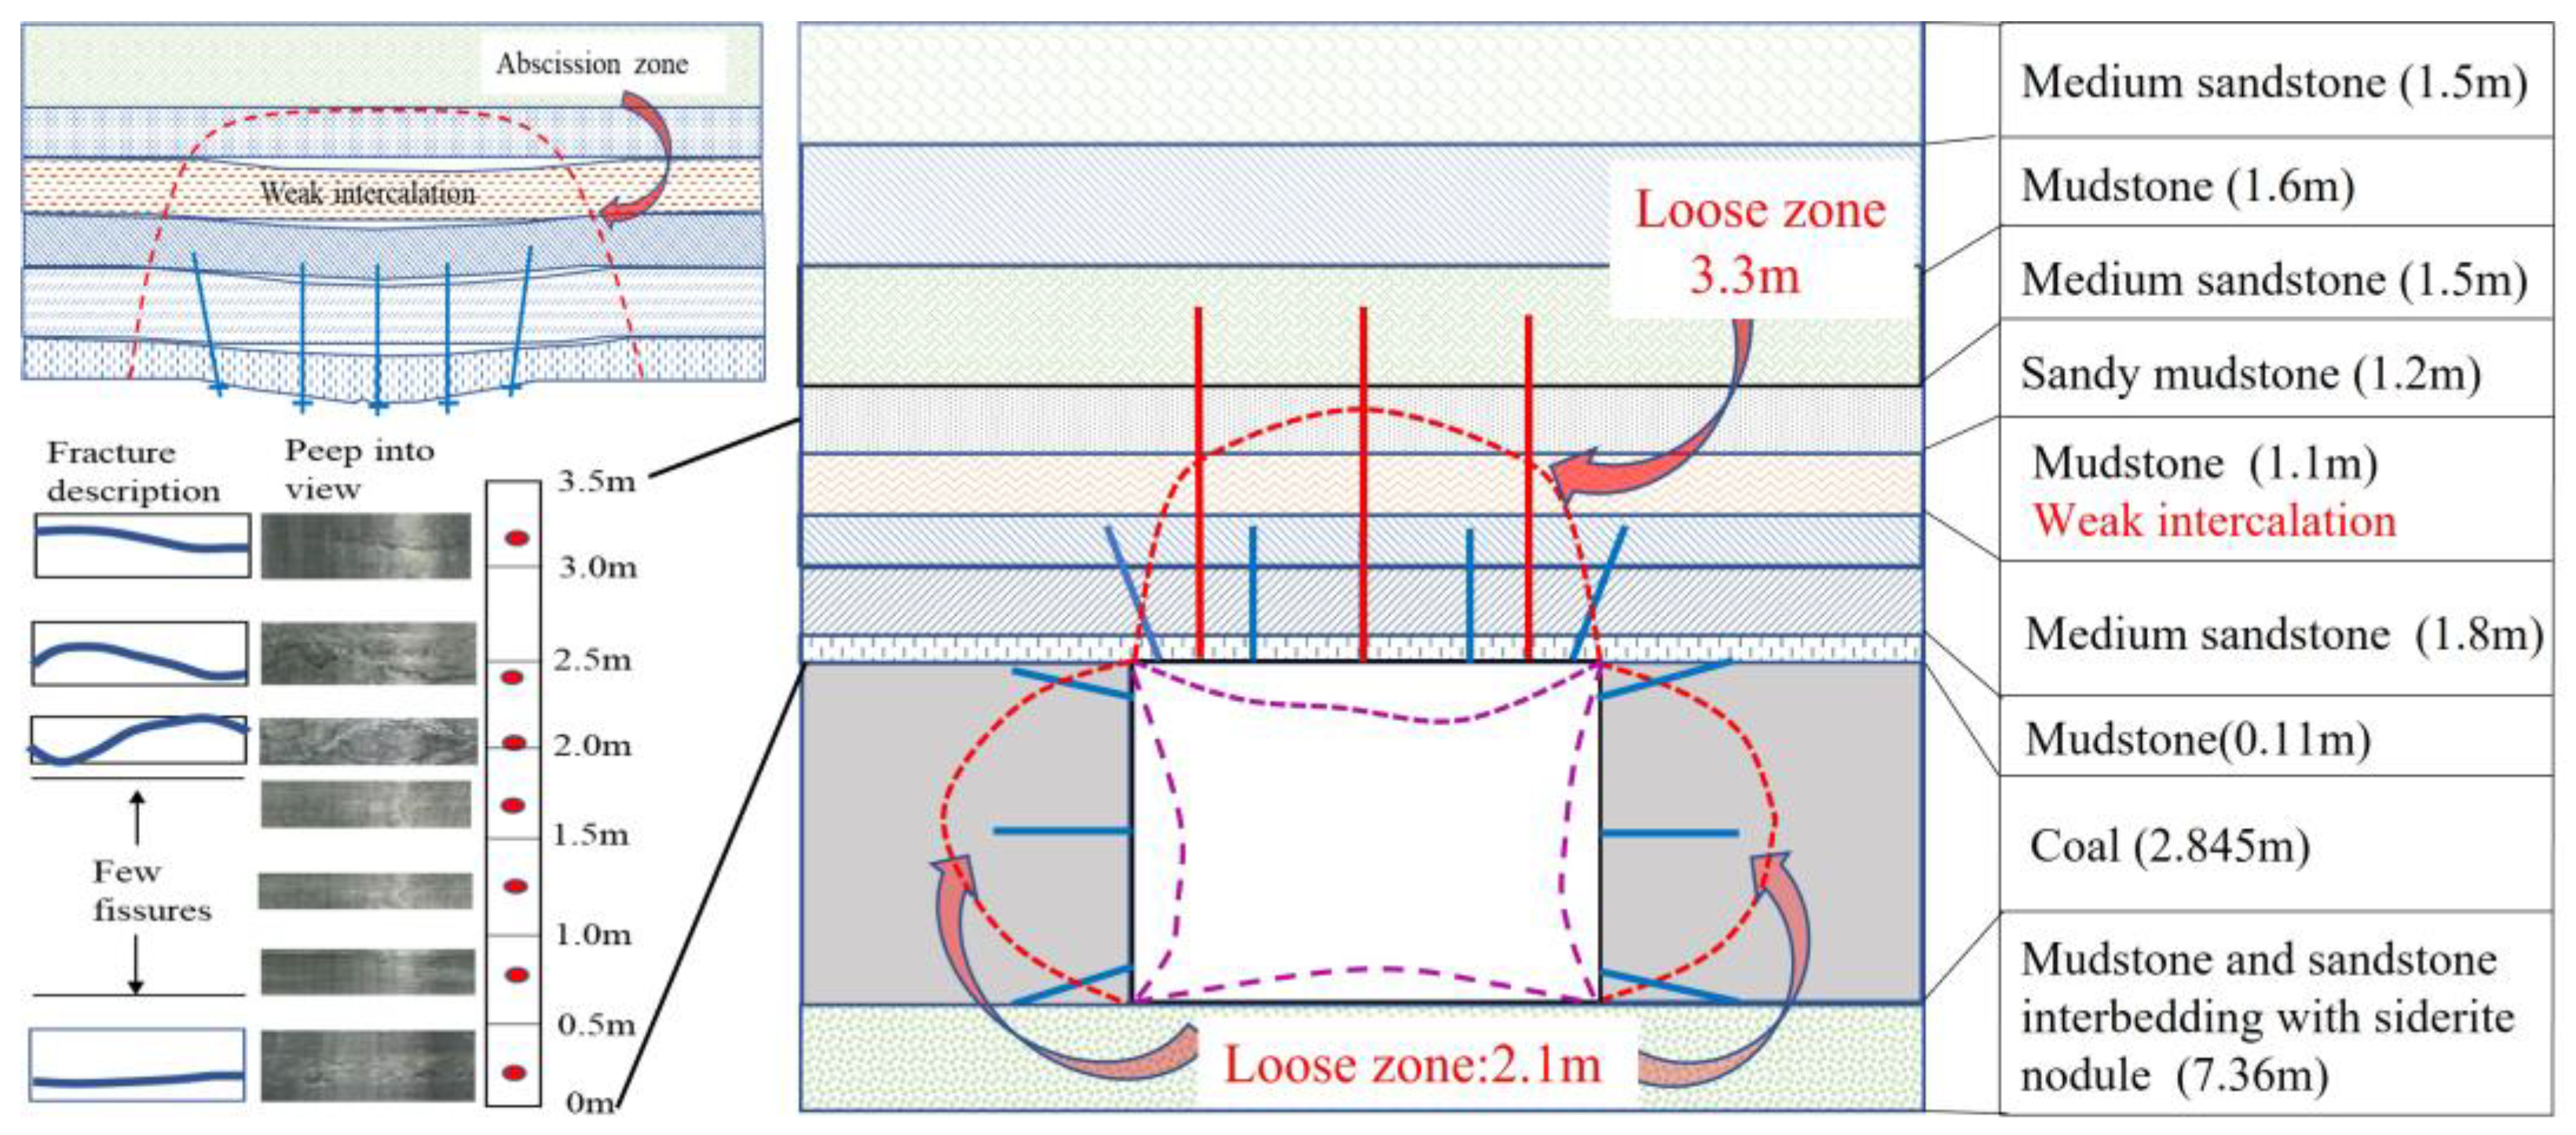
2. Engineering Geological Condition

2.1. Project Overview

Shanxi Guxian Jingu Coal Industry Co., Ltd. (Linfen, China) is located in Shanxi Province (see Figure 1). The 10904 track heading face is located in the north wing of mining area 1, with the 10904 working face transportation gateway in the east, the 10905 working face in the design in the west, and three downhills of the mine in the southwest (track downhill, belt downhill, and return air downhill). Figure 2 presents the working face layout. The design length is 2464 m, with a minimum thickness of the coal seam of 2.46 m, a maximum thickness of 3.0 m, an average thickness of 2.845 m, and an average dip angle of the coal seam of 4°30′. The roadway is rectangular, and the specification is 4.5 × 3 m (width × height). The hardness coefficient of the coal seam is 2–2.5, and the bedding of the coal seam is developed.
The 10904 track gateway is driven along coal-seam roofs. The mining party calculated that the depth of compression failure of two roadway sides is 1.24 m, according to Proctor’s theory, and the height of the potential roof-caving arch is 0.85 m during the initial support of the roadway. Therefore, the following diameters are selected for roadway-roof support: φ 18 mm, 1800 mm long anchor rod with a row spacing of 1000 × 1200 mm, and an row spacing between upper bolts of 1200 × 1200 mm. Roof anchor cables adopt φ 21.8 × 6200 mm steel strands. Three tunnels are arranged, and the anchor cables are vertically arranged in the roof rock stratum, with a spacing of 1.6 m and row spacing of 2.4 m.
According to the information obtained from the field test, including a roof abscission meter, borehole peep, and infrared distance meter, the surrounding rock of the 10904 track gateway has a wide range of loose zones, large deformation, and different degrees of delamination of composite roofs. Detection shows that a loose area is 3.3 m above the roadway roof, and a loose area is 2.1 m around the wall.
The maximum displacement of the 6 m measuring point at roof depth is 105 mm, within 1642–2464 m of the roadway from the open cut hole, found through observing the roof abscission meter, and the maximum displacement of the 2 m measuring point at the shallow is 225 mm. There is a large separation layer at the anchor-bolt anchorage part of roof. Figure 2 shows the survey results.

2.2. Deformation Feature Analysis

The roof of the 10904 track gateway is a composite roof with a weak interlayer. Since the roadway is 2464 m long, the changes in roof rock layers cannot be accurately detected. The anchoring section is located in medium-grained sandstone, and above the medium-grained sandstone is 1.1 m thick mudstone. Its compressive strength is 23.5 MPa, according to the physical and mechanical parameter test. This mudstone belongs to soft rocks located above the bolt. The weak interlayer exceeds the bolt length, which makes the roof as a whole seriously sink. The International Society of Rock Mechanics defines soft rock as a type of rock with a uniaxial compressive strength (σ c) between 0.5 and 25 MPa.
The damage of composite roofs usually develops layer by layer from the bottom to the top of the roof. The existence of weak intercalations may cause the formation of penetrating damage between adjacent rock layers, expanding the scope of roof damage, including the depth and span of damage, leading to the separation or caving of each rock layer [27]. When the length of the anchor rod or the length of the anchor cable cannot effectively pass through the weak interlayer and anchor to the stable rock stratum, the rock stratum will have a large separation at the position of the weak rock stratum, causing the partial or overall collapse of the composite roof.
When there are weak rock layers in the composite roof, not only does it have a large amount of subsidence and a fast deformation rate, but also the deformation lasts a long time from the initial slow separation of the layer to the final collapse, which may occur during the roadway excavation period or during the mining of the working face, with significant safety hazards. While reinforcing the roof, support for the side of the roadway cannot be ignored. If the support strength for the side is insufficient, the damage range of the composite roof will be expanded, and the separation speed of the added blocks will be increased [28,29].

3. Plastic Deformation Zone of Roofs at Different Weak Intercalation Positions
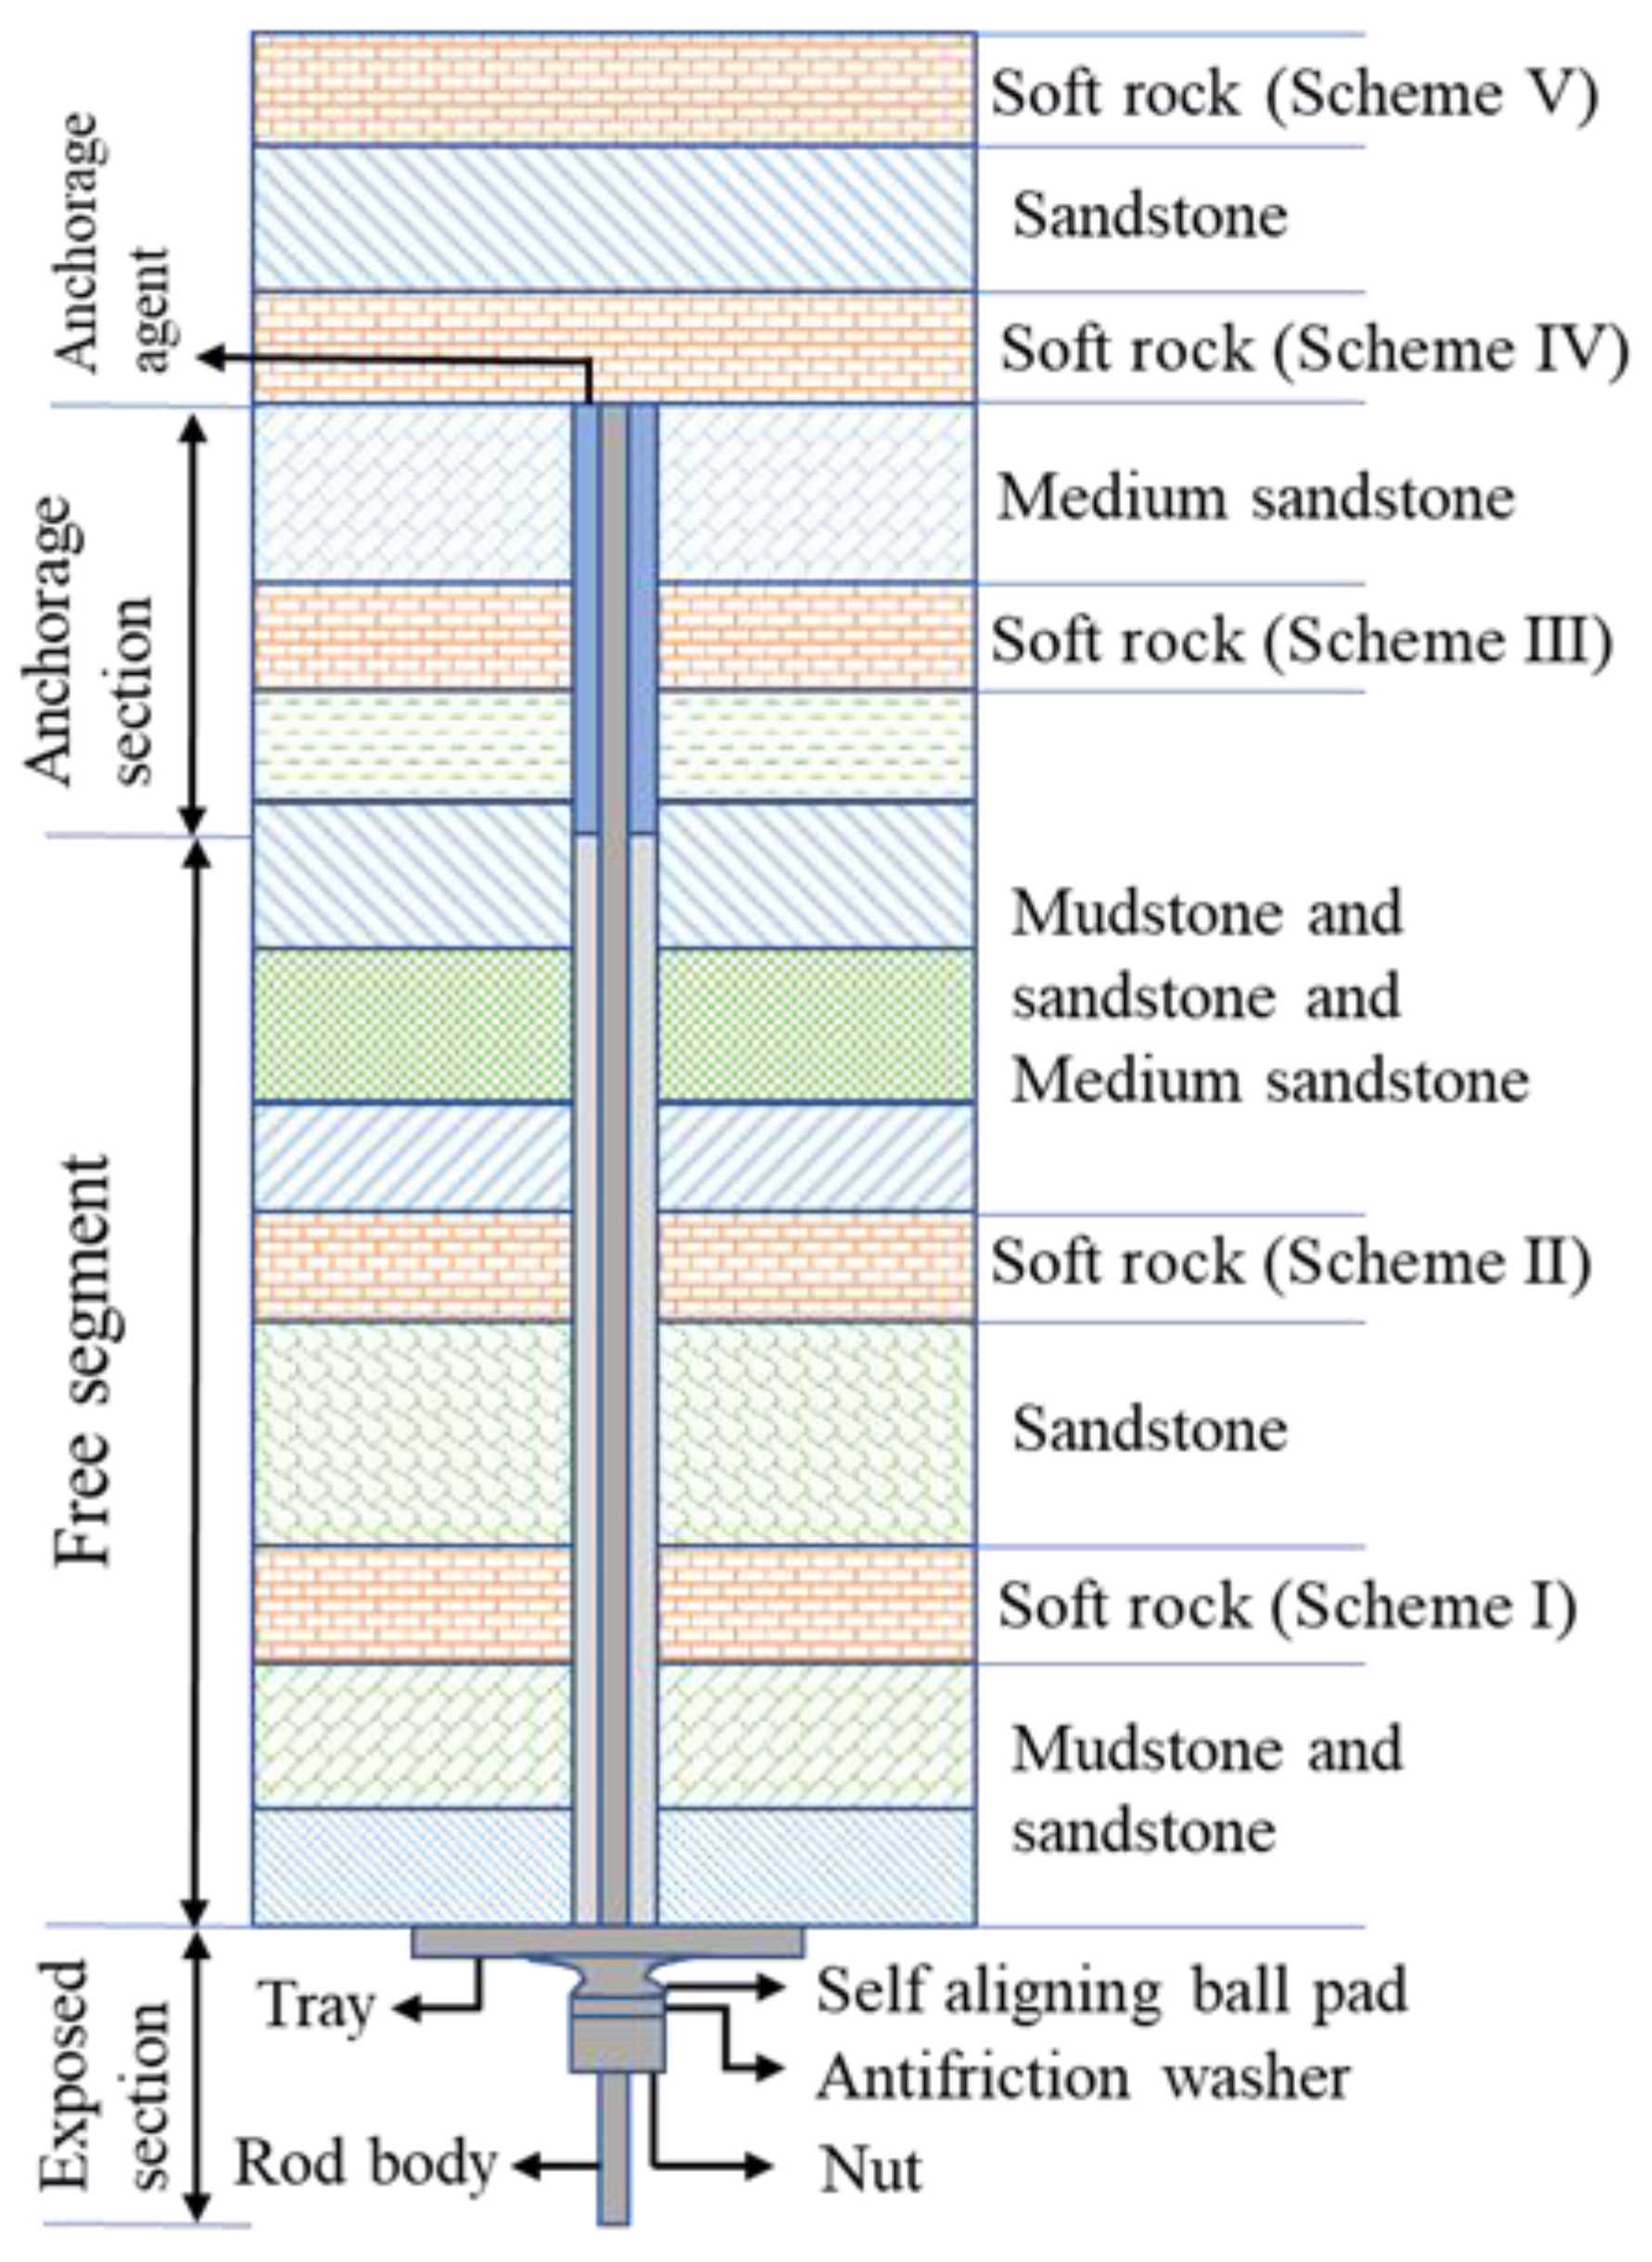
The work studied the influence of the weak-interlayer position on the failure characteristics of roofs. Based on the numerical simulation and analysis, the distribution distance of the weak interlayer was analyzed. The influence of the weak interlayer with different distribution distances on the plastic zone and displacement field of the surrounding rocks on roadway roof was studied through a large number of numerical simulation tests and the different positions of the weak interlayer relative to the bolt. Furthermore, the displacement law of roadway roofs and the weak interlayer when the weak interlayer is in different locations.

3.1. Model Scheme

The end anchor is usually used for roadway-roof support, and length L of the anchor bolt is 2.4 m. When there is a weak interlayer in the anchor-bolt anchorage range, it affects the anchor-bolt support effect. FLAC3D simulation software is used to study the impact of weak interlayers at different positions of the anchor-bolt-free section and anchorage section [30,31,32,33].
The thickness of other roof rock strata shall not exceed 2 m except for the weak interlayer to simulate the layering of the roof rock stratum. Table 1 lists the mechanical parameters of the surrounding rock material. Establish the model size of 25 × 5 × 20 m (length × width × height) and fix the left and right boundaries and lower boundaries. Apply a load of 20 MPa to the upper part of the model, and the pressure measurement coefficient is 1.0. The coal seam is 4 m thick, and the roadway size is 5 × 4 m (width × height). The elastic-plastic constitutive model and Mohr–Coulumb strength criterion are adopted for rock masses. Figure 3 shows the model.
The distance between the weak interlayer and roof is 0.2, 0.5, 0.8, 1.0, and 1.2 times L (L is the length of the anchor bolt and L = 2.4 m). The distance between the weak interlayer and roof is approximately 0.5, 1.0, 2.0, 2.5, and 3.0 m for the convenience of simulation. Then, a model without a weak interlayer above the roof is set as a comparison item. The thickness of the weak rock stratum is 0.5 m. Table 2 shows the model scheme, and Figure 4 presents the position of the weak interlayer in the simulation scheme.

3.2. Analysis of Model Results

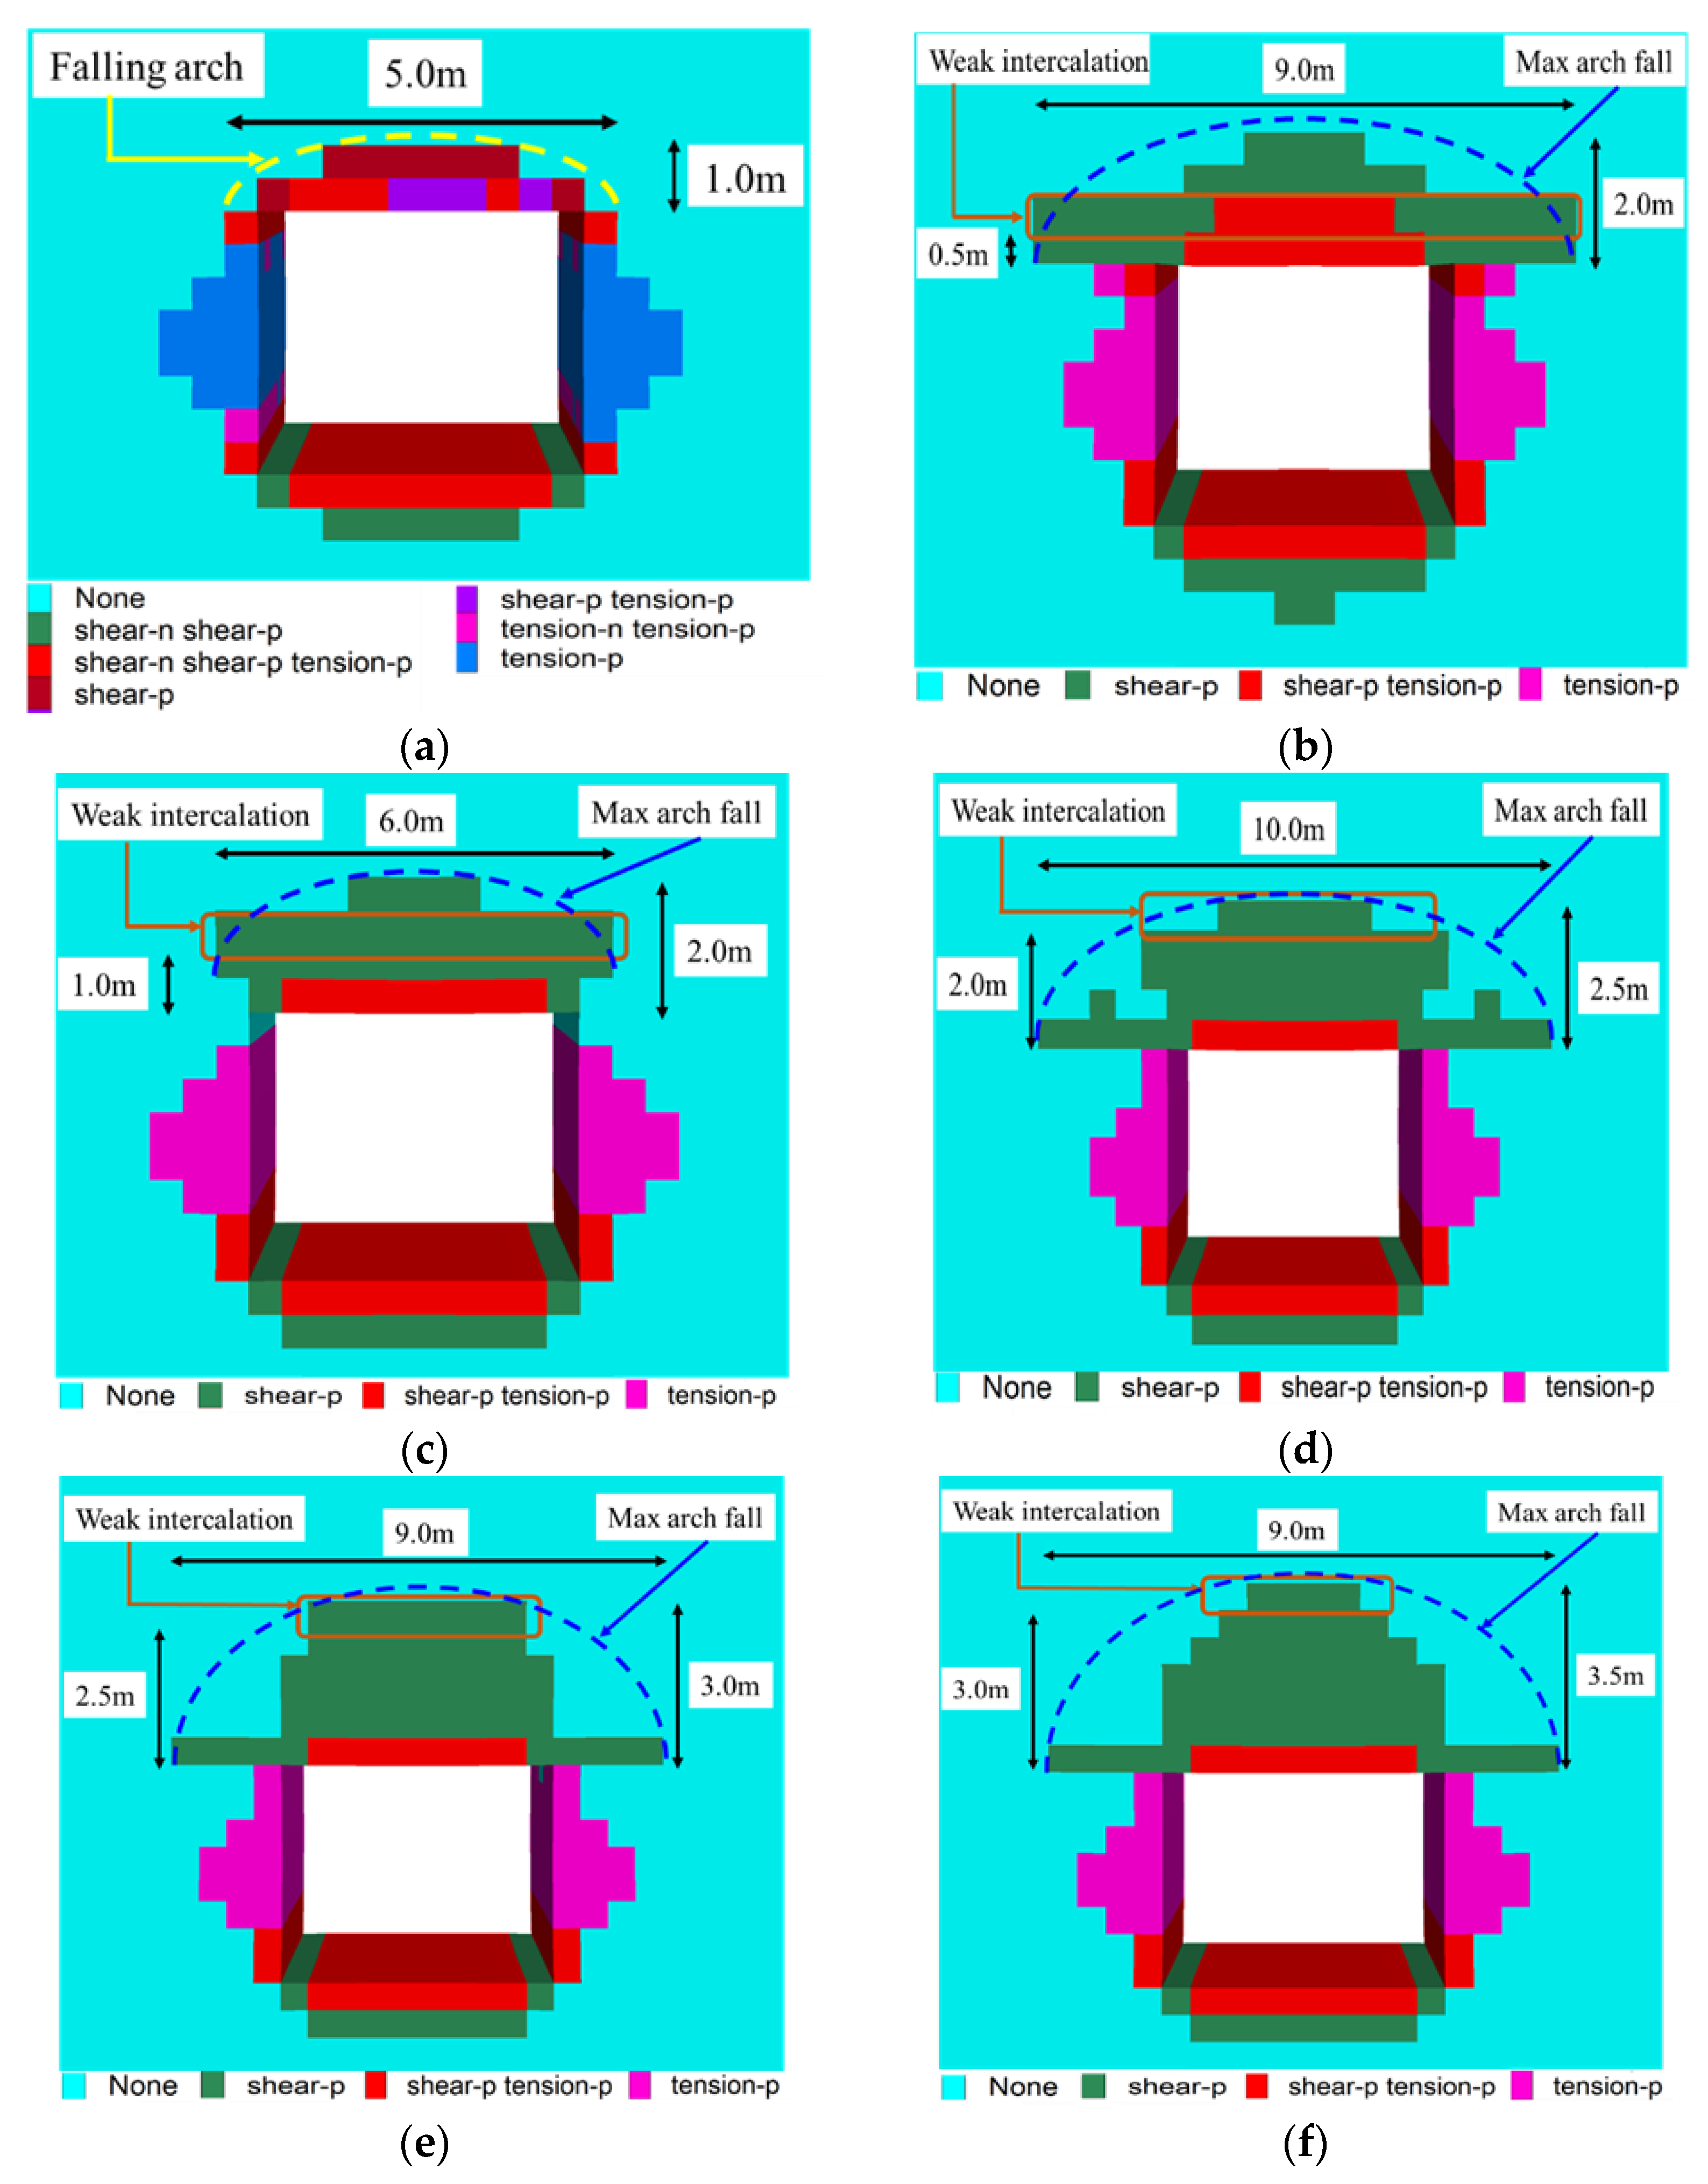
3.2.1. Distribution of the Roof-Rock Plastic Zone

The distribution of the plastic zone on the roof is obtained by calculating the model (see Figure 5). Figure 5a shows that when roadway roof is a hard rock layer, the distribution of the plastic zone on the roof conforms to Proctor’s theory. The rock layer is mainly subjected to shear stress, and the plastic zone is distributed in the roof rock layer closest to the roadway. At this time, effective control can be achieved through bolt and anchor mesh support.
Figure 5b–f show that when there are weak intercalations in the roof within the L range above the roadway, the height and width of the plastic zone of the roof rock stratum expand. The roof weak rock stratum is damaged by shear force, and the maximum falling arch will be formed. The height of the maximum falling arch reaches the rock stratum where the weak interlayer is located and even exceeds the weak-interlayer position. Its range is larger than the height of the falling arch obtained by Proctor’s theory.
Figure 5b,c show that when the weak-interlayer position is within the range of 0.2 to 0.5 times L, the range of the plastic zone of roof rocks may reach L. At this time, the weak interlayer is close to the roadway, and the rock layer is subject to shear stress. Penetrating damage between the weak rock layer and the rock layer below it can easily occur. It is manifested by the phenomenon that the roadway roof is prone to large separation and rock breakage.
When the range of weak rock strata is greater than 0.8 times L, the maximum height and span of the caving arch reach the maximum (see Figure 5d–f). The height of the caving arch exceeds L and reaches that of weak rock strata; besides, the span is up to about 2 times the width of the roadway. The overall separation and roof caving of the rock strata in the L range may occur due to the weak interlayer and layered roof rock strata.

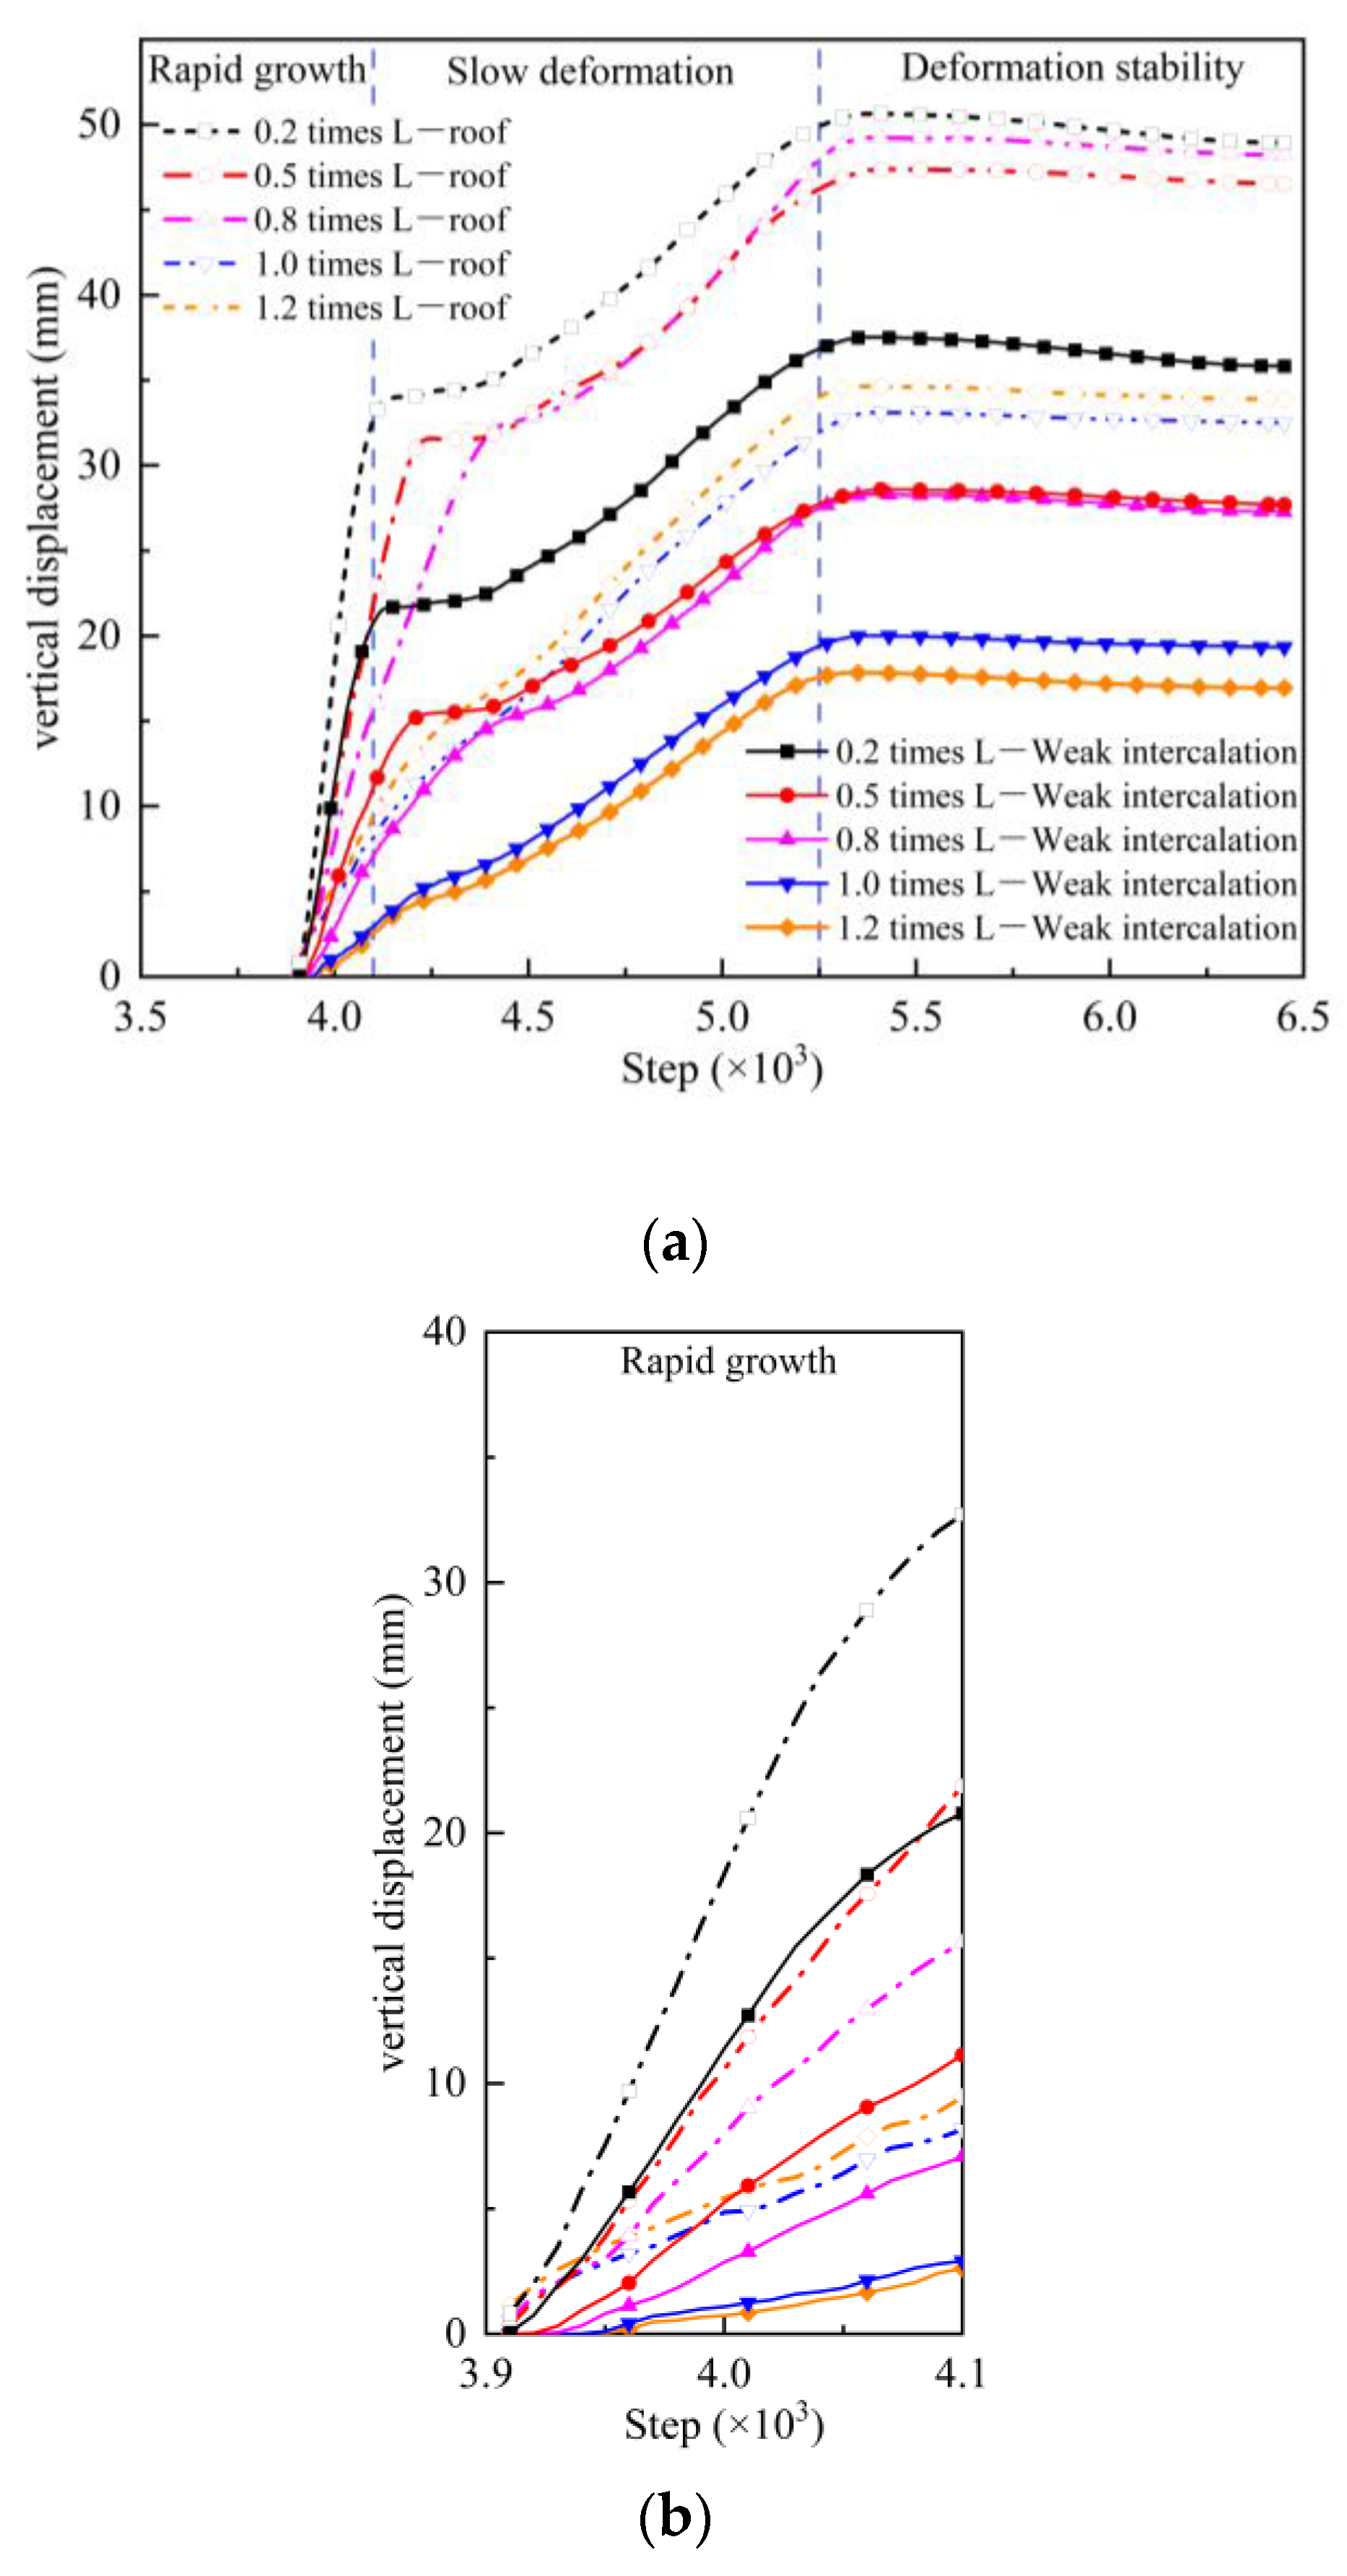
3.2.2. Maximum Displacement of the Top Plate

The vertical displacement of roof and soft rock roof and the maximum subsidence of the soft interlayer and roadway roof are obtained by arranging displacement measuring lines at the positions of the weak interlayer and roadway roof in the model (see Figure 6 and Figure 7). FLAC3D simulation software cannot simulate the effect of roadway-roof separation in the actual field very well, but its rock stratum displacement can better explain the variable relationship between the displacement of the weak interlayer and roadway roof.
Figure 6 shows that the deformation processes of roadway roofs and weak interlayers are similar, and the deformation process is shown in the rapid development stage, slow deformation stage, and stabilized deformation stage. The deformation rate of roadway roofs is greater than that of the weak interlayer in the process of deformation. When roadway roofs are supported, the support effect is optimal at the early stage of rapid development.
When the weak interlayer is located at 0.2 times L, 0.5 times L, and 0.8 times L, the maximum deformation of both the weak interlayer and the roadway roof is greater than that of the weak interlayer located at 1.0 times L and 1.2 times L. When weak interlayers are located at 0.2 times L, 0.5 times L, and 0.8 times L, there are cracks in the surrounding rocks of the roadway due to the redistribution of stress in the surrounding rocks of the roadway.
Cracks are easily connected to form new and larger cracks and accelerate the formation of plastic zones in surrounding rocks. However, there are fewer cracks in the surrounding rocks located at 1.0 times L and 1.2 times L, and the presence of weak interlayers can cause fewer new cracks than in the surrounding rocks of the roadway. Therefore, when weak interlayers are located at 0.2 times L, 0.5 times L, and 0.8 times L, the displacement of the weak interlayer and the roadway roof is greater than that of the weak interlayers located at 1.0 times L and 1.2 times L.

4. Plastic Deformation Zone of Roofs in Different Weak Intercalation Positions under Different Horizontal Pressures

4.1. Model Scheme

A large number of studies have shown that horizontal stress is the main factor affecting roof deformations and failure, while the weak interlayer affects bolt support. There are few studies on roof failure under different horizontal stress when the weak interlayer is located in different layers of the bolt.
Combined with the above research, the soft interlayer is selected to be located in the free section (0.5 times L), the anchoring section (0.8 times L), and the upper part (1.0 times L) of the anchor bolt to study the influence of different horizontal stresses on the failure of weak-interlayer roofs. The relationship between the distribution of roof plastic zone, displacement, and horizontal stress is studied by setting different horizontal pressures when the soft interlayer is located at different positions of the anchor bolt.
According to the distribution law of ground stress, vertical stress in the deep rock stratum is the weight of the rock stratum above which γ H stands (γ is the average unit weight and H is burial depth); the lateral pressure coefficient K is the ratio of horizontal stress to vertical stress. Different lateral pressure coefficients can be set to simulate different horizontal stresses in FLAC3D. The burial depth of the model is 400 m, and vertical stress is 20 MPa. Table 3 and Table 4 list the horizontal stress and model scheme settings.

4.2. Analysis of Model Results

The distribution map of the plastic zone of the roof under different horizontal stresses is obtained by simulating the model. Figure 8 shows the model results of schemes I and II. The results of scheme IV are similar to those of scheme V by comparing the model simulation results, and the results of scheme VI are similar to those of scheme VII. Therefore, the results of schemes III, V, and VII are analyzed (see Figure 9, Figure 10 and Figure 11).
(1)
Distribution of the plastic zone of roof rocks when pressure measurement coefficient K < 1:
When the pressure measurement coefficient is less than 1, the plastic zone of roadway roofs reaches the height of the weak interlayer. When the weak interlayer is located above the anchor bolt (1.0 times L), the plastic zone range will exceed the action range of the anchor bolt and the roof is prone to delamination and roof fall. The span range of the plastic zone shrinks with the increased pressure measurement coefficient.
When the pressure measurement coefficient is 0.5, that is, when horizontal stress is half of the vertical stress, the weak interlayer is damaged by tensile stress, which forms a plastic zone. The roof rocks of the roadway are damaged by shear tension so that the plastic zone between the two is connected. When the pressure measurement coefficient is 0.5 and the weak interlayer is located above the anchor bolt, the plastic zone of the roof is distributed in a “V” shape.
When the pressure measurement coefficient is 0.7, the span of the plastic zone of the roof is about 1.4–2.0 times the roadway width. When the pressure measurement coefficient is 0.7 and the weak interlayer is located above the anchor bolt, the plastic zone of the roadway roof is distributed in an inverted “V” structure, which is just opposite to the lateral pressure coefficient of 0.5. The rock stratum in the plastic zone changes from tensile stress failure to shear failure.
(2)
Distribution of the roof-rock plastic zone when pressure measurement coefficient K ≥ 1:
Figure 9, Figure 10 and Figure 11 show that the depth and span of the plastic zone of the roadway roof gradually expand with the increased lateral pressure coefficient. When the pressure measurement coefficient is 2.0, that is, when the horizontal stress is twice vertical stress, the range of the plastic zone is far beyond the range of bolt support. According to this judgment, when the roof rock stratum is layered with a weak interlayer, layered roof is damaged under shear and tension with increased horizontal stress. The range of the plastic zone gradually increases, and its span and height exceed the range of bolt support. There are hidden dangers in roadway roofs.
When the pressure measurement coefficient is 1.0 and the weak interlayer changes from 0.5 to 1.0 times L, the span of the plastic zone increases from 1.2 to 1.8 times the roadway width, and the height reaches that of the weak interlayer or exceeds 0.2 times L. When the pressure measurement coefficient is 2.0, the span of the plastic zone reaches 4 times the roadway width, and the height of the plastic zone reaches about 1.7 times L. That is, the height of the plastic zone reaches 1.7 times the length of the anchor bolt. The anchor bolt with a length L of 2.4 m has a poor support effect on the roof and is prone to roof fall.
When the pressure measurement coefficient is 2.0, the thin rock layer (less than 0.5 m in thickness) of the immediate roof of the roadway will be subject to tensile failure. The failure span is about three times the roadway width, and immediate roof is easy to break. When the weak interlayer is located at 1.0 times L, the width and span of the plastic zone formed by the weak interlayer and the immediate roof of the roadway are distributed in a symmetrical inverted “F” shape.
(3)
Relation between maximum displacement and the pressure measurement coefficient
Displacement measuring lines at the positions of the weak interlayer and roadway roof in the model are arranged to obtain the vertical displacement diagram of the roof and weak rock roof under different horizontal pressures and the maximum subsidence of the weak intercalation and roadway roof. The displacement and pressure measurement coefficients are fitted to obtain their fitting methods (see Figure 12 for the results).
The maximum displacement of the roadway roof is greater than that of the weak interlayer, and it is twice that of the weak interlayer with the pressure measurement coefficient from 0.5 to 2.0.
When the weak interlayer is located at different positions, the maximum displacement of the weak interlayer and roof is different. When the weak interlayer is located at 0.8 times L, the displacement of both is greater than that when the weak interlayer is located at 0.5 times L. When the weak interlayer is located at 1.0 times L, the displacement of both is greater than that when the weak interlayer is located in the free section and anchor section of the anchor bolt. This result is consistent with the previous description.
When the weak interlayer is located in the anchoring section (0.8 times L), the displacement of the roadway roof is close to that of the free section. Therefore, the lithology within the anchor-bolt anchoring section should be analyzed in detail to avoid weak interlayers during support on-site. The corresponding fitting function is obtained by fitting the pressure measurement coefficient and maximum vertical displacement. The fitting rate is 0.95–0.99, indicating that the pressure measurement coefficient and the vertical displacement of roof rocks conform to the corresponding linear function.
When the weak interlayer is located in different layers, the vertical displacement of the roadway roof and the weak interlayer has a linear relationship with the lateral pressure coefficient and with the increased pressure measurement coefficient (increased horizontal stress). The deformation degree of roof rocks can be found from the slope. When the weak interlayer is located at 0.8 times L, the displacement deformation of roof rocks is large with the increased pressure measurement coefficient. This result is consistent with Figure 12c.
To sum up, different horizontal stresses and positions of weak intercalation affect the deformation and destruction of layered roofs containing weak intercalation, increase the height and span of roof destruction, and form a larger arch fall. The height of arch fall exceeds the height and span of arch fall calculated using Proctor’s theory. If the roadway support scheme is calculated according to Proctor’s theory and other relevant formulas, large roof separation, even roof fall, and other safety accidents will occur on the site. Therefore, it is necessary to accurately judge the position and horizontal stress for layered roofs with a weak interlayer to scientifically and reasonably support roadway roofs.

5. Maximum Arch Fall and Bolt Support-While-Drilling (BWD)

Based on the above research on the location and horizontal stress of weak interlayers in layered roofs, the maximum caving arch range of the roof exceeds the caving arch range calculated by Proctor’s theory when there are weak interlayers above the roof. If the weak-interlayer location is not specified while designing a roadway support scheme with a length exceeding 2000 m, Proctor’s theory is used to calculate the support length based on the average value of relevant parameters. The roadway support effect will not be ideal, and even roof accidents such as roof caving may occur. Therefore, based on Proctor’s theory, the above research contents, and site conditions, the maximum arch fall of layered roofs with a weak interlayer conforms to Figure 13.
Figure 13 shows that l1 is the caving arch calculated using Proctor’s theory; h is the height of the collapse arch calculated by Proctor’s theory; l2 is the maximum arch fall with weak intercalation; H is the maximum arch fall height with weak intercalation; and h2 is the height of unstable rock strata. It is often ignored at the site because the detection of roof rock strata is unknown, or the average thickness of rock strata is calculated by Proctor’s theory, or rock strata change according to the average thickness of the rock formation. As a result, the support strength of the roof is insufficient, and safety accidents such as roof caving are prone to occur.
When pressure-measurement coefficient K < 1, that is, when horizontal stress is less than vertical stress, there are three situations of the maximum caving arch height according to the position of the weak interlayer relative to the anchor bolt: (1) If the weak interlayer is located in the free section of the anchor bolt, the height of the roof plastic zone is the height of the weak rock layer, and the maximum caving arch height is the height of the soft rock layer at this time; (2) If the weak interlayer is located in the anchoring section of the anchor bolt, the maximum arch height of roof is the height of the weak interlayer. The anchoring section fails due to the weak interlayer, and L is the height of the plastic zone (the height of the anchor bolt); (3) If the weak interlayer is located above the anchor bolt, the maximum height of the arch caving is about 1.3 times the length of the anchor bolt, and the width of the plastic zone is about 1.2–2 times the roadway width, that is, a3 = (1.2–2)a.
When the pressure measurement coefficient is 1 < K < 2, that is, when horizontal stress is greater than vertical stress, there are two cases of the maximum caving arch height according to the position of the weak interlayer relative to the anchor: (1) If the weak interlayer is located in the free section and anchor section of the anchor, the maximum caving arch span is about 1.3–2.4 times the roadway width, that is, a3 = (1.3–2.4)a, and the height is about 1.3–1.5 times L; (2) If the weak interlayer is located above the anchor bolt, the maximum caving arch span is about 2 times the roadway width, and the height is about 1.3 times L.
When the pressure measurement coefficient K is 2, that is, when horizontal stress is twice vertical stress, the maximum caving arch span reaches 4 times the roadway width. The height reaches about 1.7 times L, namely H = 1.7 times L. Assuming that hi is the height of the weak rock stratum and L is the length of the anchor bolt, Table 5 shows the maximum arch fall height and span parameters.
The rock stratum becomes complex with the deepened mining depth. Sometimes the thickness of the weak interlayer is thin, and the position of the weak interlayer is difficult to determine. The maximum caving arch height is difficult to determine at this time. The BWD method is preliminarily proposed to accurately judge the position of the weak interlayer and provide reasonable support parameters for roadway roof support.
Figure 14 shows the process. The geological exploration-while-drilling technology of roof rock strata developed by researchers [34,35,36] is used to identify the type interface and fractures [37,38] of roadway-roof rock strata and obtain the weak interlayer height and the development of fractures and other information. Roof support parameters are designed according to field-measured information to make bolt support as effective as possible.

6. Field Test

The industrial test was carried out by taking the 10904 track gate of Shanxi Guxian Jingu Coal Industry Co., Ltd. as the engineering background.
The 10904 track gateway was driven along a coal-seam roof. The mining party was calculated during the initial support of the roadway. The depth of compression failure of the two roadway sides was 1.24 m, according to Proctor’s theory, and the height of the potential roof-caving arch was 0.85 m. Therefore, the diameters selected for roadway-roof support were as follows: φ 18 mm, length L of 1800 mm, row spacing between bolts of 1000 × 1200 mm, and row spacing between upper bolts of 1200 × 1200 mm. Roof anchor cables adopted φ 21.8 × 6200 mm steel strands. Three tunnels were arranged, and the anchor cables were vertically arranged in the roof rock stratum, with a spacing of 1.6 m and a row spacing of 2.4 m.
The rock structure and fissure development of roof were detected using the detection-while-drilling technology developed by the team to accurately support the track chute of the 10904 roof. The detection-while-drilling was carried out at an interval of 50 m within the range of 1642–2464 m, and 10 valid data were selected (see Table 6 for data and Figure 15 for partial analysis results).
According to the results of exploration-while-drilling, the thickness of weak intercalation in the rock stratum above the roof of the 10904 track gateway is about 1.0 m, which is 2.1–3.3 m above the roof. Based on the mining data, the pressure measurement coefficient is 1.54. The maximum caving arch height can be calculated as 1.3 times L, that is, the maximum caving arch height is 2.34 m (see Table 5). When the roof is supported by bolts in the range of detection-while-drilling, the length of the bolts should exceed 3.0 m. The 4.2 m short anchor cable was selected to support the roof instead of the 1800 mm long anchor cable to avoid the weak rock layer being located in the anchoring section and its effect on support. The φ 21.8 × 6200 mm long anchor cable was used to support the roof. The row spacing between short anchor cables was 830 × 1200 mm; the row spacing between long anchor cables was 1600 × 2400 mm; and the other support parameters remained unchanged (see Figure 16).
Table 7 shows the results by observing the changes on the roof abscission meter after optimizing roof support within 1642–2464 m of the 10904 track along the slot to the open cut hole. The maximum displacement of the 6 m measuring point at the depth of roof is 12 mm, and the maximum displacement of the 2 m measuring point at the shallow is 23 mm. The overall subsidence is greatly reduced, indicating that the short anchor cable is used to pass through the soft rock stratum to support the roof. Figure 17 shows the field effect.

7. Conclusions

Theoretical analysis, numerical simulation, and field test methods were used to study the failure mechanism of layered roadway roofs in weak interlayers. The damage of weak intercalation and horizontal stress to layered roofs was analyzed. The research results are as follows:
(1)
A model of soft-interlayer roadway roof was established to analyze the deformation process of roadway roofs and soft interlayers when there is a soft interlayer above the roadway. The process was divided into the rapid development stage, slow deformation stage, and stabilized deformation stage.
(2)
Weak interlayers affected the effectiveness of anchor rod support. When they were located at the free section, the anchoring section, and above the anchoring section of the anchor rod, a significant difference existed in the deformation amount between the roof and weak interlayers. The difference in the deformation amount is as follows: dis-placement at the free section > displacement at the anchoring section > displacement above the anchoring section.
(3)
The concept of the maximum caving arch of roadway roofs in weak interlayers was proposed. The maximum caving arch failure span, failure height, and the maximum caving angle range of the side were obtained by establishing a schematic diagram of the maximum caving arch.
(4)
A method of anchor rod support-while-drilling was proposed and tested on-site for the difficult problem of roof support in weak interlayers. A good support effect was obtained.

Author Contributions

Conceptualization, J.W. and X.Z.; methodology, J.W. and C.L.; software, J.W. and P.L.; validation, J.W. and W.X.; writing—original draft preparation, J.W.; writing—review and editing, J.W. and C.L.; project administration, X.G. All authors have read and agreed to the published version of the manuscript.

Funding

This work was supported by Research on Intellectual Property Bottleneck and Countermeasures of Guizhou Coal Industry under the Target of “Double Carbon” (Qianzhi Strategy [2022] 10), Guizhou “100 leading talents” and “1000 innovative and entrepreneurial talents” (Guizhou people receive and distribute [2018] 4-12).

Institutional Review Board Statement

Not applicable.

Informed Consent Statement

Not applicable.

Data Availability Statement

Data are contained within the article.

Acknowledgments

The authors would like to thank the engineering technicians in Jingu Coal Industry for their enthusiastic assistance and suggestions.

Conflicts of Interest

The authors declare no conflict of interest.

References

  1. Ma, N.J.; Feng, J.C.; Lu, K.; Zhao, Z.Q.; Bai, Y.; Liu, G.B.; Ji, J.Y. Study on cause classification method and support countermeasures of roof falling in coal drift. Coal Sci. Technol. 2015, 43, 34–40. [Google Scholar]
  2. Jia, H.S.; Ma, N.J.; Zhu, Q.K. Mechanism and control method of roof fall resulting from butterfly plastic zone penetration. J. China Coal Soc. 2016, 41, 1384–1392. [Google Scholar]
  3. Yue, Z.W.; Yang, R.S.; Yan, Z.D.; Wang, G.D.; Wu, B.Y. Numerical Simulation on Support of Roadway with Compound Roof and Large Cross Section. In International Mining Forum 2010: Mine Safety and Efficient Exploitation Facing Challenge of the 21st Century; CRC Press: Boca Raton, FL, USA, 2010; pp. 138–143. [Google Scholar]
  4. Su, X.G.; Li, Y.B.; Yang, Y.K. A Research into Extra-thick compound mudstone roof roadway failure mechanism and security control. Procedia Eng. 2011, 26, 516–523. [Google Scholar]
  5. Khalymendyk, I.; Baryshnikov, A. The mechanism of roadway deformation in conditions of laminated rocks. J. Sustain. Min. 2018, 17, 41–47. [Google Scholar] [CrossRef]
  6. Fan, D.; Liu, X.; Tan, Y.; Song, S.; Gu, Q.; Yan, L.; Xu, Q. Roof Cutting Parameters Design for Gob-Side Entry in Deep Coal Mine: A Case Study. Energies 2019, 12, 2032. [Google Scholar] [CrossRef] [Green Version]
  7. Su, X.G.; Song, X.M.; Li, H.C.; Yuan, H.H.; Li, B.K. Study on Coupled Arch-beam Support Structure of Roadway with Extra-thick Soft Compound Roof. Chin. J. Rock Mech. Eng. 2014, 33, 1828–1836. [Google Scholar]
  8. Tai, Y.; Xia, H.; Kuang, T. Failure characteristics and control technology for large-section chamber in compound coal seams—A case study in Tashan Coal Mine. Energy Sci. Eng. 2019, 8, 1353–1369. [Google Scholar] [CrossRef]
  9. Lin, C.D.; Sun, T.C. Failure mechanism analysis of layered roof in coal roadway. Coal Min. Technol. 1998, 01, 41–46+64. [Google Scholar]
  10. Ma, N.J.; Zan, P.; He, G.; Xiang, Q. On soft interlayer affecting roadway stabilization in roof. Miner. Eng. Res. 2009, 24, 1–4. [Google Scholar]
  11. Zhang, N.; Li, G.C.; Kan, J.G. Influence of soft interlayer location in coal roof on stability of roadway bolting structure. Rock Soil Mech. 2011, 32, 2753–2758. [Google Scholar]
  12. Huang, Q.X.; Liu, Y.W. Ultimate self-stable arch theory in roadway support. J. Min. Saf. Eng. 2014, 31, 354–358. [Google Scholar]
  13. Chen, J. Weathering Weak Entry of Composite Roof Bolting Technology Research. Coal Technol. 2009, 28, 44–46. [Google Scholar]
  14. Wang, W.J.; Luo, L.Q.; Huang, W.Z.; Qu, Y.S.; Wu, H.; Yu, W.J. Study on supporting failure mechanism and reasonable length of anchor cable in thick soft-weak roof of high-stress coal roadway. J. Min. Saf. Eng. 2014, 31, 17–21. [Google Scholar]
  15. Jia, H.S.; Pan, K.; Li, D.F.; Liu, S.W.; Lv, X.L.; Fang, Z.Z.; Jin, M. Roof fall mechanism and control method of roof with weak interlayer in mining roadway. J. China Univ. Min. Technol. 2022, 51, 67–76+89. [Google Scholar]
  16. Sofianos, A.I.; Kapenis, A.P. Numerical evaluation of the response in bending of an underground hard rock voussoir beam roof. Int. J. Rock Mech. Min. Sci. 1998, 35, 1071–1086. [Google Scholar] [CrossRef]
  17. Sofians, A.I. Analysis and design of an underground hard rock voussoir beam roof. Int. J. Rock Mech. Min. Sci. Geomech. Abstr. 1996, 33, 153–166. [Google Scholar] [CrossRef]
  18. Lu, H.F.; Yao, D.X.; Shen, D. Numerical simulation of structure plane effect for mechanical characteristics of layered rock mass subjected to compression. J. Anhui Univ. Sci. Technol. (Nat. Sci.) 2014, 34, 24–29. [Google Scholar]
  19. Zhang, D.L.; Wang, Y.H.; Qu, T.Z. Analysis of the influence of interlayer on the stability of layered rock mass. Chin. J. Rock Mech. Eng. 2000, 02, 140–144. [Google Scholar]
  20. Cao, L.Q.; Zhang, D.L.; Fang, Q. Semi-analytical prediction for tunnelling -induced ground movements in multi-layered clayey solis. Tunn. Undergr. Space Technol. 2020, 102, 103446. [Google Scholar] [CrossRef]
  21. Adigamov, A.E.; Yudenkov, A.V. Stress-strain behavior model of disturbed rock mass with regard to anisotropy and discontinuities. Min. Inf. Anal. Bull. 2021, 8, 93–103. [Google Scholar] [CrossRef]
  22. Khayrutdinov, M.M.; Golik, V.I.; Aleksakhin, A.V.; Trushina, E.V.; Lazareva, N.V.; Aleksakhina, Y.V. Proposal of an Algorithm for Choice of a Development System for Operational and Environmental Safety in Mining. Resources 2022, 11, 88. [Google Scholar] [CrossRef]
  23. Boon, C.W. Study of reinforcement support mechanisms for wide-span horse-shoe-shaped openings in horizontally layered jointed rock using the distinct element method. Rock Mech. Rock Eng. 2019, 52, 1179–1191. [Google Scholar] [CrossRef]
  24. Paul, A.; Prakash, A.; Kumar, N.; Kumar, P.; Singh, A.K. Integration of Numerical and Empirical Approaches for Assessment of Apt Support Design for Various Underground Openings of Chromite Mine. J. Geol. Soc. India 2022, 98, 851–858. [Google Scholar] [CrossRef]
  25. Gu, S.C.; Su, F.; Cui, X.P. Analysis on Deformation and Failure Law of Complex Roof in Seam Gateway. Coal Sci. Technol. 2012, 40, 20–23+62. [Google Scholar]
  26. Yang, F.; Wang, L.G.; He, A.M. Failure mechanism and bolting support technique of complex roof. J. Min. Saf. Eng. 2008, 25, 286–289. [Google Scholar]
  27. Rybak, J.M.; Kongar-Syuryun, C.; Tyulyaeva, Y.; Khayrutdinov, A.M.; Akinshin, I. Geomechanical substantiation of parameters of technology for mining salt deposits with a backfill. Min. Sci. 2021, 28, 19–32. [Google Scholar] [CrossRef]
  28. Meng, Q.B.; Kong, L.H.; Han, L.J.; Li, Y.; Nie, J.; Li, H.; Gao, J. Stability control technology for deep soft and broken composite roof in coal roadway. J. China Coal Soc. 2017, 42, 2554–2564. [Google Scholar]
  29. He, M.C.; Qi, G.; Cheng, C.; Zhang, G.F.; Sun, X.M. Deformation and Damange Mechanisms and Coupling Support Design in Deep Coal Roadway with Compound Roof. Chin. J. Rock Mech. Eng. 2007, 05, 987–993. [Google Scholar]
  30. Wang, J.Y.; Wang, F.T.; Zheng, X.G. Stress Evolution Mechanism and Control Technology for Reversing Mining and Excavation under Mining-Induced Dynamic Pressure in Deep Mine. Geofluids 2022, 35, 1–17. [Google Scholar] [CrossRef]
  31. He, Y.L.; Gao, M.S.; Xu, D.; Yu, X. Mechanism and Procedure of Repeated Borehole Drilling Using Wall Protection and a Soft Structure to Prevent Rockburst: A Case Study. Geofluids 2011, 38, 74–76. [Google Scholar] [CrossRef]
  32. Coggan, J.; Gao, F.Q.; Stead, D.; Elmo, D. Numerical modelling of the effects of weak immediate roof lithology on coal mine roadway stability. Int. J. Coal Geol. 2012, 90, 100–109. [Google Scholar] [CrossRef]
  33. Małkowski, P. The impact of the physical model selection and rock mass stratification on the results of numerical calculations of the state of rock mass deformation around the roadways. Tunn. Undergr. Space Technol. 2015, 50, 365–375. [Google Scholar] [CrossRef]
  34. Liu, C.; Zheng, X.G.; Niaz, M.S.; Li, Z.S. Research on borehole forming characteristics of two-wing polycrystalline diamond compact bit in coal mines. Energy Sources Part A Recovery Util. Environ. Eff. 2020, 39, 1–14. [Google Scholar] [CrossRef]
  35. Liu, C.; Zheng, X.G.; Arif, A.; Xu, M. Measurement and analysis of penetration rate and vibration on a roof bolter for identification rock interface of roadway roof. Energy Sources Part A Recovery Util. Environ. Eff. 2020, 42, 2751–2763. [Google Scholar] [CrossRef]
  36. Liu, C.; Zheng, X.G.; Wang, G.; Xu, M.; Li, Z. Research on drilling response characteristics of two-wing PDC bit. Sustainability 2020, 12, 406. [Google Scholar] [CrossRef] [Green Version]
  37. Liu, C.; Zhan, Q.; Yang, L.; Zheng, X.G.; Li, P.; Shahani, Z. Recognition of Interface and Category of Roadw ay Roof Strata Based on Drilling Parameters. J. Pet. Sci. Eng. 2021, 204, 108724. [Google Scholar] [CrossRef]
  38. Liu, C.C.; Zheng, X.G.; Yang, L.; Li, P.; Niaz, M.S.; Wang, C.; Guo, X.W. Automatic identification of rock formation interface based on borehole imaging. Energy Sources Part A Recovery Util. Environ. Eff. 2021, 25, 1–13. [Google Scholar] [CrossRef]
Figure 1. Coal Mine Location and Working Face Layout.
Processes 11 01198 g001
Figure 2. Survey Results.
Processes 11 01198 g002
Figure 3. Model.
Figure 3. Model.
Processes 11 01198 g003
Figure 4. Location of the Soft Interlayer in the Model Scheme.
Processes 11 01198 g004
Figure 5. Distribution of the Plastic Zone of the Roof Layer. (a) Contrast model. (b) Scheme I. (c) Scheme II. (d) Scheme III. (e) Scheme IV. (f) Scheme V.
Processes 11 01198 g005
Figure 6. Vertical Displacement of Roadway Roof and Soft Rock Roof at Different Locations of Soft Rock Strata. (a) Displacement of roof and weak interlayer. (b) Enlarged view of the rapid development stage.
Processes 11 01198 g006
Figure 7. Comparison of Maximum Displacement.
Processes 11 01198 g007
Figure 8. Distribution of the Plastic Zone of Roof in schemes I and II. (a) Scheme I—0.5 times L. (b) Scheme II—0.5 times L. (c) Scheme I—0.8 times L. (d) Scheme II—0.8 times L. (e) Scheme I—1.0 times L. (f) Scheme II—1.0 times L.
Processes 11 01198 g008
Figure 9. Simulation Results of Scheme III. (a) Scheme III—0.5 times L. (b) Scheme III—0.8 times L. (c) Scheme III—1.0 times L.
Processes 11 01198 g009
Figure 10. Simulation Results of Scheme V. (a) Scheme V—0.5 times L. (b) Scheme V—0.8 times L. (c) Scheme V—1.0 times L.
Processes 11 01198 g010
Figure 11. Simulation Results of Scheme VII. (a) Scheme VII—0.5 times L. (b) Scheme VII—0.8 times L. (c) Scheme VII—1.0 times L.
Processes 11 01198 g011
Figure 12. Relation between the roof deformation and pressure measurement coefficient. (a) Relationship between the vertical displacement of roadway roof and the pressure measurement coefficient. (b) Relationship between the vertical displacement of weak intercalation and the pressure measurement coefficient. (c) Comparison of maximum displacement under different k conditions.
Processes 11 01198 g012
Figure 13. Calculation of the Maximum Arch Fall of the Horizontal Layered Roof with the Soft Interlayer.
Processes 11 01198 g013
Figure 14. Flow of Support-While-Drilling.
Processes 11 01198 g014
Figure 15. Analysis of LWD Results of Borehole 1 #.
Processes 11 01198 g015
Figure 16. Roadway Support. (a) Roadway section support. (b) Roadway-roof support.
Processes 11 01198 g016
Figure 17. Site Effect.
Processes 11 01198 g017
Table 1. Mechanical Parameters of Surrounding Rock Materials.
Lithology ClassificationP
(kg/m3)
V0 (Gpa)G (Gpa)Coh (Mpa)Fric (°)Rm
(MPa)
Remarks
Medium sandstone250010.63.23.3421.4
Sandy mudstone260014.56.35.6381.842
Mudstone24008.262.76.7421.4
Coal17504.231.256.7322
Mudstone22000.50.72.3230.65Weak interlayers
Mudstone sandstone interbed25009.85.24.3381.62floor
Table 2. Model Scheme.
SchemeScheme IScheme IIScheme IIIScheme IVScheme VControl Group
Relative anchor positionRange of the free sectionAnchorage sectionAnchorage section edgeOutside the anchoring range/
0.2 times L0.5 times L0.8 times L1.0 times L1.2 times L0.0 L
From top plate0.5 m1.0 m2.0 m2.5 m3.0 m/
Table 3. Horizontal Stress Parameter Setting.
Lateral pressure coefficient (K)0.50.71.01.21.41.62.0
Horizontal stress/MPa10142024283240
Table 4. Scheme Settings of the Model.
Location of the Weak Rock StratumScheme IScheme IIScheme IIIScheme IVScheme VScheme VIScheme VII
0.5 times LK = 0.5K = 0.7K = 1.0K = 1.2K = 1.4K = 1.6K = 2.0
0.8 times L
1.0 times L
Table 5. Maximum arch falling parameters.
Pressure Measurement Coefficient/KLocation of Weak IntercalationMaximum Arch FallMaximum Collapse Angle of the Upper/β(°)
Span/2a3(m)Height/H(m)
K < 1Anchor rod free section1.2 times Lhiarctan[(0.6 L-a)/2b]
Anchor sectionhi or L
Above anchor rod1.3 times L
1 < K < 2Anchor free section and anchor section2(1.2~2.4)a(1.3~1.5) times Larctan[(0.1~1.4)a/2b]
Above anchor rod4a1.3 times Larctan(a/2b)
K ≥ 2Anchor free section, anchor section and above anchor8a1.7 times Larctan(3a/2b)
Table 6. Identification Data of the Strata Interface Position.
Borehole No12345
Location of soft rock/mmLower boundary2215–22432225–22522231–22342221–22132223–2298
Upper boundary3226–33123223–32463234–33533296–33233302–3319
Borehole No678910
Location of soft rock/mmLower boundary2122–22032186–22062188–22122195–22062210–2221
Upper boundary3233–32433219–32233226–33243206–33263265–3384
Table 7. Maximum Roof Separation (Unit: mm).
Layer Separator No.12345678910
2.0 m1211172320191581220
6.0 m8591012109765
Disclaimer/Publisher’s Note: The statements, opinions and data contained in all publications are solely those of the individual author(s) and contributor(s) and not of MDPI and/or the editor(s). MDPI and/or the editor(s) disclaim responsibility for any injury to people or property resulting from any ideas, methods, instructions or products referred to in the content.

