
Comparative Analysis of the Engine Performance and Emissions Characteristics Powered by Various Ethanol–Butanol–Gasoline Blends
Abstract
:1. Introduction
2. Experimental
3. Results and Discussion
4. Conclusions and Future Perspectives
Funding
Data Availability Statement
Acknowledgments
Conflicts of Interest
Abbreviations/Nomenclatures
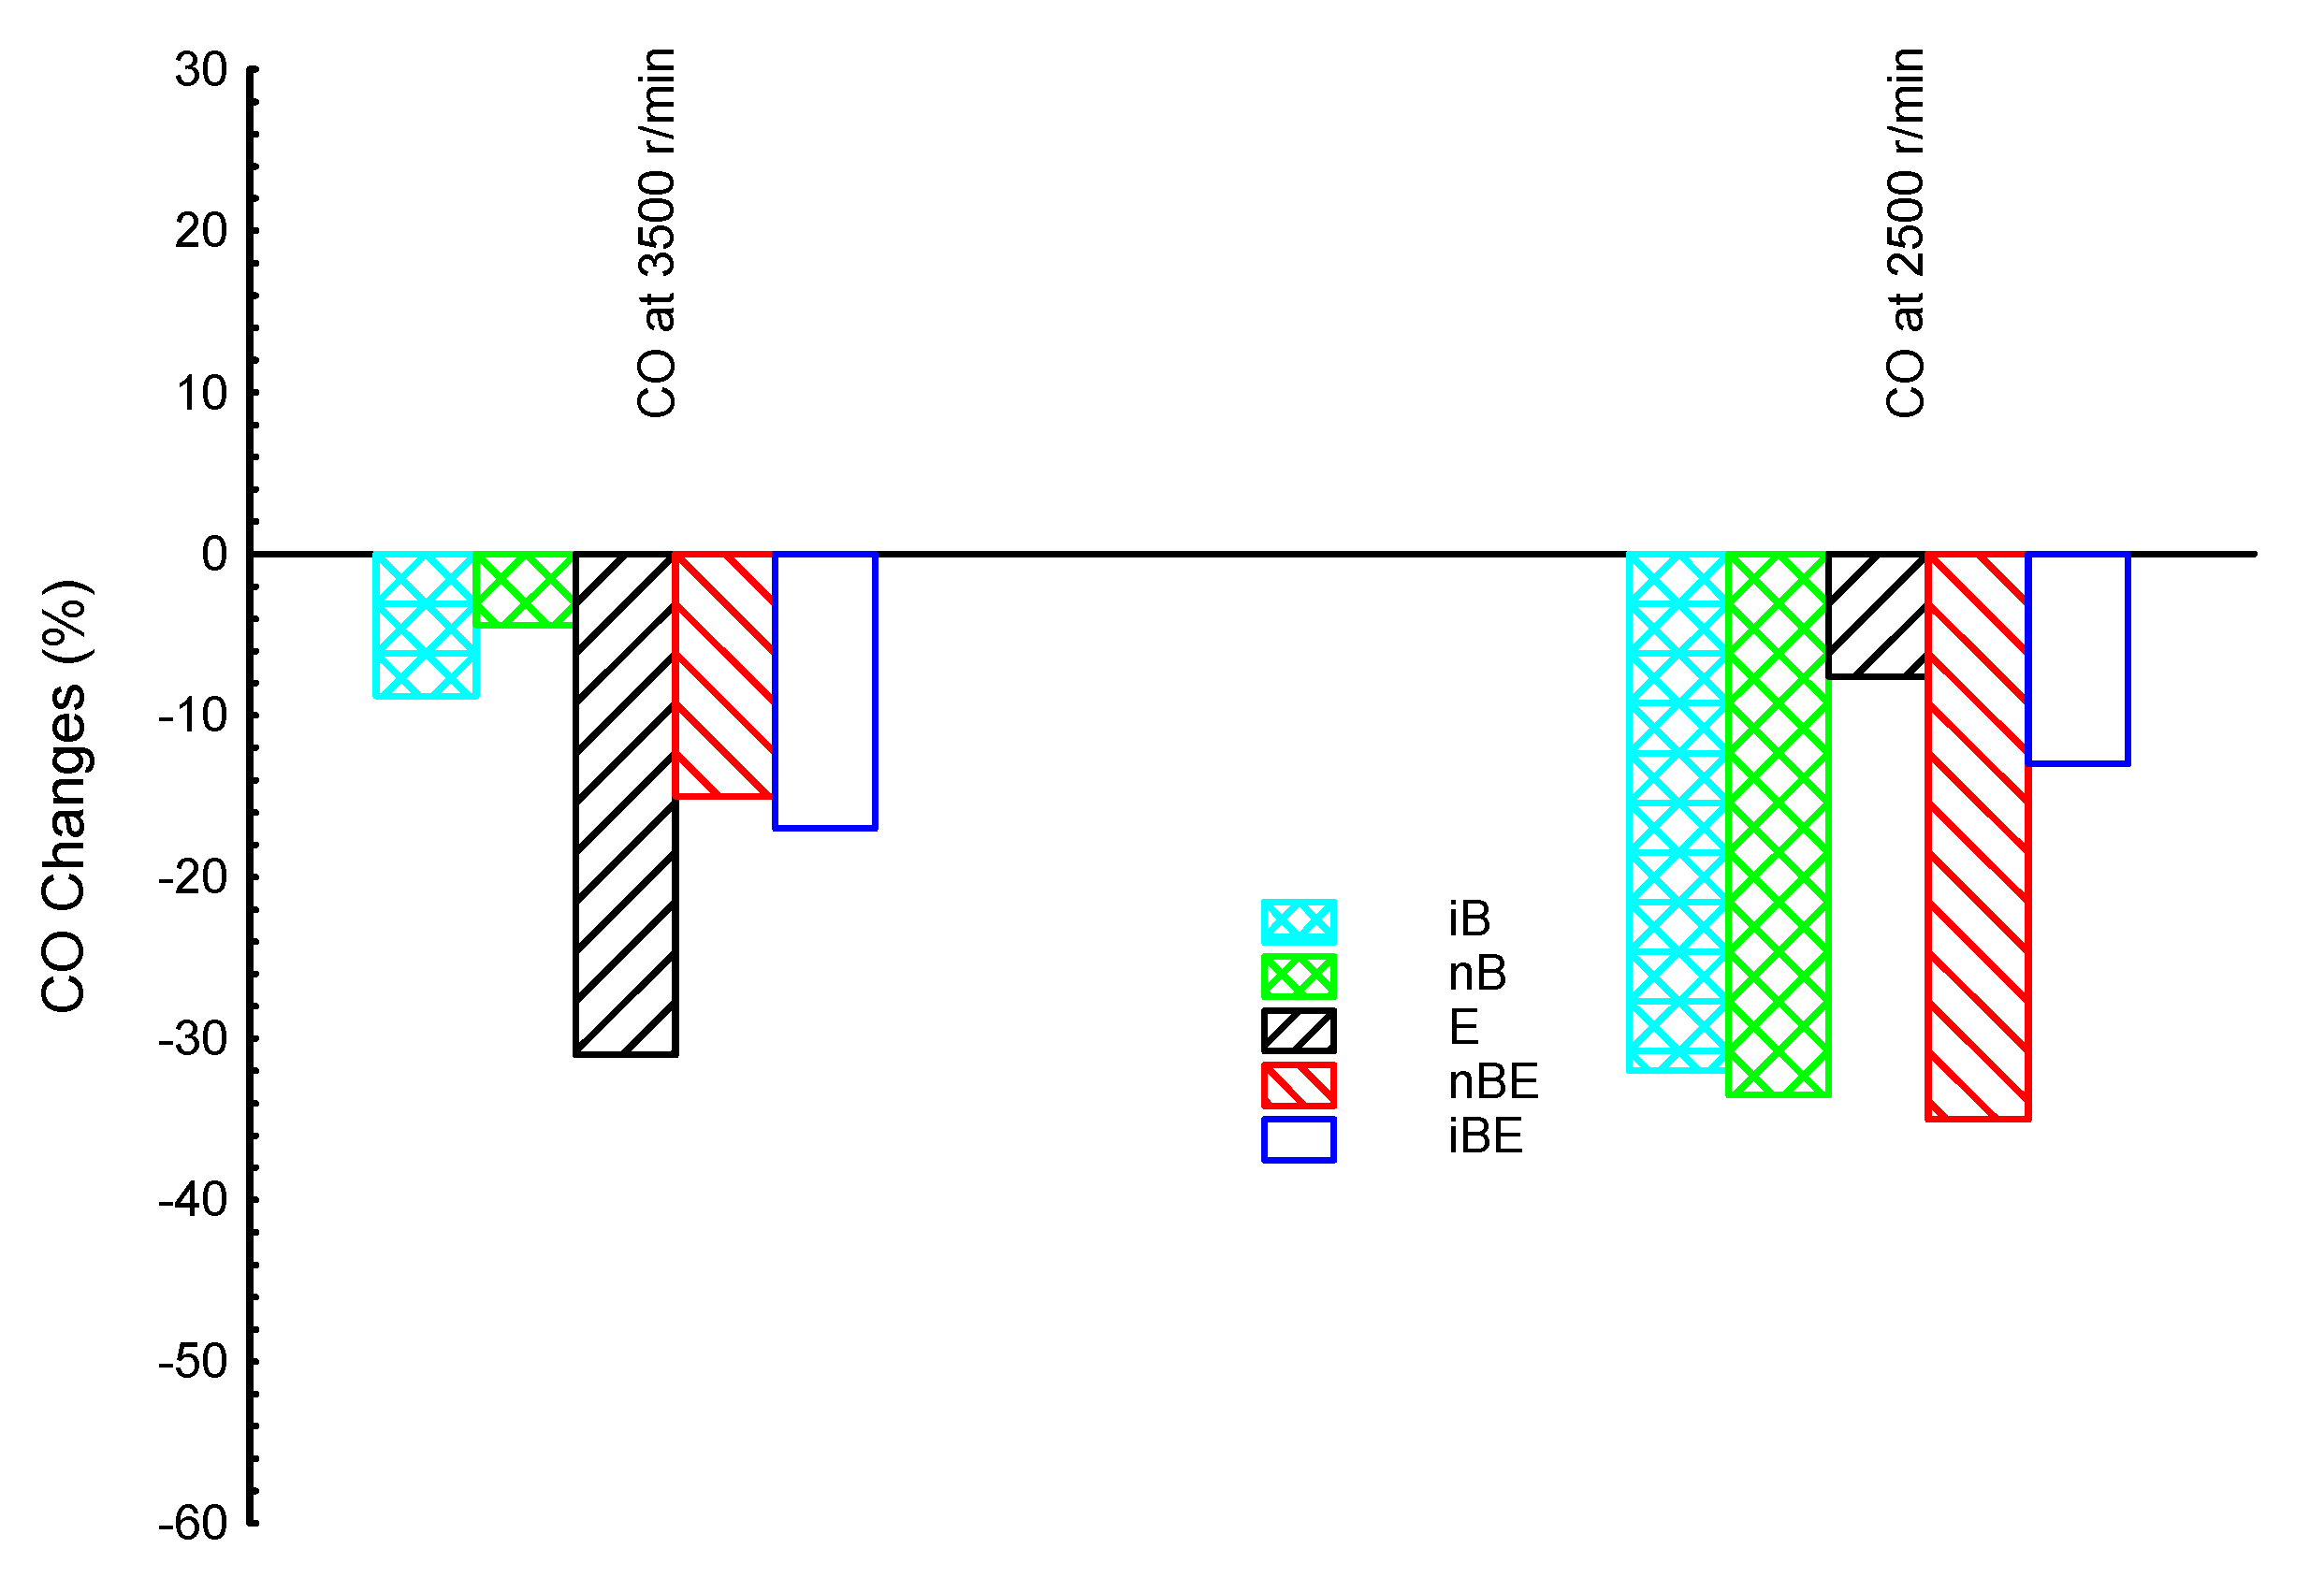
| CO | Carbon monoxide |
| CO2 | Carbon dioxide |
| UHC | Unburned hydrocarbon |
| BP | Brake power |
| Tq | Engine torque |
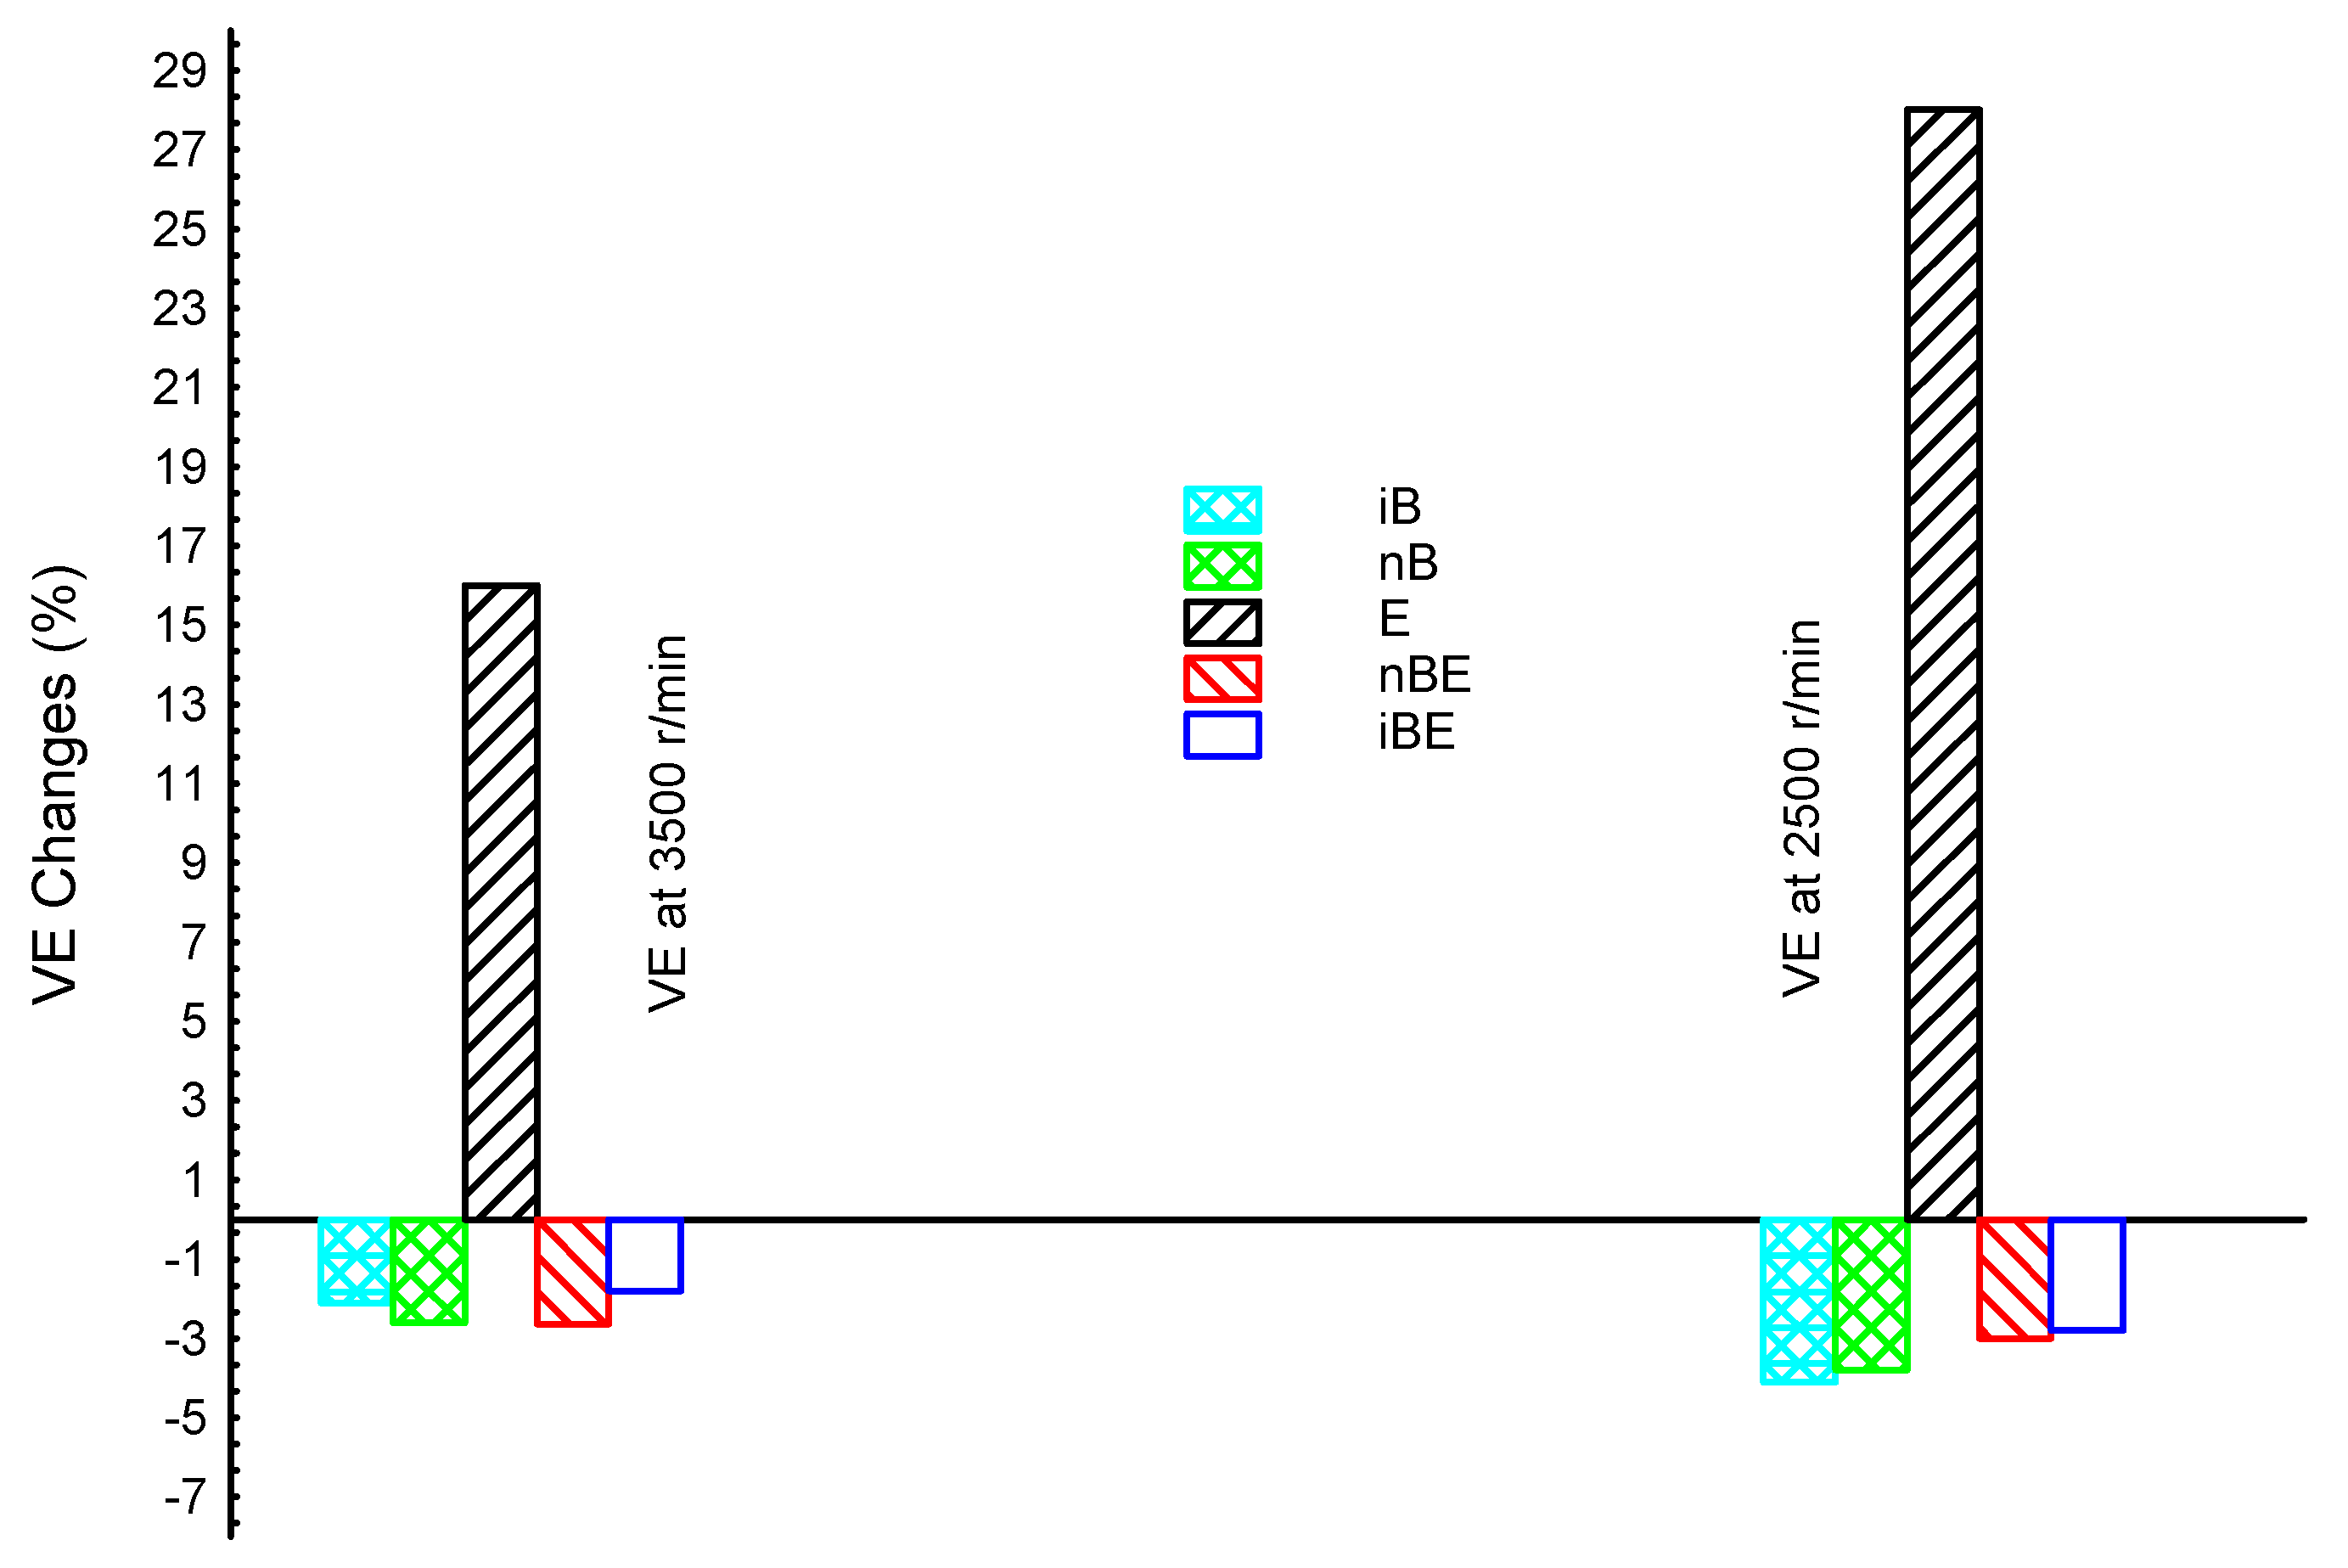
| VE | Volumetric efficiency |
| iB | i-Butanol–gasoline blend |
| nB | n-Butanol– gasoline blend |
| E | Bio-ethanol–gasoline blend |
| nBE | n-Butanol–bio-ethanol–gasoline blend |
| iBE | i-Butanol–bio-ethanol–gasoline blend |
References
- Elfasakhany, A.; Klason, T.; Bai, X.S. Modeling of Pulverised Wood Combustion Using a Functional Group Model. Combust. Theory Model. 2008, 12, 883–904. [Google Scholar] [CrossRef]
- Elfasakhany, A.; Tao, L.; Espenas, B.; Larfeldt, J.; Bai, X.S. Pulverised Wood Combustion in a Vertical Furnace: Experimental and Computational Analyses. Appl. Energy 2013, 112, 454–464. [Google Scholar] [CrossRef]
- Elfasakhany, A. Powder biomass fast pyrolysis as in combustion conditions: Numerical prediction and validation. Renew. Energy Focus 2018, 27, 78–87. [Google Scholar] [CrossRef]
- Elfasakhany, A.; Bai, X.S. Numerical and experimental studies of irregular-shape biomass particle motions in turbulent flows. Eng. Sci. Technol. 2019, 22, 249–265. [Google Scholar] [CrossRef]
- Elfasakhany, A. The Effects of Ethanol-Gasoline Blends on Performance and Exhaust Emission Characteristics of Spark Ignition Engines. Int. J. Automot. Eng. 2014, 4, 608–620. [Google Scholar]
- Cheng, S.; Kang, D.; Fridlyand, A.; Goldsborough, S.S.; Vuilleumier, D. Autoignition behavior of gasoline/ethanol blends at engine-relevant conditions. Combust. Flame 2020, 216, 369–384. [Google Scholar] [CrossRef]
- Elfasakhany, A. Experimental study on emissions and performance of an internal combustion engine fueled with gasoline and gasoline/n-butanol blends. Energy Convers. Manag. 2014, 88, 277–283. [Google Scholar] [CrossRef]
- Han, D.; Fan, Y.; Sun, Z.; Nour, M.; Li, X. Combustion and emissions of isomeric butanol/gasoline surrogates blends on an optical GDI engine. Fuel 2020, 27215, 117690. [Google Scholar] [CrossRef]
- Elfasakhany, A. Experimental investigation on SI engine using gasoline and a hybrid iso-butanol/gasoline fuel. Energy Convers. Manag. 2015, 95, 398–405. [Google Scholar] [CrossRef]
- Zhao, L.; Wang, D.; Qi, W. Comparative study on air dilution and hydrogen-enriched air dilution employed in a SI engine fueled with iso-butanol-gasoline. Int. J. Hydrogen Energy 2020, 45, 10895–10905. [Google Scholar] [CrossRef]
- Isam, E.Y.; Saleh, A.M. Butanol-gasoline blends impact on performance and exhaust emissions of a four stroke spark ignition engine. Case Stud. Therm. Eng. 2023, 41, 102612. [Google Scholar]
- Hosseini, H.; Hajialimohammadi, A.; Gavzan, I.J.; Hajimousa, M.A. Numerical and experimental investigation on the effect of using blended gasoline-ethanol fuel on the performance and the emissions of the bi-fuel Iranian national engine. Fuel 2023, 337, 127252. [Google Scholar] [CrossRef]
- Qadiri, U. Computational Investigations on MPFI Engine Fueled Blended Ethanol, H2O based Micro-Emulsions, and Conventional Gasoline. Environ. Adv. 2023; 100367, (in press). [Google Scholar] [CrossRef]
- Mortadha, K.M.; Hyder, H.B.; Zaid, M.H.A.-D.; Zaid, S.K.; Mudhaffar, S.A.-Z. Effect of ethanol-gasoline blends on SI engine performance and emissions. Case Stud. Therm. Eng. 2021, 25, 100891. [Google Scholar]
- Iodice, P.; Amoresano, A.; Langella, G. A review on the effects of ethanol/gasoline fuel blends on NOX emissions in spark-ignition engines. Biofuel Res. J. 2021, 8, 1465–1480. [Google Scholar] [CrossRef]
- Dehhaghi, M.; Panahi, H.K.S.; Aghbashlo, M.; Lam, S.S.; Tabatabaei, M. The effects of nanoadditives on the performance and emission characteristics of spark-ignition gasoline engines: A critical review with a focus on health impacts. Energy 2021, 225, 120259. [Google Scholar]
- Nazzal, T. Experimental study of gasoline –Alcohol blends on performance of internal combustion engine. Eur. J. Sci. Res. 2011, 52, 16–22. [Google Scholar]
- Elfasakhany, A. Investigations on the effects of ethanol-methanol-gasoline blends in a spark-ignition engine: Performance and emissions analysis. Eng. Sci. Technol. 2015, 18, 713–719. [Google Scholar] [CrossRef]
- Balaji, D.; Govindarajan, P.; Venkatesan, J. Influence of isobutanol blend in spark ignition engine performance operated with gasoline and ethanol. Int. J. Eng. Sci. Technol. 2010, 2, 2859–2868. [Google Scholar]
- Sileghem, L.; Coppens, A.; Casier, B.; Vancoillie, J.; Verhelst, S. Performance and emissions of iso-stoichiometric ternary GEM blends on a production SI engine. Fuel 2014, 117, 286–293. [Google Scholar] [CrossRef]
- Elfasakhany, A.; Mahrous, A.-F. Performance and emissions assessment of n-butanol–methanol–gasoline blends as a fuel in spark-ignition engines. Alex. Eng. J. 2016, 55, 3015–3024. [Google Scholar] [CrossRef]
- Turner, J.W.G.; Pearson, R.J.; Dekker, E.; Iosefa, B.; Johansson, K.; Bergstom, K. Extending the role of alcohols as transport fuels using iso-stoichiometric ternary blends of gasoline, ethanol and methanol. Appl. Energy 2013, 102, 72–86. [Google Scholar] [CrossRef]
- Andersen, V.F.; Anderson, J.E.; Wallington, T.J.; Nielsen, O.J. Vapor pressures of alcohol–gasoline blends. Energy Fuels 2010, 24, 3647–3654. [Google Scholar] [CrossRef]
- Elfasakhany, A. Exhaust emissions and performance of ternary iso-butanol–bio-methanol–gasoline and n-butanol–bio-ethanol–gasoline fuel blends in spark-ignition engines: Assessment and comparison. Energy 2018, 158, 830–844. [Google Scholar] [CrossRef]
- Elfasakhany, A. Experimental study of dual n-butanol and iso-butanol additives on spark-ignition engine performance and emissions. Fuel 2016, 163, 166–174. [Google Scholar] [CrossRef]
- Siwale, L.; Kristóf, L.; Bereczky, A.; Mbarawa, M.; Kolesnikov, A. Performance, combustion and emission characteristics of n-butanol additive in methanol–gasoline blend fired in a naturally-aspirated spark ignition engine. Fuel Process. Technol. 2014, 118, 318–326. [Google Scholar] [CrossRef]
- Elfasakhany, A. Benefits and drawbacks on the use biofuels in spark ignition engines. In Mauritius; LAP LAMBERT Academic Publishing: Saarland, Germany, 2017; ISBN 978-620-2-05720-2. [Google Scholar]
- Elfasakhany, A. Biofuels in Automobiles: Advantages and Disadvantages: A Review. Curr. Altern. Energy 2019, 3, 1–7. [Google Scholar] [CrossRef]
- Elfasakhany, A. Gasoline engine fueled with bioethanol-bio-acetone-gasoline blends: Performance and emissions exploration. Fuel 2020, 274, 117825. [Google Scholar] [CrossRef]
- Elfasakhany, A. Investigation on performance and emissions characteristics of an internal combustion engine fuelled with petroleum gasoline and a hybrid methanol–gasoline fuel. Int. J. Eng. Technol. (IJET-IJENS) 2013, 13, 24–43. [Google Scholar]
- Elfasakhany, A. Investigations on performance and pollutant emissions of spark-ignition engines fueled with n-butanol-, iso-butanol-, ethanol-, methanol-, and acetone-gasoline blends: A comparative study. Renew. Sustain. Energy Rev. 2017, 71, 404–413. [Google Scholar] [CrossRef]
- Elfasakhany, A. Alcohols as Fuels in Spark Ignition Engines: Second Blended Generation; LAP LAMBERT Academic Publishing: Saarland, Germany, 2017; ISBN 978-3-659-97691-9. [Google Scholar]
- Elfasakhany, A. Performance and emissions analysis on using acetone-gasoline fuel blends in spark ignition engine. Eng. Sci. Technol. 2016, 19, 1224–1232. [Google Scholar] [CrossRef]
- Elfasakhany, A. State of Art of Using Biofuels in Spark Ignition Engines. Energies 2021, 14, 779. [Google Scholar] [CrossRef]
- Elfasakhany, A. Comparisons of Using Ternary and Dual Gasoline-Alcohol Blends in Performance and Releases of SI Engines. Arab. J. Sci. Eng. 2021, 46, 7495–7508. [Google Scholar] [CrossRef]
- Deng, B.; Yang, J.; Zhang, D.; Feng, R.; Fu, J.; Liu, J.; Li, K.; Liu, X. The challenges and strategies of butanol application in conventional engines: The sensitivity study of ignition and valve timing. Appl. Energy 2013, 108, 248–260. [Google Scholar] [CrossRef]
- Wallner, T.; Miers, S.A.; McConnell, S. A comparison of ethanol and butanol as oxygenates using a direct-injection, spark-ignition engine. J. Eng. Gas Turbines Power 2009, 131, 032802. [Google Scholar] [CrossRef]
- Irimescu, A. Performance and fuel conversion efficiency of a spark ignition engine fueled with iso-butanol. Appl. Energy 2012, 96, 477–483. [Google Scholar] [CrossRef]
- Zhou, N.; Huo, M.; Wu, H.; Nithyanandan, K.; Lee, C.F.; Wang, Q. Low temperature spray combustion of acetone-butanol-ethanol (ABE) and diesel blends. Appl. Energy 2014, 117, 104–115. [Google Scholar] [CrossRef]
- Lapuerta, M.; Contreras, R.G.; Fernandez, J.C.; Dorado, M.P. Stability, lubricity, viscosity, and cold-flow properties of alcohol-diesel blends. Energy Fuels 2010, 24, 4497–4502. [Google Scholar] [CrossRef]
- Elfasakhany, A. Dual and Ternary Biofuel Blends for Desalination Process: Emissions and Heat Recovered Assessment. Energies 2021, 14, 61. [Google Scholar] [CrossRef]


| Gas Analyzer | Engine | ||
|---|---|---|---|
| Weight | 9 kg | Type | SI (spark ignition) |
| Warm-up period | 10 min | No. of cylinders | 1 |
| Exhaust gas temp. range | 5–45 °C | No. of valves | 2 |
| Apparatus heating range | 0−130 °C, resolution ±1 °C | Bore (mm) | 65.1 |
| Voltage | 230 V (+10%/−15%) | Stroke (mm) | 44.4 |
| Frequency | 50 ± 1 Hz | Compression ratio | 7:1 |
| Power consumption | Max. 45 VA | Displacement (cm3) | 147.7 |
| Pollutant range | CO 0–10 vol.% CO2 0–20 vol.% UHC 0–2000 ppm | Maximum power (kW) | 1.5 |
| Weight | 17 kg | ||
| Fuel | Gasoline | Bio-Ethanol | i-Butanol | n-Butanol | |
|---|---|---|---|---|---|
| Property | |||||
| Formula | C8H15 | C2H6O | C4H10O | C4H10O | |
| C, H, O value (wt.%) | 86, 14, 0 | 52, 13, 35 | 65, 13.5, 21.5 | 65, 13.5, 21.5 | |
| LHV (MJ/kg) | 43.5 | 27 | 33.3 | 33.1 | |
| Heat of evap. (kJ/kg) | 223.2 | 725.4 | 474.3 | 582 | |
| Stoich. A/F ratio | 14.6 | 9 | 11.1 | 11.2 | |
| Oxygen wt.% | 0.0 | 34.7 | 21.6 | 21.6 | |
| Density (kg/m3) | 760 | 790 | 802 | 810 | |
| P sat. at 38 °C (kPa) | 31 | 13.8 | 2.3 | 2.27 | |
| Flash temp. (°C) | −45 to −38 | 21.1 | 28 | 35 | |
| Ignition temp. (°C) | 420 | 434 | 415 | 385 | |
| Boiling temp. (°C) | 25–215 | 78.4 | 108 | 117.7 | |
| Solubility in water (mL/100 mL H2O) | <0.1 | Fully miscible | 10.6 | 7.7 | |
| Vapor toxicity | Moderate irritant | Toxic even in small doses | Moderate irritant | Moderate irritant | |
Disclaimer/Publisher’s Note: The statements, opinions and data contained in all publications are solely those of the individual author(s) and contributor(s) and not of MDPI and/or the editor(s). MDPI and/or the editor(s) disclaim responsibility for any injury to people or property resulting from any ideas, methods, instructions or products referred to in the content. |
© 2023 by the author. Licensee MDPI, Basel, Switzerland. This article is an open access article distributed under the terms and conditions of the Creative Commons Attribution (CC BY) license (https://creativecommons.org/licenses/by/4.0/).
Share and Cite
Elfasakhany, A. Comparative Analysis of the Engine Performance and Emissions Characteristics Powered by Various Ethanol–Butanol–Gasoline Blends. Processes 2023, 11, 1264. https://doi.org/10.3390/pr11041264
Elfasakhany A. Comparative Analysis of the Engine Performance and Emissions Characteristics Powered by Various Ethanol–Butanol–Gasoline Blends. Processes. 2023; 11(4):1264. https://doi.org/10.3390/pr11041264
Chicago/Turabian StyleElfasakhany, Ashraf. 2023. "Comparative Analysis of the Engine Performance and Emissions Characteristics Powered by Various Ethanol–Butanol–Gasoline Blends" Processes 11, no. 4: 1264. https://doi.org/10.3390/pr11041264