Article

Activation Energy of Ion Diffusion in an Electrode Material: Theoretical Calculation and Experimental Estimation with LiCoVO4 as an Example

by
Kirill S. Rybakov
1,*,
Arseni V. Ushakov
1,* and
Artem A. Kabanov
2,3
1
Physical Chemistry Department, Institute of Chemistry, Saratov State University, Saratov 410012, Russia
2
General and Inorganic Chemistry Department, Samara State Technical University, Samara 443100, Russia
3
Samara Branch of P. N. Lebedev Physical Institute of the Russian Academy of Sciences, Samara 443011, Russia
*
Authors to whom correspondence should be addressed.
Processes 2023, 11(5), 1427; https://doi.org/10.3390/pr11051427
Submission received: 7 April 2023 / Revised: 5 May 2023 / Accepted: 7 May 2023 / Published: 8 May 2023
(This article belongs to the Special Issue Advanced Lithium Battery Electrode Materials)

Abstract

:
The development of electrode materials for metal-ion batteries is a complex and resource-demanding process. The optimization of this development process requires a combination of theoretical and experimental methods. The former is used to predict the properties of materials and the latter to confirm them. Thus, it is very important to understand how the results of the modeling and experiment are related. In this study, we compare the results of determining the activation energies of lithium ion diffusion in cobalt(II)-lithium vanadate(V), which we obtained by calculations from first principles within the framework of density functional theory (DFT), with the experimental results, which we achieved by applying electrochemical methods such as cyclic voltammetry and galvanostatic and potentiostatic pulses. Based on the experimental and theoretical data obtained for LiCoVO4, we hypothesize that the limitation of the practically realizable capacity of the material at about 1/3 of the theoretical one is due to its structural limitations that lead to the impossibility of involving all lithium ions in the current-forming process. This reason is fixed by the simulation results, but is not detected by the experimental results.

1. Introduction

The tasks of developing the concept of sustainable energy are stated in the first lines of the national strategies of most progressive countries. This concept involves the construction of efficient energy accumulation and storage systems. Lithium-ion batteries are the foundation for such systems. This is primarily due to the fact that they combine energy intensity and energy efficiency [1]. Such a high demand for lithium-ion batteries constantly requires that they are provided with higher energy density, which primarily depends on the cathode materials, since they mostly determine the energy intensity of the battery [2], and also make up a significant part of its cost, mass, and volume [3].
The development of new electrode materials and improvement of existing ones is a very important and urgent task. It requires that the researcher combine various theoretical methods to predict the material properties and experimental methods to confirm them. To optimize the process of material development, it is important to know how the results of theoretical modeling are comparable with the results of the experiment, in order to understand on a qualitative and quantitative level the limits of applicability and objectivity of information obtained by a particular method. This article discusses the features revealed during the joint analysis of experimental data and the results of theoretical modeling for a cathode material based on cobalt(II)-lithium vanadate(V) LiCoVO4.
LiCoVO4 is an attractive cathode material due to its theoretical specific capacity of 148 mA·h·g−1 and its charge/discharge operating potential of 4.2 V relative to Li+/Li. The full realization of the theoretical possibilities corresponds to a specific energy of 622 W·h·kg−1. This value is more than or comparable to commercially available cathode materials such as LiCoO2 (518 W·h·kg−1), LiMn2O4 (400 W·h·kg−1), LiFePO4 (495 W·h·kg−1), LiCo1/3Ni1/3Mn1/3O2 (576 W·h·kg−1), and LiNi0.5Mn1.5O4 (610 W·h·kg−1) [4,5]. LiCoVO4 has the potential to provide an alternative to the electrode materials currently in use, as well as complementing a set of materials to choose from for specific applications and conditions.
LiCoVO4 has an inverted spinel structure (space group F d 3 ¯ m ) where lithium ions of a regular sample make up octahedral positions (16d), and cobalt and vanadium ions statistically divide and arrange both octahedral (16d) and tetrahedral (8a) positions. The corresponding formula is V 0.7   5 + Co 0.3   2 + 8 a Li 0.5   1 + V 0.15   5 + C o 0.35   2 + 16 d ( O 4   2 ) 32 e [6,7,8]. This is the presence of various atomistic schemes for filling the structure.
Previously [9], we obtained material based on LiCoVO4 and analyzed it using X-ray phase and morphological analysis. The unit cell parameter was 8.2774 ± 0.0004 Å, which is in good agreement with the works [6,7,10]. The particle size of the obtained material was less than 10 μm. In accordance with the data of galvanostatic cycling, the maximum specific discharge capacity was 44 mA·h·g−1, regardless of the synthesis mode, and the charging capacity also did not exceed the theoretical value. According to the cyclic voltammetry, the diffusion coefficients of lithium ions were moderate for solid ionic conductors; Dcat = 3.7·10−13 cm2·s−1 (for the reduced form, LiCoVO4) and Dan = 2.8·10−12 cm2·s−1 (for oxidized forms, Li1−xCoVO4).
The reasons for such a low specific capacity are not obvious, since the obtained samples are phase-pure, have micrometer sizes and relatively high diffusion coefficients, and compounds with a similar structure exhibit electrochemical activity [11].
The theoretical specific capacity of a material is expressed in accordance with Faraday’s laws:
Q = 26,800·n/M,
where Q (mA·h·g−1)—the specific capacity; 26,800 (mA·h·mol−1)—Faraday’s constant; n—number of electrons per unit of substance with molar mass M (g·mol−1). The number of electrons for the case of insertion or extraction of singly charged ions (for example, lithium ions) also corresponds to the number of such ions involved in the electrode reaction with the substance. For lithium-ion cathode materials, the first process is lithium ion extraction during charging. Thus, the incomplete extraction of lithium ions from the structure of the material which are potentially capable of participating in the intercalation process is the only factor that limits the level of the specific charge-discharge capacity of LiCoVO4. The fact that the material has structural resolutions for the electrode process, a high electrochemical potential, and a high theoretical capacitance is undoubtedly a necessary condition for the manifestation of electrochemical activity. However, this condition is far from being sufficient for the possible implementation of activity with a high energy density, since the electrochemical properties are affected by phase purity, morphology, and particle size distribution, as well as factors that are not directly related to the material, but also affect its functional behavior: the composition of the electrode composite, the method of manufacturing and forming the electrode, the electrolyte system, and others. Therefore, in a theoretical calculation, we exclusively consider the cathode material and model only its functional properties with the assumption that other factors are idealized.
In this study, we compare the results of theoretical and experimental methods for determining the activation energies of diffusion of lithium ions in cobalt(II)-lithium vanadate(V). We obtained theoretical values from first-principle calculations within the framework of density functional theory (DFT), and experimental values using cyclic voltammetry, and galvanostatic and potentiostatic pulse methods.

2. Materials and Methods

2.1. Computational Details

We used the experimental data of single-crystal X-ray diffraction for cobalt(II)-lithium vanadate(V) (a = 8.2760 Å, b = 8.2760 Å, c = 8.2760 Å, V = 566.84 Å3, space group F d 3 ¯ m ) from the work [6] as initial structural data. The structure of this material is disordered, and to take into account the stochastic arrangement of atoms, all possible atomistic schemes were generated using the Supercell program [12]. A cubic cell containing 8 formula units was used as an input structure for Supercell. In total, 52,364 nonequivalent configurations were generated according to the stoichiometry of Li8Co8V8O32.
The calculations were carried out in the framework of the density functional theory (DFT) using the generalized gradient approximation (GGA) method with the PBE (Perdew-Burke-Ernzerhof) exchange-correlation functional [13], implemented in VASP (Vienna Ab initio Simulation package). All calculations were performed for cells of 56 atoms. After preliminary convergence tests, the Brillouin zone was represented using a set of 4 × 4 × 4 k-points according to the Monkhorst–Pack scheme [14], and the cutoff energy in all calculations was set to 600 eV. In structural optimization, convergence thresholds of 10−6 eV and 10−5 eV·Å−1 were used for the values of the total (free) energy and interatomic forces, respectively. These parameters made it possible to adequately optimize the structures with reasonable computational and time costs, and a further increase in the accuracy of calculations leads to only minor changes.
We estimated the activation energy of diffusion of lithium ions in the cobalt(II)-lithium vanadate(V) structure using the NEB (Nudged Elastic Bands) method [15]. In the NEB calculations, the spring constant was set to −5.0 eV·Å−2, and the convergence thresholds for the total energy and ion forces were 10−3 eV and 10−2 eV·Å−1, respectively. The search for possible diffusion paths was carried out using the PATHFINDER code [16]. Interpolation of 8 intermediate images between known initial and final states was carried out using VTST scripts [17]. NEB calculations were carried out for a cell with a fixed volume and with parameters corresponding to the optimized values. The results obtained were visualized using the VESTA program [18].

2.2. Experimental Section

2.2.1. Material Synthesis Procedure

We obtained the active material (LiCoVO4) by solid phase reaction. The starting materials were lithium carbonate Li2CO3 (purity class chemically “pure”, Zavod redkih metallov, Novosibirsk, Russia), vanadium(V) oxide V2O5 (purity class “pure for analysis”, Himreaktivsnab, Ufa, Russia), and cobalt acetate Co(CH3COO)2·4H2O (purity class “pure”, Himreaktivsnab, Ufa, Russia). Homogenization of the stoichiometric mixture of starting materials was carried out by mechanical treatment at room temperature in an AGO-2 planetary mill-activator (Novits, Novosibirsk, Russia) at a carrier rotation frequency of 560 rpm for 20 min. Mechanical treatment was carried out in acetone medium. After processing, we annealed the prepared dry mixture in air at a temperature of 700 °C for 12 h. The heating rate was 10 °C·min−1.
The phase composition of the final product was controlled by X-ray phase analysis. The diffraction patterns were recorded at a speed of 2°·min−1, with a step of 0.01° using CuKα radiation on an Empyrean diffractometer (Malvern Panalytical, Almelo, The Netherlands). The supplementary file contains the X-ray diffraction pattern of the material and main results of its analysis by the Rietveld technique (Figure S1, List S1).

2.2.2. Making a Working Electrode and Electrochemical Measurements

To prepare the cathode, we thoroughly mixed the sample (LiCoVO4) with an electrically conductive additive (carbon black) and a binder (polyvinylidene fluoride, PVDF, in the form of a 3.00 wt.% solution in N-methylpyrrolidone) in the LiCoVO4: carbon black: PVDF mass ratio of 80.0:10.0:10.0. The resulting suspension was uniformly applied to aluminum plates 0.4 mm thick. After spreading, the electrodes were rolled to a thickness of 0.25 mm and dried in air for 12 h at a temperature of 100 °C. The loading level of the active material was 3.0–4.0 mg·cm−2. The results of galvanostatic cycling of the electrodes [9] are presented in the supplementary file in Figure S2.
We carried out the electrochemical measurements of the obtained samples by the methods of cyclic voltammetry (CV), and galvanostatic and potentiostatic pulses in sealed glass three-electrode cells. A composite based on LiCoVO4 was used as a working electrode, and metal lithium was used as an auxiliary and reference electrode. All electrochemical measurements were carried out at a variable temperature (5.00–35.00 °C) in an electrolyte consisting of a 0.67 M solution of lithium chlorate(VII) LiClO4 in a mixture of propylene carbonate and dimethoxyethane (with a volume ratio of 7:3). The temperature control of the cell was carried out using a thermostat (PolyScience, Niles, IL, USA) with an accuracy of ±0.01 °C.
We performed the CV measurements on an Elins P-20X8 (Elins, Chernogolovka, Russia) multichannel potentiostat; the potential sweep rate from cycle to cycle increased from 0.05 to 1 mV·s−1 in the potential range from 3 to 4.5 V. Investigations by pulse methods were carried out on an Elins P-45X potentiostat (Elins, Chernogolovka, Russia). In the galvanostatic mode, the magnitude of the pulsed current applied to the electrode was 500 μA, and its duration was 40 ms. In the potentiostatic mode, the value of the potential pulse was 40 mV relative to the equilibrium value, and the pulse duration was 200 ms. Before the upcoming measurement, the system relaxed at the required temperature for at least 5 h. An important feature was that short pulses did not lead to a significant change in the stoichiometry of the electrode material.

3. Results

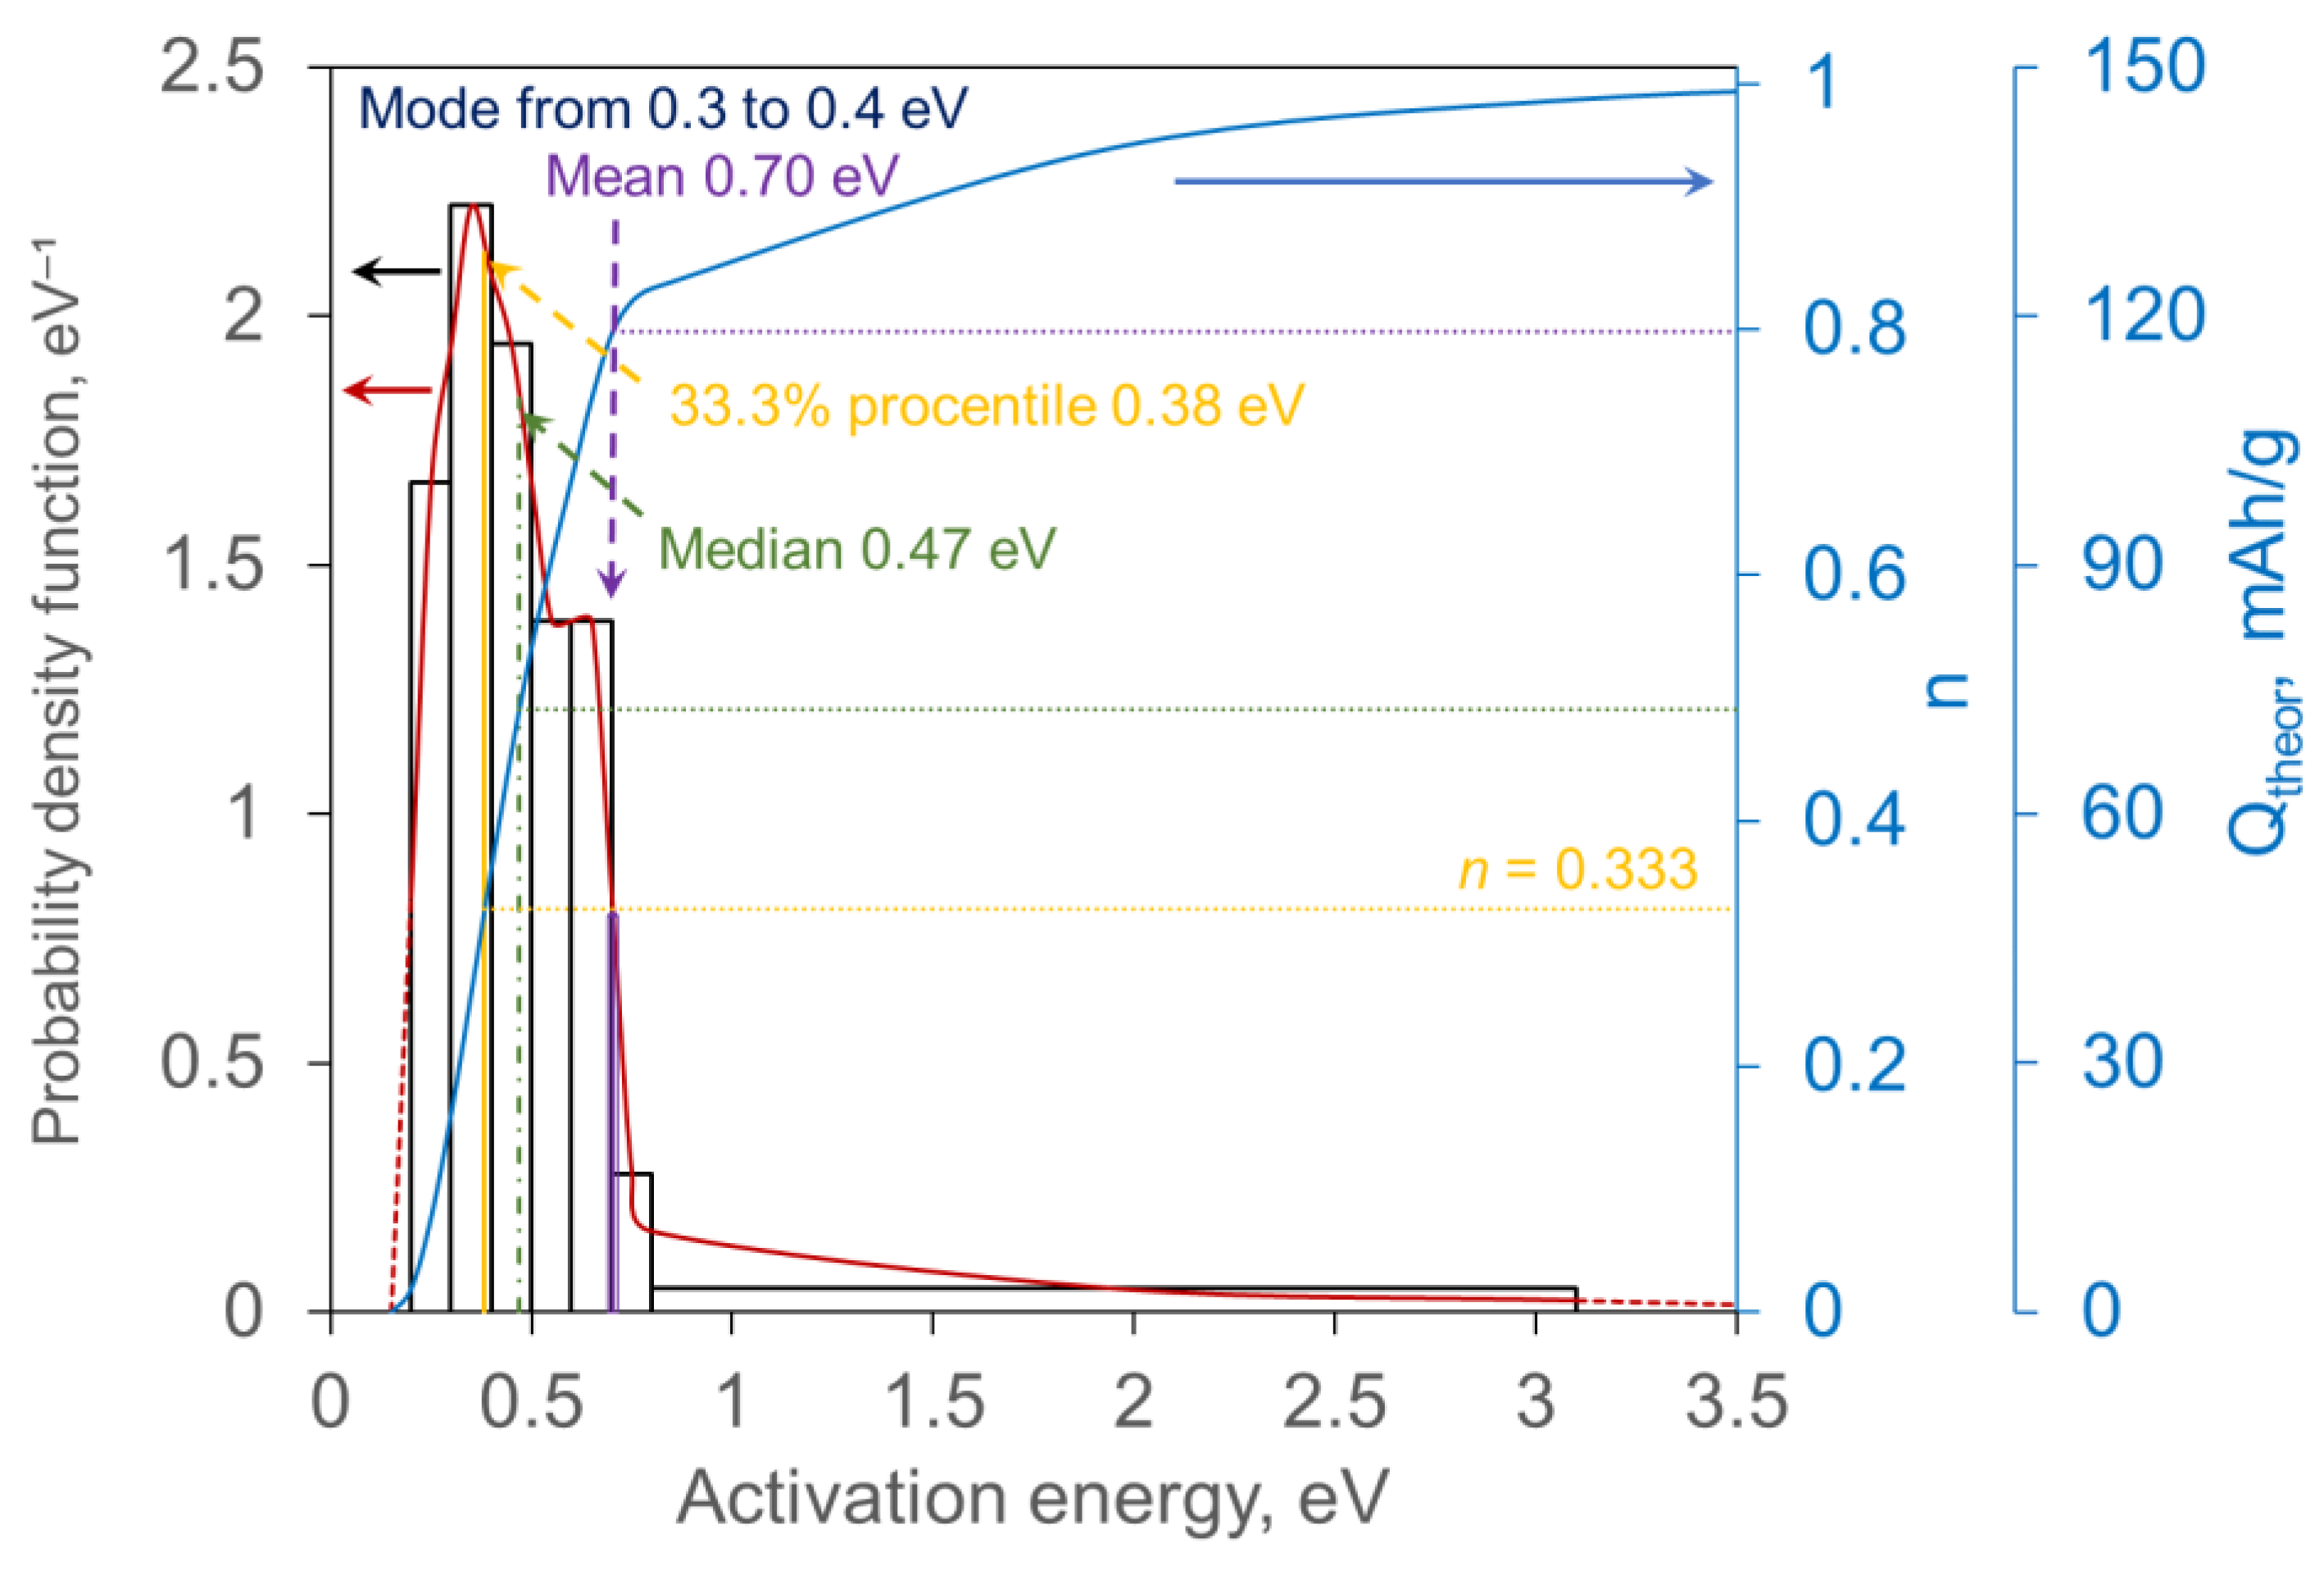
3.1. Theoretical Study

Cobalt(II)-lithium vanadate(V) has 52,364 nonequivalent structures. Optimization of such a quantity would require large computational costs, and thus a sample of 200 structures was randomly selected for a reasonable use of resources.
The energy values for the sample have a distribution close to normal (Figure 1; mean −403.813 eV, standard deviation 0.843 eV). The distribution center corresponding to the probability density maximum is the most representative estimate of the average energy of the LiCoVO4 structure. Therefore, when assessing the energy barriers to migration, the structure closest to the center of this distribution was used, as well as the nearest structures to the right and left of the center for a more detailed consideration of changes in activation barriers (Table 1) in various configurations. It should also be noted that structures containing a cluster of four lithium atoms (inset in Figure 1) are predominantly located to the right of the center of the normal distribution and, accordingly, have a higher energy. Apparently, clustering is an energetically unfavorable process.
The NEB method was used to estimate the migration energies of possible lithium ion diffusion paths. Since the structure of this material is disordered, it contains many non-equivalent paths; therefore, for reasonable use of computational resources, only those with a length not exceeding 6 Å were considered. The migration energies were determined as the energy difference between the local minimum and the saddle point corresponding to the highest energy value along the lithium ion migration path (Figure 2, Table 2).
All possible paths required for the migration of lithium ions along the main crystallographic axes are presented in Figure 3. The migration distances and barriers for all three structures are summarized in Table 2. We found that the structures have activation barriers comparable to each other in the range from 0.20 to 3.05 eV. Based on the data on migration energies for potential and already well-established cathode materials [19,20,21,22], it can be assumed that if the path has an energy of more than 0.8 eV, then this transition is unlikely and this direction is not considered possible for diffusion.
All structures are characterized by a certain uniformity, which manifests itself in two-dimensional diffusion of lithium ions along the b axis in the [010] direction, the a axis in the [100] direction in the case of the first structure, and c axis in the [001] direction in the cases of the second and third, in an arcuate bend of the shape paths, as well as the presence of one extended path connecting clusters of lithium ions located on opposite sides of the unit cell (path marked in gray for structure 1, black for structure 2, and yellow for 3).
NEB calculations show that paths 11 of structure 1, 9 of structure 2, and 7 of structure 3 have the highest activation barriers, which are 3.05 eV, 2.84 eV, and 2.90 eV with the corresponding lengths of 5.465 Å, 5.248 Å, and 5.355 Å. There is a direct correlation between the migration distance and the barrier. At the same time, it should be noted that in structure 1, the nearest atom to lithium at the saddle point is the vanadium atom located at a distance of 2.31 Å, whereas in structures 2 and 3, the cobalt atoms are at distances of 2.29 Å and 2.07 Å, respectively. At the saddle point, the lithium ion crosses either a triangle (structure 1) or a tetragon (structures 2 and 3) formed by oxygen anions lying approximately in the same plane (Figure 2). The corresponding average Li-O distances at the saddle point are 1.88 Å, 2.13 Å, and 2.08 Å for structures 1, 2, and 3, respectively. The trend is that saddle points located in triangular windows suggest systematically lower migration barriers than those in tetragons. Apparently, the values of the migration energies in the aggregate are determined by the local atomic environment, the Coulomb interaction, interatomic distances, and the length of the path.
Pathway 11 (structure 1) ensures the bonding of lithium ions inside the unit cell along the direction of the parameter b, and path 9 (structure 2) and path 7 (structure 3) ensure the bonding of lithium ions between unit cells along the c direction. However, since these pathways are characterized by high energy barriers, this allows us to conclude that the LiCoVO4 crystallite built by translation of the considered unit cell may not have through channels. As a result, lithium ions, which are far from each other in terms of the volume of the crystallite, are not connected with each other by migration trajectories with a non-zero probability. Accordingly, the volume of crystallite from which extraction is possible is limited. This limitation is due not only to the slow diffusion of lithium ions, but also to the complete “break” of possible diffusion paths. This is consistent with the fact that in practice there is a significant capacity limitation (no more than 30% of the theoretical limit) and sensitivity to synthesis condition.
Figure 4 shows the energy profiles of paths 1–6 for structure 3. The asymmetric shape of the energy profiles indicates thermodynamic differences in the forward and reverse transitions of lithium ions. In addition, it is highly probable that, during delithiation, the phase with a low lithium content will have lower values of activation energy [22,23,24].
The results of our analysis allow us to draw a partial conclusion that all three structures do not have through migration channels and groups of lithium ions that are located in close proximity to each other have short diffusion paths with low energy barriers, and groups of lithium ions that are located over long distances have high-energy paths. Apparently, this pattern will be typical for all other variants of structures.
A set of values of the activation energy of diffusion of lithium ions also allows us to predict the capacity limit of the electrode material. In Figure 5, we present a histogram, a probability density curve, and distribution function curve. The mode (the most probable value) of the activation energy is in the range from 0.3 to 0.4 eV, the median (it is possible to meet the activation energy below and above this value with the same probability of 50%) is 0.47 eV, and the mean is 0.70 eV. The distribution function corresponds to the proportion of paths for which the activation energy is lower than the corresponding value. We believe that this also corresponds to the proportion of lithium ions that can be extracted along these paths, that is, the value of n in Equation (1), and is proportional to the theoretical specific capacity Q if the experimental mode provides a certain level of energy.
We can make some predictions basing on this distribution. For example, if we conduct an experiment so that the level of excess energy supplied is 0.47 eV (median distribution), then we should expect a maximum of 50% of 148 mA·h·g−1. We can expect 80% of 148 mA·h·g−1 if the input energy level is 0.70 eV (the average for the distribution). The realization of 1/3 of 148 mA·h·g−1 corresponds to a minimum level of excess energy of 0.38 eV.

3.2. Experimental Study

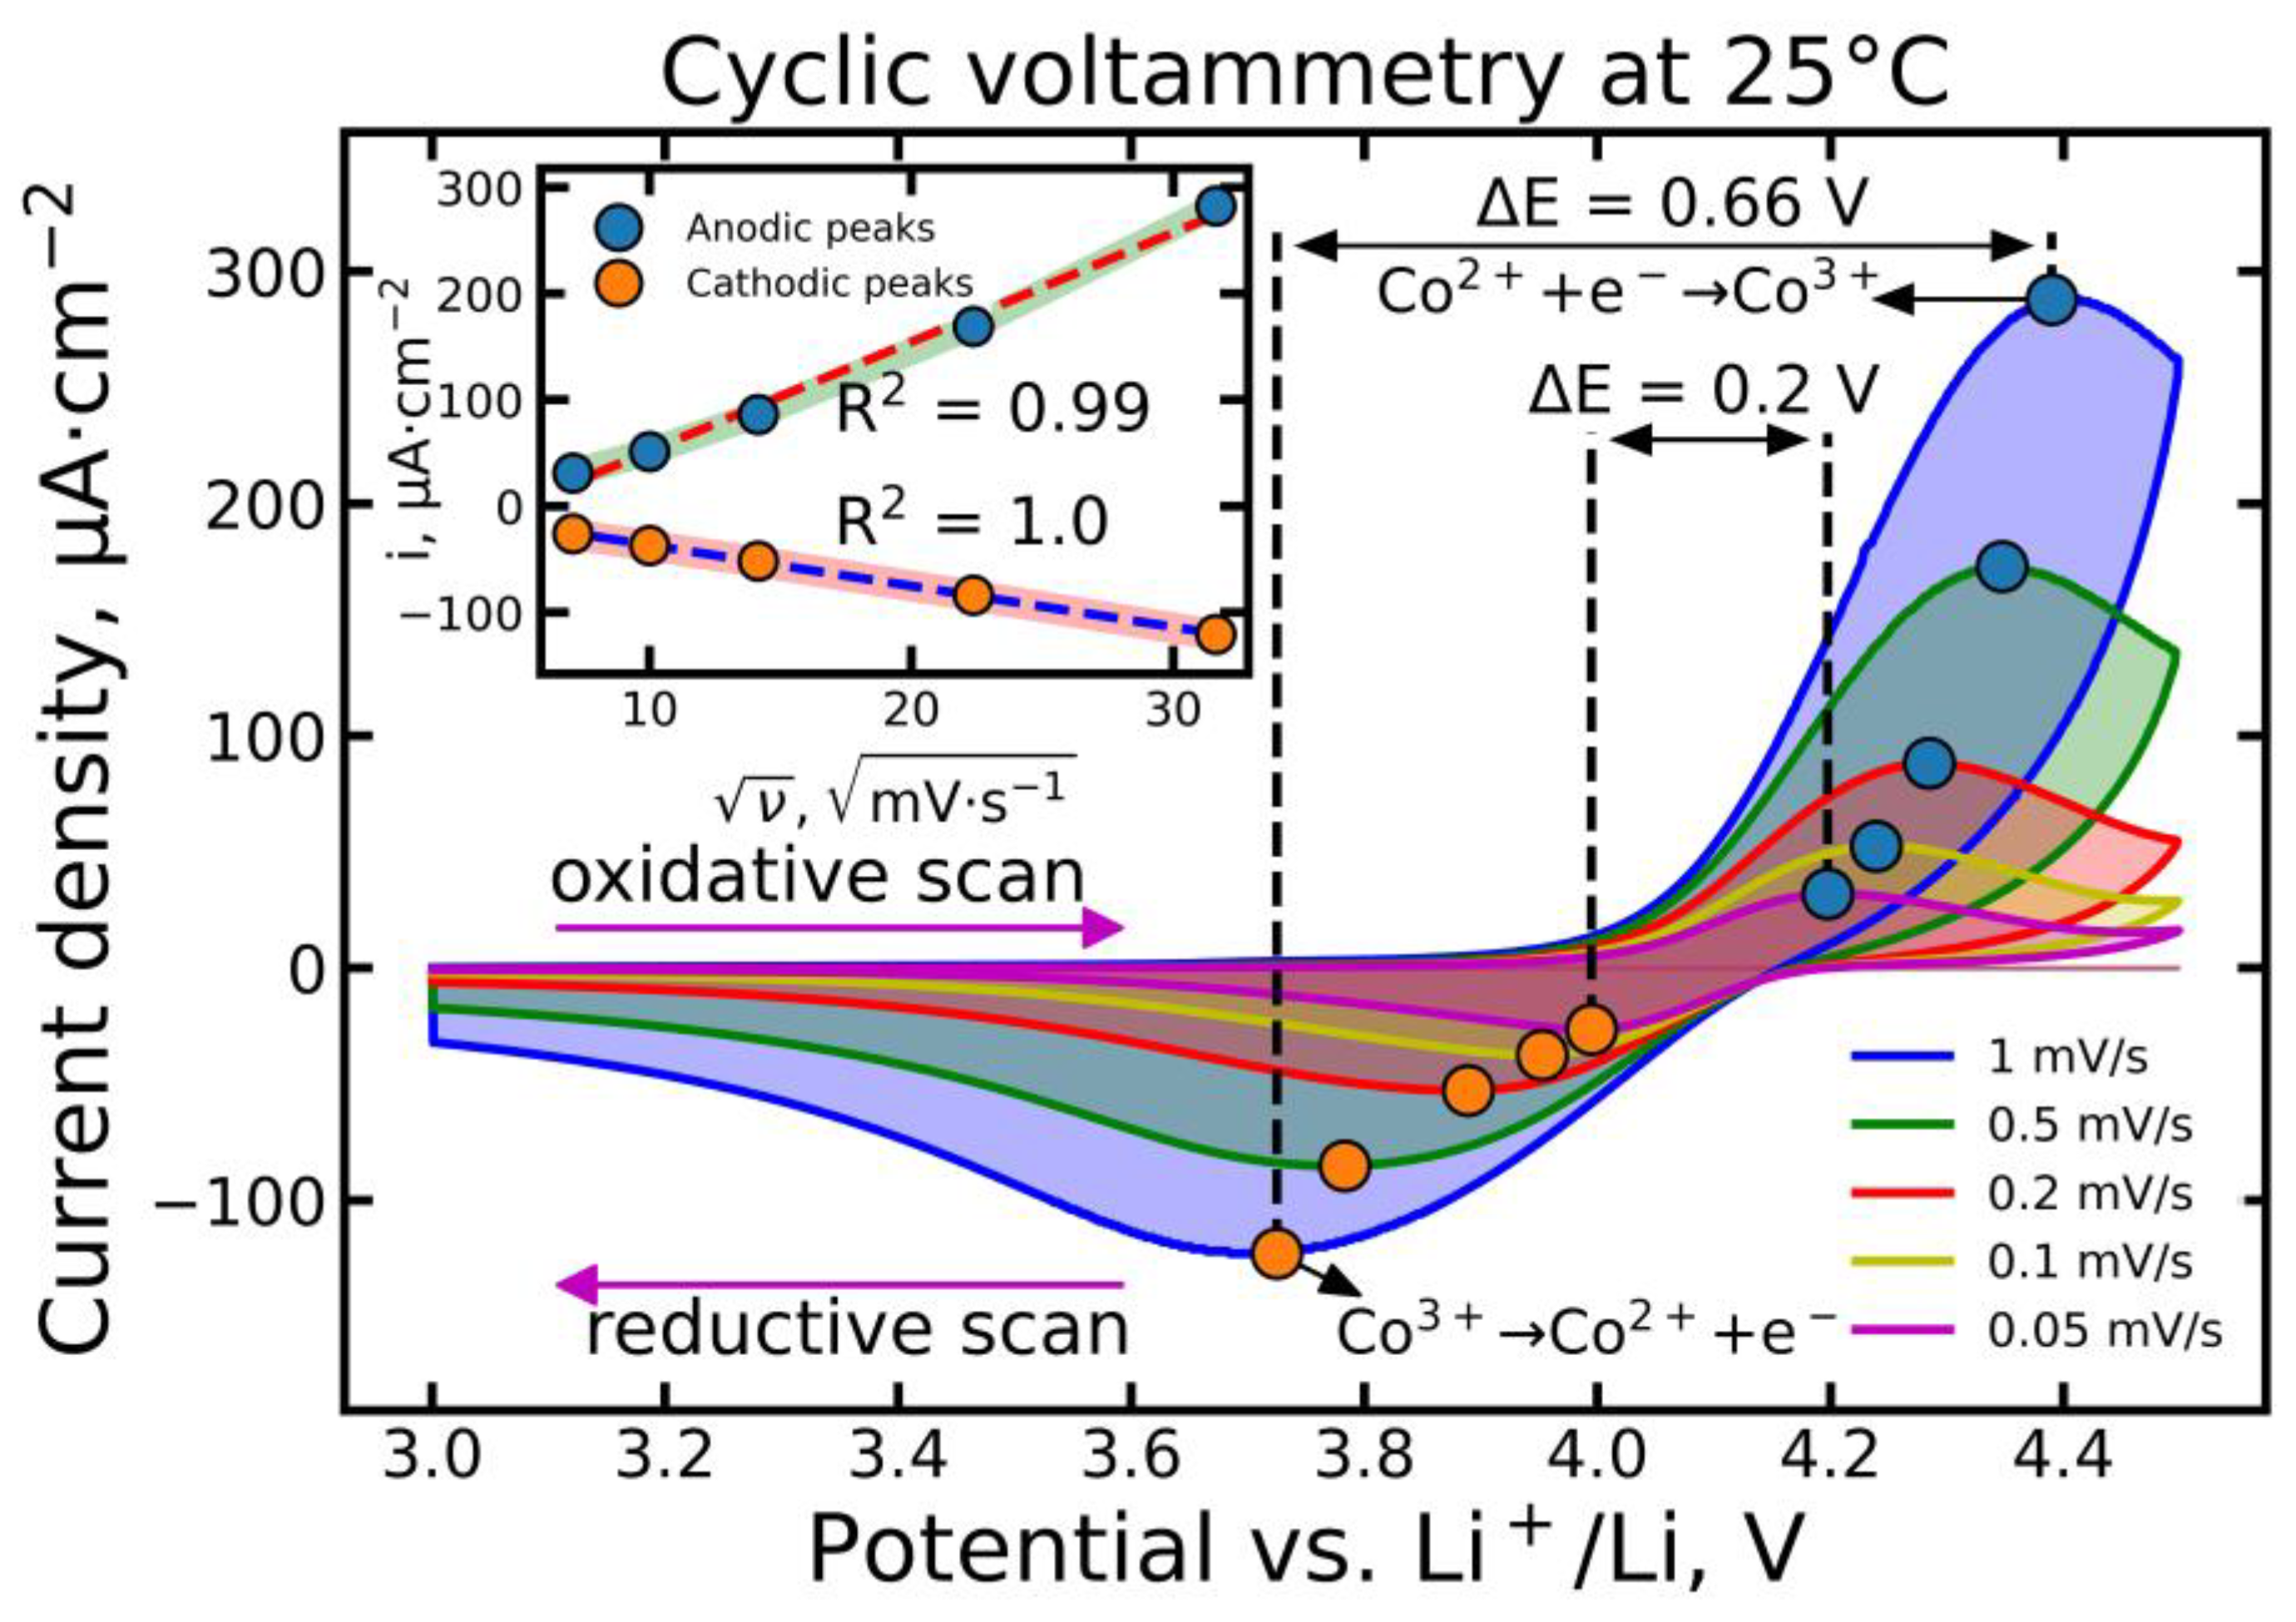
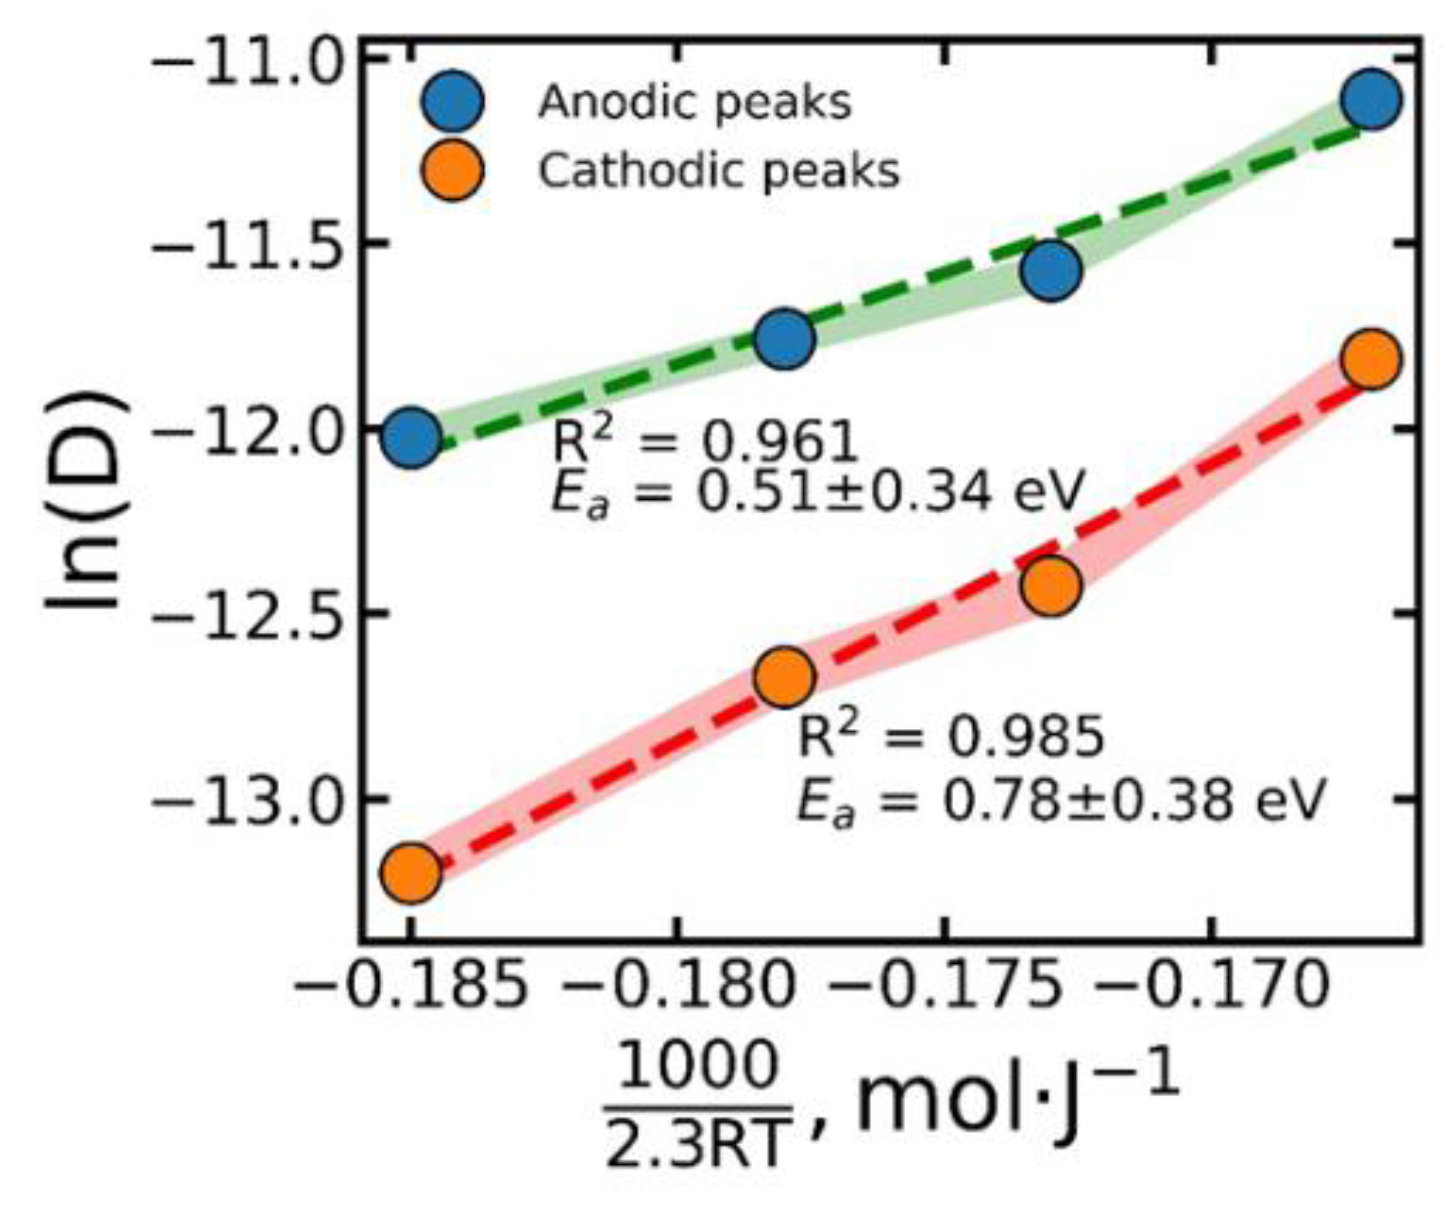
3.2.1. Cyclic Voltammetry

Cyclic voltammetry (CV) is a useful electrochemical tool for characterizing electrode reactions [25]. Figure 6 shows a typical LiCoVO4 cyclic current–voltage curve taken at 25 °C. In the first scan, there is one broad oxidation peak at 4.4 V, which corresponds to the oxidation of cobalt Co2+ → Co3+ + e, and one broad reduction peak at 3.7 V, corresponding to the reverse transition Co3+ + e → Co2+. A small relative shift in the potentials of the anode and cathode peaks is observed in the voltammograms at other temperatures, which can be seen from the change in the value of ΔE in Figure S3 in the Supplementary File. In addition, at any temperature, we observe the closeness of the capacities of the anode and cathode half-cycles at low potential sweep rates, which indicates a good reversibility of deintercalation of Li+ ions from LiCoVO4.
The heights of the oxidation and reduction peaks, as well as the distance between the peaks of opposite processes on the potential scale, decrease with decreasing potential scan rate. This suggests that among the possible diffusion and kinetic deceleration of the electrode process under study, it is difficult to single out the limiting stage unambiguously: the lithium ion diffusion stage and the discharge-ionization stage affect the rate of the entire process to a comparable extent.
For the material under consideration, there is a close-to-linear dependence of the current density of the cathode and anode peaks on the square root of the potential scan rate (inserts in Figure 6). To interpret this dependence, we use the Randles-Shevchik model [25]:
i p = 0.4463 v · n 3 F 3 R T · D 1 / 2 c 0 ,
where ip (A·cm−2)—peak current density; v (V·s−1)—polarization rate; n—number of electrons involved in the process; F = 96,485.34 (C·mol−1)—Faraday constant; R = 8.314 (J·K−1·mol−1)—universal gas constant; T (K)—absolute temperature; D (cm2·s−1)—diffusion coefficient; c0 (mol·cm−3)—initial concentration of electroactive particles.
When interpreting anodic peaks, available lithium ions for extraction from the spinel phase should be assumed to be electroactive particles in the model under consideration. In addition, the available vacancies for lithium ions for lithium incorporation into them should be assumed to be electroactive particles when interpreting cathode peaks. The initial concentration of electroactive particles in the considered phase can be estimated by the formula:
c 0 = n L i ·   ρ M ,
where n(Li) = 1—number of lithium atoms per LiCoVO4 formula unit; ρ = 4.234 (g·cm−3) is the density of the LiCoVO4 phase [1]; M = 180.81 (g·mol−1)—molar mass of LiCoVO4.
The values of the diffusion coefficients estimated in this way for the cathode and anode directions are summarized in Table 3. The values of Dcat. can be assumed to characterize the reduced form of the electrode material, and the values of Dan. characterize the oxidized one.
The dependence of diffusion coefficients on temperature in linearized coordinates is shown in Figure 7. The data obtained indicate a monotonous increase in diffusion coefficients with increasing temperature. Thus, we can conclude that temperature has a positive effect on the rate of the electrochemical lithiation/delithiation reaction in the considered temperature range.
The activation energies (Ea) for the diffusion coefficients (Dan. and Dcat.) were determined from the slopes of the graphs (Figure 7) in accordance with the S. Arrhenius model:
D = D 0 e x p E a R T ,
where D and D0 (m2·s−1) are the diffusion coefficient, and the limiting value of its extrapolation to T → ∞; Ea (J·mol−1) is diffusion activation energy; T (K) is temperature. The values of activation energy estimated using Equation (4) are given in Table 3.

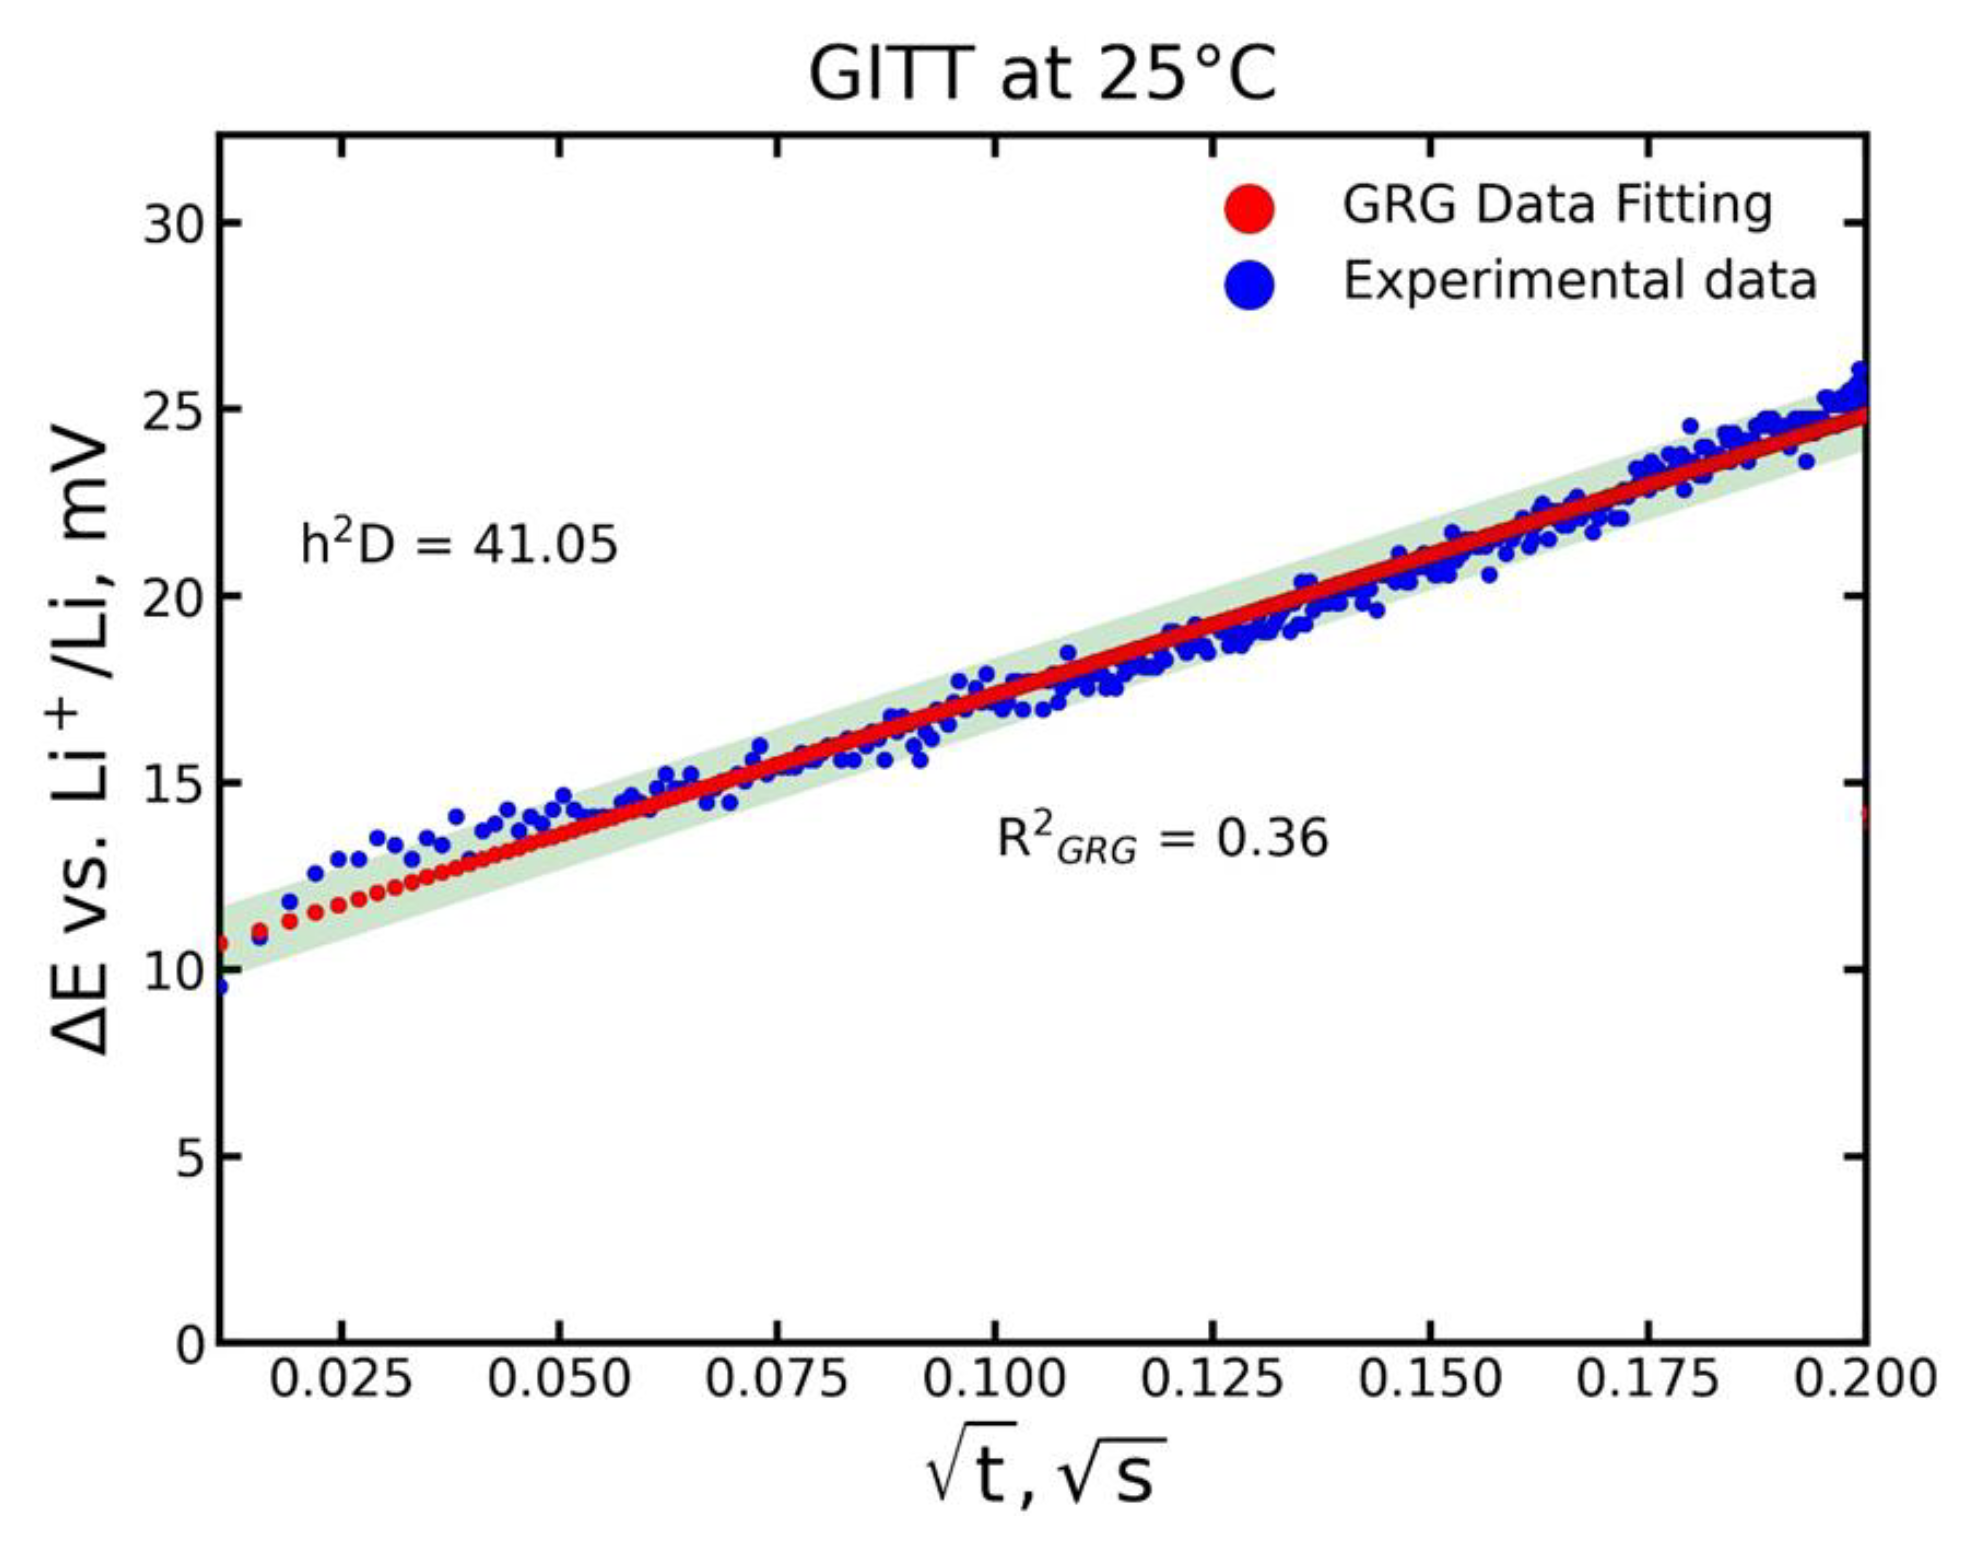
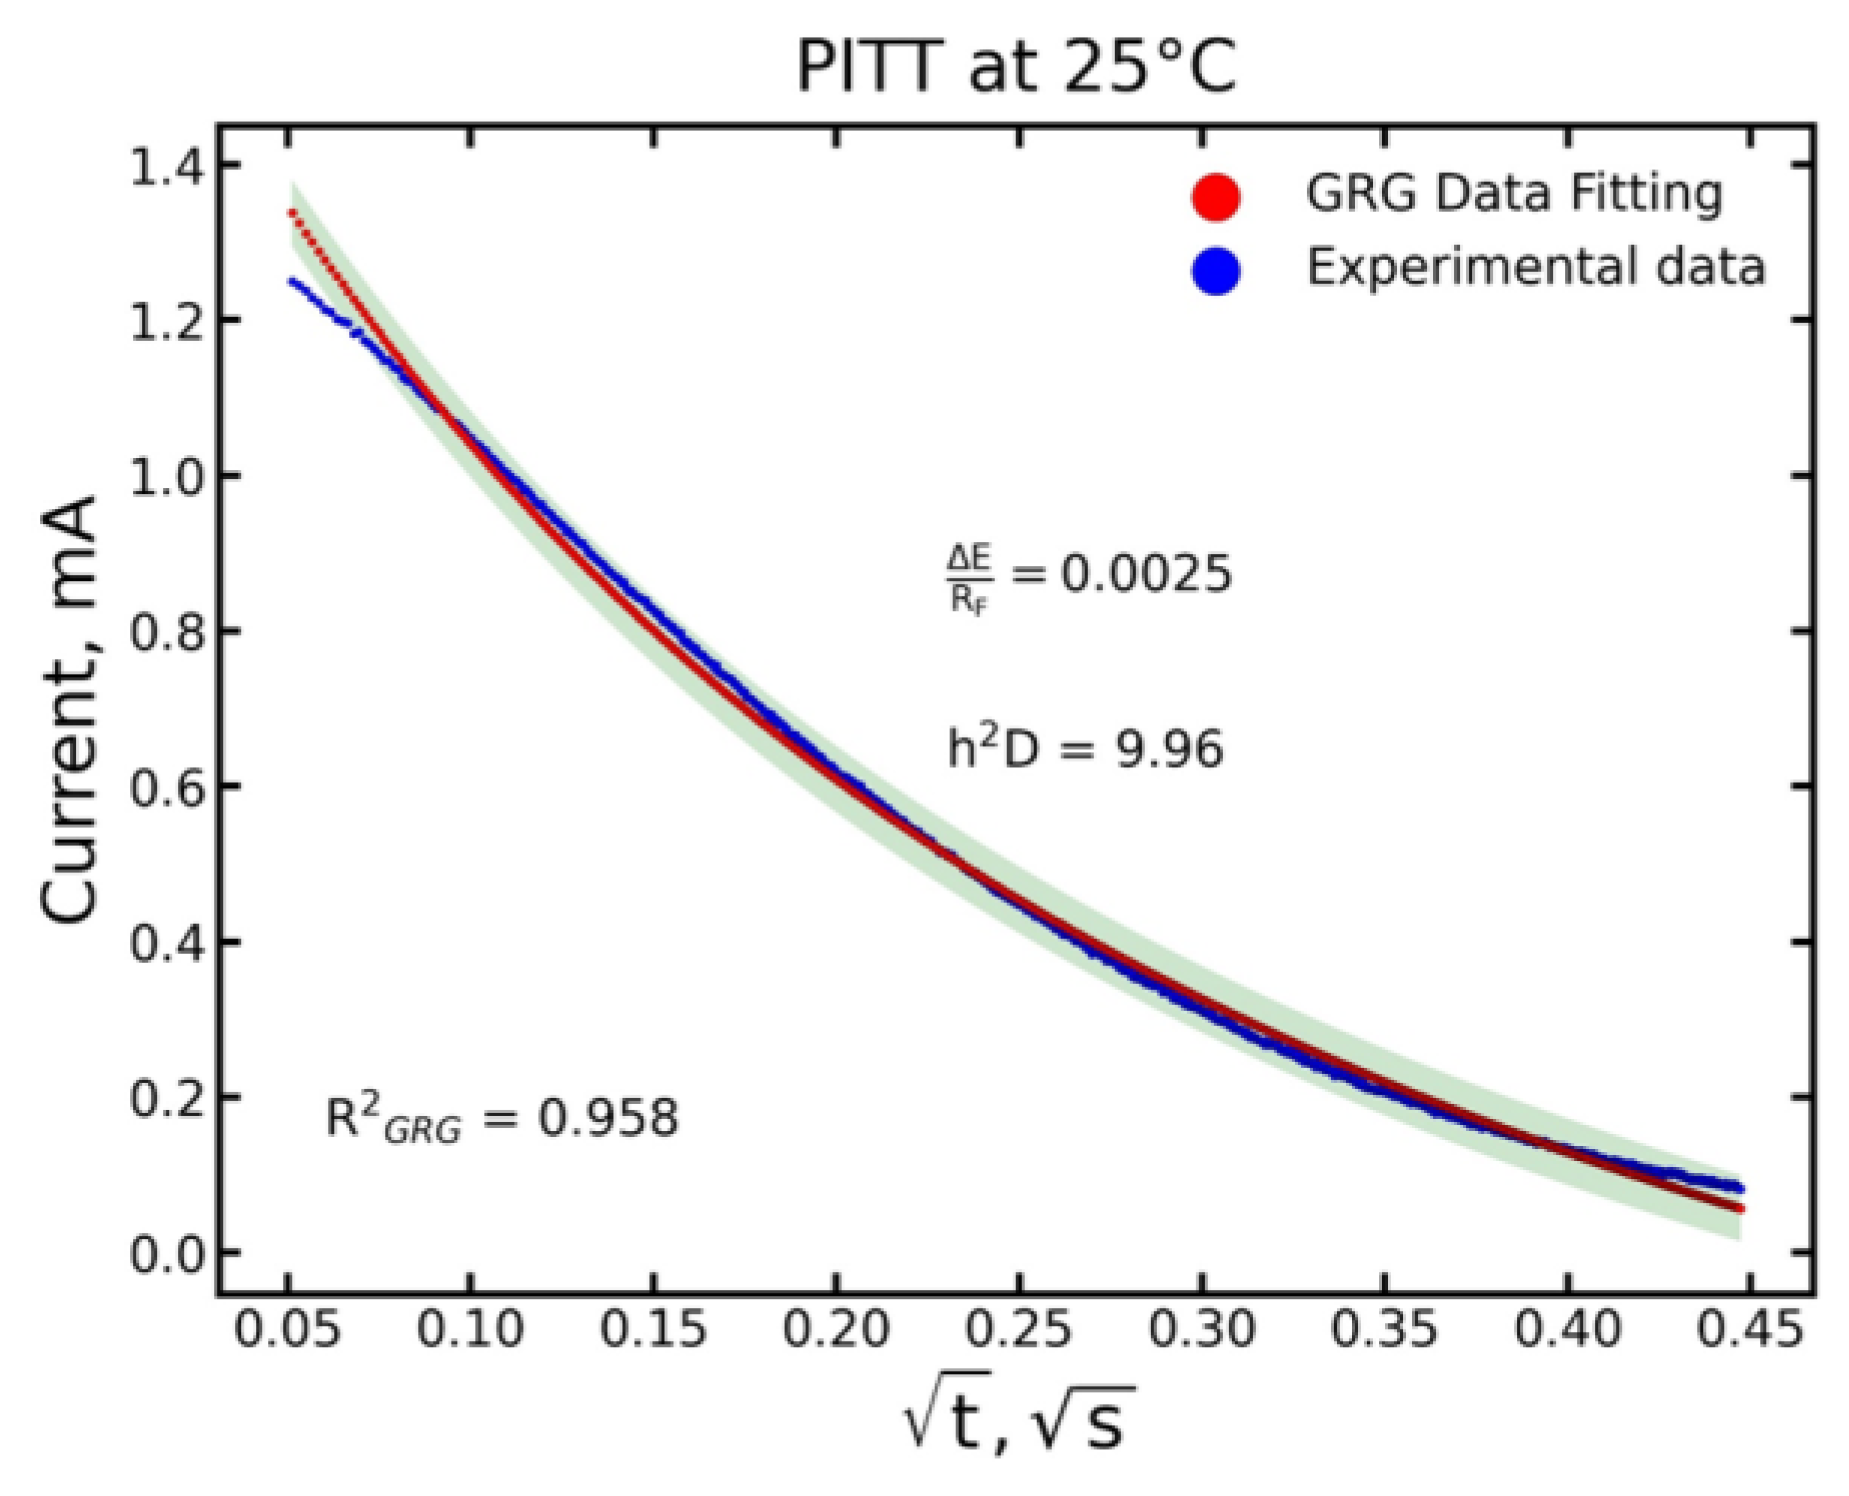
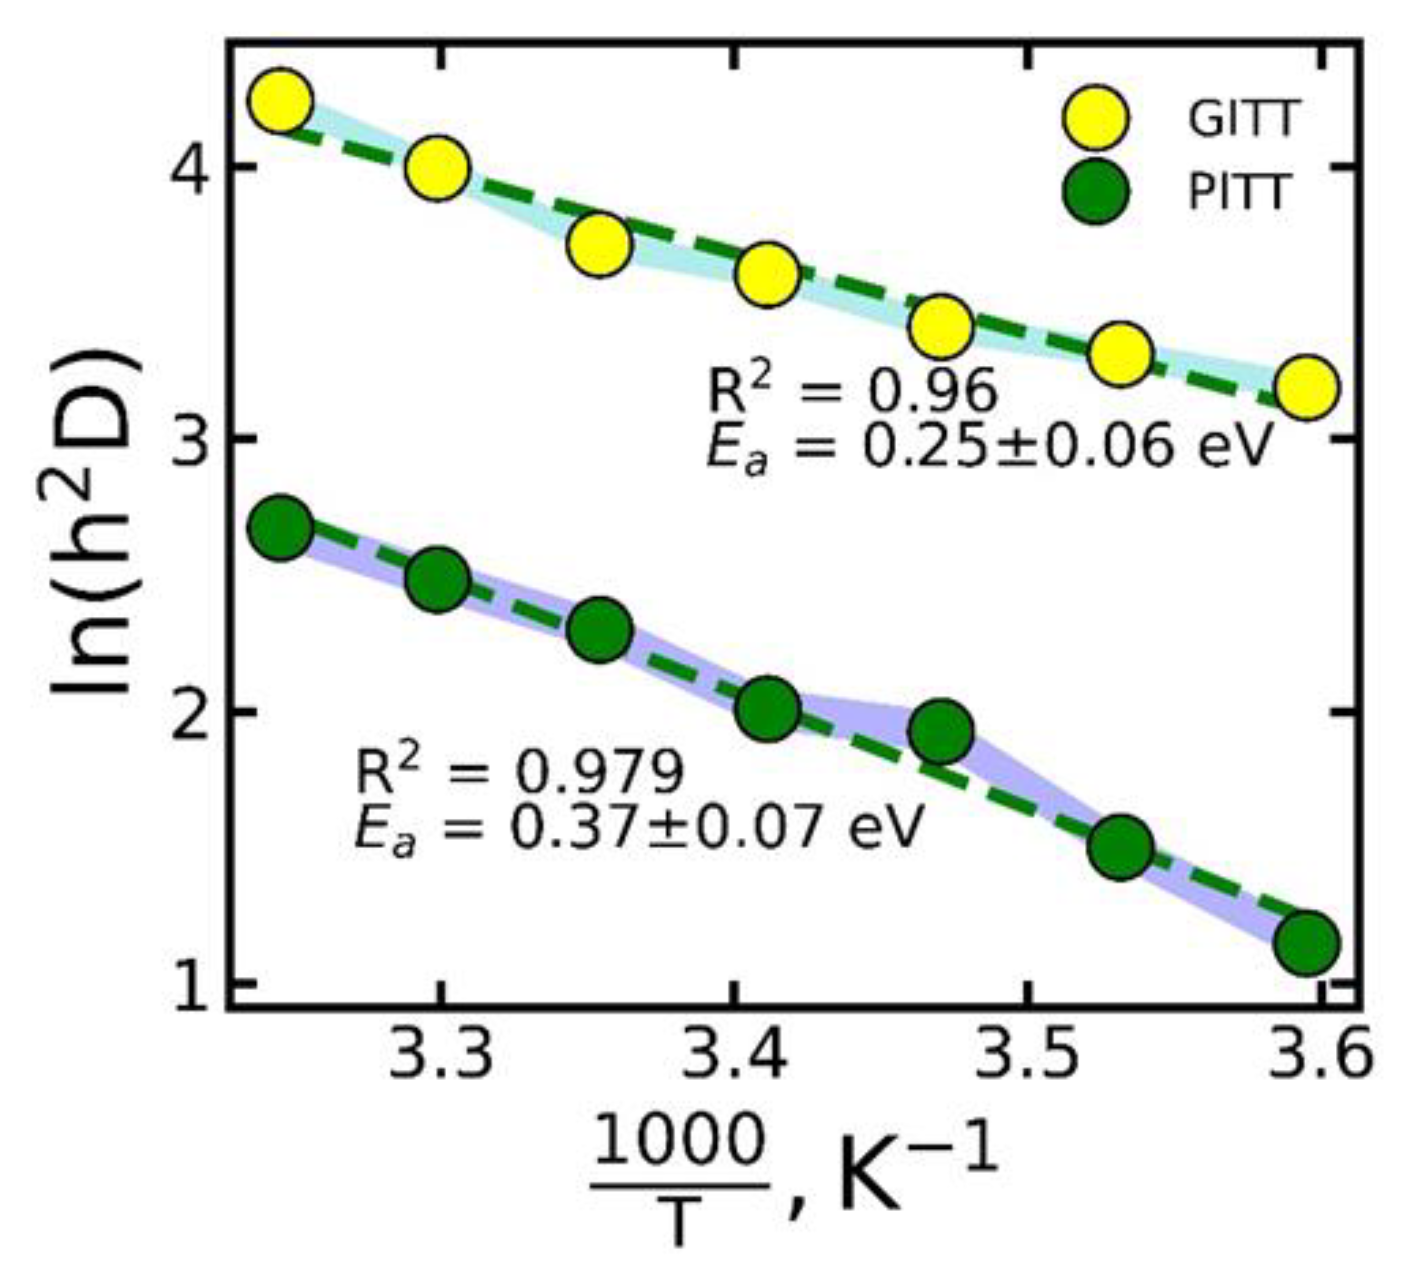
3.2.2. Galvanostatic and Potentiostatic Impulses

Galvanostatic and potentiostatic intermittent titration (GITT and PITT, respectively) are useful electrochemical methods that provide the opportunity to obtain both kinetic and thermodynamic information about the investigated electrochemical system, including with a change in composition [26]. In this study, we limited ourselves to single pulses (without registering the dependence of the electrode reaction parameters on the degree of delithiation), since the problem was to determine the activation energy of lithium ion diffusion.
Figure 8 shows a typical chronopotentiogram; others can be found in Figure S3 in the Supplementary File. During the pulse time equal to 40 ms, it is assumed that the diffusing particles of lithium ions cannot reach the second boundary of the particle. Therefore, the solution of the equation of Fick’s second law for semi-infinite diffusion under chronopotentiometric conditions [26] was used, which has the following form:
Δ E = Δ E s 2   i s n F d E d c c 0 ·   t π D ,
where Δ E = E E 0 (V)— difference between the current potential E and the initial equilibrium value E0; d E d c c 0 —derivative of the electrode potential with respect to the lithium concentration at the equilibrium point (c = c0); ΔEs = i s   R F (V)—conventionally instantaneous potential jump; i s (A·m−2)—current density; R F (Ohm·m2)—boundary resistance; D (m2·s−1)—lithium ion diffusion coefficient; t (s)—time; n—the number of electrons involved in the process; F = 96,485.34 (C·mol−1)—Faraday constant.
Under conditions of mixed kinetics (neither diffusion nor kinetic control significantly predominates), the characteristic parameter is important ( h = d E d c c 0 n F D R F , m−1). With this characteristic of such a process sensor, we consider not only separately h or D, but also the parameter h 2 D , the existing dimension of the inverse time. This cumulative parameter with the dimension reciprocal of the dimension of time can be assumed to be proportional to the frequency of elementary acts of a complex electrode process at a specific electrode. It combines the effect of deceleration in the volume due to slow diffusion and the effect of boundary resistance.
From Equation (5) we see that the dynamics of the potential in the galvanostatic pulse mode is reflected by the dependence on time, linearized in the coordinates E vs. t . The coefficients A and B of the regression equation Δ E = A B t allow us to find the cumulative parameter h 2 D as π 4 · B A 2 . Note that the convenience of the aggregate parameter is that its determination does not require separate determination of d E d c c 0 and R F , as well as the value of the specific surface area of the electrode material, which significantly shortens the experiment.
An example of using Equation (5) is shown in Figure 8. Using a set of parameters, the experimental data were approximated by theoretical curves using the least squares method (LSM). The parameters determined as a result of the regression are summarized in Table 4.
In the pulsed potentiostatic method, we also use the model of semi-infinite diffusion [26]. The current flowing in this case was described by the equation:
i s = Δ E R F exp h 2 D t erfc h D t
(decoding of symbols—see Equation (5)).
The cumulative parameter h2D and the ratio ΔE·RF−1 were found by the least squares method (LSM) by sorting through various combinations of these parameters (Figure 9).
The functional dependence of the current at the moment of the potential jump on t1/2 is well described by the model curve, which confirms the statistical parameter R-square. The parameters of the model curve obtained as a result of the approximation of the experimental points are shown in Table 4.
The activation energies (Ea) for the kinetic cumulative parameter h 2 D as a result of impulse measurements were determined from the slopes of the graphs (Figure 10) in accordance with an equation similar to the S. Arrhenius model for the temperature dependence of the kinetic cumulative parameter:
h 2 D = h 2 D 0   e x p E a R T ,
where h 2 D 0 (s−1)—limit value of h2D, extrapolation to T → ∞; Ea (J·mol−1) diffusion activation energy; T (K)—temperature.
The results of pulsed electrochemical measurements confirm that higher temperatures lead to an increase in diffusion coefficients. The activation energies estimated using Equation (7) are summarized in Table 4.
The activation energy values obtained by CV (Table 3) are more than twice as high as those obtained by pulse methods. Apparently, this is due to the fact that the activation energy obtained by the CV method is averaged over the entire time range of the cathode or anode electrode processes and reflects the energy corresponding to that part of lithium ions that limited the rate of the entire process. In the case of pulsed methods, the activation energy was determined for very short time intervals and corresponded to that fraction of lithium ions that had time to participate in the electrode process during this interval.
The difference in activation energies for the galvanostatic and potentiostatic methods also indicates the correspondence to only partial extraction of lithium. In accordance with M. Faraday law, the amount of extracted lithium is directly proportional to the accumulated charge. According to the modes of our experiment, the charge per galvanostatic pulse (500 μA 40 ms = 20 μC) did not change with the change in temperature that we used in our work. In this case, the charge per potentiostatic pulse is defined as the product of the average current and the duration and varies with temperature from 64 μC at 5 °C to 80 μC at 35 °C. In any case, a greater involvement of the material in the process corresponds to a greater activation energy.

4. Discussion and Conclusions

Experimental electrochemical methods made it possible to determine the parameters only for practically extractable (introduced) lithium ions. This is reflected in the range of lithium ion concentrations in the material over which one of the parameters of the electrode process, the diffusion activation energy, is averaged.
Involvement of the theoretical approach makes it possible firstly to concretize the distribution of diffusion activation energy over individual possible trajectories of lithium ion transfer in the structure of the material, and secondly to characterize the paths in the structure with a high energy barrier.
For example, the elastic band method makes it possible to consider a sample of all lithium ions and their transfer trajectories, regardless of their practical participation in the electrode process. The activation energy values obtained by pulsed electrochemical methods (0.23–0.37 eV) are consistent with those for low-energy pathways in accordance with the theoretical calculation. This is due to the short duration of measurements by these methods (hundredths and tenths of a second); only the most energetically available lithium ions have time to be involved in the process. The activation energy values obtained by cyclic voltammetry are close to the values, which is up to 0.8 eV for less probable paths achieved by the elastic tape method.
On the basis of the experimental and theoretical data obtained for LiCoVO4, a hypothesis can be put forward: the limitation of the practically realized capacity of the material at a level approximately one third of the theoretical one from the Faraday law is due to the fact that the involvement of additional lithium ions in the process is accompanied by a monotonous increase in the energy barrier, which, upon reaching a certain value, blocks further involvement. The increase in the energy barrier is due to the distribution of lithium ions in the structure of the material in such a way that in order to extract a large amount of lithium ions, it is necessary to use paths with high energy barriers that hinder diffusion.
It can be concluded that there are uncertainties in the development of electrode material if only experimental methods are used. We explain this by the different nature of the methods: averaging over the volume of material involved and time in the experiment compared with the analysis of individual ions and their transport trajectories in a theoretical study. A comprehensive analysis of the capabilities of the material, revealing limitations in that part that is not yet implemented in practice, requires the addition of experimental data with the results of theoretical calculations.
We assume that the identified limitations, both in terms of experimental and theoretical data, will make it possible to improve the behavior of the LiCoVO4 electrode material by controlling its structural parameters. At the same time, the applied approach of joint interpretation of experimental and theoretical data is recommended in the development of various electrode materials.

Supplementary Materials

The following supporting information can be downloaded at: https://www.mdpi.com/article/10.3390/pr11051427/s1. Figure S1: X-ray powder diffraction pattern of a LiCoVO4 sample and illustration of the analysis result by the Rietveld technique. List S1: Main results of XRD analysis by the Rietveld technique. Figure S2: The curves of galvanostatic charge and discharge of the electrode based on LiCoVO4, and the change in electrode capacitance and Coulomb efficiency during cycling at temperature of 30 °C. The data from [9]. Figure S3: Cyclic voltammograms of LiCoVO4 taken at temperatures of 10, 25, 30 and 40 °C in the potential range from 3.0 to 4.5 V. The polarization rate increased from 0.05 to 1 mV·s−1. Inserts show the dependence of the peak current density on the potential sweep rate in linearized coordinates. Figure S4: Fitting a linear regression of the potential transient to the square root of time during the current pulse; blue markers—experimental data; red markers are the results of simulation based on Equation (5). The magnitude of the pulsed current is 500 μA. The duration of the pulse and relaxation is 40 ms. Temperature range is from 5 to 25 °C in steps of 5 °C. Figure S5: Current transients during potentiostatic impulse. Blue markers—experimental data; red markers are the results of simulation based on Equation (6). The value of the potential pulse is 40 mV. The pulse duration is 200 ms. Temperature range is from 5 to 35 °C in steps of 5 °C.

Author Contributions

Conceptualization, K.S.R. and A.V.U.; methodology, A.V.U. and A.A.K.; software, K.S.R. and A.A.K.; validation, K.S.R., A.V.U. and A.A.K.; formal analysis, K.S.R.; investigation, K.S.R., A.V.U. and A.A.K.; resources, K.S.R., A.V.U. and A.A.K.; data curation, K.S.R.; writing—original draft preparation, K.S.R.; writing—review and editing, K.S.R., A.V.U. and A.A.K.; visualization, K.S.R.; supervision, A.V.U.; project administration, A.V.U.; funding acquisition, A.V.U. and A.A.K. All authors have read and agreed to the published version of the manuscript.

Funding

K.S.R. and A.V.U. thank the Russian Science Foundation (project No. 21-73-10091). A.A.K. thanks the Russian Science Foundation (project No. 19-73-10026).

Data Availability Statement

The data presented in this study are available on request from the corresponding authors.

Acknowledgments

Quantum-mechanical calculations were carried out using the “Zeolite” computational cluster of SCTMS and also on the computing cluster of the Saratov State University. K.S.R. and A.V.U. are grateful to Mariya A. Vikulova for registration of XRD patterns. We thank Natalya I. Igolkina for correcting the English.

Conflicts of Interest

The authors declare no conflict of interest.

References

  1. El Kharbachi, A.; Zavorotynska, O.; Latroche, M.; Cuevas, F.; Yartys, V.; Fichtner, M. Exploits, advances and challenges benefiting beyond Li-ion battery technologies. J. Alloy Compd. 2020, 817, 153261. [Google Scholar] [CrossRef]
  2. Daniel, C. Materials and processing for lithium-ion batteries. JOM 2008, 60, 43–48. [Google Scholar] [CrossRef]
  3. Harks, P.; Mulder, F.; Notten, P. In situ methods for Li-ion battery research: A review of recent developments. J. Power Sources 2015, 288, 92–105. [Google Scholar] [CrossRef]
  4. Liu, D.; Zhu, W.; Trottier, J.; Gagnon, C.; Barray, F.; Guerfi, A.; Mauger, A.; Groult, H.; Julien, C.M.; Goodenough, J.B.; et al. Spinel materials for high-voltage cathodes in Li-ion batteries. RSC Adv. 2014, 4, 154–167. [Google Scholar] [CrossRef]
  5. Darjazi, H.; Madinabeitia, I.; Zarrabeitia, M.; Gonzalo, E.; Acebedo, B.; Javad Rezvani, S.; Muñoz-Márquez, M.Á. LiNi0.5Mn1.5O4 Thin Films Grown by Magnetron Sputtering under Inert Gas Flow Mixtures as High-Voltage Cathode Materials for Lithium-Ion Batteries. ChemElectroChem 2023, 10, e202201004. [Google Scholar] [CrossRef]
  6. Wong-Ng, W.; McMurdie, H.F.; Paretzkin, B.; Zhang, Y.; Davis, K.L.; Hubbard, C.R.; Dragoo, A.L.; Stewart, J.M. Reference X-Ray Diffraction Powder Patterns of Fifteen Ceramic Phases. Powder Diffr. 1987, 2, 257–265. [Google Scholar] [CrossRef]
  7. Bernier, J.C.; Poix, P.; Michel, A. Etude cristallographique et magnetique de deux vanadates mixtes spinelles [Magnetic and crystallographic study of two mixed spinel vanadates]. Bull. Soc. Chim. Fr. 1963, 1963, 445–446. [Google Scholar]
  8. Leonidova, O.N.; Voronin, V.; Leonidov, I.A.; Samigullina, R.F.; Slobodin, B.V. Crystal Structures of Double Vanadates LiCoVO4 and Li0.5Co1.25VO4. J. Struct. Chem. 2004, 44, 277–283. [Google Scholar] [CrossRef]
  9. Rybakov, K.S.; Ushakov, A.V. High-voltage Cathode Material Based on LiCoVO4 for Lithium-Ion Battery: Development and Research. Electrochem. Energetics 2019, 19, 90–104. Available online: https://energetica.sgu.ru/en/articles/high-voltage-cathode-material-based-on-licovo-for-lithium-ion-battery-development-and (accessed on 6 April 2023). [CrossRef]
  10. Prakash, D.; Masuda, Y.; Sanjeeviraja, C. Structural, electrical and electrochemical studies of LiCoVO4 cathode material for lithium rechargeable batteries. Powder Technol. 2013, 235, 454–459. [Google Scholar] [CrossRef]
  11. Zhang, H.; Yang, Y.; Xu, H.; Wang, L.; Lu, X.; He, X. Li4Ti5O12 spinel anode: Fundamentals and advances in rechargeable batteries. Infomat 2022, 4, e12228. [Google Scholar] [CrossRef]
  12. Okhotnikov, K.; Charpentier, T.; Cadars, S. Supercell program: A combinatorial structure-generation approach for the local-level modeling of atomic substitutions and partial occupancies in crystals. J. Chemin. 2016, 8, 17. [Google Scholar] [CrossRef]
  13. Perdew, J.P.; Burke, K.; Ernzerhof, M. Generalized gradient approximation made simple. Phys. Rev. Lett. 1996, 77, 3865–3868. [Google Scholar] [CrossRef]
  14. Monkhorst, H.J.; Pack, J.D. Special points for Brillouin-zone integrations. Phys. Rev. B 1976, 13, 5188–5192. [Google Scholar] [CrossRef]
  15. Henkelman, G.; Jónsson, H. Improved tangent estimate in the nudged elastic band method for finding minimum energy paths and saddle points. J. Chem. Phys. 2000, 113, 9978–9985. [Google Scholar] [CrossRef]
  16. BatteryMaterials. Available online: https://batterymaterials.info/downloads (accessed on 6 April 2023).
  17. Henkelman, G.; Uberuaga, B.P.; Jónsson, H. A climbing image nudged elastic band method for finding saddle points and minimum energy paths. J. Chem. Phys. 2000, 113, 9901–9904. [Google Scholar] [CrossRef]
  18. Momma, K.; Izumi, F. VESTA 3 for three-dimensional visualization of crystal, volumetric and morphology data. J. Appl. Crystallogr. 2011, 44, 1272–1276. [Google Scholar] [CrossRef]
  19. Aksyonov, D.; Fedotov, S.; Stevenson, K.; Zhugayevych, A. Understanding migration barriers for monovalent ion insertion in transition metal oxide and phosphate based cathode materials: A DFT study. Comput. Mater. Sci. 2018, 154, 449–458. [Google Scholar] [CrossRef]
  20. Xiao, Y.; Miara, L.J.; Wang, Y.; Ceder, G. Computational Screening of Cathode Coatings for Solid-State Batteries. Joule 2019, 3, 1252–1275. [Google Scholar] [CrossRef]
  21. Xu, S.; Jacobs, R.M.; Nguyen, H.M.; Hao, S.; Mahanthappa, M.; Wolverton, C.; Morgan, D. Lithium transport through lithium-ion battery cathode coatings. J. Mater. Chem. A 2015, 3, 17248–17272. [Google Scholar] [CrossRef]
  22. Deng, Z.; Mo, Y.; Ong, S.P. Computational studies of solid-state alkali conduction in rechargeable alkali-ion batteries. NPG Asia Mater. 2016, 8, e254. [Google Scholar] [CrossRef]
  23. Aksyonov, D.; Boev, A.; Fedotov, S.; Abakumov, A. Computational insights into ionic conductivity of transition metal electrode materials for metal-ion batteries—A review. Solid State Ion. 2023, 393, 116170. [Google Scholar] [CrossRef]
  24. Liu, Z.; Huang, X. Factors that affect activation energy for Li diffusion in LiFePO4: A first-principles investigation. Solid State Ion. 2010, 181, 907–913. [Google Scholar] [CrossRef]
  25. Bagotsky, V.S. Fundamentals of Electrochemistry, 2nd ed.; John Wiley & Sons: Hoboken, NJ, USA, 2005. [Google Scholar]
  26. Churikov, A.V. Mathematics of Diffusion in Application to Lithium Electrochemical Systems (Transliteration of Russian into English: Matematika Diffuzii v Prilozhenii k Litiyevym Elektrokhimicheskim Sistemam); Nauka: Moscow, Russia, 2015. [Google Scholar]
Figure 1. Histogram and probability density curve of the normal distribution of absolute energy for a sample of 200 randomly selected structures. The rhombuses mark the structures chosen for estimating the energy barriers to migration. Blue markers indicate structures with a cluster of four lithium atoms.
Processes 11 01427 g001
Figure 2. Migration path 11 of structure 1 and path 7 of structure 3 (the path number is deciphered in Table 2). Green spheres are lithium atoms, red ones are vanadium, blue ones are cobalt. The black dotted lines connect the lithium atom at the saddle point to the nearest neighboring oxygen atoms, forming a distorted plane in the shape of a triangle or hexagon, perpendicular to the local trajectory.
Processes 11 01427 g002
Figure 3. Possible paths of migration of lithium ions for the selected structures. Lithium atoms are depicted as green spheres, cobalt atoms are in blue spheres, and vanadium atoms in red octahedrons and tetrahedra. Migration paths are color-coded according to Table 2.
Processes 11 01427 g003
Figure 4. Energy profiles of some selected transitions of lithium ions in structure 3. Arrows indicate the values of energy barriers to migration.
Processes 11 01427 g004
Figure 5. The distribution of the number of lithium ion diffusion paths by activation energy and the correspondence of the distribution to the number of ions that will take part in the process and the maximum specific capacity.
Processes 11 01427 g005
Figure 6. Cyclic voltammograms of LiCoVO4 taken at a temperature of 25 °C in the potential range from 3.0 to 4.5 V. The polarization rate increased from 0.05 to 1 mV·s−1. The inset is the dependence of the peak current density on the potential sweep rate in linearized coordinates. Other data can be found in Figure S3 in the Supplementary File.
Processes 11 01427 g006
Figure 7. Arrhenius dependence of the diffusion coefficient on temperature in linearized coordinates according to the results of cyclic voltammetry.
Processes 11 01427 g007
Figure 8. Fitting a linear regression of the potential transient to the square root of time during the current pulse. Blue markers—experimental data; red markers are the results of simulation based on Equation (5). The magnitude of the pulsed current is 500 μA. The duration of the pulse and relaxation is 40 ms. Temperature range is from 5 to 25 °C in steps of 5 °C. Data for 25 °C are shown. Other data can be found in Figure S4 in the Supplementary File.
Processes 11 01427 g008
Figure 9. Current transients during potentiostatic impulse. Blue markers—experimental data; red markers are the results of simulation based on Equation (6). The value of the potential pulse is 40 mV. The pulse duration is 200 ms. Temperature range is from 5 to 35 °C in steps of 5 °C. Data for 25 °C are shown. Other data can be found in Figure S5 in the Supplementary File.
Processes 11 01427 g009
Figure 10. Arrhenius dependence of the kinetic cumulative parameter h2D on temperature in linearized coordinates according to the results of cyclic voltammetry.
Processes 11 01427 g010
Table 1. Parameters of unit cells and energies of structures (Figure 1) selected for estimation by the NEB method of the values of energy barriers of possible pathways of lithium ion migration.
NoIDa (Å)b (Å)c (Å)α (°)Β (°)Γ (°)V (Å3)E (eV)
1Processes 11 01427 i0018.21618.14318.120289.97489.13189.920543.218−403.737
2Processes 11 01427 i0028.15528.20498.140490.24989.61589.777544.672−403.816
3Processes 11 01427 i0038.10888.14378.202790.58490.15489.652541.626−403.881
Table 2. Some estimated parameters of possible lithium ion diffusion paths in the structures under consideration.
No.Structure 1Structure 2Structure 3
IDPath Length (Å)Ea (eV)IDPath Length (Å)Ea (eV)IDPath Length (Å)Ea (eV)
1Processes 11 01427 i0042.6090.35Processes 11 01427 i0182.7950.27Processes 11 01427 i0292.6800.25
2Processes 11 01427 i0053.1410.65Processes 11 01427 i0192.7620.39Processes 11 01427 i0302.8290.28
3Processes 11 01427 i0062.7950.37Processes 11 01427 i0202.9030.36Processes 11 01427 i0312.8110.40
4Processes 11 01427 i0072.4470.20Processes 11 01427 i0213.0500.51Processes 11 01427 i0322.8400.39
5Processes 11 01427 i0082.9620.77Processes 11 01427 i0222.7500.46Processes 11 01427 i0333.0550.48
6Processes 11 01427 i0092.9840.34Processes 11 01427 i0233.0510.47Processes 11 01427 i0342.9590.69
7Processes 11 01427 i0102.9420.62Processes 11 01427 i0242.9690.26Processes 11 01427 i0355.3552.90
8Processes 11 01427 i0113.3480.51Processes 11 01427 i0253.0460.43Processes 11 01427 i0365.2512.42
9Processes 11 01427 i0123.0430.62Processes 11 01427 i0265.2482.84Processes 11 01427 i0372.7190.32
10Processes 11 01427 i0133.0800.59Processes 11 01427 i0272.8840.50Processes 11 01427 i0382.8250.24
11Processes 11 01427 i0145.4653.05Processes 11 01427 i0282.8510.34Processes 11 01427 i0392.7850.47
12Processes 11 01427 i0153.0060.50
13Processes 11 01427 i0163.0530.48
14Processes 11 01427 i0172.9940.61
Table 3. Summary of the results of cyclic voltammetry. The values of diffusion coefficients at different temperatures for the anodic and cathodic processes and the corresponding activation energies.
Temperature (°C)Dan.·1013 (m2·s−1)Dcat.·1013 (m2·s−1)Ean. (eV 1)Ecat., (eV 1)
109.430.6290.51 ± 0.340.78 ± 0.38
2517.52.13
3026.73.76
4077.615.4
1 The conversion to eV has been undertaken for comparison with the results of a theoretical study. The value of 1 eV corresponds to 96,485 J·mol−1.
Table 4. A summary of the results of measurements by galvanostatic (GI) or potentiostatic (PI) impulses at different temperatures.
Temperature (°C)GIPI
h2D (s−1)Ea (eV)h2DΔE·RF−1 (A·m−2)Ea (eV)
524.250.25 ± 0.063.150.00170.37 ± 0.07
1027.434.480.0019
1530.316.850.0021
2036.747.450.0023
2541.059.960.0025
3054.2911.980.0027
3569.5314.850.0030
Disclaimer/Publisher’s Note: The statements, opinions and data contained in all publications are solely those of the individual author(s) and contributor(s) and not of MDPI and/or the editor(s). MDPI and/or the editor(s) disclaim responsibility for any injury to people or property resulting from any ideas, methods, instructions or products referred to in the content.

