Article

Research on Two-Way Contra-Rotating Axial-Flow Pump–Turbine with Various Blade Angles in Pump Mode

1
National Research Center of Pumps, Jiangsu University, Zhenjiang 212013, China
2
The Joint Lab of Intelligent O & M for NPP Pump, Zhenjiang 212013, China
3
China Nuclear Power Engineering Co., Ltd., Beijing 100840, China
*
Author to whom correspondence should be addressed.
Processes 2023, 11(5), 1552; https://doi.org/10.3390/pr11051552
Submission received: 9 April 2023 / Revised: 14 May 2023 / Accepted: 17 May 2023 / Published: 18 May 2023
(This article belongs to the Special Issue State-of-the-Art Energy Conversion and Storage)

Abstract

:
In tidal two-way contra-rotating units, significant differences in performance often occur when arranging the front and rear impellers, which requires an optimized design of the impellers. To solve this problem, by reducing the blade inlet and outlet angles, the impact of different blade angles on the performance of two-way pump–turbines and the internal flow was explored, and the effects of the blade inlet angle of the impellers on the performance of the counter-rotating pump were obtained. Afterward, the streamline and vorticity of the two-stage impeller at different angles were analyzed. The results show that different blade angles will have a certain impact on the internal flow of the two-way pump–turbine. Different blade outlet angles have a significant impact. The variation in different inlet blade angles is not significant for the vorticity changes in the front impeller and rear impeller. In addition, changes in the outlet blade angle will have an impact on the location of LE impact water of the rear impeller, which in turn affects the contours of vorticity of the rear impeller near LE, which also means that the vorticity in this area is mainly dominated by the vortex stretching term.

1. Introduction

With the increasing awareness of the adverse effects of fossil fuels on the environment, people are currently interested in looking for and producing sustainable energy alternatives [1,2,3]. As is well known, the coverage of the Earth’s ocean reaches approximately 71%, while land only accounts for approximately 29% of the total area. With the increasing level of technology, human exploration has gradually shifted from land to a broader ocean, which contains enormous energy. Marine energy is an energy source with strong predictability and high development, which has aroused great interest in the scientific community. Ocean energy mainly includes salt difference energy, tidal energy, temperature difference energy, wave energy, and current energy [4].
The bidirectional operation mode of tidal units can provide relatively continuous power, with strong adaptability to the power grid, and can operate at peak loads. Due to the higher efficiency, compact structure, stable performance curve, and great anti-cavitation performance of the counter-rotating unit [5], the application of counter-rotating technology in tidal power plants is expected to effectively improve the performance of the unit and provide more potential energy for the next step of power generation, while fully leveraging the advantages of power generation.
In recent years, many scholars have conducted research on the counter-rotating unit. Cao et al. studied the influence of blade geometry and load distribution on cavitation characteristics [6]. Clarke et al. developed a new type of counter-rotating tidal turbine, whose novelty includes two counter-rotating rotor blade groups that directly drive an open ocean permanent magnet generator [7]. Muis et al. compared the performance of a single rotor and two opposing rotating rotor turbines and found that both turbines can operate with relatively high efficiency [8]. Shigemitsu et al. conducted experiments and performed a numerical analysis to study the performance of small water turbines and found that their efficiency was very high, and they can maintain high efficiency within a wide flow range, while the performance of the secondary rotor is lower under partial flow [9]. Huang et al. studied the vorticity distribution of oblique-flow jet propulsion pumps under three operating conditions and found that the development of cavitation enhances the generation of vortices and the instability of flow within the propulsion pump [10]. Guo et al. applied an improved Zwart cavitation model to study the tip leakage vortex cavitation of a water jet propulsion pump, revealing the tip leakage flow and tip leakage vortex cavitation characteristics under different cavitation conditions [11]. Kan et al. used the entropy production method to analyze the high energy loss regions within key components in an axial-flow pump and investigate the variation in energy loss during the transition process of a bidirectional axial-flow pump [12].
In counter-rotating machinery, the direct interaction between the two-stage impellers can lead to complex flow structures within the unit. When designing contrarotating machinery, it is necessary to consider the influence of the wake of the primary impeller on the performance and pressure interaction of the secondary impeller, which is also the design focus of such machinery [13]. Toru et al. discussed the flow behavior of counter-rotating axial-flow pumps, including blade loads, tip clearance leakage vortices, and the interaction between wake and blades [14]. The study by Momosaki et al. shows that near the leading edge of the secondary impeller blade, the fluid flows smoothly along the back of the blade towards the tip clearance area and ultimately forms a strong tip clearance leakage vortex. Blocking caused by the tip clearance leakage vortex may lead to a decrease in the head of the secondary impeller under certain operating conditions [15]. De Zhang et al. found that after designing the specific speed of the secondary impeller, the blocking effect caused by leakage vortices at the blade tip inside the secondary impeller was reduced [16]. The study by Furukawa et al. shows that due to the low blade load, even under non-design flow rates, counter-rotating axial-flow pumps can achieve high efficiency and cavitation performance [17]. Linlin Cao et al. found that the area where cavitation first occurs in a counter-rotating axial-flow pump is the tip area of the secondary impeller. There is a strong interaction between the two-stage impellers, and the performance of the unit can be improved by optimizing the speed of the two-stage impellers [18]. Later, Linlin Cao and others redesigned the secondary impeller with the method of speed optimization to improve the anti-cavitation performance of the unit, reduce the interaction between impellers and inhibit secondary flow [19]. However, there is still limited literature on the influence of angle on reverse rotation pump turbines.
In this study, by calculating different schemes for adjusting the blade angle of the impeller, the effects of the blade angle of the impellers on the performance of the counter-rotating pump were obtained. Afterward, the streamline and vorticity of the two-stage impeller at different angles were analyzed.

2. Research Model

2.1. Pump Parameters

In this paper, the asymmetric blade design method was adopted, and the same two-stage impellers were designed. The front and rear impellers for the same hydraulic model have a mirror relationship, which can ensure the consistent performance of the forward and reverse working conditions, that is, meet the requirements of two-way operation. The design parameters of the pump include the flow Q = 100 m3/h, head H = 1.8 m, and rotation speed n = 1450 r/min.
The impeller blades in this paper are S-shaped airfoils. As shown in Figure 1a, the velocity triangle between the two-stage impellers is given. And Figure 1b shows the blade airfoil angle on different contour planes βa, βb, βc, βd, and βe. In this study, the inlet angle of the front impeller is βf1, the outlet angle of the front impeller is βf2, the inlet angle of the rear impeller is βr1, and the outlet angle of the rear impeller is βr2. Due to the mirror arrangement of the front and rear impellers, the value of the outlet angle of the front impeller βf2 is equal to the value of the inlet angle of the rear impeller βr1.
In order to further reveal the law of different blade angles of the impeller on the performance of the two-way pump–turbine in pump mode, as well as the changes in the performance of the two-stage impeller, six impeller blade angle schemes are designed in this paper, as shown in Table 1. In Table 1, β1 is the inlet angle, and β2 is the outlet angle.

2.2. Experimental Methods

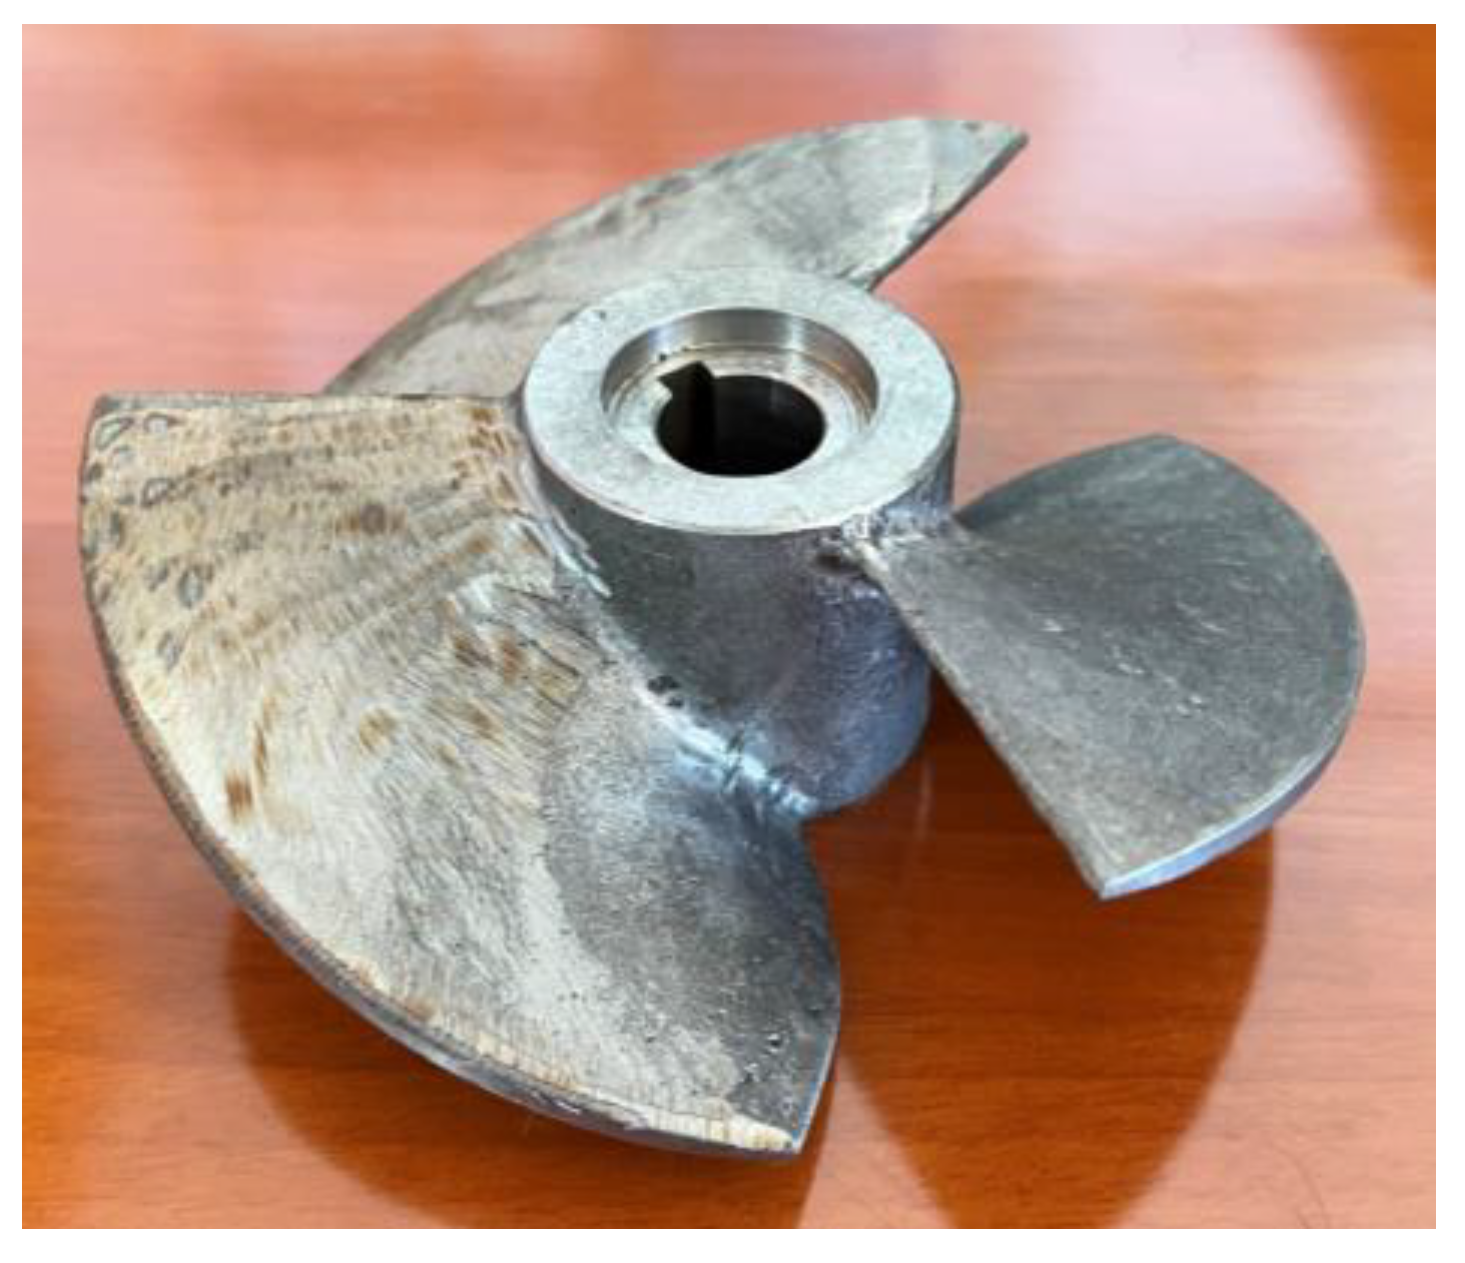
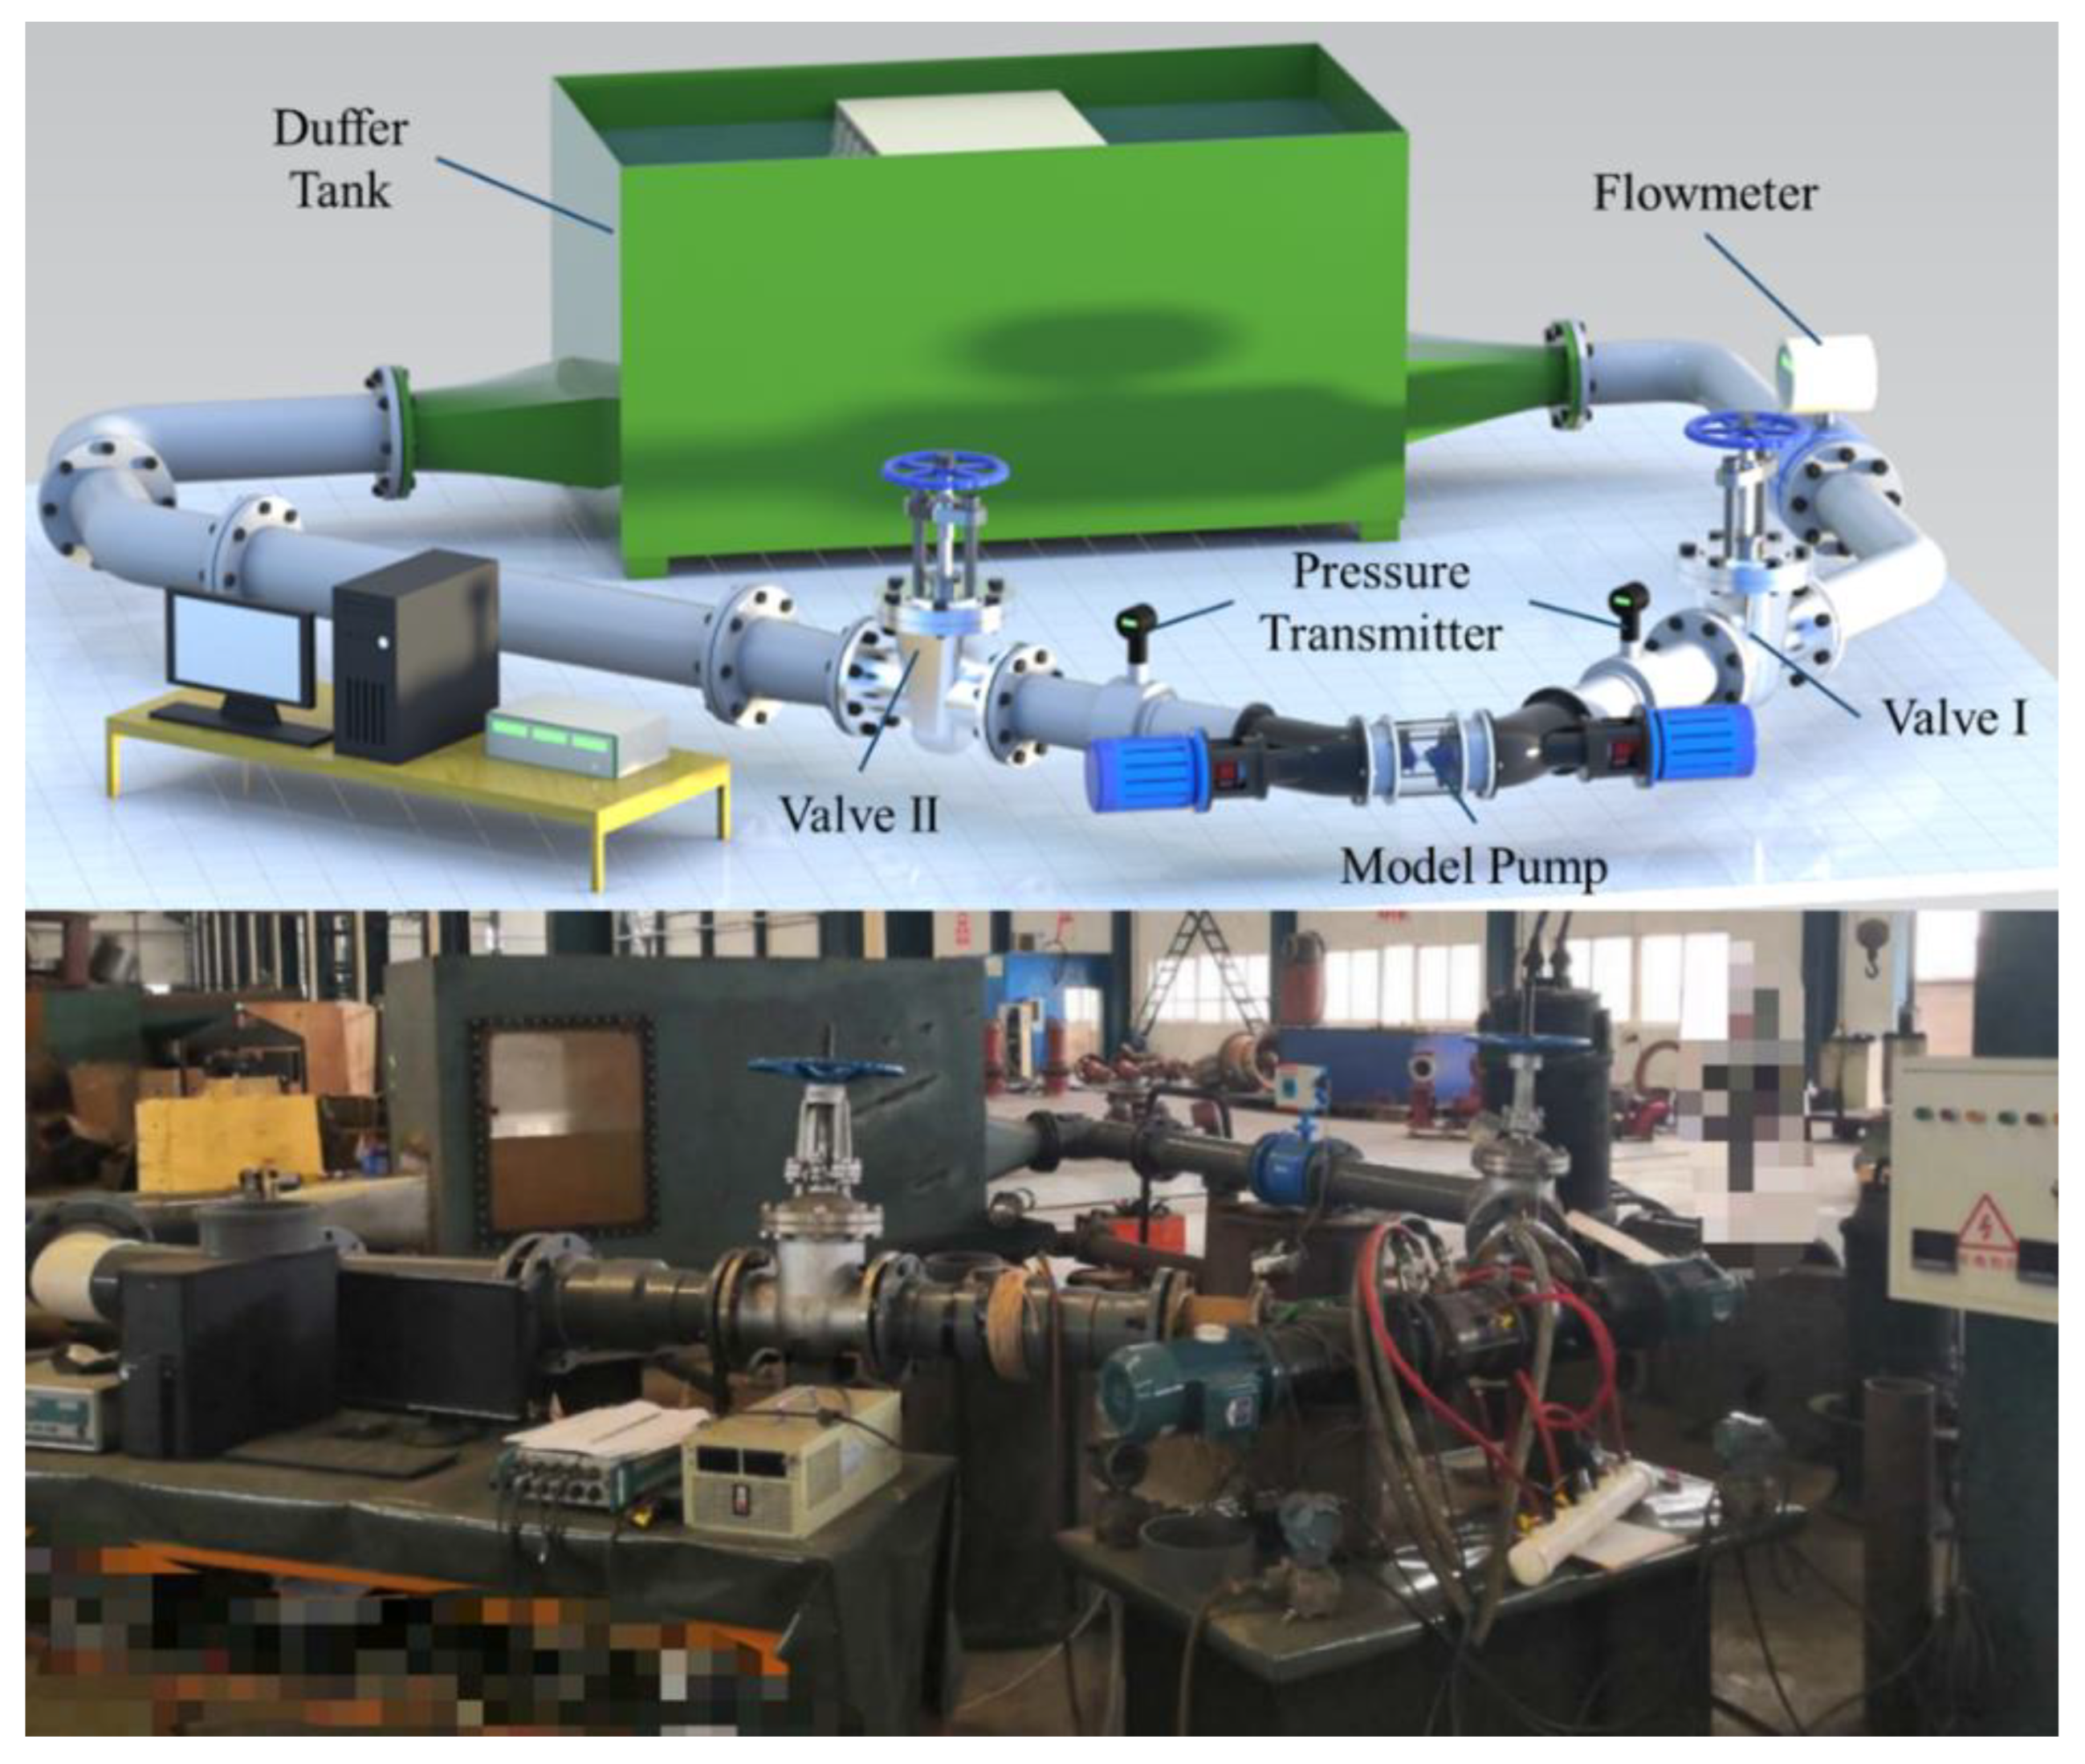
Figure 2 is the actual impeller. Figure 3 shows the schematic of the experimental setup [20]. In addition, relevant measuring instruments as shown in Table 2. The total measurement uncertainty consists of two parts: random uncertainty and system uncertainty. The total measurement uncertainty is equal to the measurement uncertainty values of each independent component squared first, added together, and then square rooted; the equation is as follows:
e = 0.5 2 + 0.2 2 + 0.05 2 + 0.5 2 2 = ± 0.74 %

2.3. Numeral Calculation Methods

2.3.1. Calculation Model

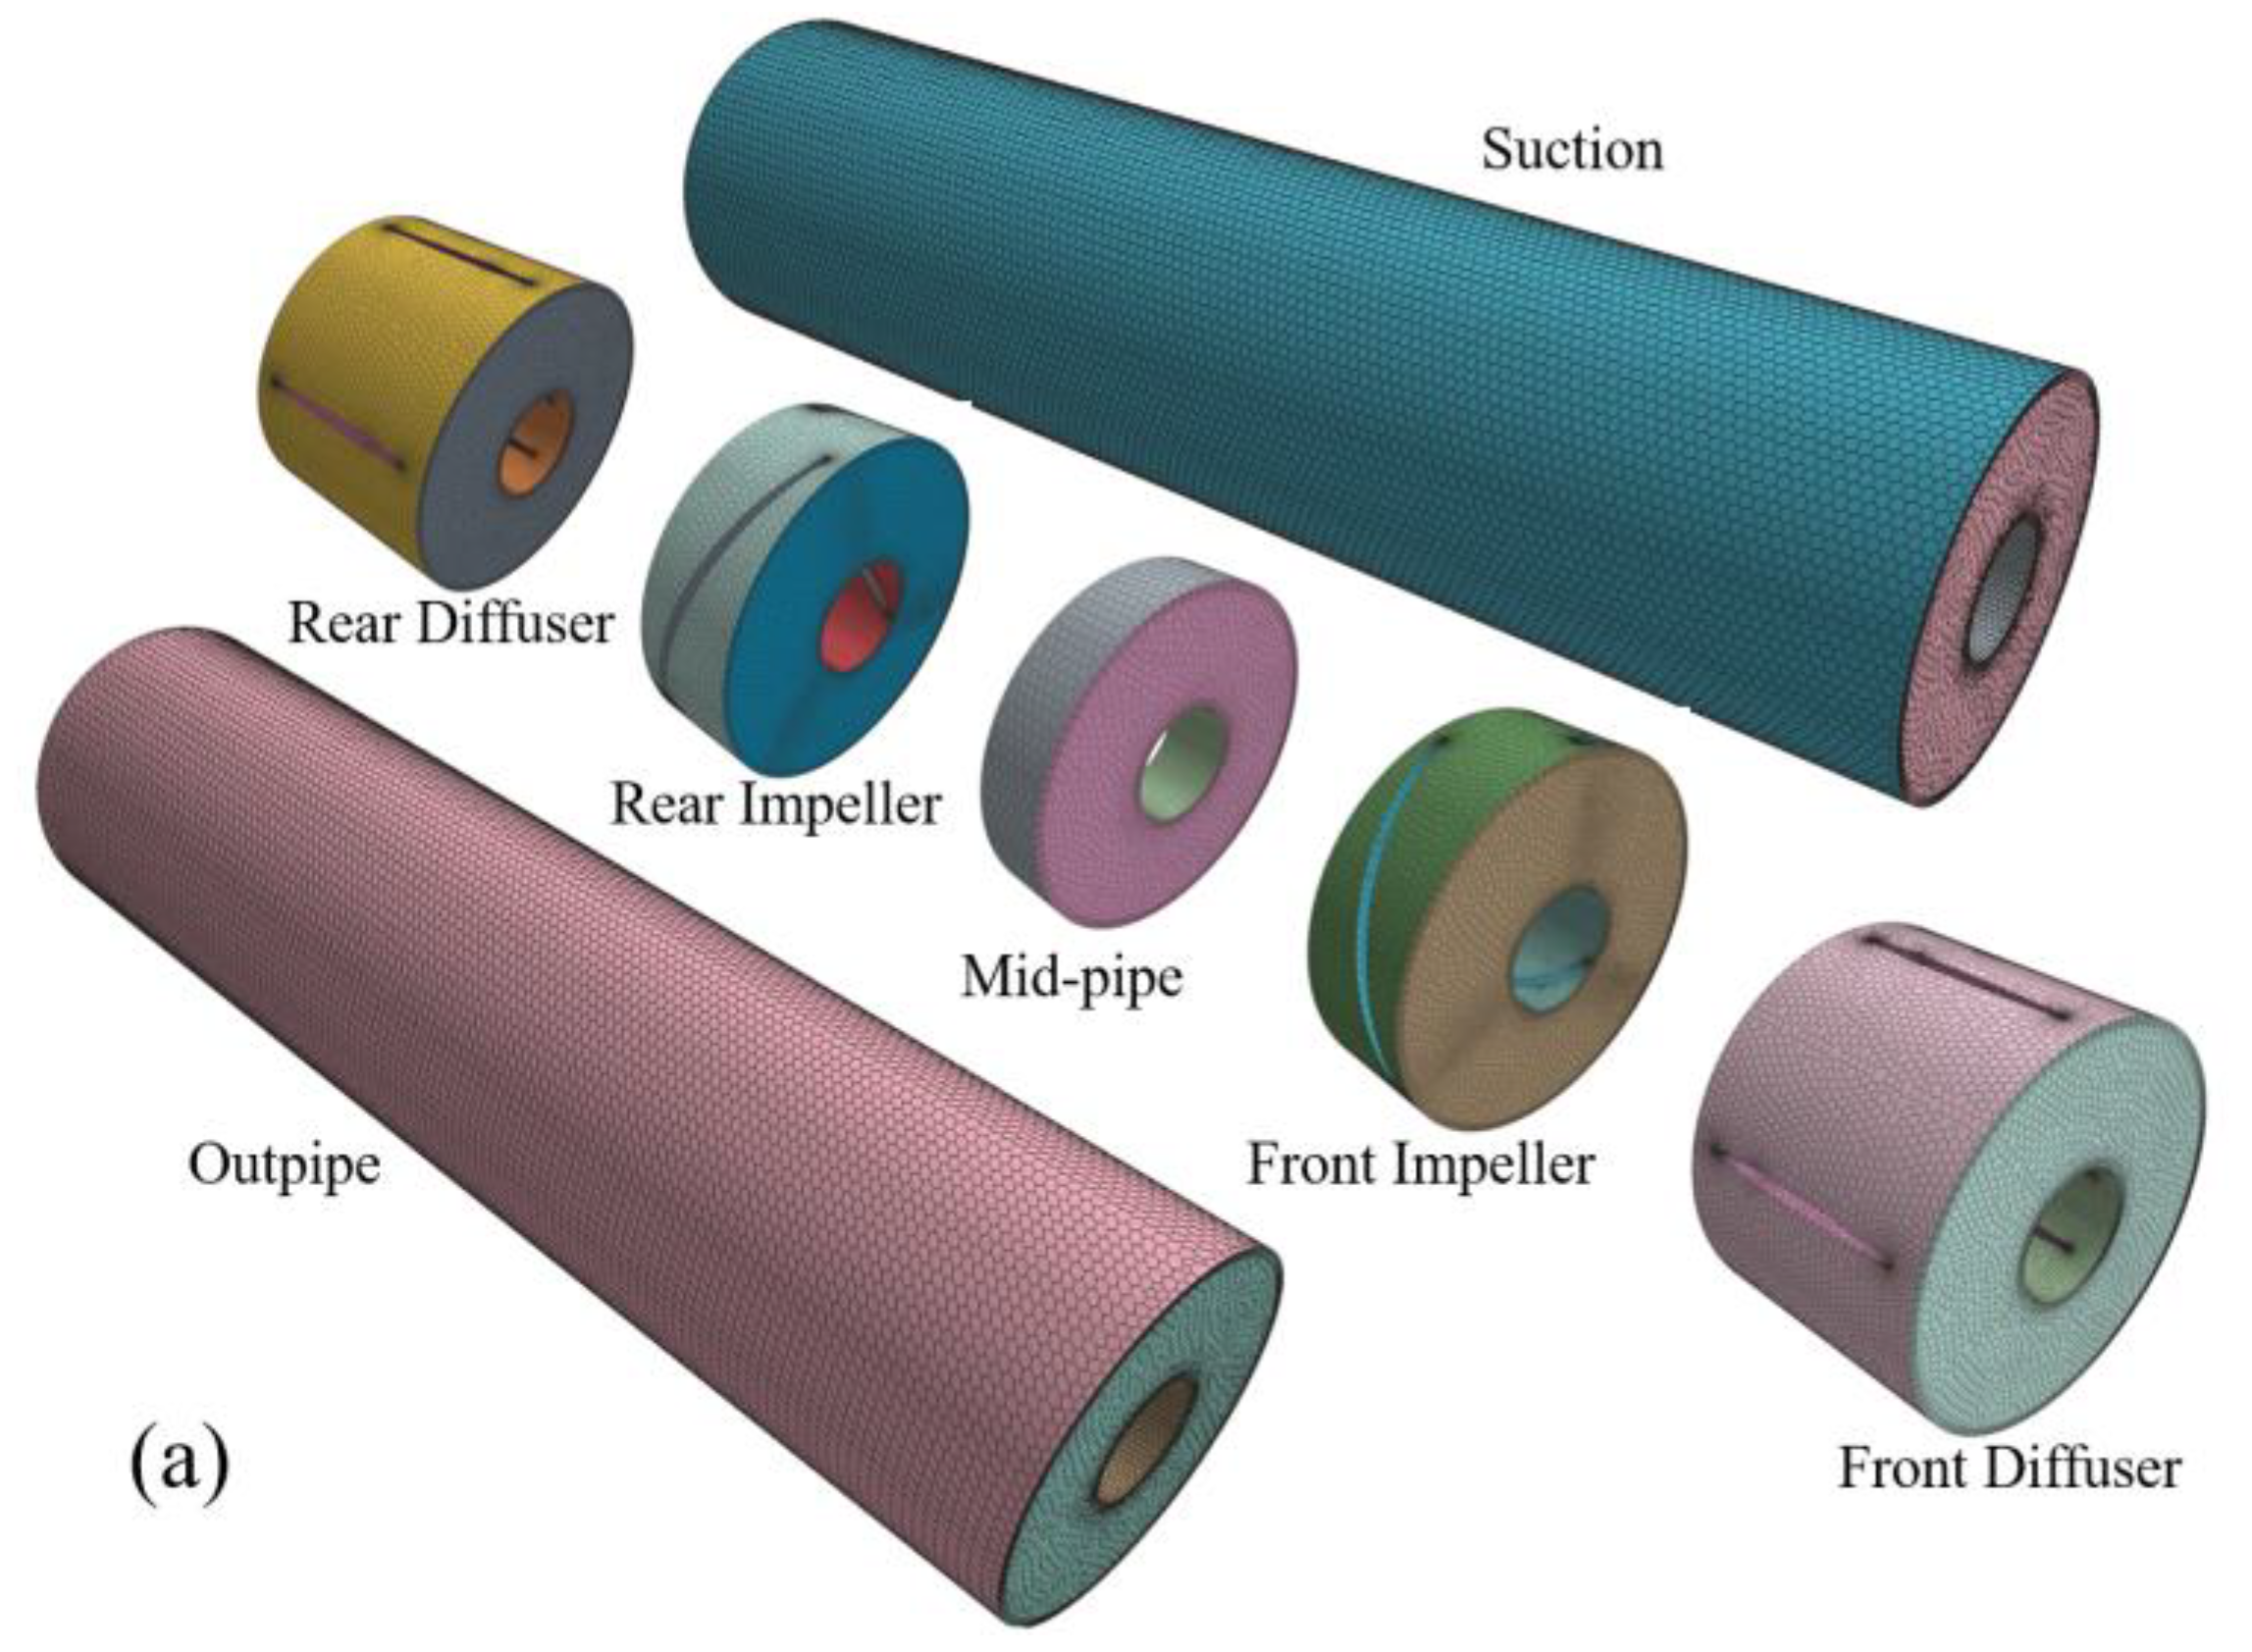
Figure 4 shows the domain of the hydraulic components of the two-way pump–turbine. It should be noted that the rotation axis of the two-stage impeller is collinear, but there are different rotation directions.

2.3.2. Meshing

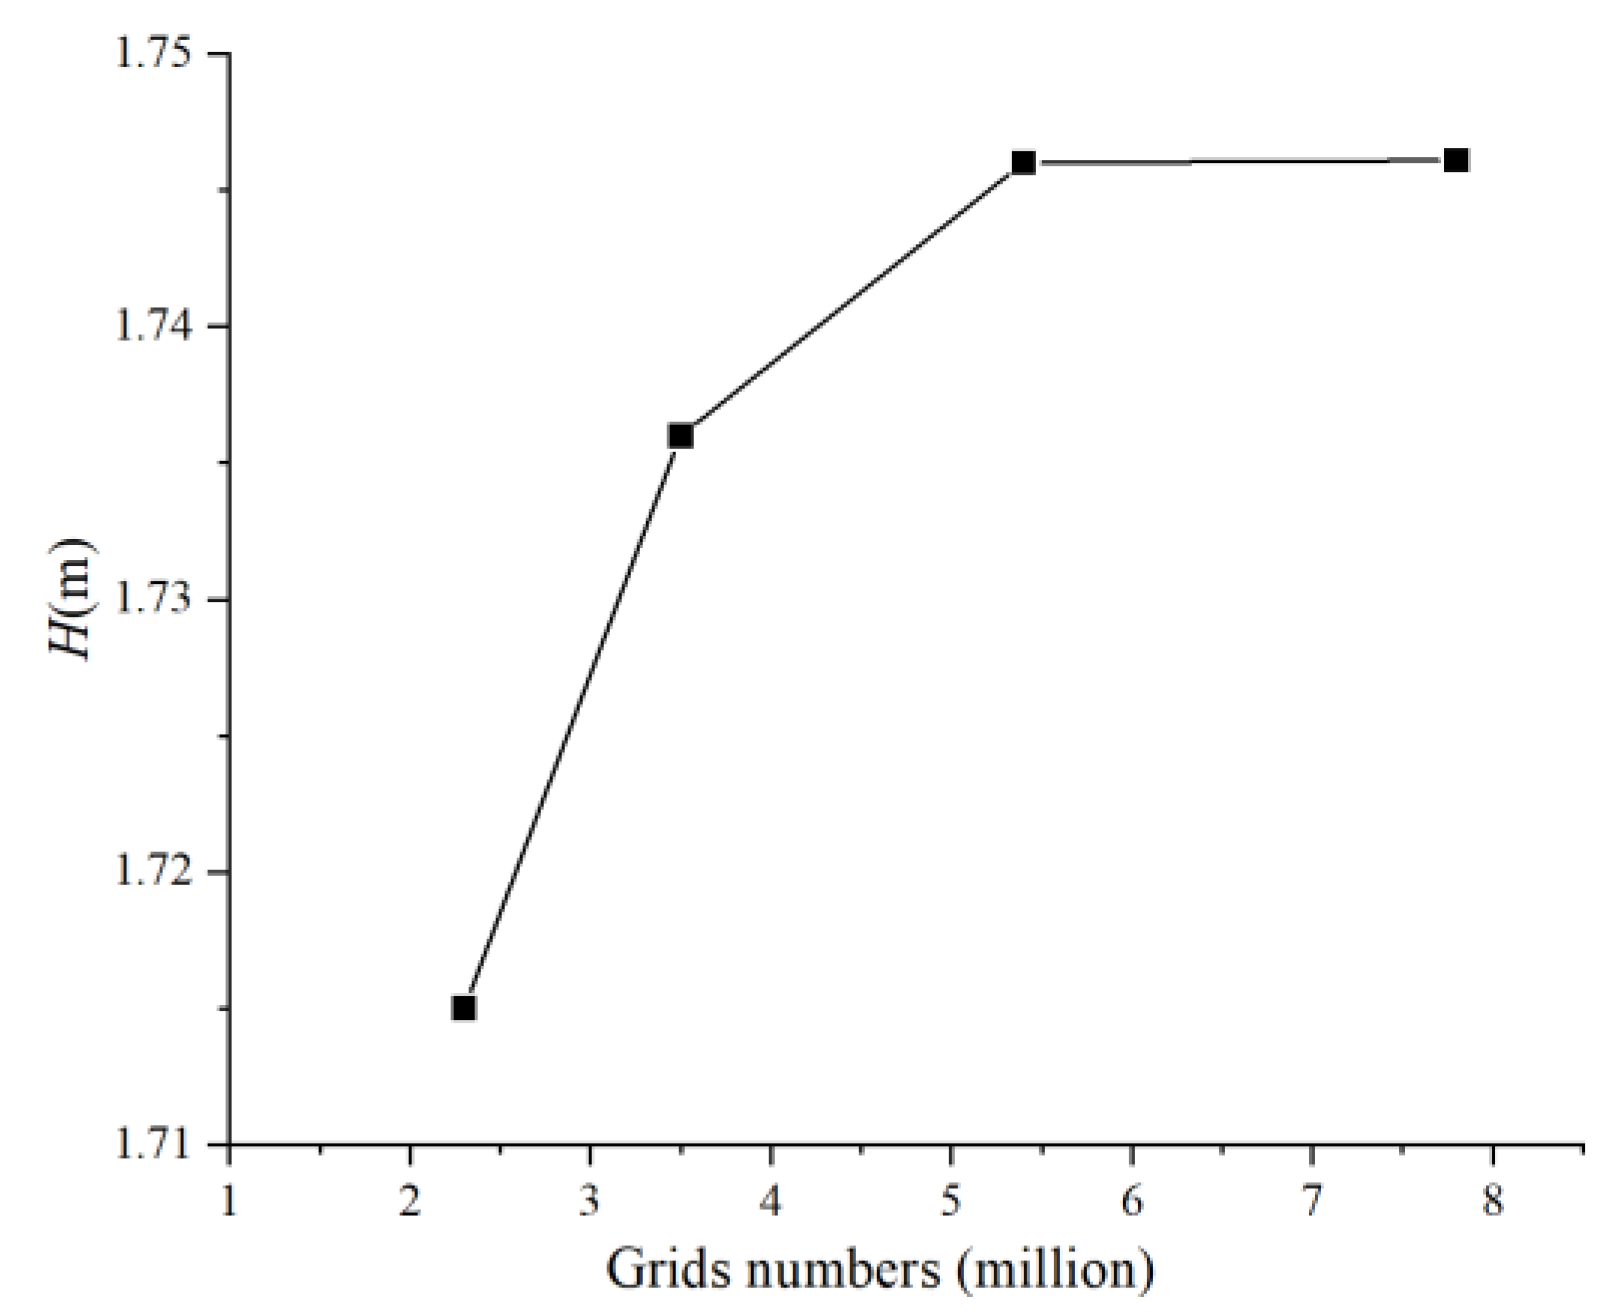
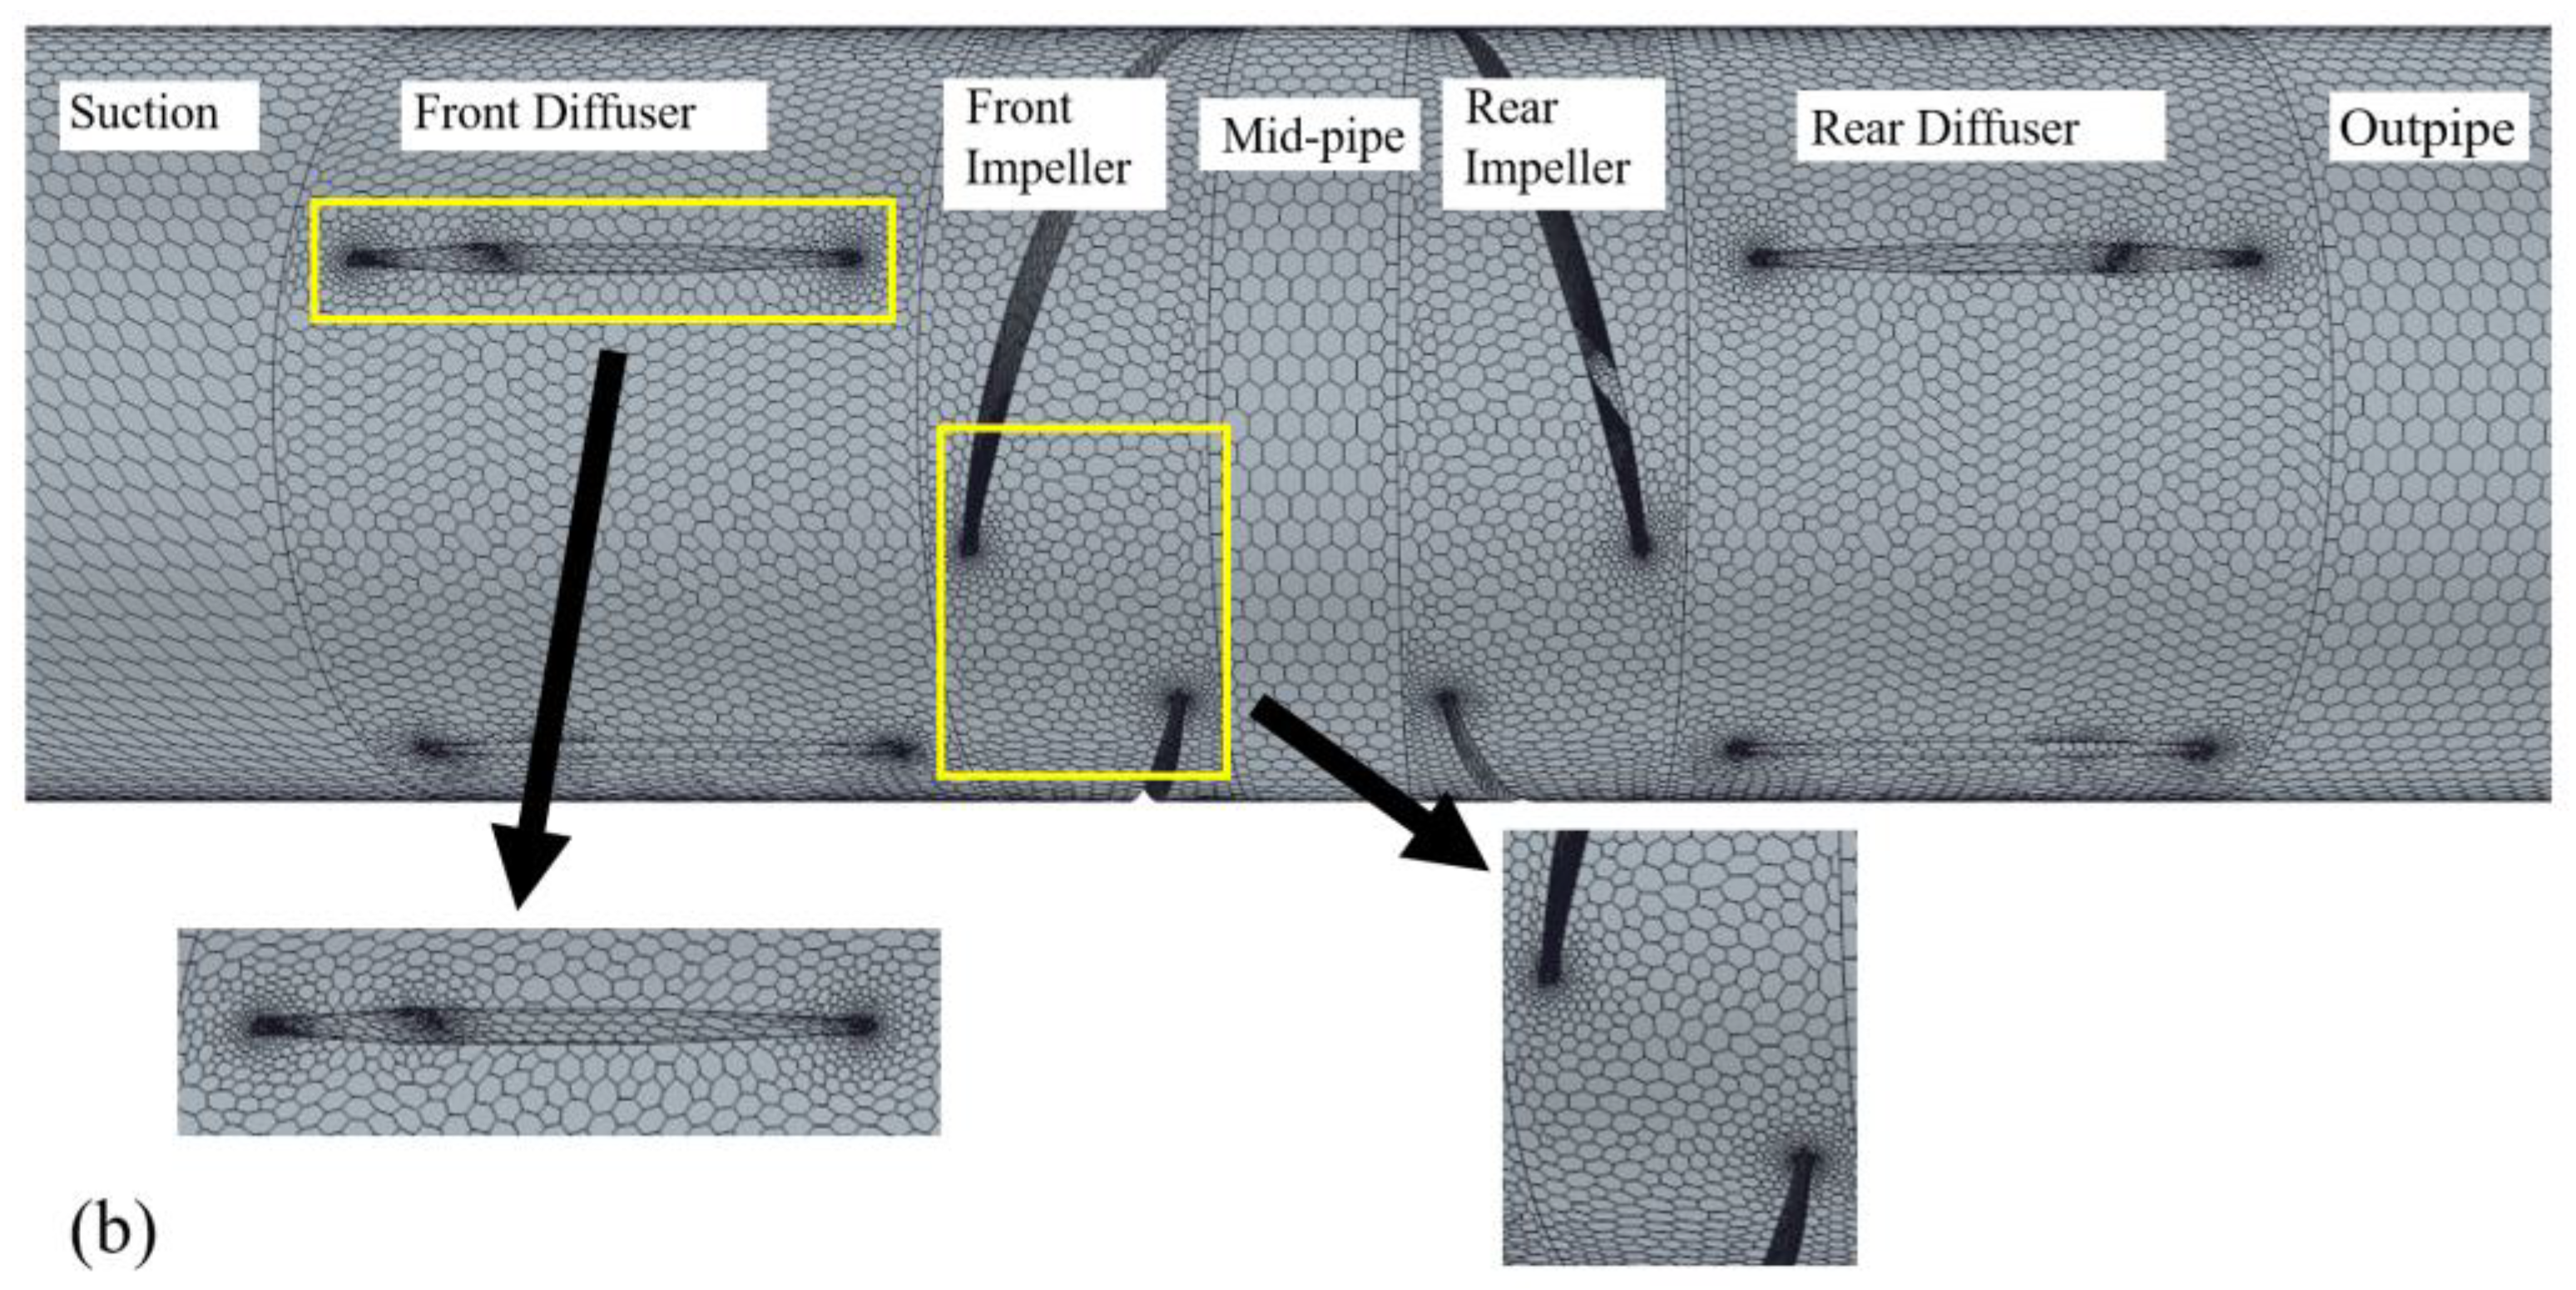
STAR CCM+ is a new generation CFD solver developed based on computational continuum mechanics algorithms and used for meshing and solving components. As shown in Figure 5, when the number of grids exceeds 5.2 million, head change in the two-way contra-rotating axial-flow pump is less than 0.1% [20]. Figure 6 shows the calculation grids. As shown in Figure 6b, mesh refinement is applied to the inlet and outlet edges of the guide vane and impeller blades to ensure a more accurate restoration of the actual shape of the relevant area when converting the geometric domain into a mesh and to reduce model loss caused by low mesh accuracy.

2.3.3. Calculation Settings

In this study, the inlet of the calculation domain is set as the normal speed inlet, while the outlet is set as the average static pressure. Since cavitation calculation is not involved, the outlet pressure is set to the default value of 0 Pa. The fluid medium in the calculation is clean water at 25 °C, assuming it is incompressible, with a density of 997.561 kg/m3 and a dynamic viscosity of 8.8871 × 10⁻⁴ Pa·s. The no-slip boundary conditions and smooth wall are used.

2.3.4. Calculation Method

In this paper, steady-state calculation and a realizable RNG k–ε two-layer turbulence model are adopted. The realizable k–ε model adopts a new transport equation for turbulent dissipation rate ε [21], and the calculation of turbulent vortex viscosity μ t is as follows:
μ t = ρ C μ f μ k T
f μ = 1 C μ { 4 + 6   cos [ 1 3 cos 1 ( 6 S * 3 S * : S * 3 ) ] k ε S : S + W : W
S * = S 1 3 tr S I
S = 1 2 u i x j + u j x i
W = 1 2 u i x j u j x i
where C μ is the model coefficient with a value of 0.09, f μ is the damping function, T is the turbulence time scale, S is the average strain rate tensor, W is the average vortex tensor, and I is the unit tensor.
The vorticity equation of the flow in the Navier–Stokes equation is as follows [22]:
D ω D t = ω · u ω · u + ρ × p ρ 2 + ν 2 ω
where ω represents the vorticity, u represents the velocity, ν represents the kinematic viscosity, is the Hamiltonian operator, D ω D t represents the variation in vorticity caused by fluid transport over time, ω · u represents vortex stretching, ω · u represents vortex dilatation, ρ × p ρ 2 represents barotropic torque, and ν 2 ω represents the viscous diffusion. Considering the non-compressibility of the fluid and relatively small viscous diffusion, the last two terms of the vorticity equation are ignored.
Afterward, the simplified Z-axis component of the vorticity equation is as follows:
D ω Z D t = ω · u Z ω Z · u

3. Internal Flow Field Analysis

3.1. Performance Test in Pump Mode

Figure 7 is the performance curve of the two-way pump–turbines by experiment and numerical calculation in pump mode. As shown in Figure 7, there is a slight difference between experimental results and numerical calculation results. This is because the numerical simulation calculation did not consider the mechanical loss. Meanwhile, the experimental pump in this article is consistent with Reference [20], and the difference between the two is not significant under full flow conditions. Accordingly, the numerical calculation results are comparatively reliable.

3.2. Performance Analysis on Different Blade Angles

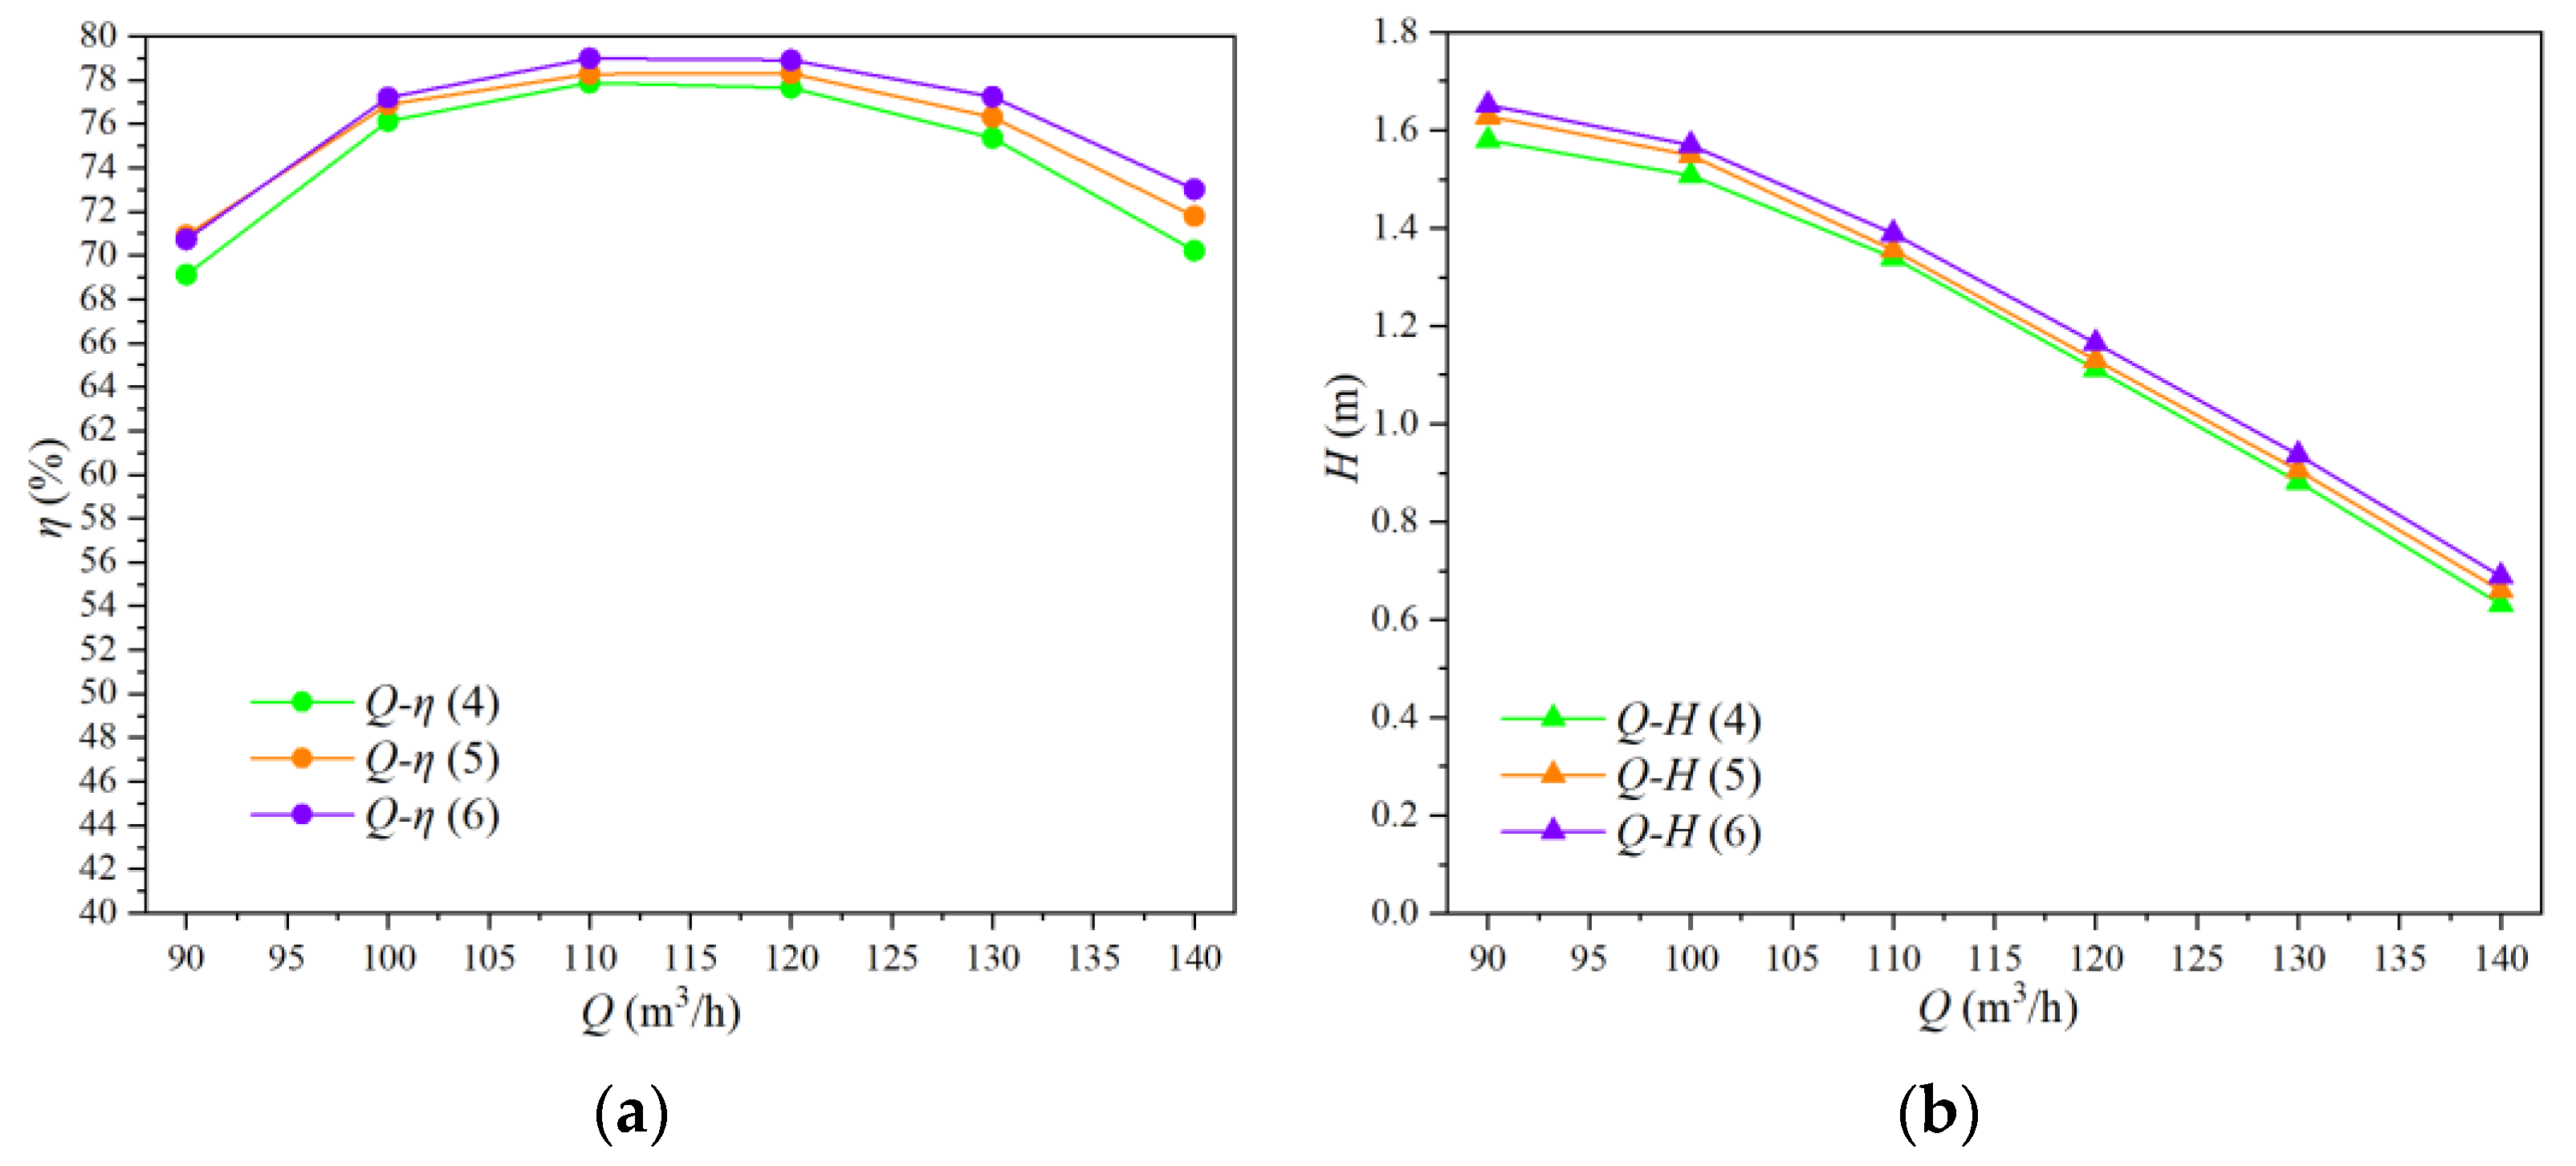
Figure 8 displays the performance curves of various blade inlet angles. Specifically, Figure 8a shows the Q-η curve, while Figure 8b shows the Q-H curve. As shown in Figure 8a, the outlet blade angle remains unchanged while the inlet blade angle gradually decreases; it is found that the efficiency of the two-way pump–turbines also decreases with a decrease in the inlet blade angle. Similarly, the difference in water head between different inlet angle schemes is about 1% compared to Scheme 1 in Figure 8b.
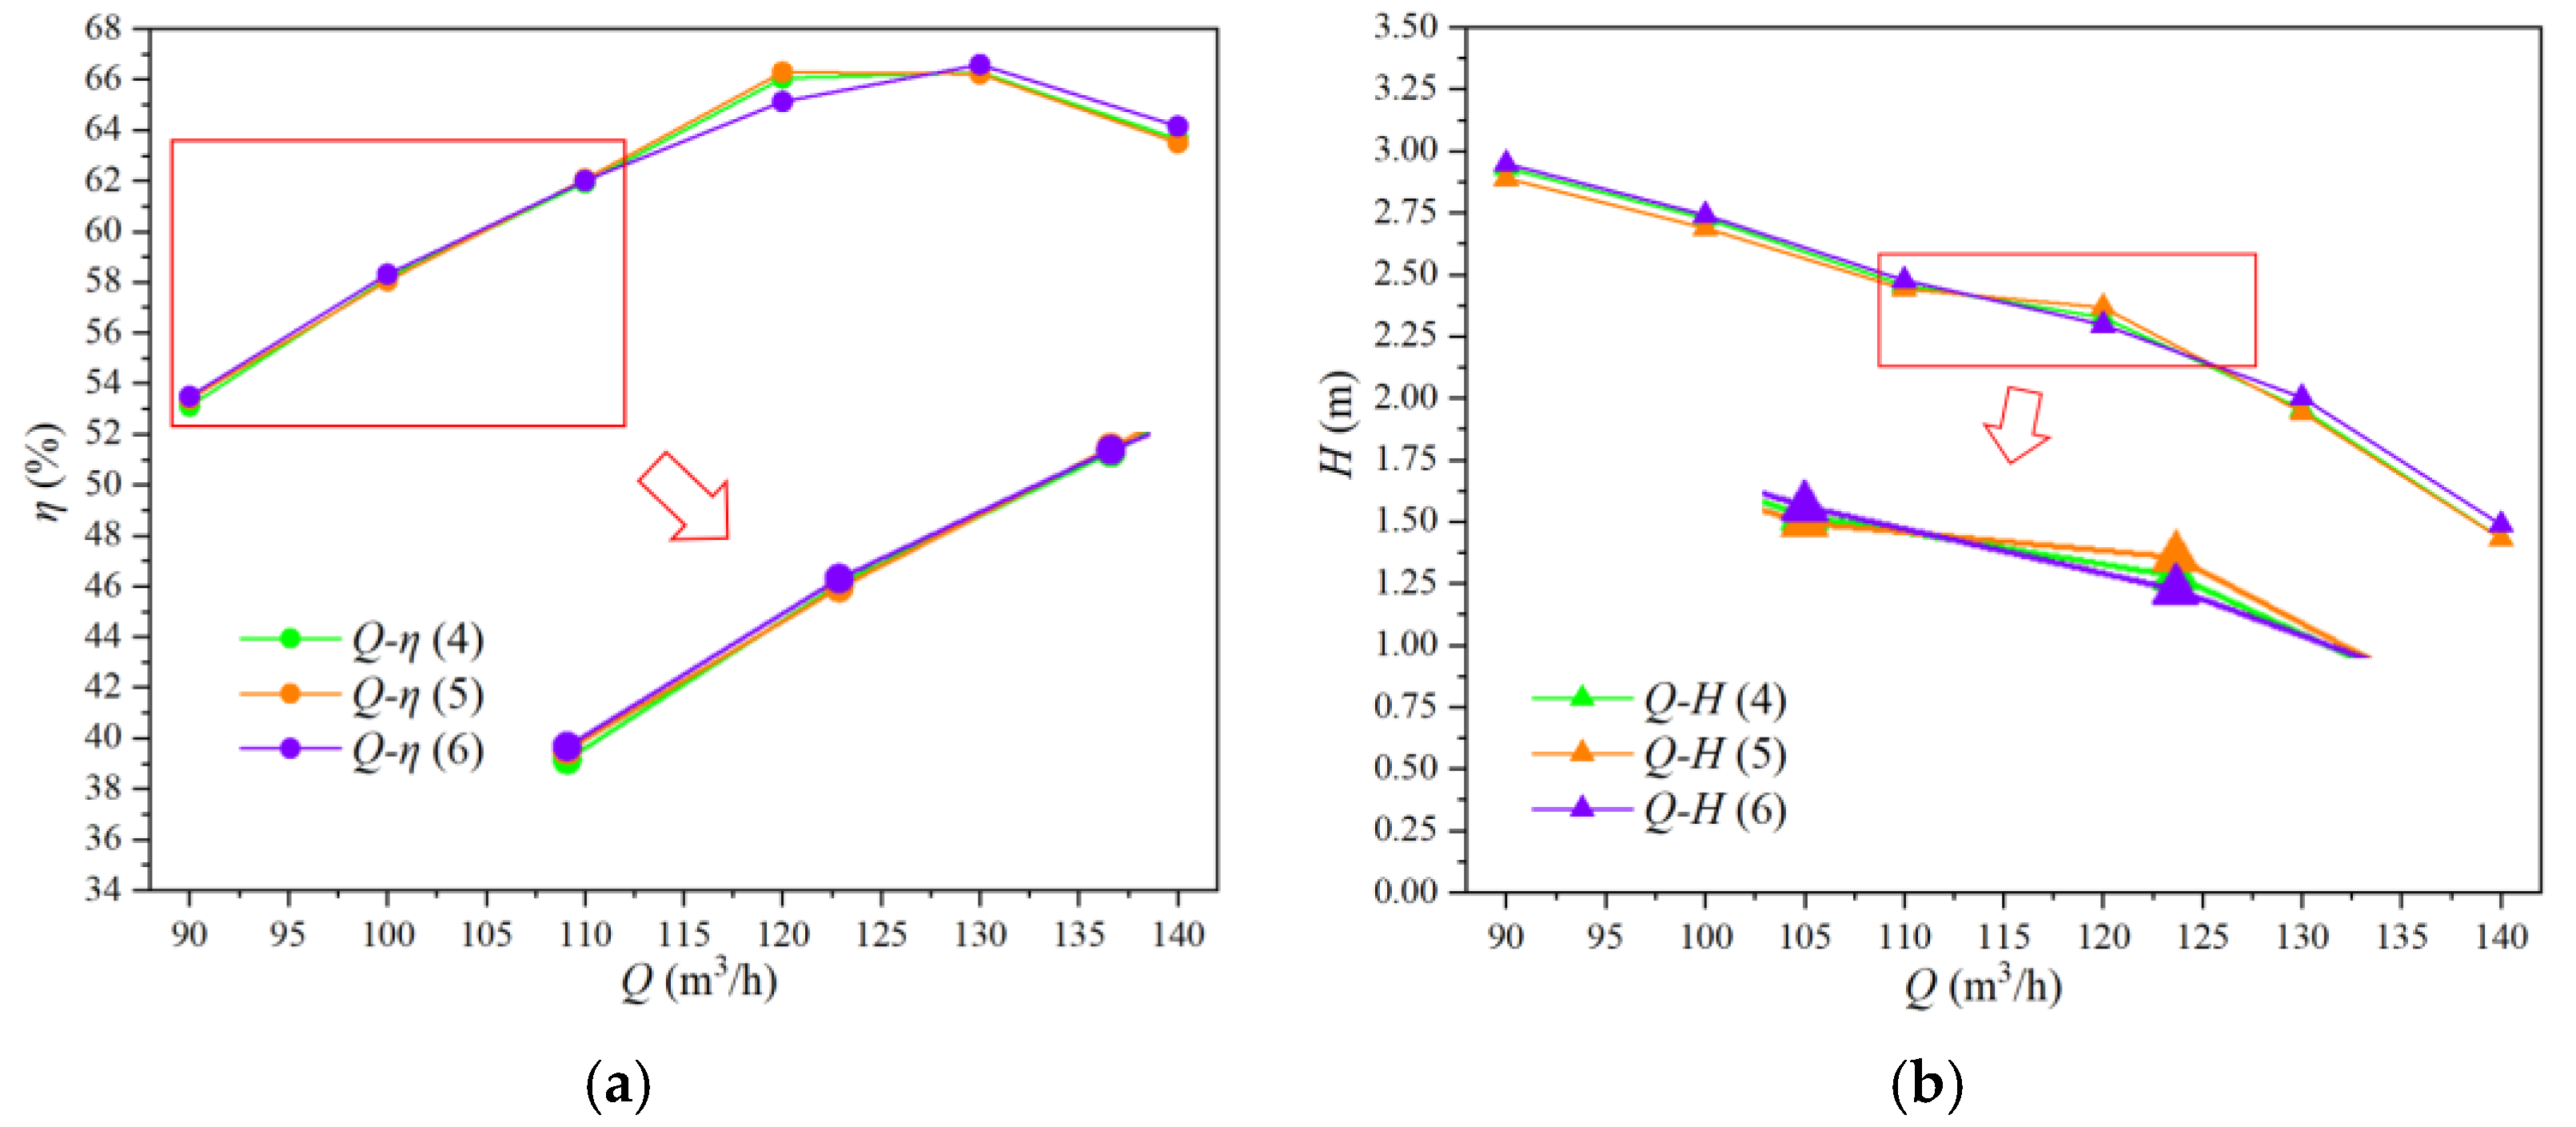
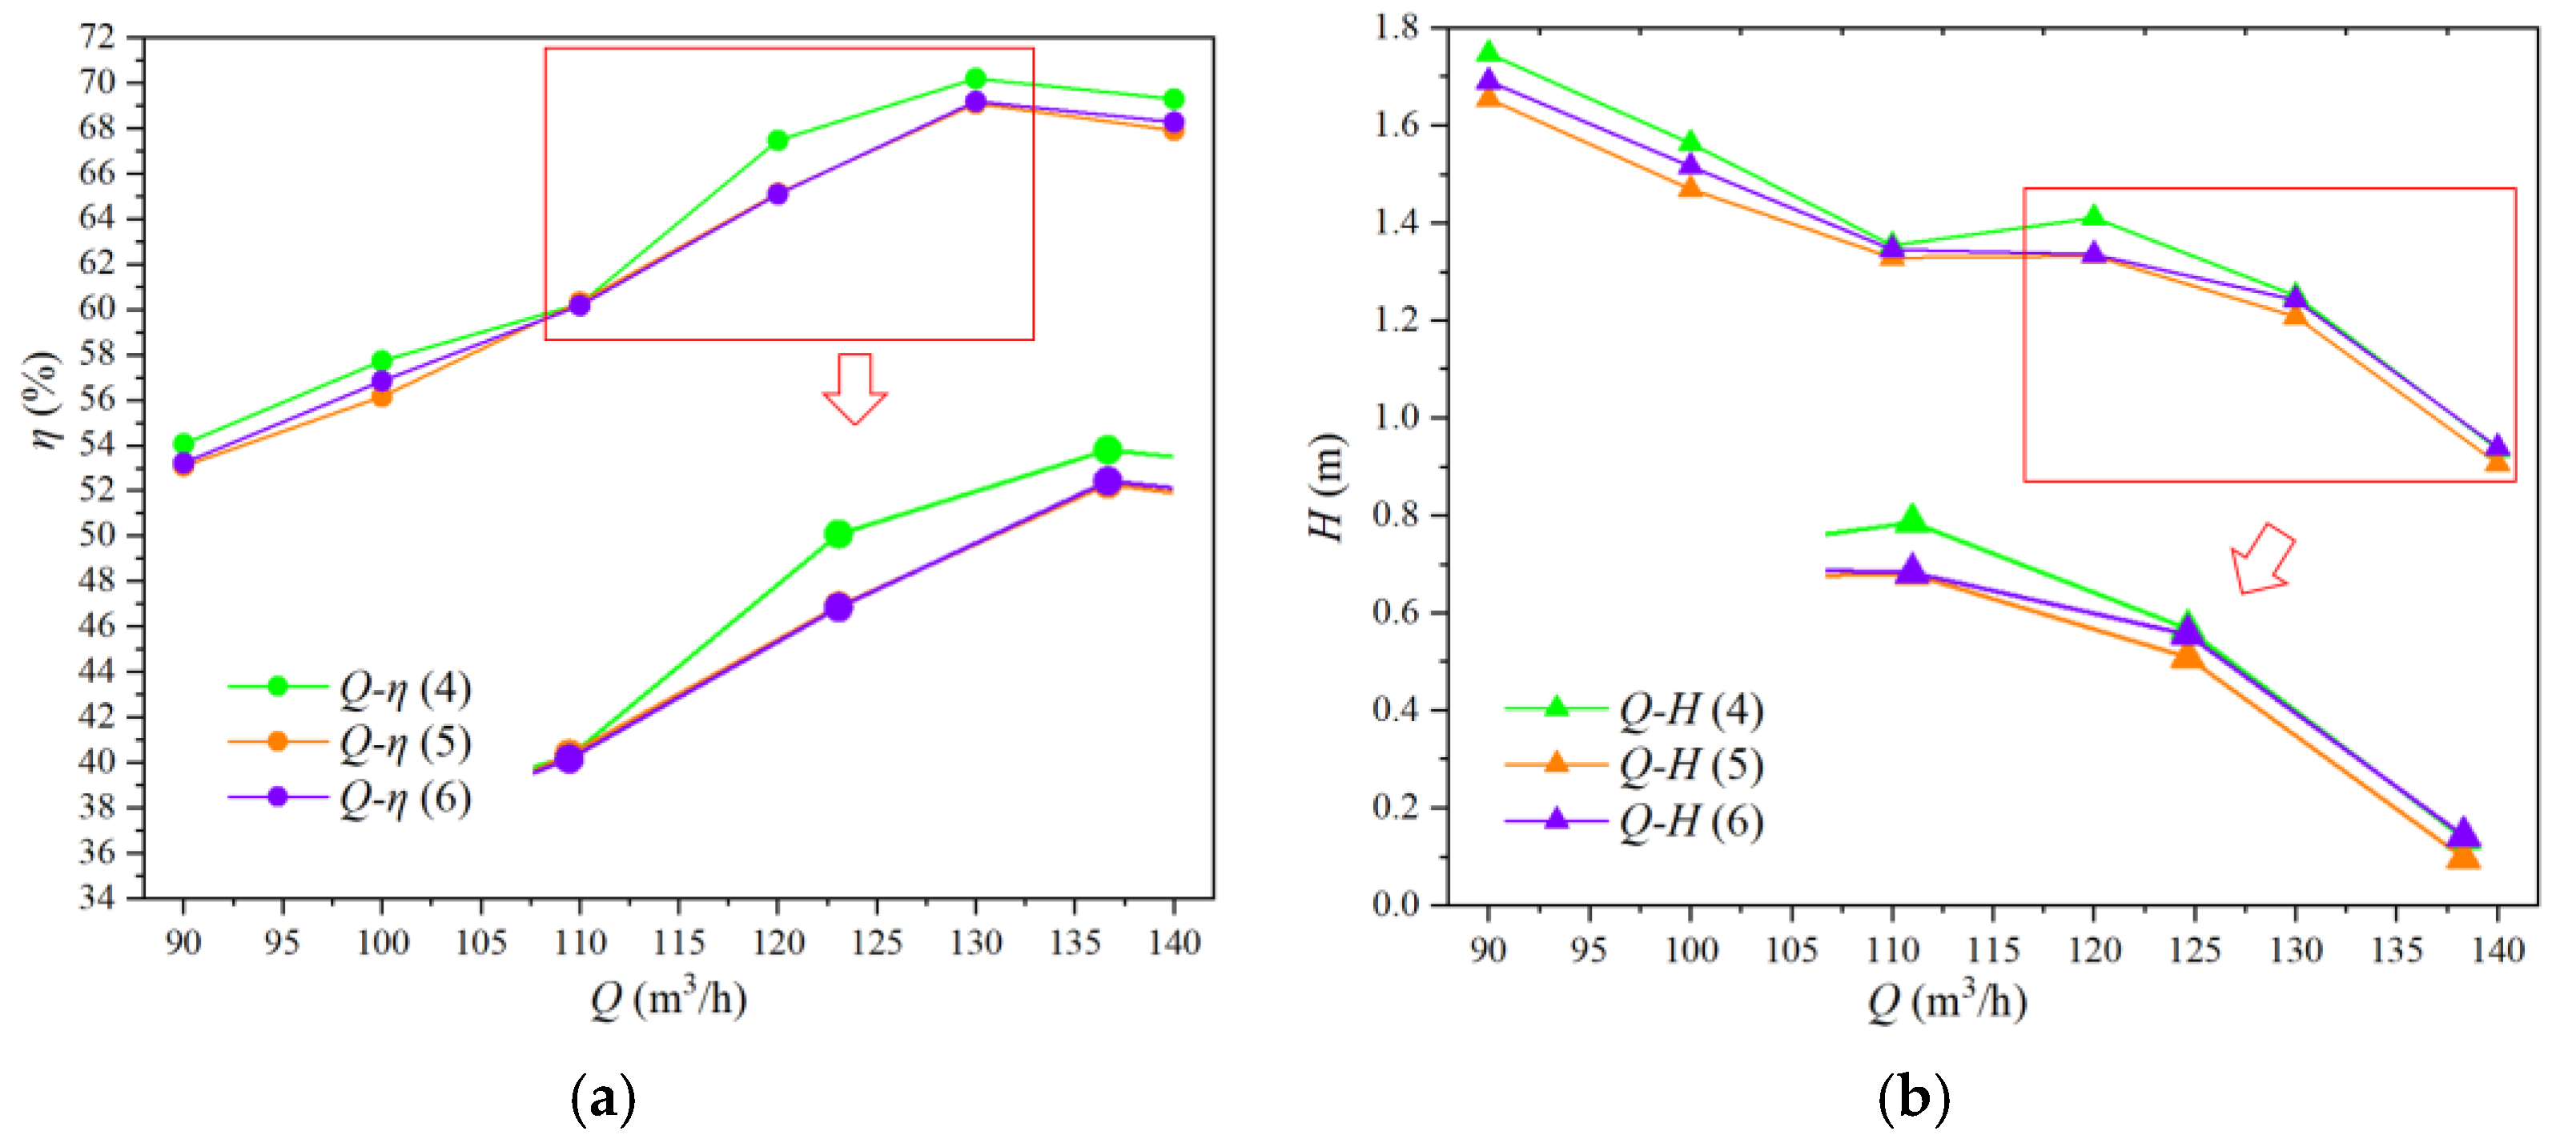
Figure 9 displays the performance curves of various blade outlet angles. Specifically, Figure 9a shows the Q-η curve, while Figure 9b shows the Q-H curve. As shown in Figure 9a, the efficiency point of Scheme 6 is biased toward high-flow operating conditions, while the efficiency trend of Scheme 4 and Scheme 5 is similar. In Figure 9b, there is no significant difference in head changes between different outlet angles.
In order to determine the impact of different blade angles on the performance of the two-way pump–turbines, a detailed analysis was conducted on the head and efficiency of each impeller.
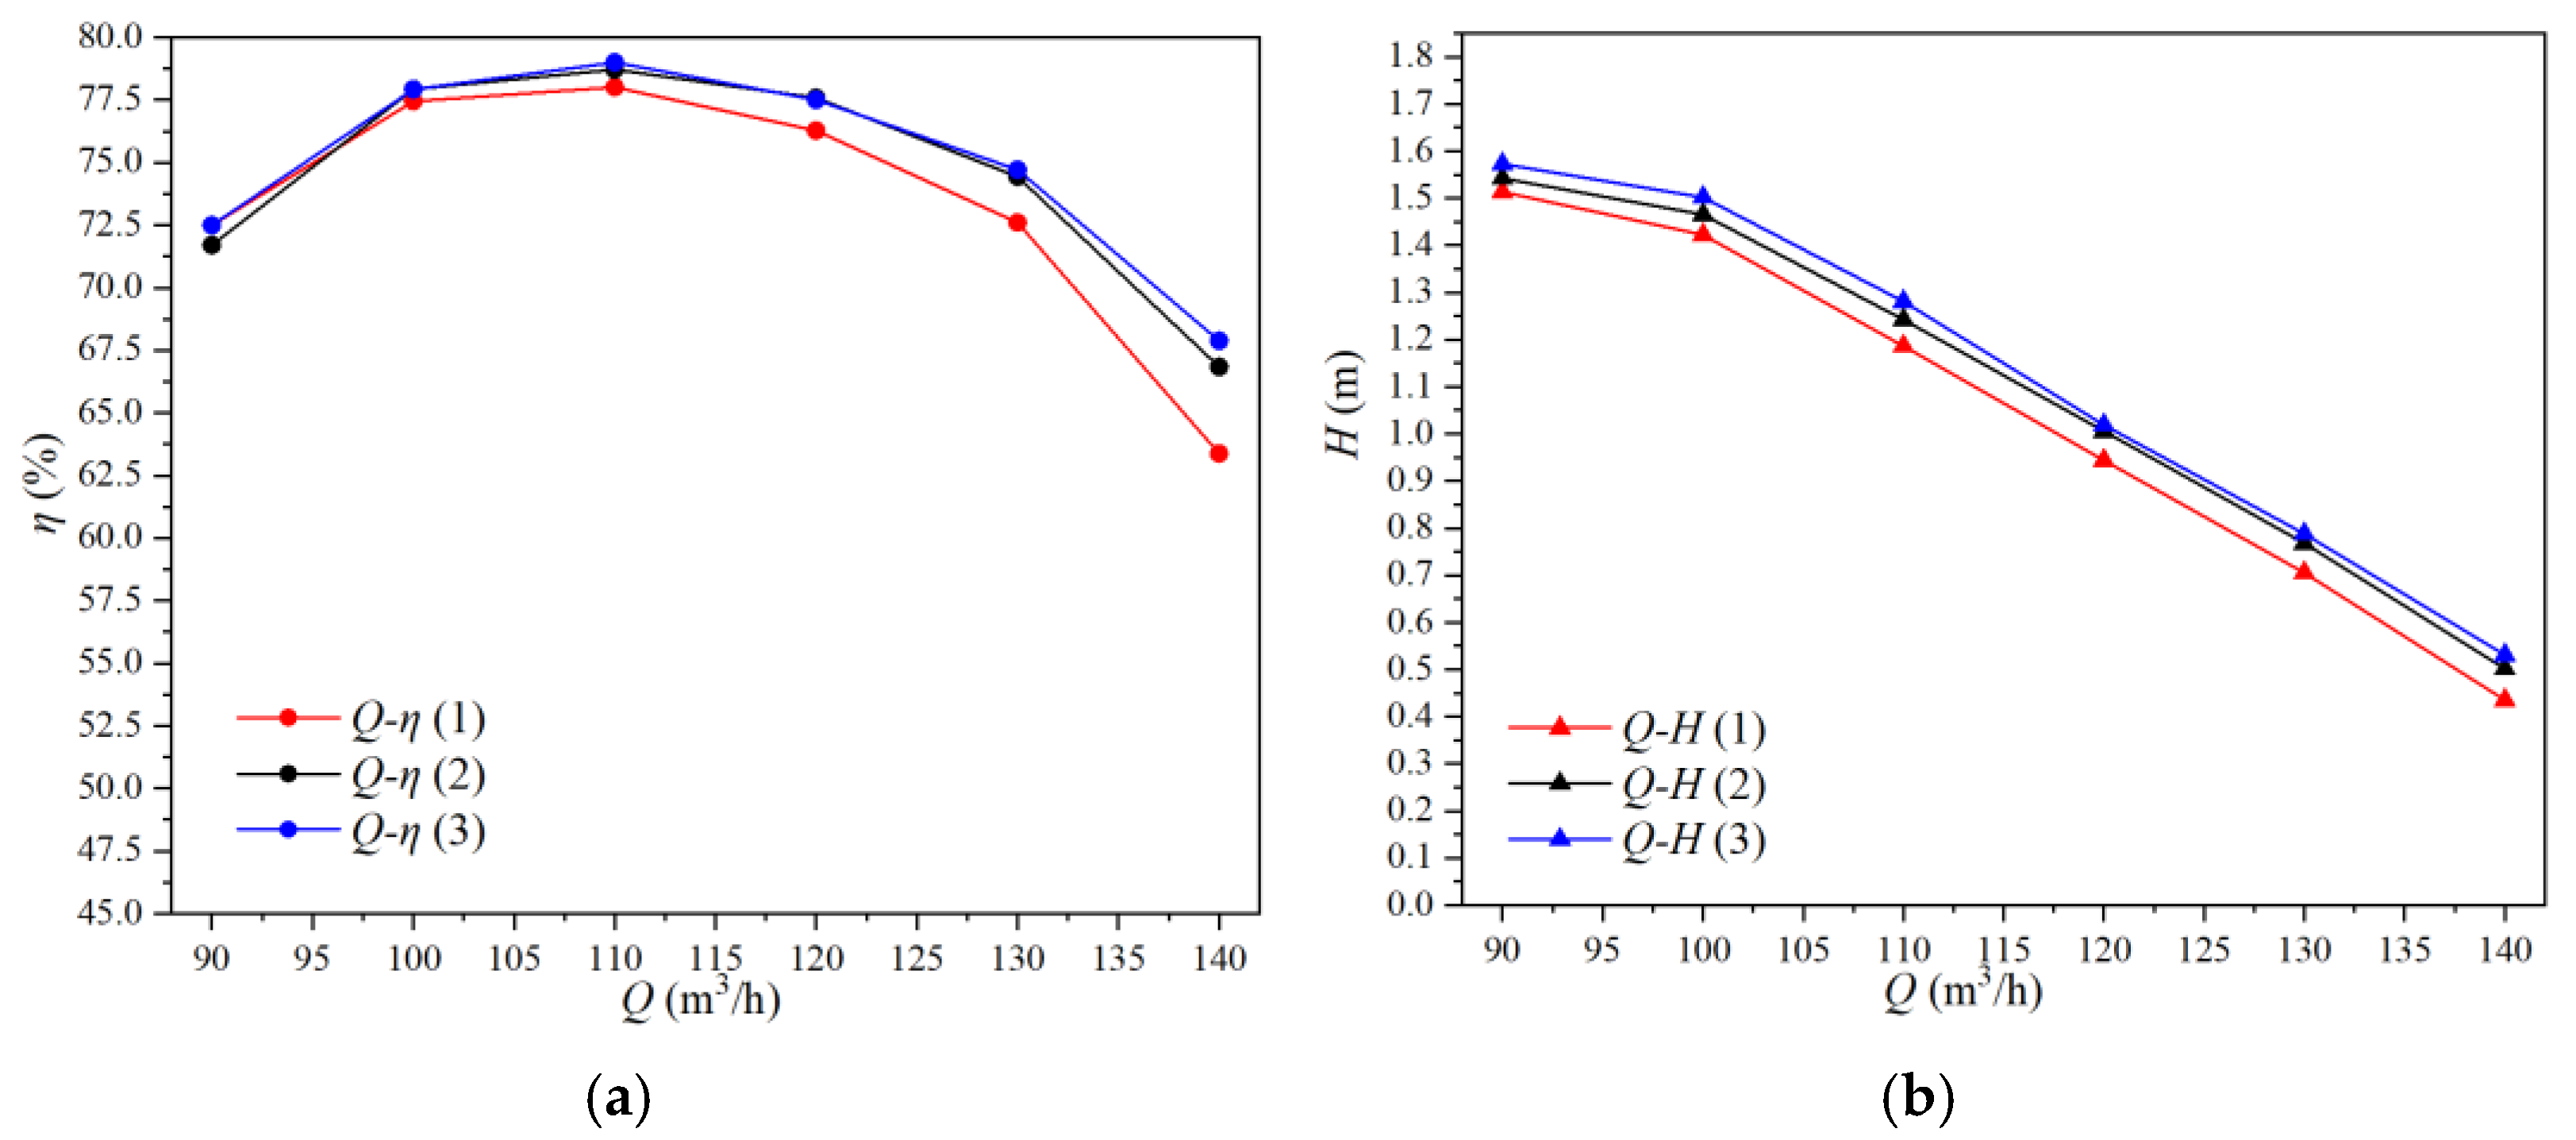
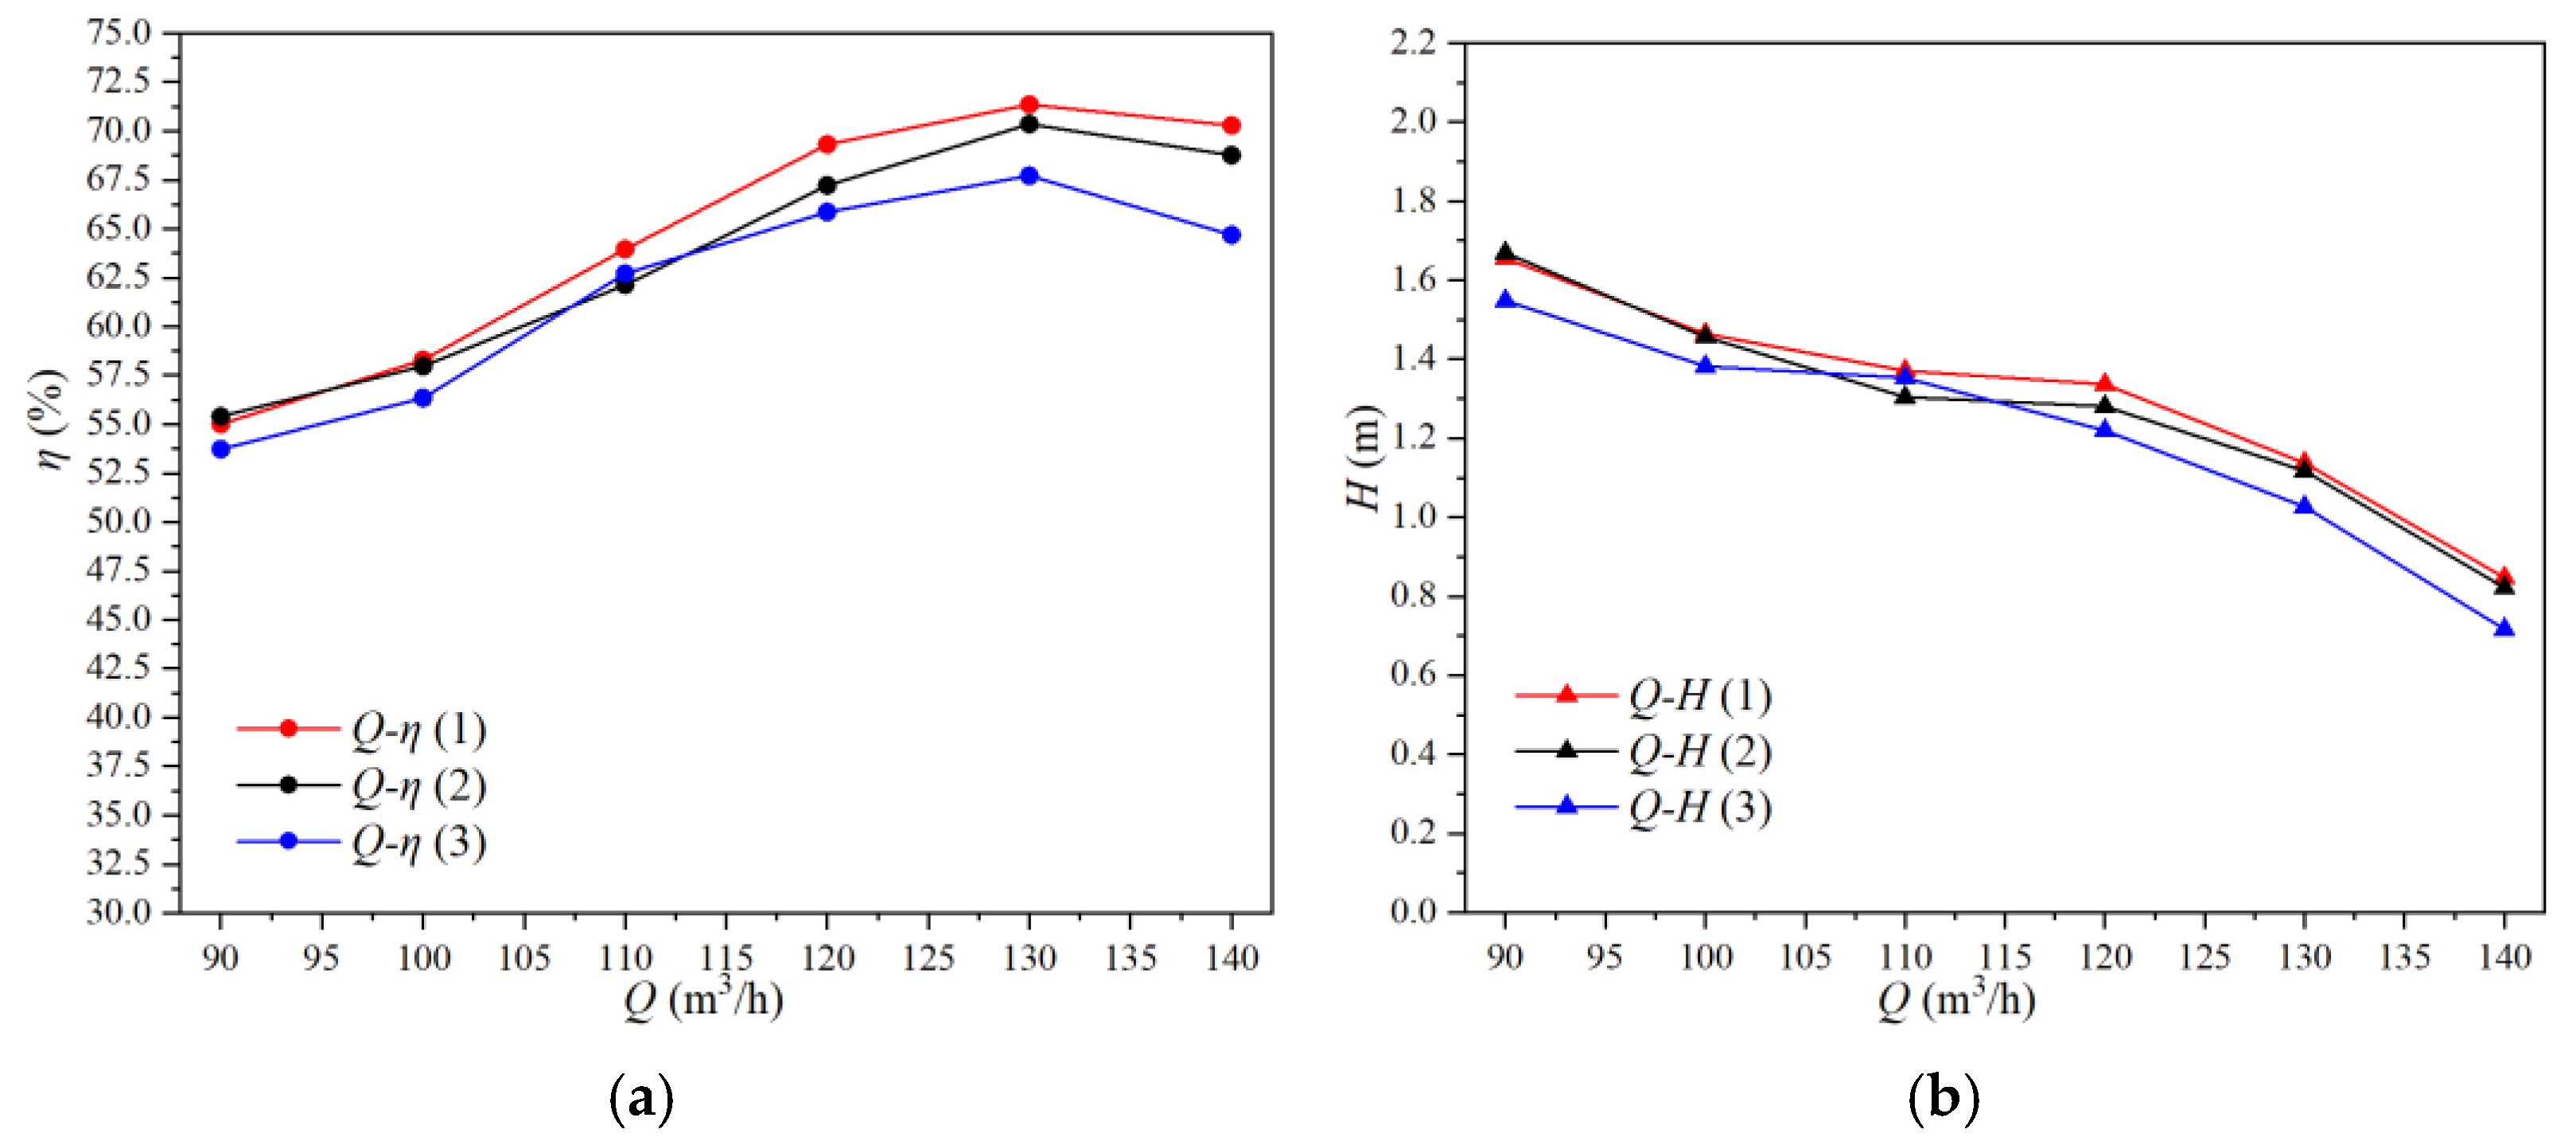
Performance curves of different front and rear blade inlet angles are shown in Figure 10 and Figure 11. The Q-η curve is shown in Figure 10a and Figure 11a, and the Q-H curve is shown in Figure 10b and Figure 11b. As shown in Figure 10, the change pattern of the Q-H curve of the front impeller in different schemes is basically consistent. Additionally, as the inlet blade angle decreases, the head of the front impeller increases in an approximately linear manner, and the efficiency of the front impeller also increases. Then, the performance changes in the rear impeller are significantly different from those of the front impeller. When the outlet blade angle is constant, the efficiency of the rear impeller decreases with the decrease in the inlet blade angle in Figure 11b, while the head of the rear impeller decreases. Comparing Figure 10 and Figure 11, the head of the front and rear impeller were relatively alike. The efficiency of the rear impeller is much lower than that of the front impeller.
Performance curves of different front and rear blade outlet angles are shown in Figure 12 and Figure 13. The Q-η curve is shown in Figure 12a and Figure 13a, and the Q-H curve is shown in Figure 12b and Figure 13b. As shown in Figure 12, the change patterns of the Q-H curve and the Q-η curve of the front impeller in different outlet angles are basically consistent. Similar to the decrease in the inlet blade angle of the front impeller, as the outlet blade angle decreases, the head of the front impeller increases in an approximately linear manner, and the efficiency of the front impeller also increases. Then, as shown in Figure 13, the performance change trend of the rear impeller for different blade outlet angles is also similar to that for different inlet angles.
When the inlet angle remains unchanged and the outlet angle decreases (the inlet angle of the rear impeller decreases), this mainly affects the performance of the rear impeller, leading to changes in the performance of the two-way pump–turbines. This is due to the improved flow angle of the inlet liquid of the rear impeller, resulting in a reduced flow rate and reduced losses.
Therefore, it is necessary to focus on considering the impact of changes in blade outlet angle on the two-way pump–turbines impeller.

3.3. Streamline Analysis

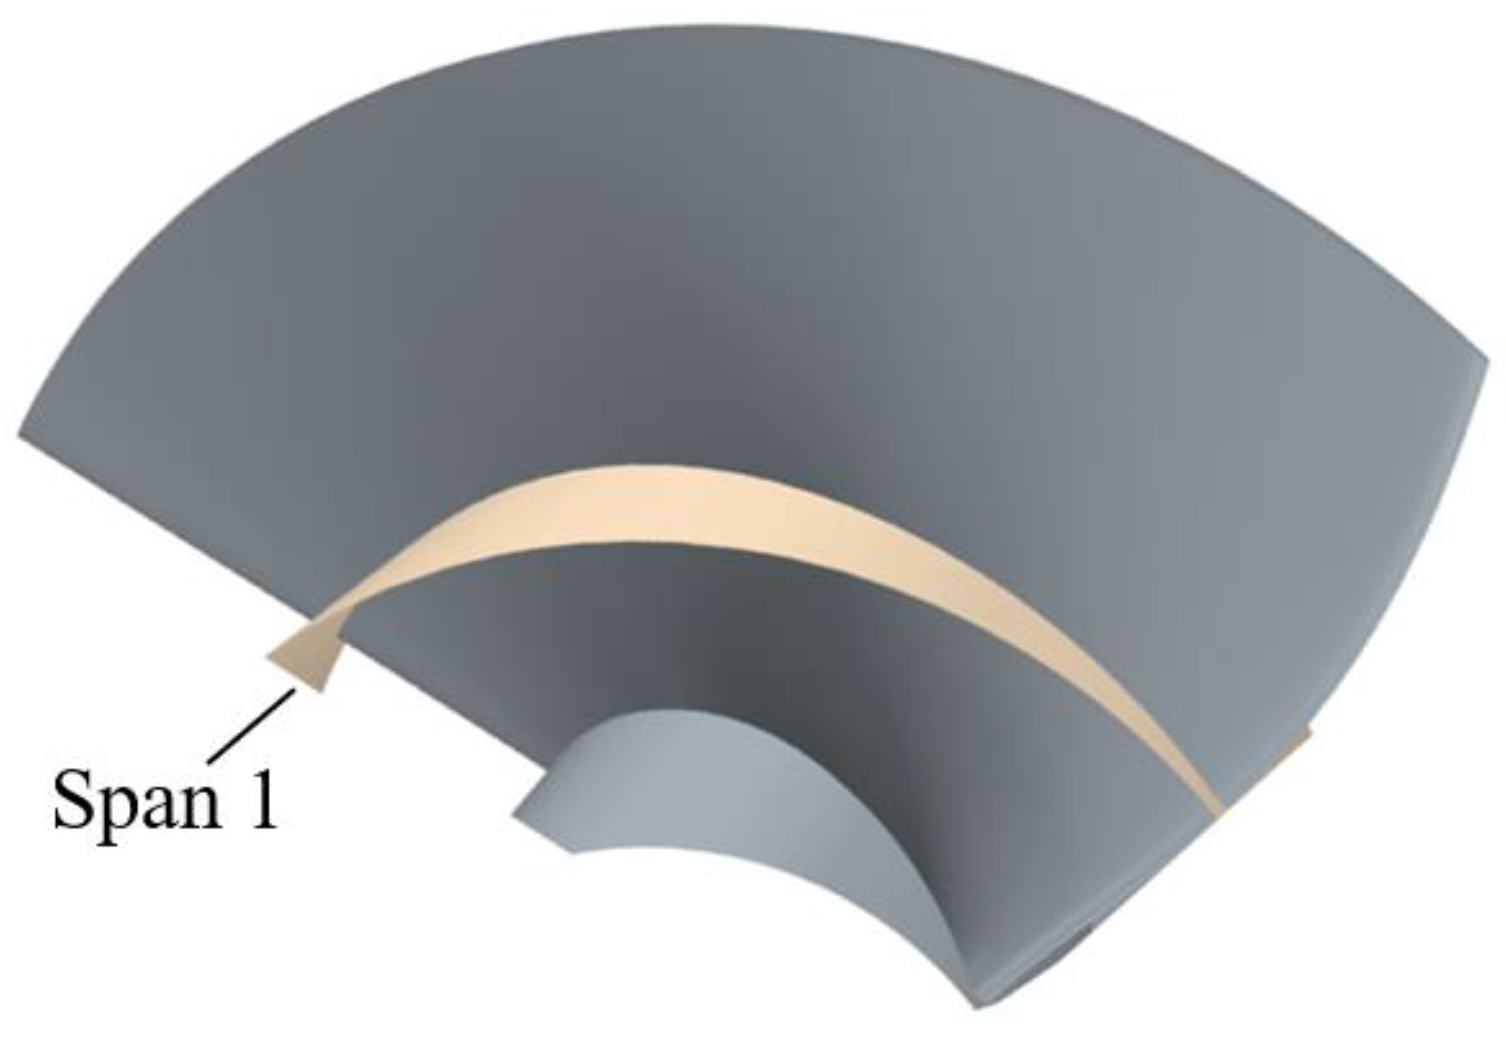
In this study, the tip leakage vortex flow is not considered, and the flow pattern of the two-stage impellers is studied. Different flow patterns impact the hydraulic performance and internal flow characteristics of fluid machinery [23]. Figure 14 shows the span surface of the impeller, in which Span 1 is span = 0.6.
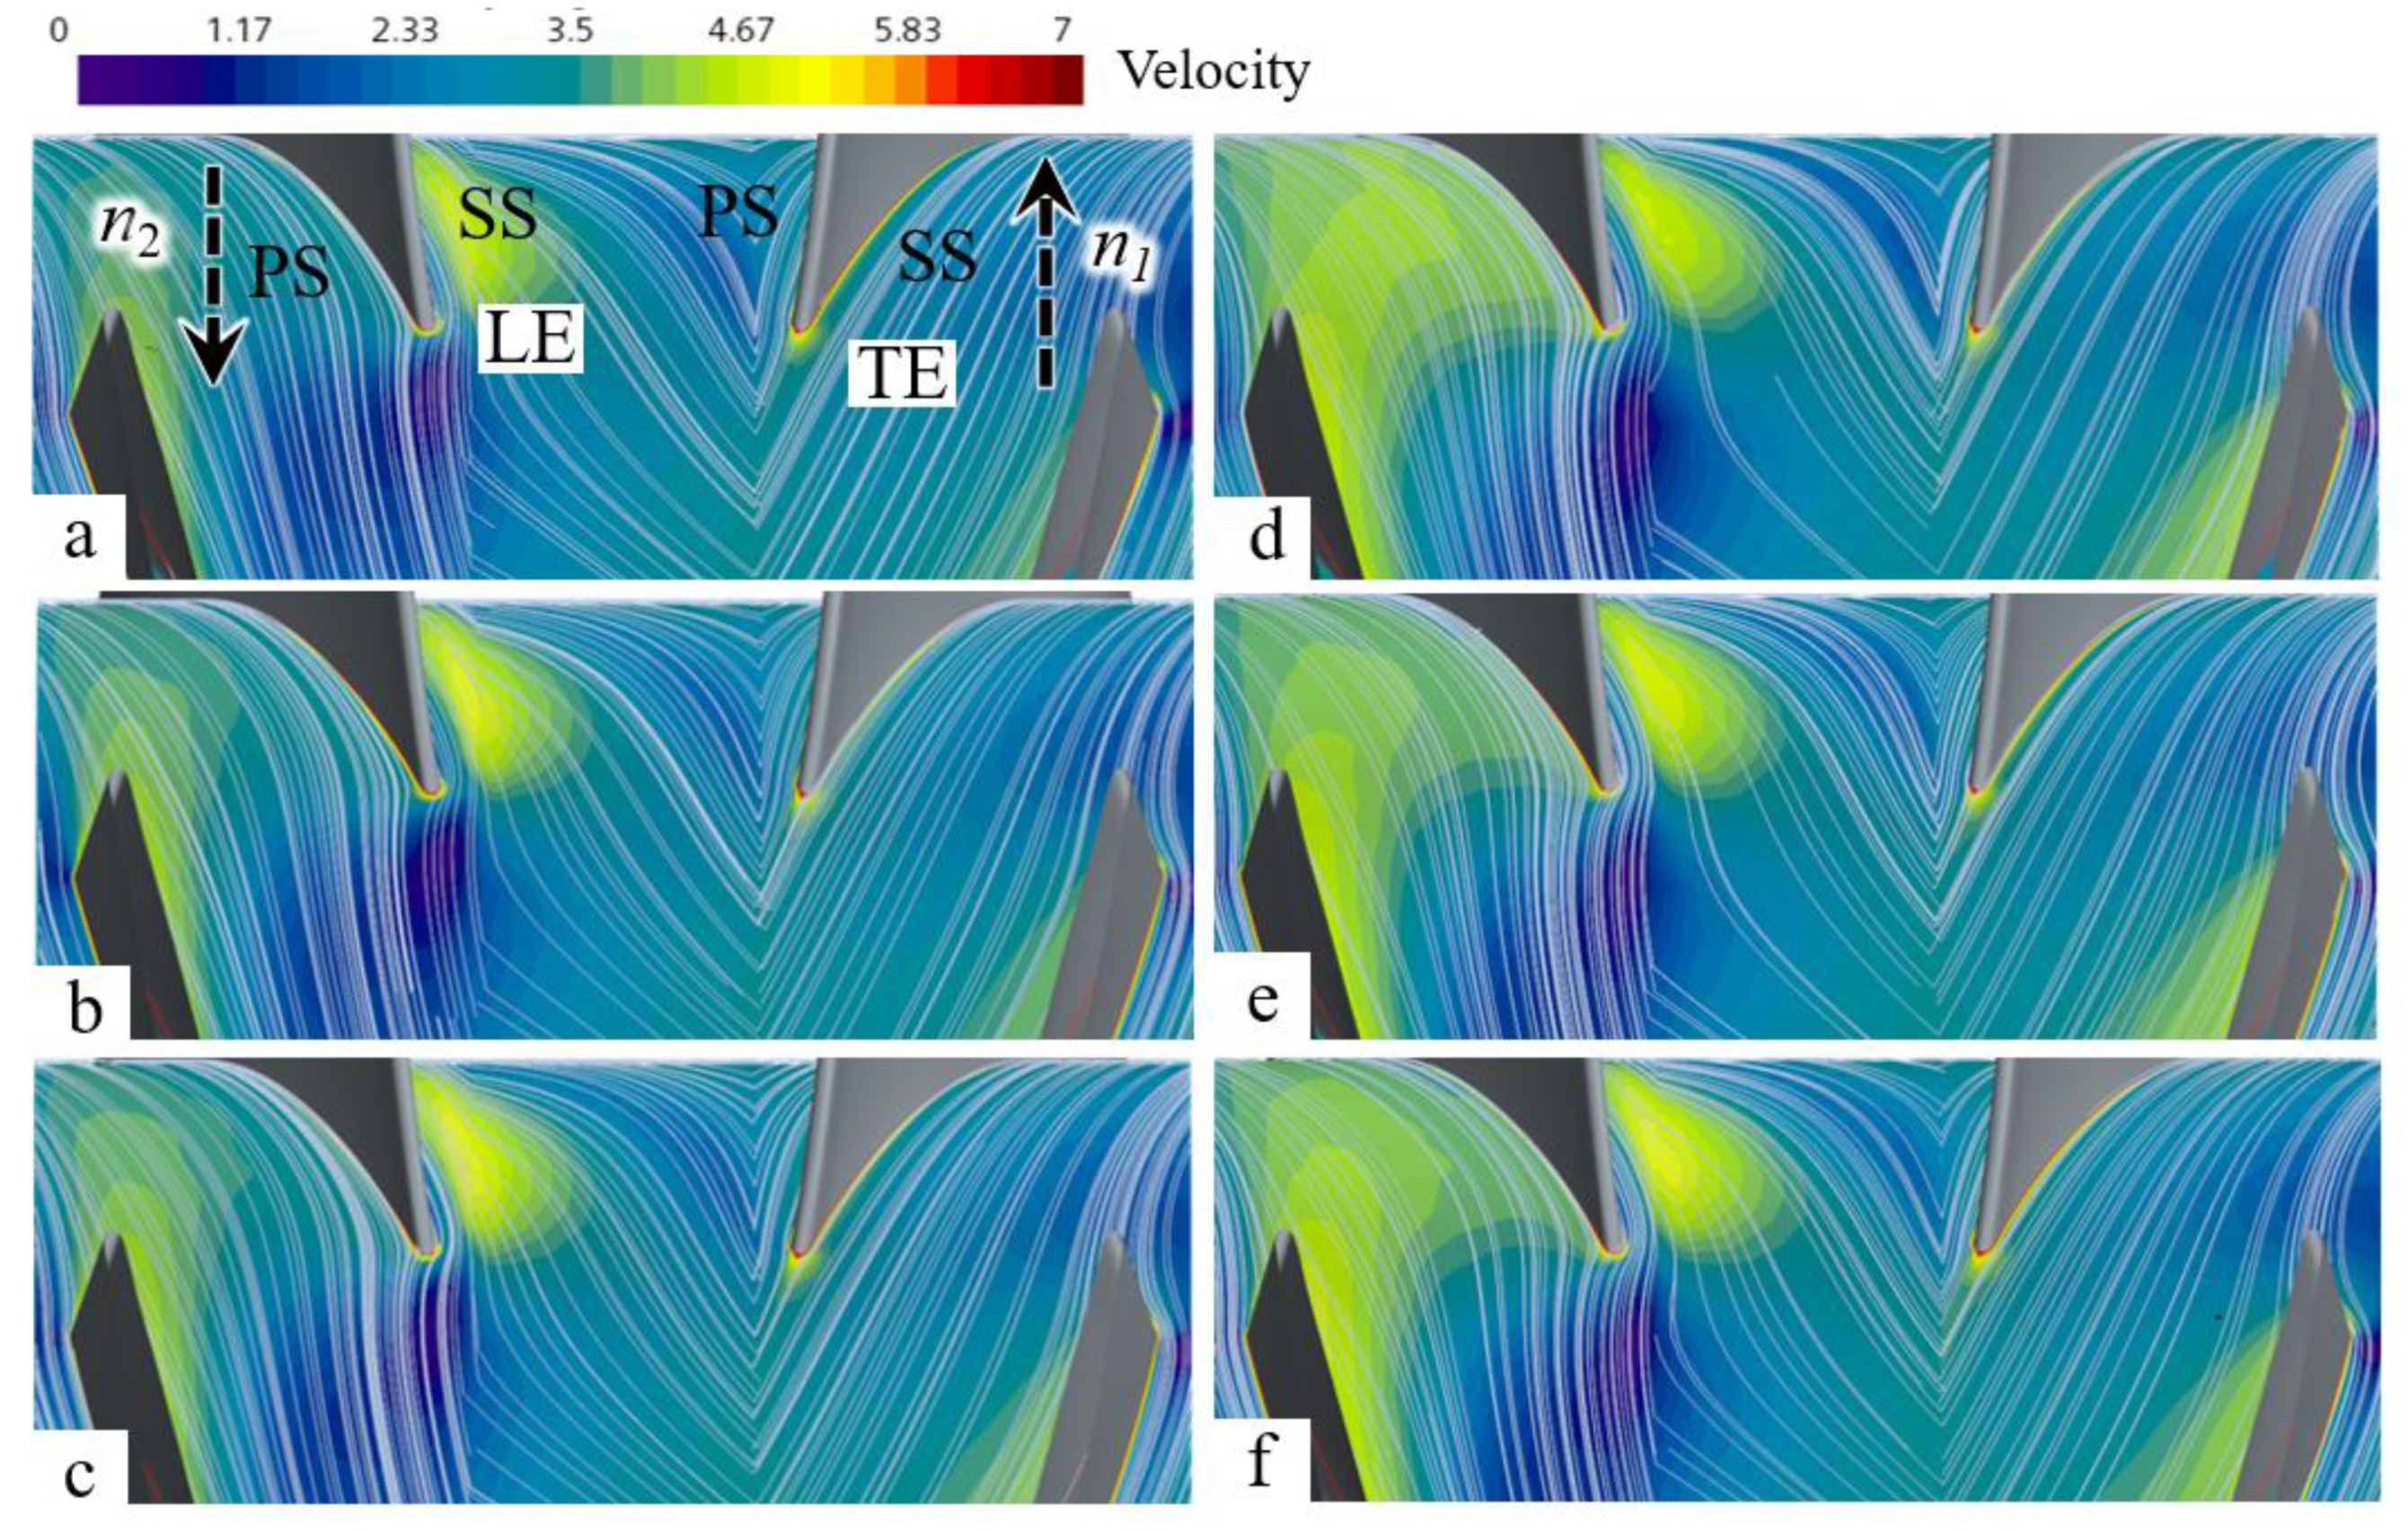
Figure 15 shows the streamline diagram of different schemes on Span 1 of the two-way impeller. In Figure 15, (a–c) are impeller inlet angle Scheme 1–3, and (d–f) are impeller outlet angle Scheme 4–6, respectively. As shown in Figure 15, the rear impeller has relatively high flow velocity, concentrating at the leading edge (LE) of the rear impeller, thereby resulting in a high-speed area. The area of higher velocity accumulation was observed in the suction surface (SS), which is close to the TE of the rear impeller. It was found that the high-speed area near the TE of the rear impeller with a smaller inlet angle is significantly larger than that with a larger inlet angle.
However, as the outlet angle decreases, the area of the high-speed region also decreases. When the outlet angle of the front impeller is reduced, the impact near the LE of the rear impeller is mitigated.

3.4. Vorticity Analysis

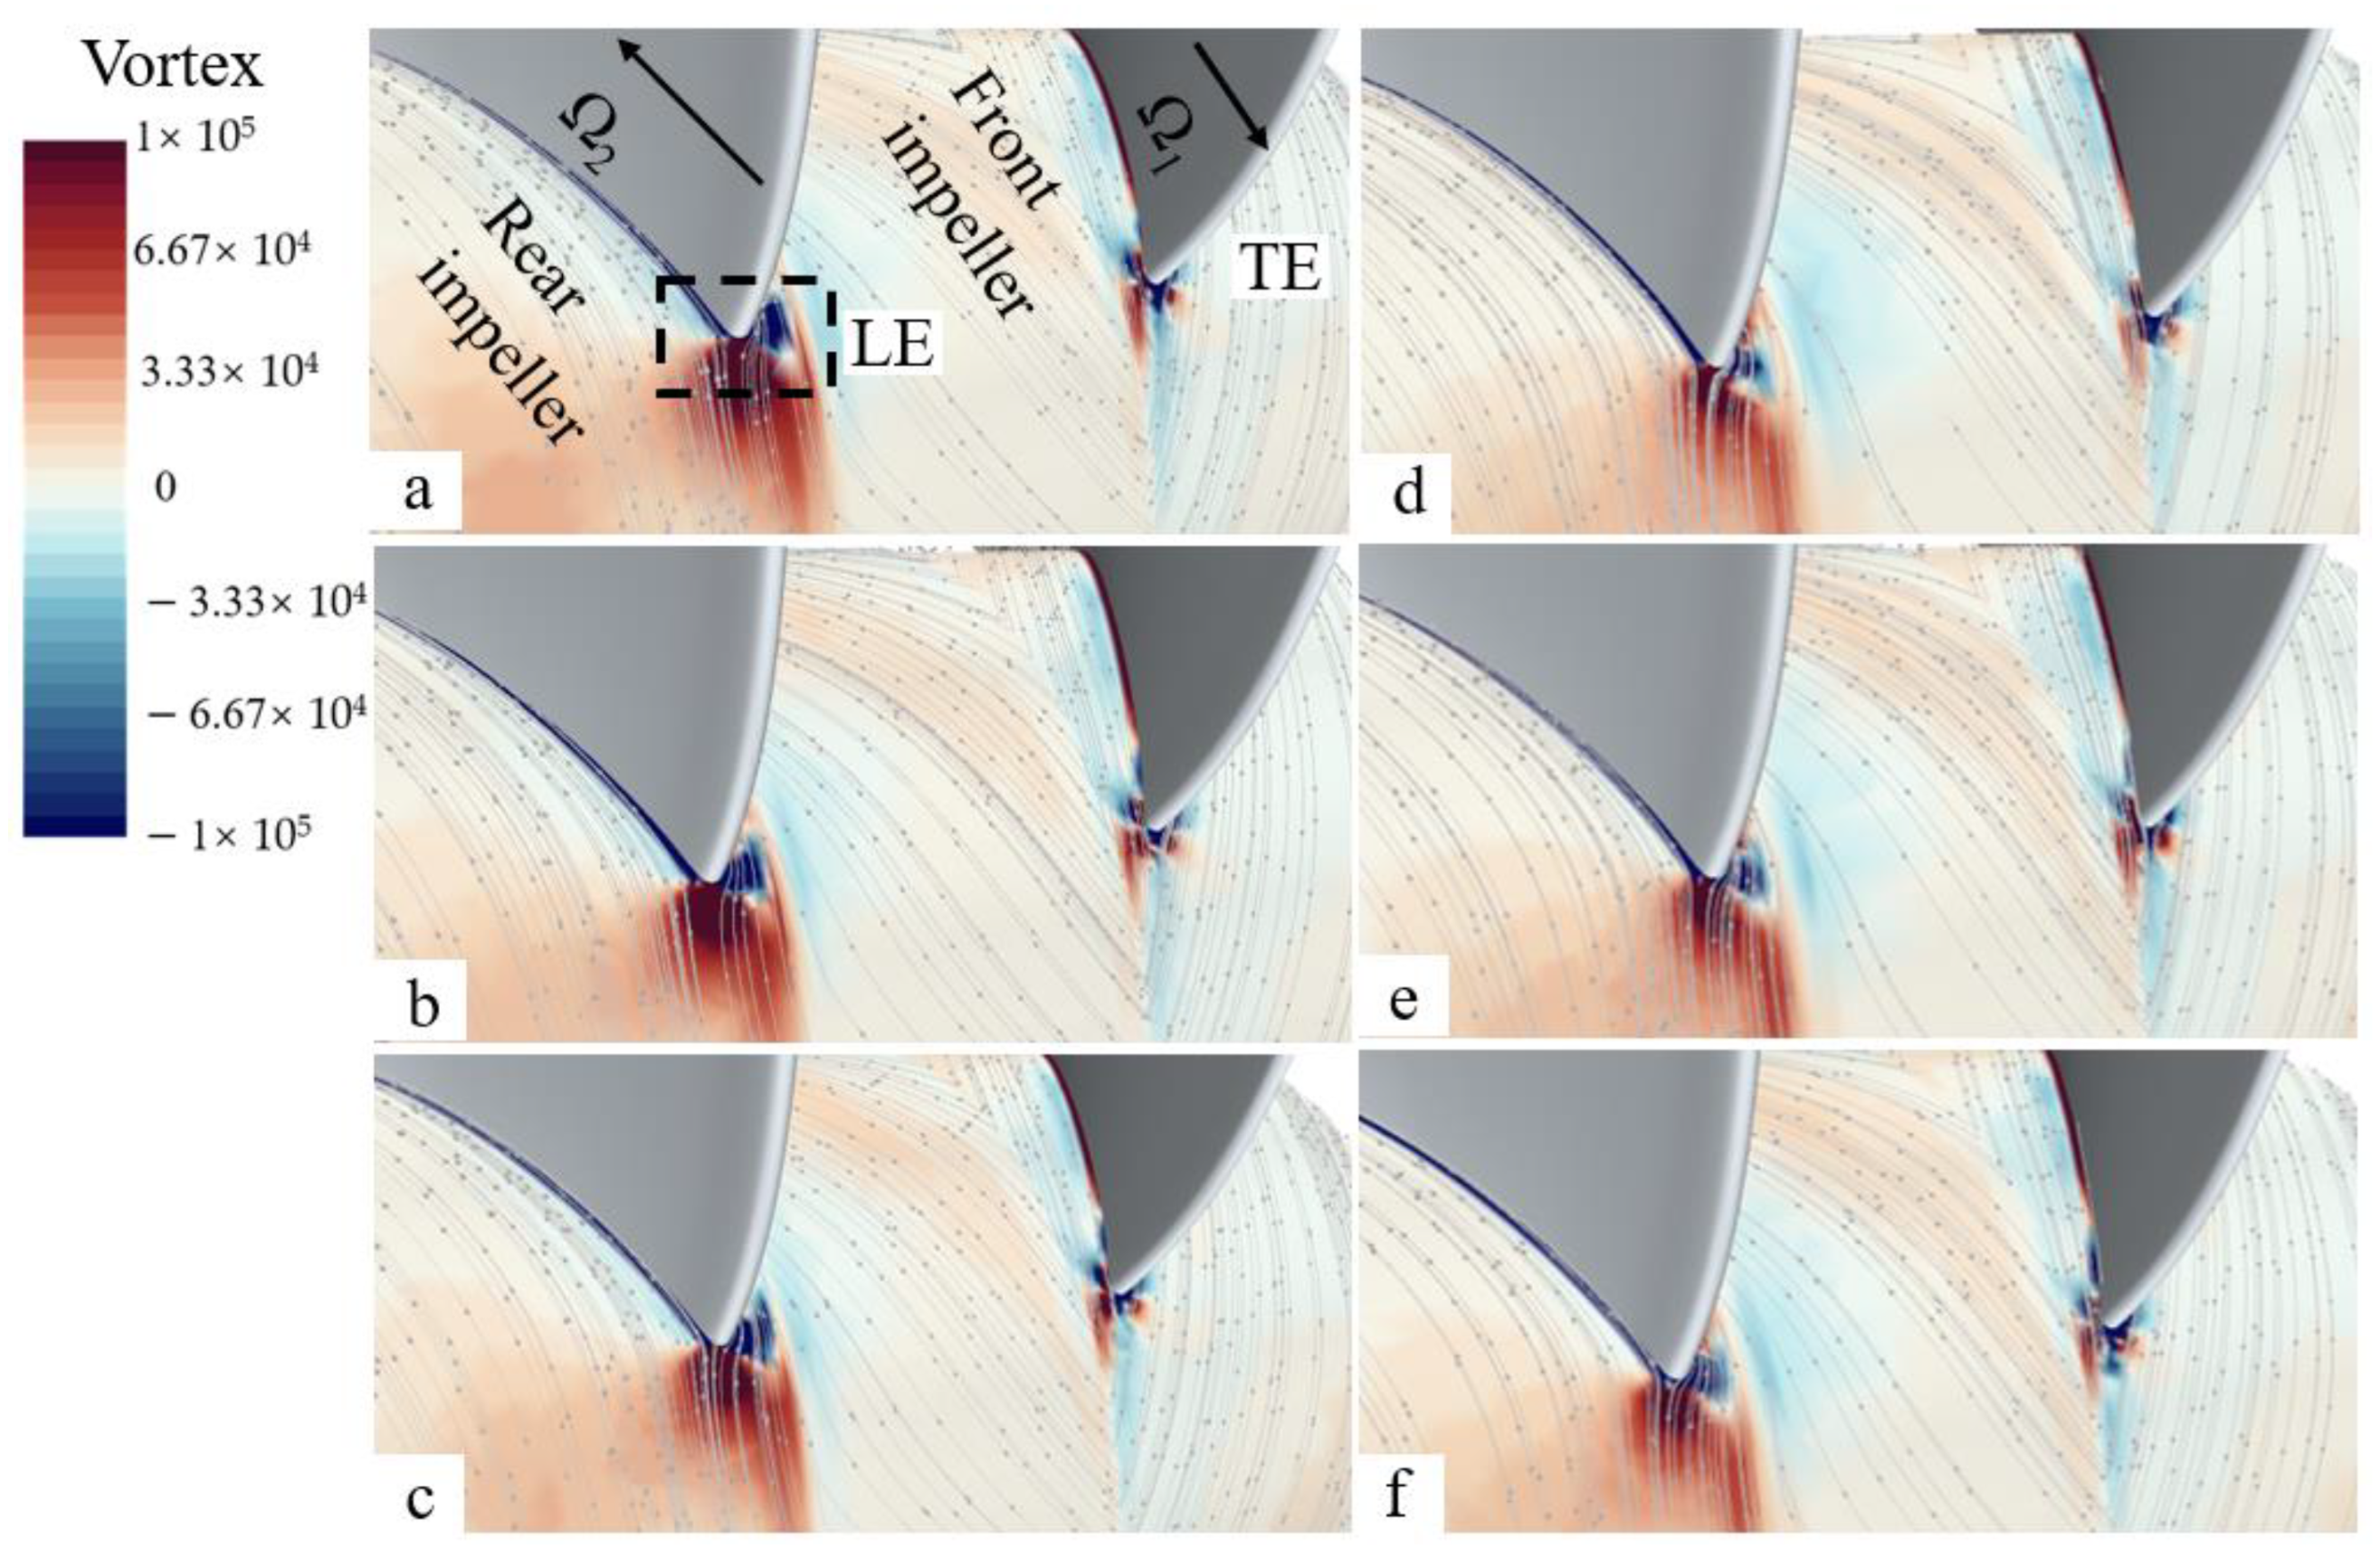
The vortex characteristics of the impeller under different blade angles were studied. Figure 16 is the vorticity of different schemes on Span 1 of the two-way impeller. In Figure 16a–c, a significant difference is not observed in the contours of vorticity around the impeller, which means that the change in the inlet blade angle of blades mainly affects the vorticity caused by blade tip leakage. As shown in Figure 16e,f, as the blade outlet angle decreases, the vorticity region on the PS of the front impeller decreases significantly, and the vorticity area near the LE of the rear impeller also decreases significantly. This is due to the position of the LE impact water of the rear impeller changing.
By analyzing each term of the vorticity equation of each impeller in detail, the performance of the two-stage impeller was further studied. Due to the insignificant changes in vorticity among different schemes, the following analysis will be conducted on Scheme 4.
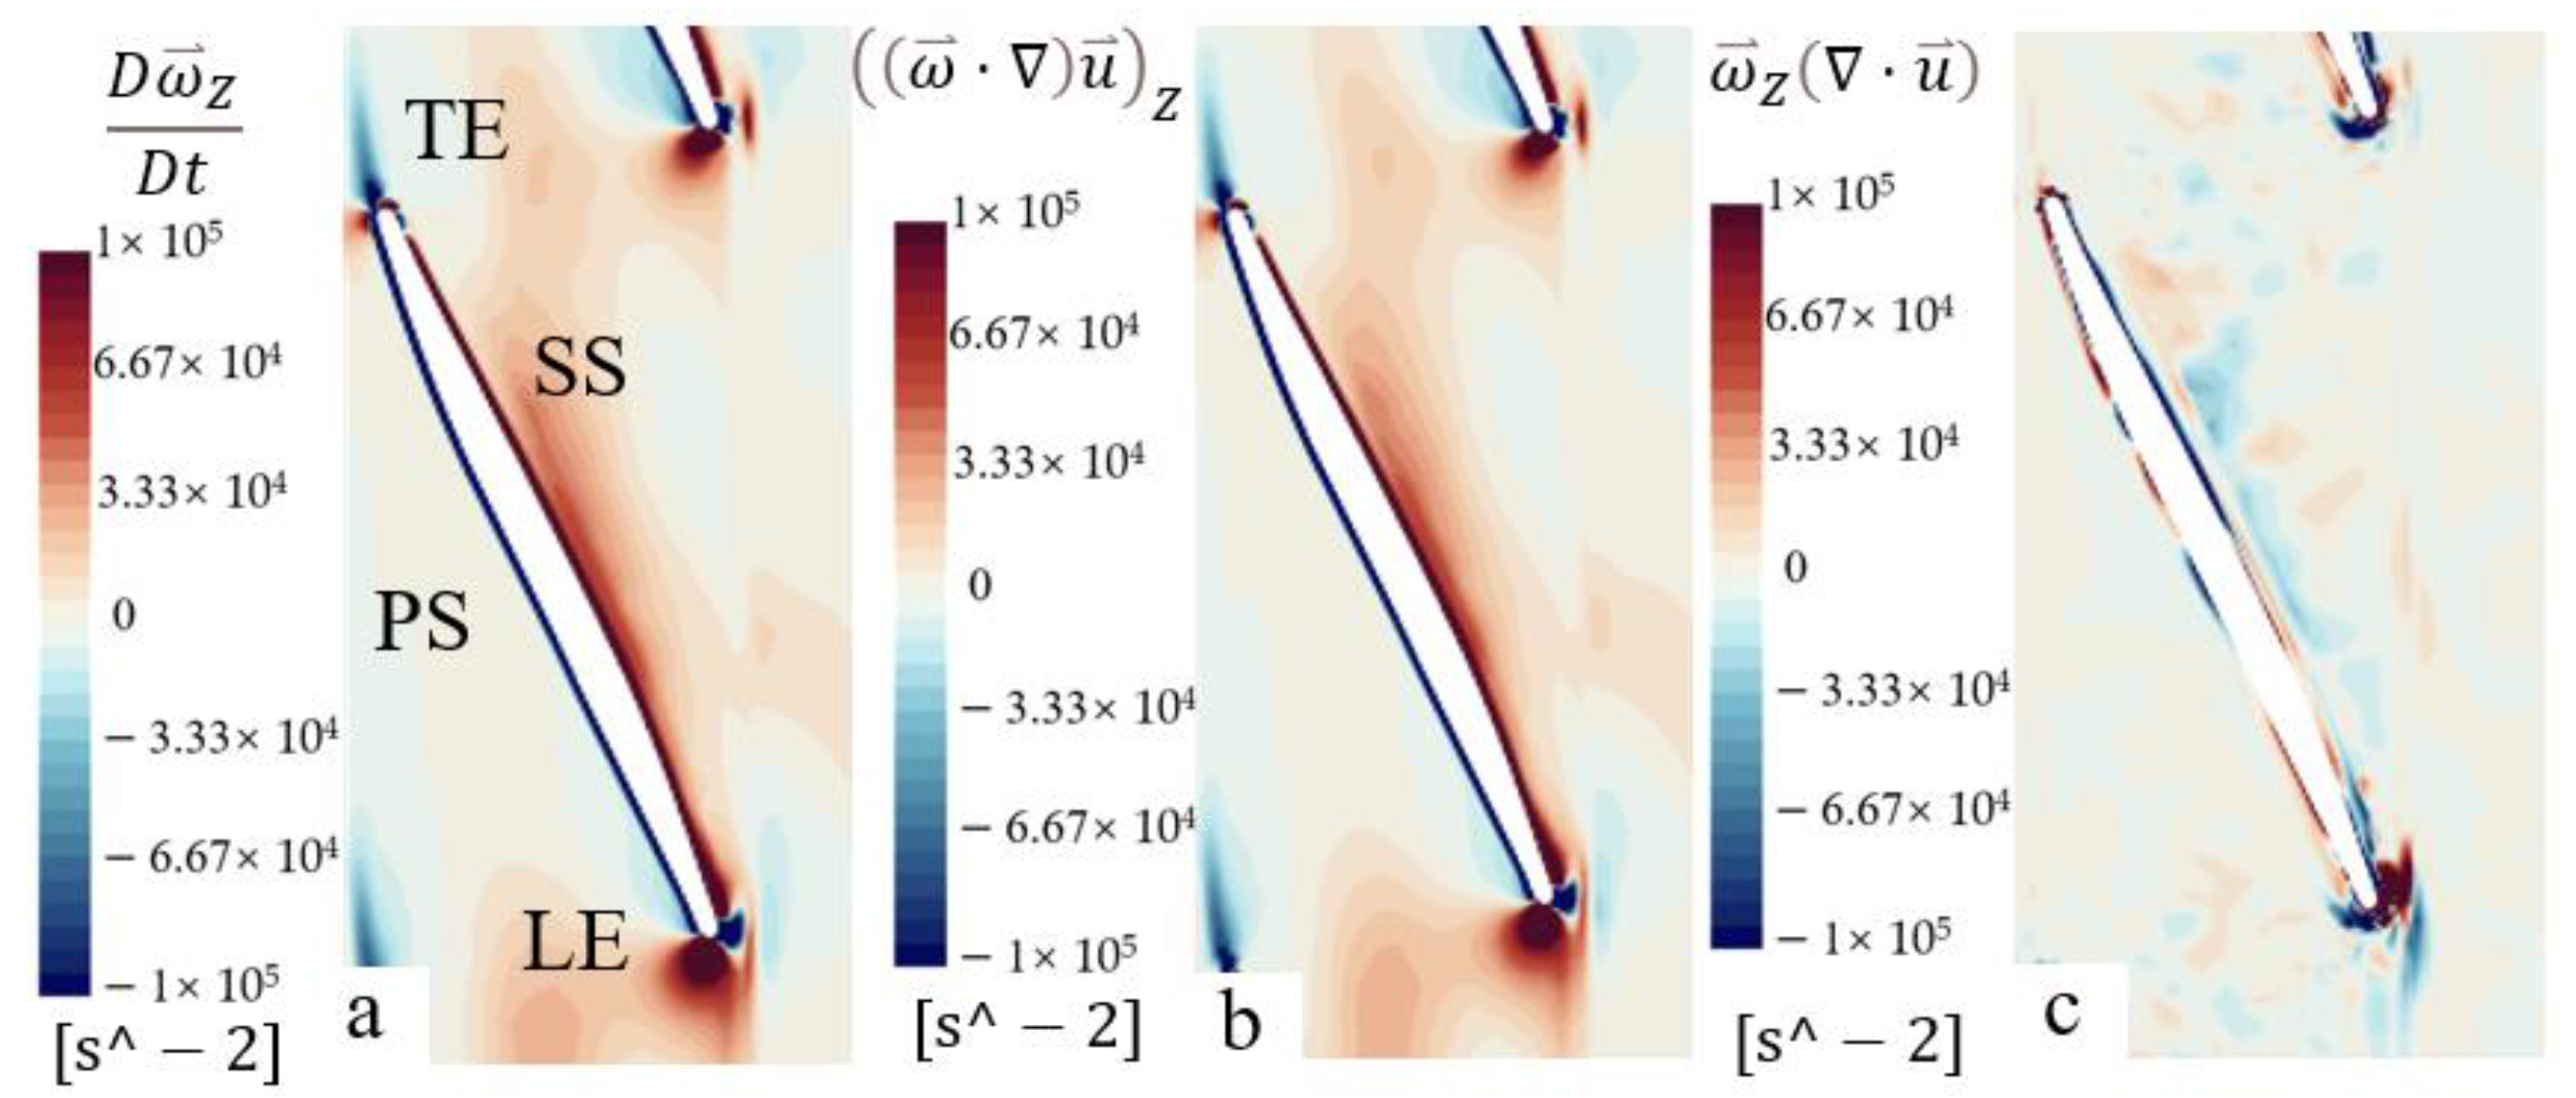
Figure 17 and Figure 18 show each term of the vorticity equation on Span 1 of the front impeller and rear impeller in Scheme 4. Comparing the figures in Figure 17, the vorticity in this area is mainly dominated by the vortex stretching term, which means that the vortex deformation here is relatively severe. In addition, there is also significant vorticity in LE, which is generated by LE impact water of the impeller. There is a region with a small value of vorticity near PS in LE, which is a continuation of the vortex caused by impact downstream and gradually dissipates in the flow. Comparing Figure 17a,b, there is only a slight difference near the blade. The contours of the vorticity caused by the vortex stretching term are mainly located near the blade surface and in the wake near the TE of the front impeller.
Due to the large distance between Span 1 and the tip clearance area, the change in vorticity caused by tip clearance leakage cannot be observed. At this time, the vorticities are mainly caused by the flow separation, which is caused by water impacting the LE of the rear impeller of the two-stage impeller and vortices formed by the wake of the TE of the front impeller. There is a region with a small value of vorticity near the blade surface in Figure 18c, which means that the vortex stretching term still dominates the vorticity transport equation at this time.
In summary, different inlet blade angles will have a certain impact on the internal flow situation of the two-way pump–turbine. The variation in different inlet blade angles is not significant for the vorticity variations in the front impeller and rear impeller. In addition, changes in the outlet blade angle will have an impact on the location of LE impact water of the rear impeller, which in turn affects the vorticity profile of the rear impeller near LE.

4. Conclusions

By calculating different schemes for adjusting the blade angle of the impeller, the effects of the blade angle of the impellers on the performance of the counter-rotating pump were obtained. The law of blade angle variation in a bidirectional water pump turbine was obtained, and the internal flow phenomenon of the front and rear impellers was studied:
(1)
When the inlet angle remains unchanged and the outlet angle decreases (the inlet angle of the rear impeller decreases), it reduces the inlet flow rate and loss of the rear impeller, affecting the performance of the rear impeller and causing changes in the performance of the two-way pump–turbines.
(2)
Compared to each term of the vorticity equation on different spans of the two-stage impeller, the vorticity in this area is mainly dominated by the vortex stretching term, which means that significant vorticity in LE of the rear impeller is generated by LE impact water of the rear impeller.
(3)
Different blade angles will have a certain impact on the internal flow situation of the two-way pump–turbine. The variation in different inlet blade angles is not significant for the vorticity variations in the two-stage impeller.
In this paper, by reducing the blade inlet and outlet angles, the impact of different blade angles on the performance of two-way pump–turbines and the internal flow situation is explored, and the effects of the blade inlet angle of the impellers on the performance of the two-way pump–turbine were obtained. Afterward, the streamline and vorticity of the two-stage impeller at different angles were analyzed.

Author Contributions

Methodology, software, and validation, C.A.; formal analysis, investigation, data curation, writing—original draft preparation, and writing—review and editing, Y.C.; supervision, R.Z. (Rongyong Zhang); project administration, Q.F.; funding acquisition, R.Z. (Rongsheng Zhu). All authors have read and agreed to the published version of the manuscript.

Funding

This study was supported by Joint Funds of the National Natural Science Foundation of China (U20A20292); National Key Research and Development Program of China (2018YFB0606105); Natural Science Foundation of Jiangsu Province (BK20210771); National Natural Science Foundation of China (51906085); China Postdoctoral Science Foundation Funded Project (2021M701847).

Data Availability Statement

We acknowledge that the data presented are original.

Conflicts of Interest

The authors declared no potential conflict of interest with respect to the research, authorship, and/or publication of this article.

References

  1. Sangiuliano, S.J. Community energy and emissions planning for tidal current turbines: A case study of the municipalities of the Southern Gulf Islands Region, British Columbia. Renew. Sustain. Energy Rev. 2017, 76, 1–8. [Google Scholar] [CrossRef]
  2. Li, Y.; Lence, B.J.; Calisal, S.M. An integrated model for estimating energy cost of a tidal current turbine farm. Energy Convers. Manag. 2011, 52, 1677–1687. [Google Scholar] [CrossRef]
  3. Qian, P.; Feng, B.; Liu, H.; Tian, X.; Si, Y.; Zhang, D. Review on configuration and control methods of tidal current turbines. Renew. Sustain. Energy Rev. 2019, 108, 125–139. [Google Scholar] [CrossRef]
  4. Charlier, R.H. A “sleeper” awakes: Tidal current power. Renew. Sustain. Energy Rev. 2003, 7, 515–529. [Google Scholar] [CrossRef]
  5. Cao, L.L.; Watanabe, S.; Imanishi, T.; Momosaki, S.; Furukawa, A. On high efficiency operation of contra-rotating axial flow pump with rotational speed control toward effective energy saving. IOP Conf. Ser. Mater. Sci. Eng. 2012, 15, 042027. [Google Scholar] [CrossRef]
  6. Cao, L.; Che, B.; Hu, L.; Wu, D.Z. Design method of water jet pump towards high cavitation performances. IOP Conf. Ser. Mater. Sci. Eng. 2016, 129, 012067. [Google Scholar] [CrossRef]
  7. Clarke, J.; Connor, G.; Grant, A.; Johnstone, C.; Ordonez-Sanchez, S. Analysis of a single point tensioned mooring system for station keeping of a contra-rotating marine current turbine. IET Renew. Power Gener. 2010, 4, 473–487. [Google Scholar] [CrossRef]
  8. Muis, A.; Sutikno, P.; Suwono, A.; Hartono, F. Comparative study on performance of very low head axial hydraulic turbine using a single rotor and a contra-rotating rotor. Appl. Mech. Mater. 2015, 758, 165–172. [Google Scholar] [CrossRef]
  9. Shigemitsu, T.; Takeshima, Y.; Ogawa, Y.; Fukutomi, J. Internal flow of contra-rotating small hydroturbine at off- design flow rates. IOP Conf. Ser. Earth Environ. Sci. 2016, 49, 102008. [Google Scholar] [CrossRef]
  10. Huang, R.; Ji, B.; Luo, X.; Zhai, Z.; Zhou, J. Numerical investigation of cavitation-vortex interaction in a mixed-flow waterjet pump. J. Mech. Sci. Technol. 2015, 29, 3707–3716. [Google Scholar] [CrossRef]
  11. Guo, Q.; Huang, X.; Qiu, B. Numerical investigation of the blade tip leakage vortex cavitation in a waterjet pump. Ocean Eng. 2019, 187, 106170. [Google Scholar] [CrossRef]
  12. Kan, K.; Zhang, Q.; Xu, Z.; Zheng, Y.; Gao, Q.; Shen, L. Energy loss mechanism due to tip leakage flow of axial flow pump as turbine under various operating conditions. Energy 2022, 255, 124532. [Google Scholar] [CrossRef]
  13. Sanders, A.J.; Papalia, J.; Fleeter, S. Multi-blade row interactions in a transonic axial compressor: Part I—Stator particle image velocimetry (PIV) investigation. J. Turbomach. 2002, 124, 10–18. [Google Scholar] [CrossRef]
  14. Shigemitsu, T.; Furukawa, A.; Watanabe, S.; Okuma, K.; Fukutomi, J. Internal flow measurement with ldv at design point of contra-rotating axial flow pump. J. Fluid Sci. Technol. 2009, 4, 723–734. [Google Scholar] [CrossRef]
  15. Momosaki, S.; Usami, S.; Watanabe, S.; Furukawa, A. Numerical simulation of internal flow in a contrarotating axial flow pump. IOP Conf. Ser. Earth Environ. Sci. 2010, 12, 012046. [Google Scholar] [CrossRef]
  16. Zhang, D.; Katayama, Y.; Watanabe, S.; Tsuda, S.-I.; Furukawa, A. Numerical study on loss mechanism in rear rotor of contra-rotating axial flow pump. Int. J. Fluid Mach. Syst. 2020, 13, 241–252. [Google Scholar] [CrossRef]
  17. Furukawa, A.; Shigemitsu, T.; Watanabe, S. Performance test and flow measurement of contrarotating axial flow pump. J. Therm. Sci. 2007, 16, 7–13. [Google Scholar] [CrossRef]
  18. Cao, L.; Watanabe, S.; Momosaki, S.; Imanishi, T.; Furukawa, A. Low speed design of rear rotor in contra-rotating axial flow pump. Int. J. Fluid Mach. Syst. 2013, 6, 105–112. [Google Scholar] [CrossRef]
  19. Cao, L.; Watanabe, S.; Imanishi, T.; Yoshimura, H.; Furukawa, A. Experimental analysis of flow structure in contra-rotating axial flow pump designed with different rotational speed concept. J. Therm. Sci. 2013, 22, 345–351. [Google Scholar] [CrossRef]
  20. An, C.; Chen, Y.; Zhu, R.; Wang, X.; Yang, Y.; Shi, J. Internal Flow Phenomena of Two-Way Contral Rotating Axial Flow Pump-Turbine in Pump Mode under Variable Speed. J. Appl. Fluid Mech. 2023, 16, 285–297. [Google Scholar] [CrossRef]
  21. Shih, T.-H.; Liou, W.W.; Shabbir, A.; Yang, Z.; Zhu, J. A New k-Epsilon Eddy Viscosity Model for High Reynolds Number Turbulent Flows: Model Development and Validation; NASA Technical Memorandum; NASA: Washington, DC, USA, 1994.
  22. Yu, Z. Numerical and Physical Investigation of Tip Leakage Vortex Cavitating Flows; Beijing Institute of Technology: Beijing, China, 2016. [Google Scholar]
  23. Li, X.; Chen, B.; Luo, X.; Zhu, Z. Effects of flow pattern on hydraulic performance and energy conversion characterisation in a centrifugal pump. Renew. Energy 2020, 151, 475–487. [Google Scholar]
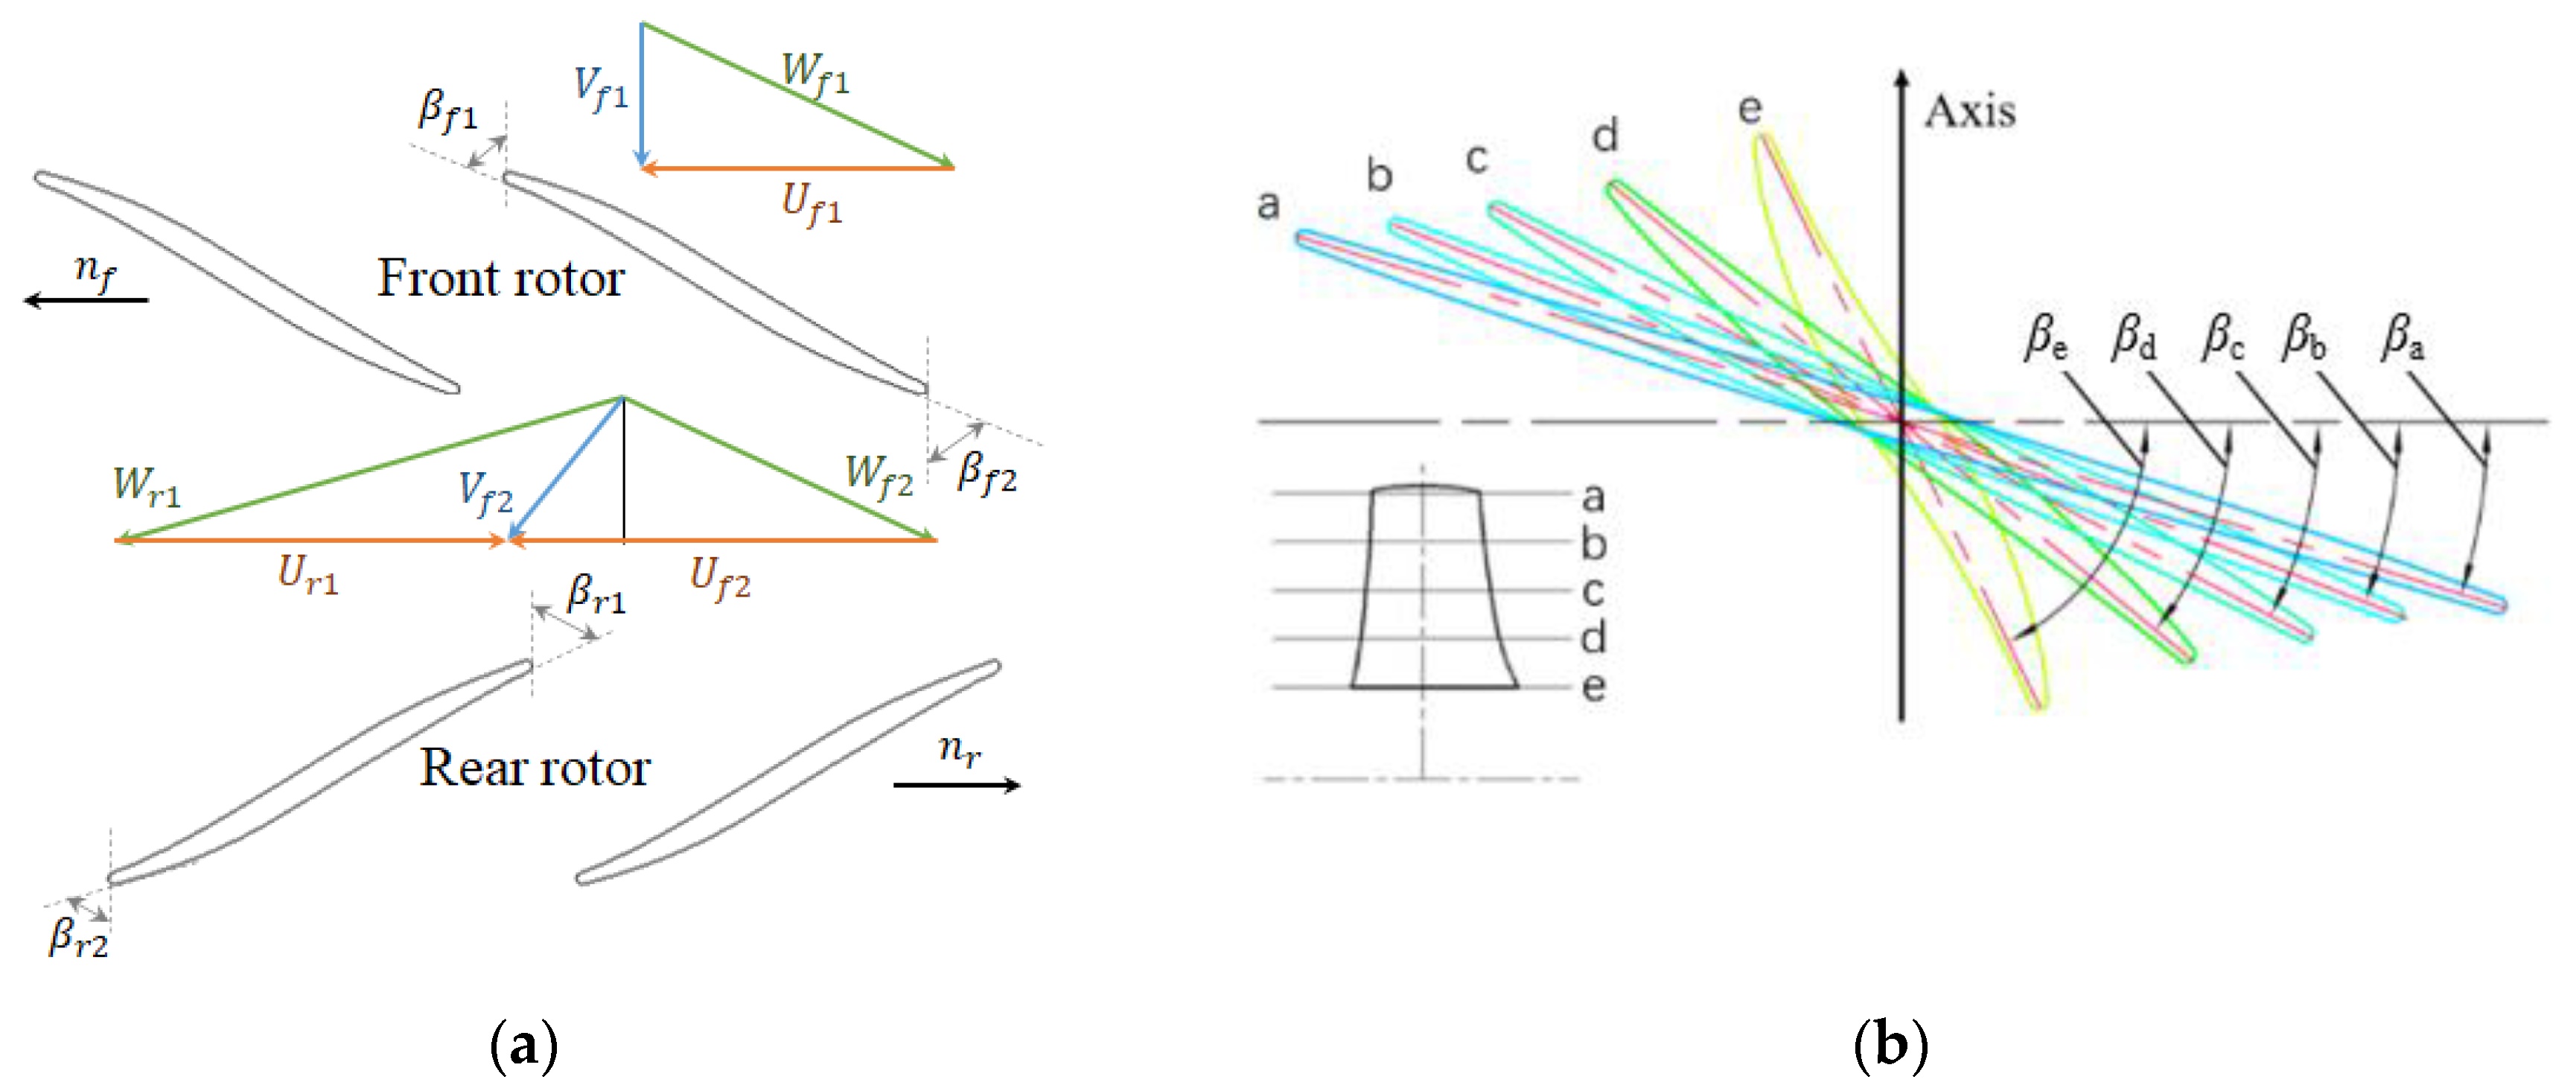
Figure 1. Blade airfoil angles. (a) the velocity triangle; (b) the blade angle on different contour planes [20].
Processes 11 01552 g001
Figure 2. Impeller mold.
Processes 11 01552 g002
Figure 3. Schematic of the experimental setup [20].
Processes 11 01552 g003
Figure 4. Domain of the hydraulic components.
Processes 11 01552 g004
Figure 5. Grid number of the test pump.
Processes 11 01552 g005
Figure 6. Calculation grids. (a) Assembly grids; (b) The detail grid of impeller and diffuser.
Processes 11 01552 g006aProcesses 11 01552 g006b
Figure 7. Performance curves in pump mode [20].
Processes 11 01552 g007
Figure 8. Performance curves of different blade inlet angles. (a) The Q-η curve of different blade inlet angles; (b) the Q-H curve of different blade inlet angles.
Processes 11 01552 g008
Figure 9. Performance curves of different blade outlet angles. (a) The Q-η curve of different blade outlet angles; (b) the Q-H curve of different blade outlet angles.
Processes 11 01552 g009
Figure 10. Performance curves of front impeller for different blade inlet angles. (a) The Q-η curve of front impeller for different blade inlet angles; (b) The Q-H curve of front impeller for different blade inlet angles.
Processes 11 01552 g010
Figure 11. Performance curves of rear impeller for different blade inlet angles. (a) The Q-η curve of rear impeller for different blade inlet angles; (b) The Q-H curve of rear impeller for different blade inlet angles.
Processes 11 01552 g011
Figure 12. Performance curves of front impeller for different blade outlet angles. (a) The Q-η curve of front impeller for different blade outlet angles; (b) The Q-H curve of front impeller for different blade outlet angles.
Processes 11 01552 g012
Figure 13. Performance curves of rear impeller for different blade outlet angles. (a) The Q-η curve of rear impeller for different blade outlet angles; (b) The Q-H curve of rear impeller for different blade outlet angles.
Processes 11 01552 g013
Figure 14. Span surface.
Processes 11 01552 g014
Figure 15. Streamline diagram of different schemes on Span 1 of two-way impeller. (a) The Scheme 1; (b) The Scheme 2; (c) The Scheme 3; (d) The Scheme 4; (e) The Scheme 5; (f) The Scheme 6.
Processes 11 01552 g015
Figure 16. Each term of the vorticity equation on Span 1 of two-way impeller. (a) The Scheme 1; (b) The Scheme 2; (c) The Scheme 3; (d) The Scheme 4; (e) The Scheme 5; (f) The Scheme 6.
Processes 11 01552 g016
Figure 17. Each term of the vorticity equation on Span 1 of the front impeller. (a) The distribution of the vorticity on Span 1; (b) The contours of the vortex stretching term on Span 1; (c) The contours of the vortex dilatation term on Span 1.
Processes 11 01552 g017
Figure 18. Each term of the vorticity equation on Span 1 of the rear impeller. (a) The distribution of the vorticity on Span 1; (b) The contours of the vortex stretching term on Span 1; (c) The contours of the vortex dilatation term on Span 1.
Processes 11 01552 g018
Table 1. Schemes of different outlet angles.
Number 123456
Inlet blade anglesβ1a15.5°11°10.5°10°
β1b18.5°14°12°12.5°
β1c22.5°16.5°14°15°
β1d28°21°18°19.5°
β1e37°30°26°28°
Outlet blade anglesβ2a12°12°12.5°12.5°
β2b14.5°13.8°14.5°14.5°
β2c19°17.2°18°18.5°
β2d27.5°23.5°26.5°28.5°
β2e50°43.5°53.5°62.5°
Table 2. Detailed parameters of equipment.
ProjectTypeAccuracy
1Pressure transmitterWT30000.2%
2Electromagnetic flowmeterKEFC±0.5%
3Photoelectric tachometerDT2243C±0.05%
4Three-phase multifunction energy meterBK8E±0.5%
Disclaimer/Publisher’s Note: The statements, opinions and data contained in all publications are solely those of the individual author(s) and contributor(s) and not of MDPI and/or the editor(s). MDPI and/or the editor(s) disclaim responsibility for any injury to people or property resulting from any ideas, methods, instructions or products referred to in the content.