Article

Study on the Internal Flow Characteristics of Long and Short Blade Runners of a 1000 MW Francis Turbine under Different Opening Conditions

1
Baihetan Engineering Construction Department, China Three Gorges Construction Engineering Corporation, Chengdu 610041, China
2
State Key Laboratory of Hydroscience and Engineering, Department of Energy and Power Engineering, Tsinghua University, Beijing 100084, China
3
National Research Center of Pumps, Jiangsu University, Zhenjiang 212013, China
4
S.C.I. Energy, Future Energy Research Institute, Seidengasse 17, 8706 Zurich, Switzerland
*
Author to whom correspondence should be addressed.
Processes 2023, 11(6), 1796; https://doi.org/10.3390/pr11061796
Submission received: 24 April 2023 / Revised: 25 May 2023 / Accepted: 5 June 2023 / Published: 13 June 2023
(This article belongs to the Special Issue State-of-the-Art Energy Conversion and Storage)

Abstract

:
The 1000 MW Francis turbine unit at the Baihetan hydropower station is the maximum capacity unit in the world at present, and it has adopted the runner type with long and short blades. For this ultra-high output Francis turbine, especially with the breakthrough runner structure, the hydraulic excitation phenomenon caused by internal dynamic and static interference is the key factor for the stability of the unit. In this study, the 1000 MW Francis turbine unit is taken as the research object, and the rated output conditions with different guide vane openings are selected for comparative analysis. The flow field structure and the pressure pulsation characteristics inside the guide vane and runner under different openings are obtained. The distribution characteristics and evolution law of the vortex in the runner under different guide vane openings are analyzed. The results show that the dynamic and static interference between the runner and the guide vane induces the local high-speed flow to appear in the vaneless area, and the larger the guide vane opening, the smaller the dynamic and static interference between the runner and the guide vane; the vortex in the runner mainly develops and evolves from the inlet to the outlet and is mainly distributed near the blade wall surface. The pressure pulsation inside the runner is mainly due to the action of dynamic and static interference. The pressure pulsation induced by the dynamic and static interferences shows a decreasing law from the runner inlet to the runner outlet.

1. Introduction

The 1000 MW Francis turbine unit at the Baihetan hydropower station is the maximum capacity unit in the world at present, and its runner type with long and short blades is adopted on the eight units on the right bank [1]. As the core component of a hydropower station, the Francis turbine is mainly composed of a volute, stationary guide vane, guide vane, runner, and draft tube. Due to the dynamic and static interference between runner rotation and other components, runner blades will produce large dynamic and static loads, and even resonance may occur between components, which makes the unit produce strong vibration. Therefore, the hydraulic excitation phenomenon caused by the dynamic and static interference inside the runner is the key factor for the safe and stable operation of the turbine unit. The appearance of the long and short blade runner of the turbine can improve the hydraulic performance and improve the stability of the unit operation. At the same time, the pressure pulsation in the vaneless zone is effectively reduced [2].
In recent years, domestic and foreign scholars have carried out experimental and numerical studies on the flow characteristics and pressure pulsation characteristics of Francis turbines under many working conditions. Wang et al. [3] found that in some guide vane opening ranges, the pressure gradient inside the runner is not continuous, which will lead to the formation of a blade passage vortex, thereby reducing the efficiency and stability of the unit. Gentner C et al. [4] carried out an unsteady simulation of the whole flow passage of the pump turbine. The results show that the unstable interference between the high pressure of the runner and the guide vane may cause high-frequency pressure pulsation along the circumferential direction of the runner outlet. The sudden increase in local stress causes fatigue damage or even cracks at the junction of the upper crown and the lower ring of the runner. Jacquet et al. [5] simulated the external characteristic parameters, runner inlet velocity distribution, and pressure pulsation characteristics of a medium-specific speed model pump turbine under the constant opening. The results show that the SAS-SST turbulence model can be used to obtain results close to the model test, and it is pointed out that the S characteristic curve is related to the backflow in the vaneless region. Combined with model test and numerical simulation, Zhang et al. [6] studied the pump-turbine under multiple opening conditions and pointed out that the pressure pulsation intensity in the vaneless zone was significantly higher than that in the volute and draft tube monitoring points at the points deviating from the design conditions. Braun et al. [7] studied the unsteady flow in the guide vane of pump turbine under off-design conditions. The results show that the local flow separation is greatly affected by the incident angle between the guide vane direction and the incoming flow direction. Lowys et al. [8] put sensors and strain gauges into the turbine runner blades to detect the pressure, and the results show that the pressure pulsation value of the runner is stronger than that of other working conditions when the turbine is running under the blade passage vortex condition. After the Fast Fourier Transform (FFT), the corresponding frequency is 8–12 times the rotation frequency. Gohil et al. [9] used CFX to analyze the hydraulic performance parameters under different working conditions and studied the calculation results of head and efficiency loss of the Francis turbine under five different working conditions. Kurosawa et al. [10] used the Reynolds stress model and multiphase flow model to study the evolution of vortex in the blade by numerical method. Yang et al. [11] proved that the velocity in the runner can be effectively reduced by lower the rotational speed, but the rotational speed reduction was also limited by the efficiency and velocity near the guide vane. Tang et al. [12] analyzed the vortex characteristics of the inner blade of the runner when the Francis turbine operates under the off-design conditions and revealed the interaction characteristics of the inner blade vortex and energy dissipation by vorticity transport equation and entropy production method.
The above literature mainly studies the ordinary pump turbine, and there are few studies on the turbine with long and short blade runners. Therefore, this study uses a numerical simulation method to study the rated output conditions under three typical openings. The flow structure and the pressure pulsation characteristics in the runner under different openings are obtained, and the pressure pulsation distribution law inside the runner provides some theoretical references for the study of long and short blade runners.

2. Research Object

2.1. Francis Turbine Model and Parameters

The research object is a Francis turbine unit on the right bank of the Baihetan hydropower station, with a rated output of 1000 MW. The runner of the turbine adopts the structure of 15 long blades and 15 short blades; the main parameters are shown in Table 1. According to the design data, the whole flow field water model of the turbine is established. The fluid domain includes five parts: volute, stay vane, guide vane, long and short blade runner, and draft tube. The fluid domain model is shown in Figure 1.

2.2. Balance Equations and Turbulence Model

In this study, the Shear Stress Transport (SST) turbulence model is selected. The model is to process different regions of the flow field by mixing the k-ε model and the k-ω model. In the process of fluid flow, the law of conservation of mass and the law of conservation of momentum are followed, and the control equation is the mathematical description of the conservation law. The control equation is as follows [13].
The continuity equation is:
𝜕 ρ 𝜕 t + 𝜕 ρ u 𝜕 x + 𝜕 ρ v 𝜕 y + 𝜕 ρ w 𝜕 z = 0
where ρ is the density of fluid; t is time; and u, v and w are the velocity components of the velocity vector in x, y, and z directions, respectively.
The momentum equation is:
𝜕 ρ u 𝜕 t + div ρ u u = 𝜕 p 𝜕 x + 𝜕 τ x x 𝜕 x + 𝜕 τ y x 𝜕 y + 𝜕 τ z x 𝜕 z + F x
𝜕 ρ v 𝜕 t + div ρ v u = 𝜕 p 𝜕 x + 𝜕 τ x y 𝜕 x + 𝜕 τ y y 𝜕 y + 𝜕 τ z y 𝜕 z + F y
𝜕 ρ w 𝜕 t + div ρ w u = 𝜕 p 𝜕 x + 𝜕 τ x z 𝜕 x + 𝜕 τ y z 𝜕 y + 𝜕 τ z z 𝜕 z + F z
where u is the velocity vector; p is the pressure on the fluid micro-element; τ x x , τ x y , and τ x z are the components of the viscous stress τ of the fluid micro-element in the x, y, and z directions; and F x , F y , and F z are the physical forces on the micro-element, respectively.

2.3. Grid Independence Validation and CFD Setup

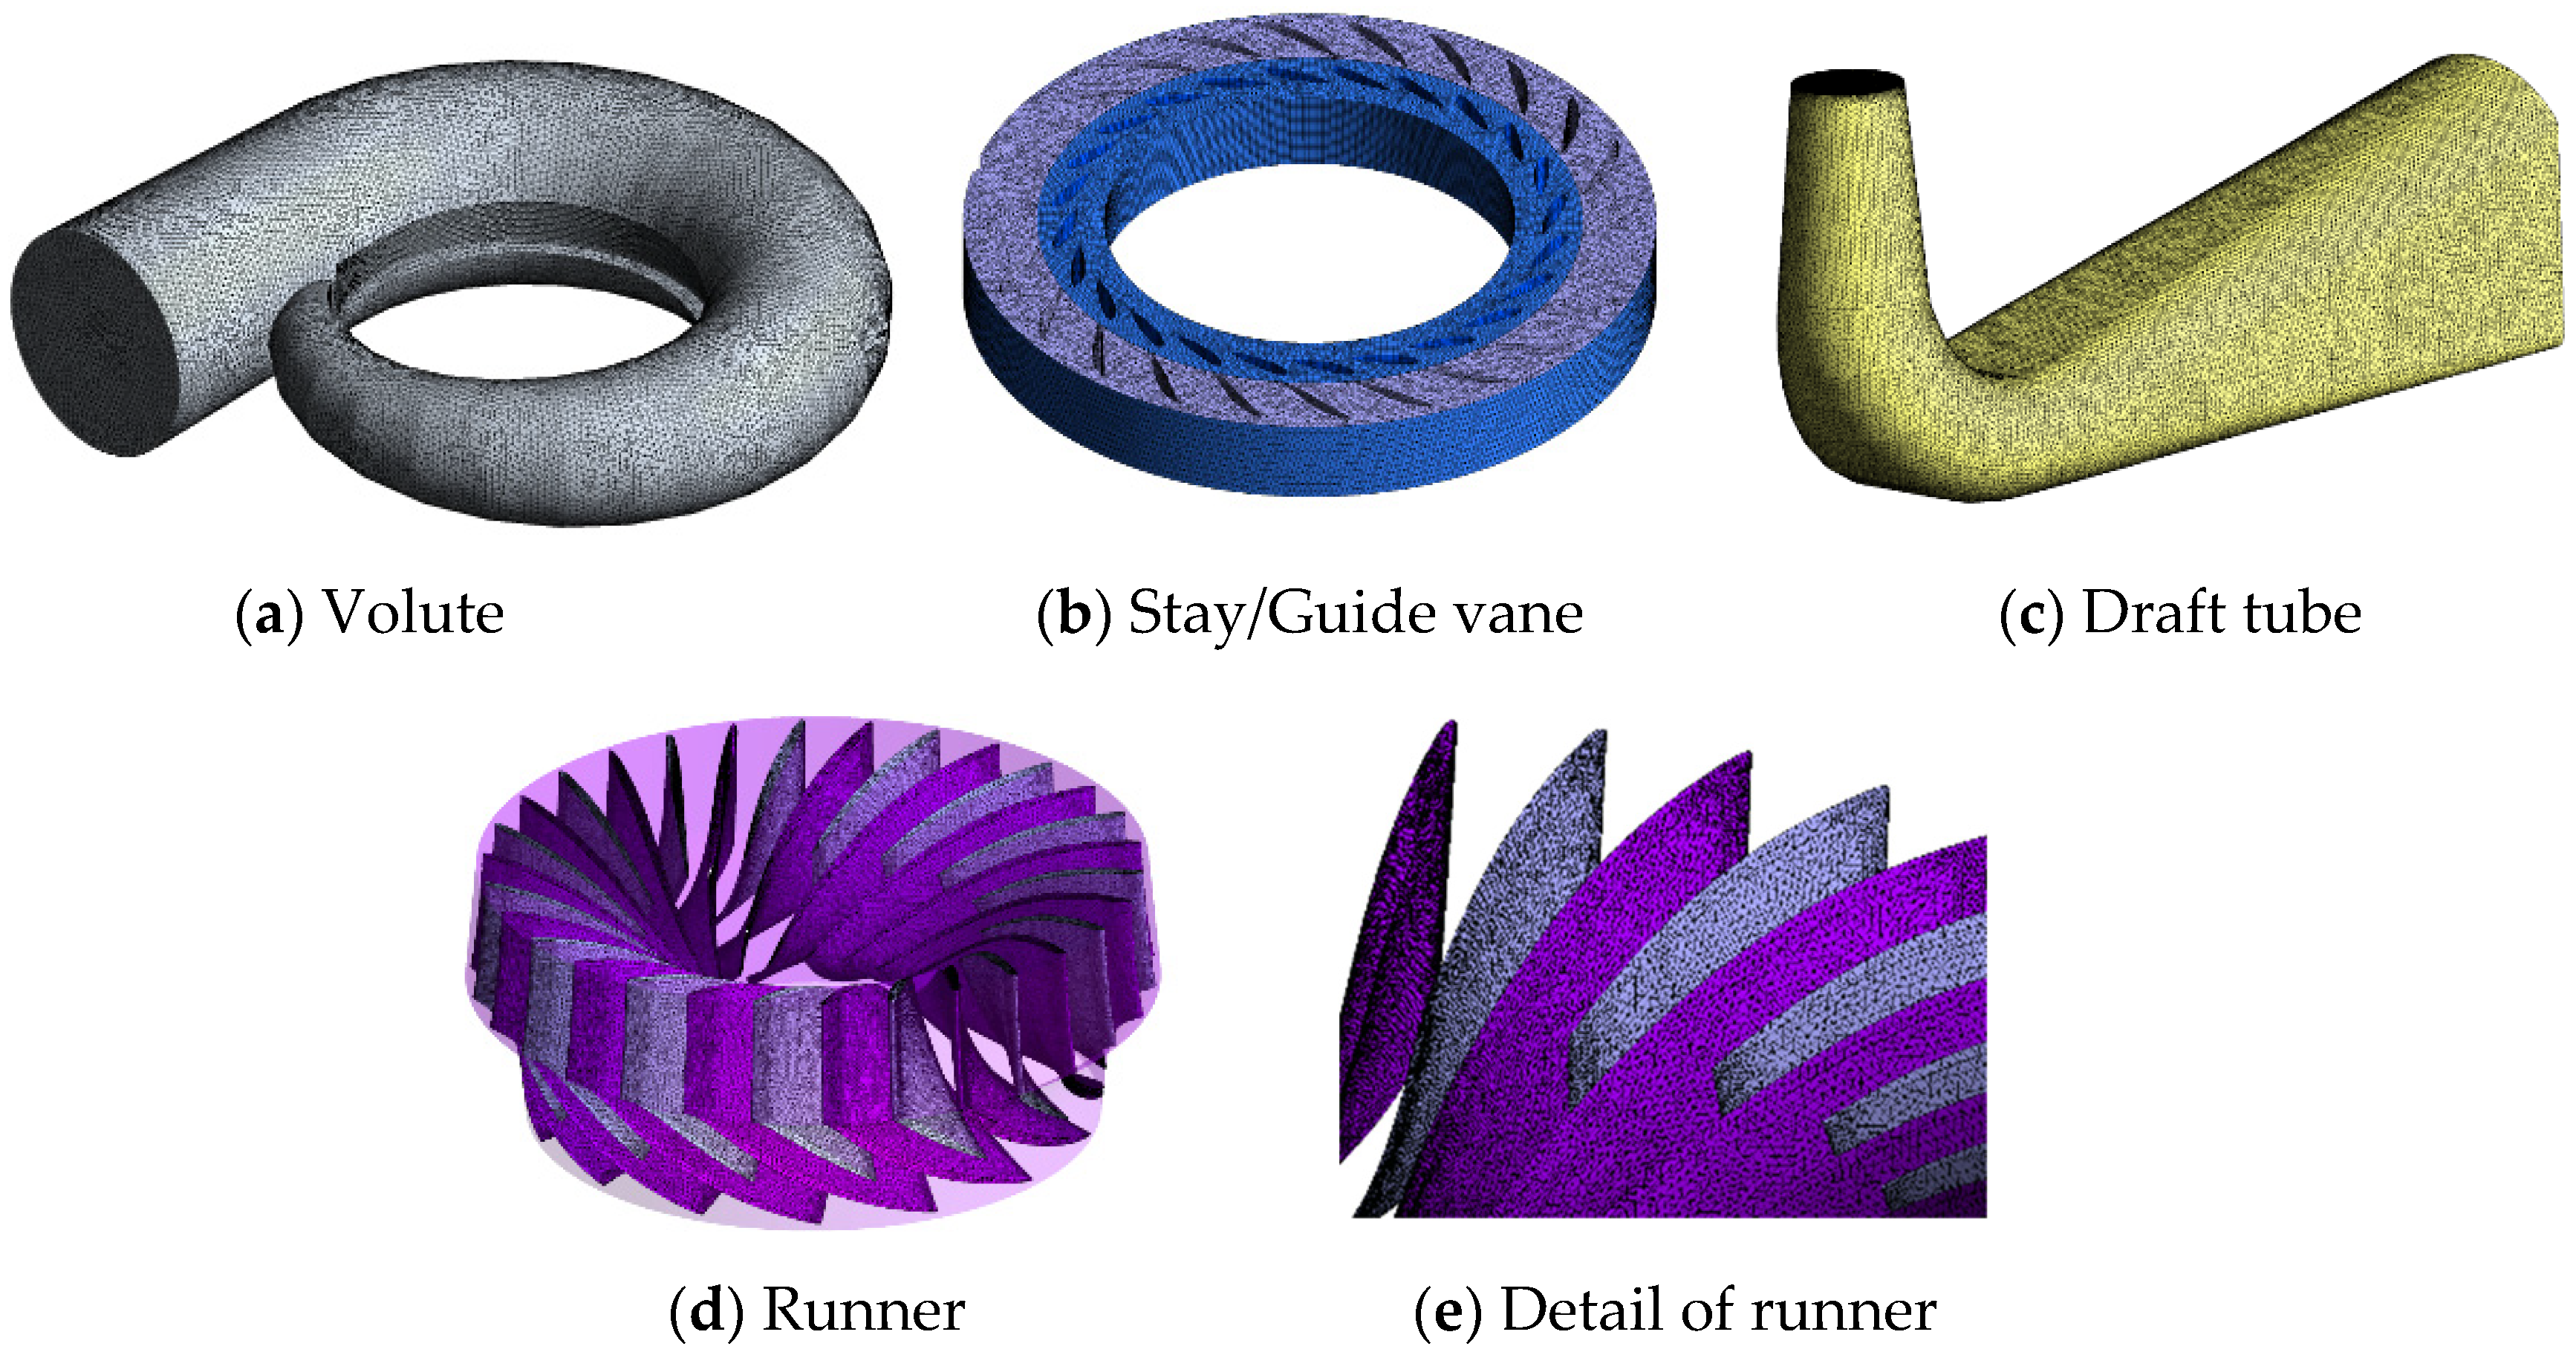
In this study, CFX was used to simulate the flow field in the turbine, and the fluid domain of each component of the turbine was meshed by Meshing. The volute, runner, and draft tube are meshed by tetrahedral grid, and the stay vane and the guide vane are meshed by the hexahedral structured grid. In order to verify the grid independence, five sets of grid schemes were created, with the total number of grids being 7,654,027, 8,163,698, 8,672,402, 9,201,632, and 9,717,968, respectively. It can be seen from Figure 2 that the efficiency tends to smooth out as the number of grids increases, and the third set of grid schemes was selected for simulation considering the computational speed and resources, The number of grids of volute, stay vane, guide vane, runner, and draft tube is 1,279,176, 557,296, 247,968, 5,019,628, and 1,568,334, respectively, and the y plus of the first layer is less than 1. The specific division results are shown in Figure 3.
The settings for CFD are as follows: the Shear-Stress Transport (SST) model is used as the turbulence model for both steady and unsteady calculations, and the reference pressure in the calculation domain is set to 1 atm. The inlet and outlet are pressure boundary conditions, and the wall condition is set to No Slip Wall. The advection scheme is set to High Resolution. The total number of steps to solve is set to 1000, Timescale Control is set to Physical Timescale, and Convergence Criteria is set to RMS. The convergence residual accuracy is set to 10−5. The unsteady calculation takes the steady calculation results as the initial value, selects the time of rotating 2° as a time step with Δt = 0.0031124 s, and the calculation time is selected as eight rotation cycles with t = 4.4817927 s. The dynamic and static interface is set to Transient Rotor Stator.
In order to obtain the pressure pulsation distribution of the runner, monitoring points are set along the long and short blades from the inlet to the outlet of the runner. The monitoring points on the long blade pressure surface from the inlet to the outlet are RN01~RN05, and the monitoring points on the short blade pressure surface are RN06~RN10. The monitoring points on the long blade suction surface are RN11~RN15, and the monitoring points on the short blade suction surface are RN16~RN20. The distribution of the monitoring points is shown in Figure 4.

2.4. Condition Selection and Experimental Verification

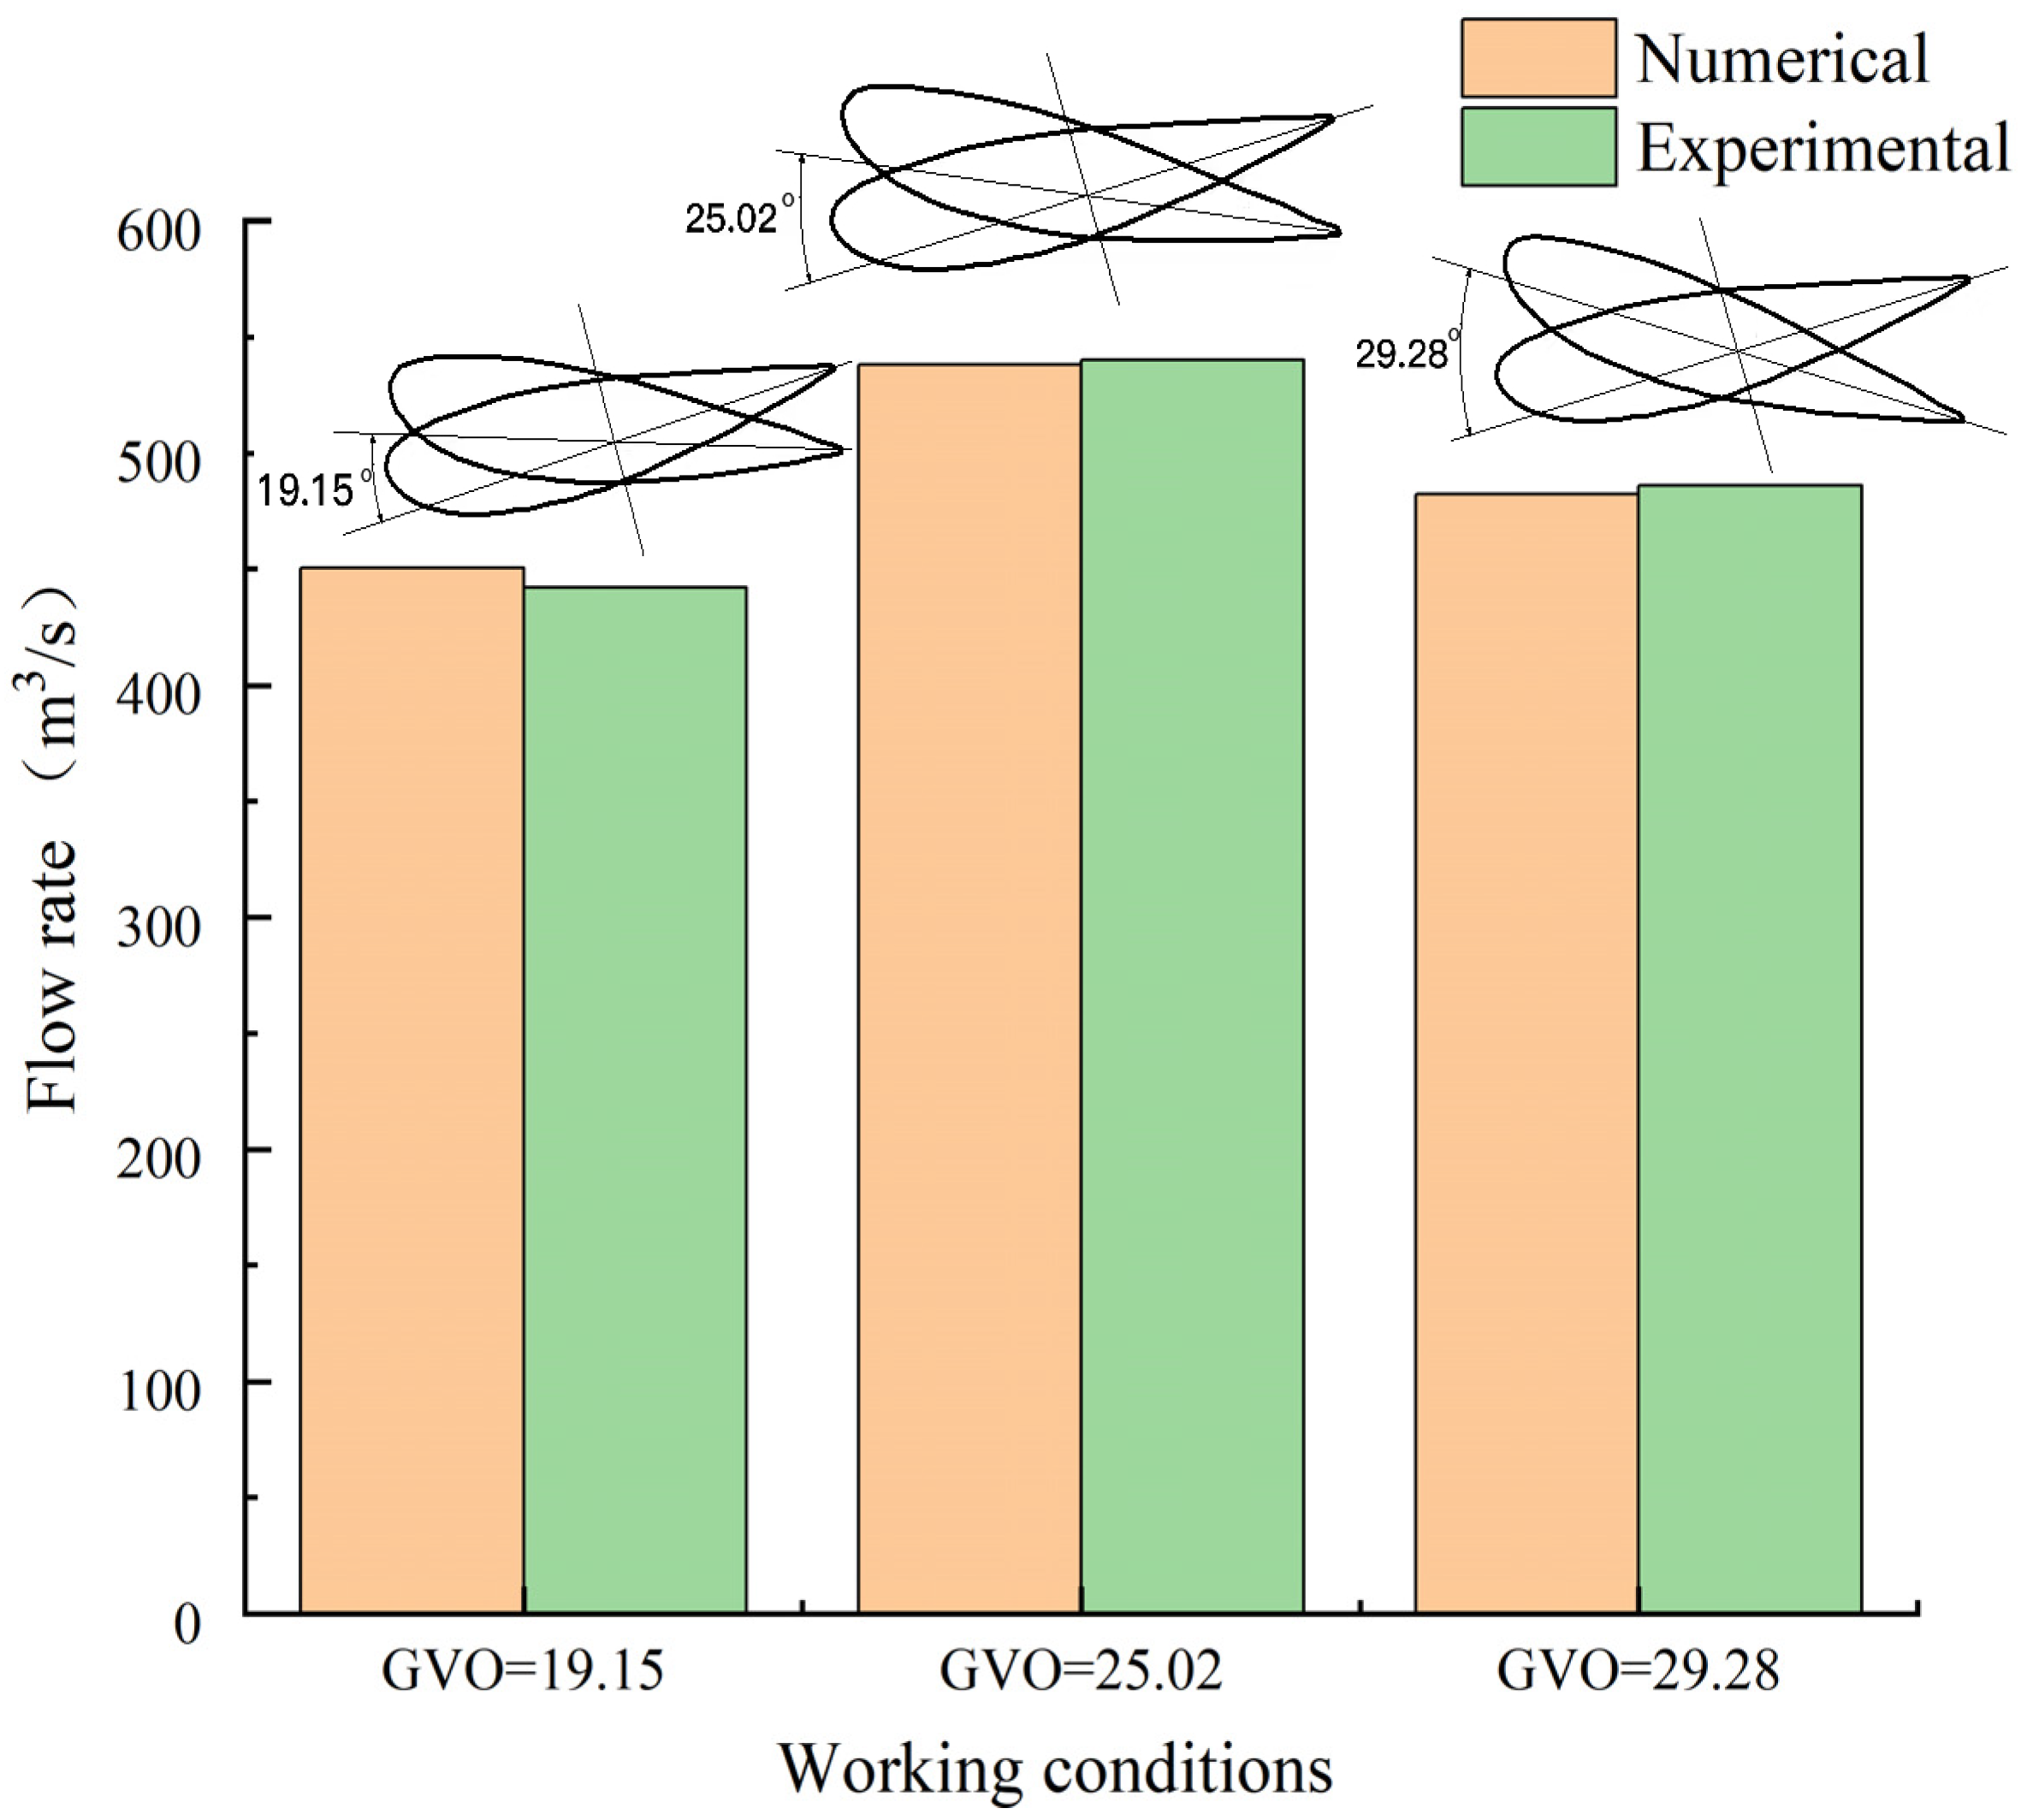
In order to study the influence of different openings of the guide vane on the internal flow characteristics of the runner, the openings under three rated output conditions were selected, namely, the opening corresponding to the maximum head GVO = 19.15, the rated opening GVO = 25.02, and the maximum opening GVO = 29.28. The efficiency of the turbine corresponding with three different openings is 92.89%, 95.23%, and 90.95%, respectively. The comparison of real machine and simulated data is shown in Figure 5, and the simulation error is less than 2%.

3. Results and Analysis

3.1. Internal Flow Analysis of the Runner at Different Opening Conditions

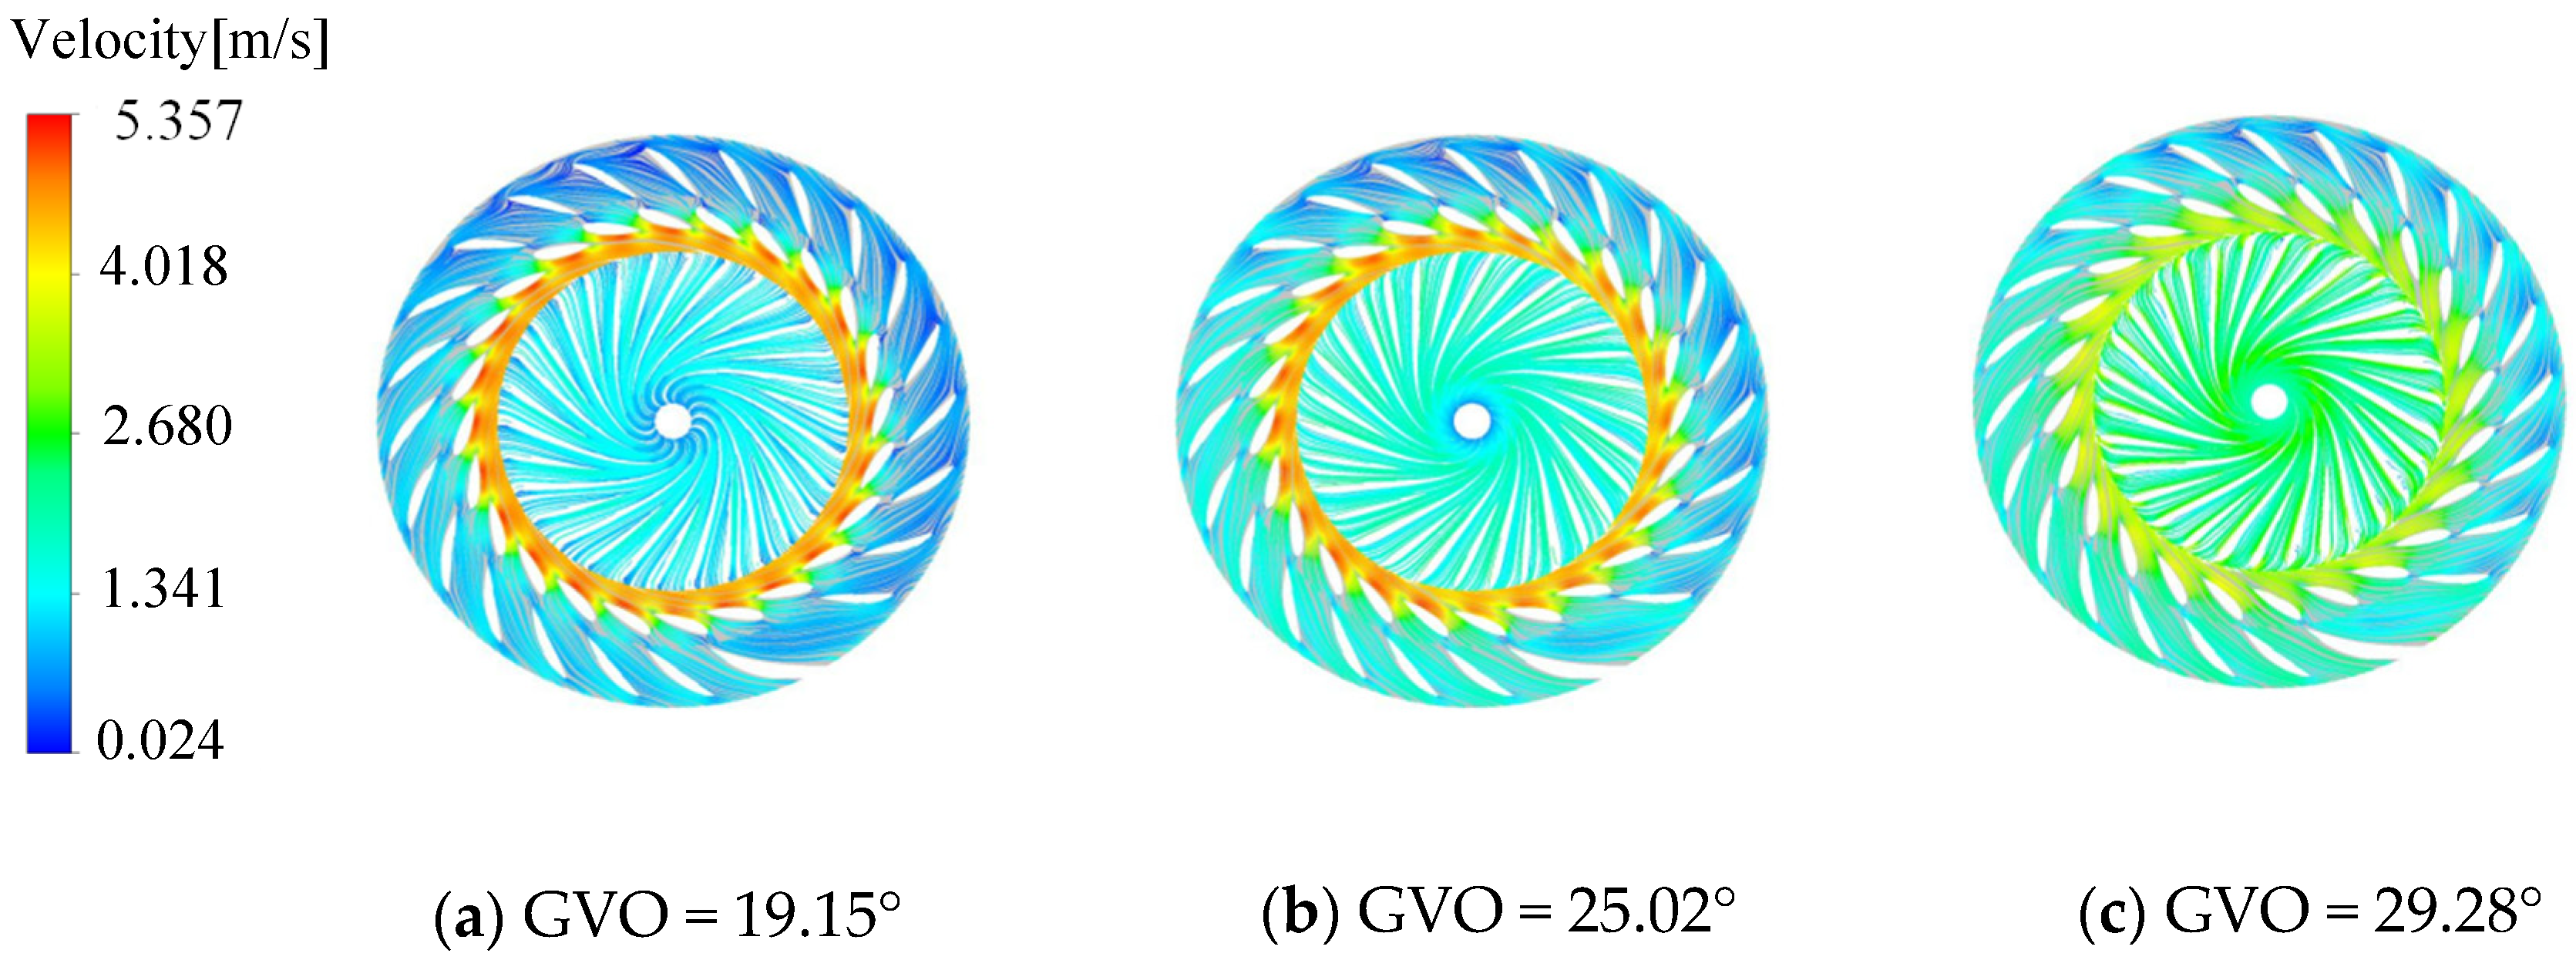
The stay vane and the guide vane perform the role of diversion and adjustment to ensure that the incoming flow entering the runner has a suitable circulation. In order to analyze the internal flow regime of the runner, Figure 6 gives the streamlined distribution of the stay vane, the guide vane, and the runner. Under the three opening conditions, the internal streamline of the runner is relatively uniform, and there is no common vortex flow at the inlet of the blade. It can be seen that the long and short blades can adjust the inflow of the runner inlet, thereby reducing the flow loss inside the runner. With the increase in guide vane opening, the streamlined velocity in the guide vane channel and the runner shows the law of overall increase. Due to the dynamic and static interference between the runner and the fixed parts, the local high-speed flow is mainly concentrated in the vaneless area. In addition, the smaller the guide vane opening, the more obvious the effect of dynamic and static interference.
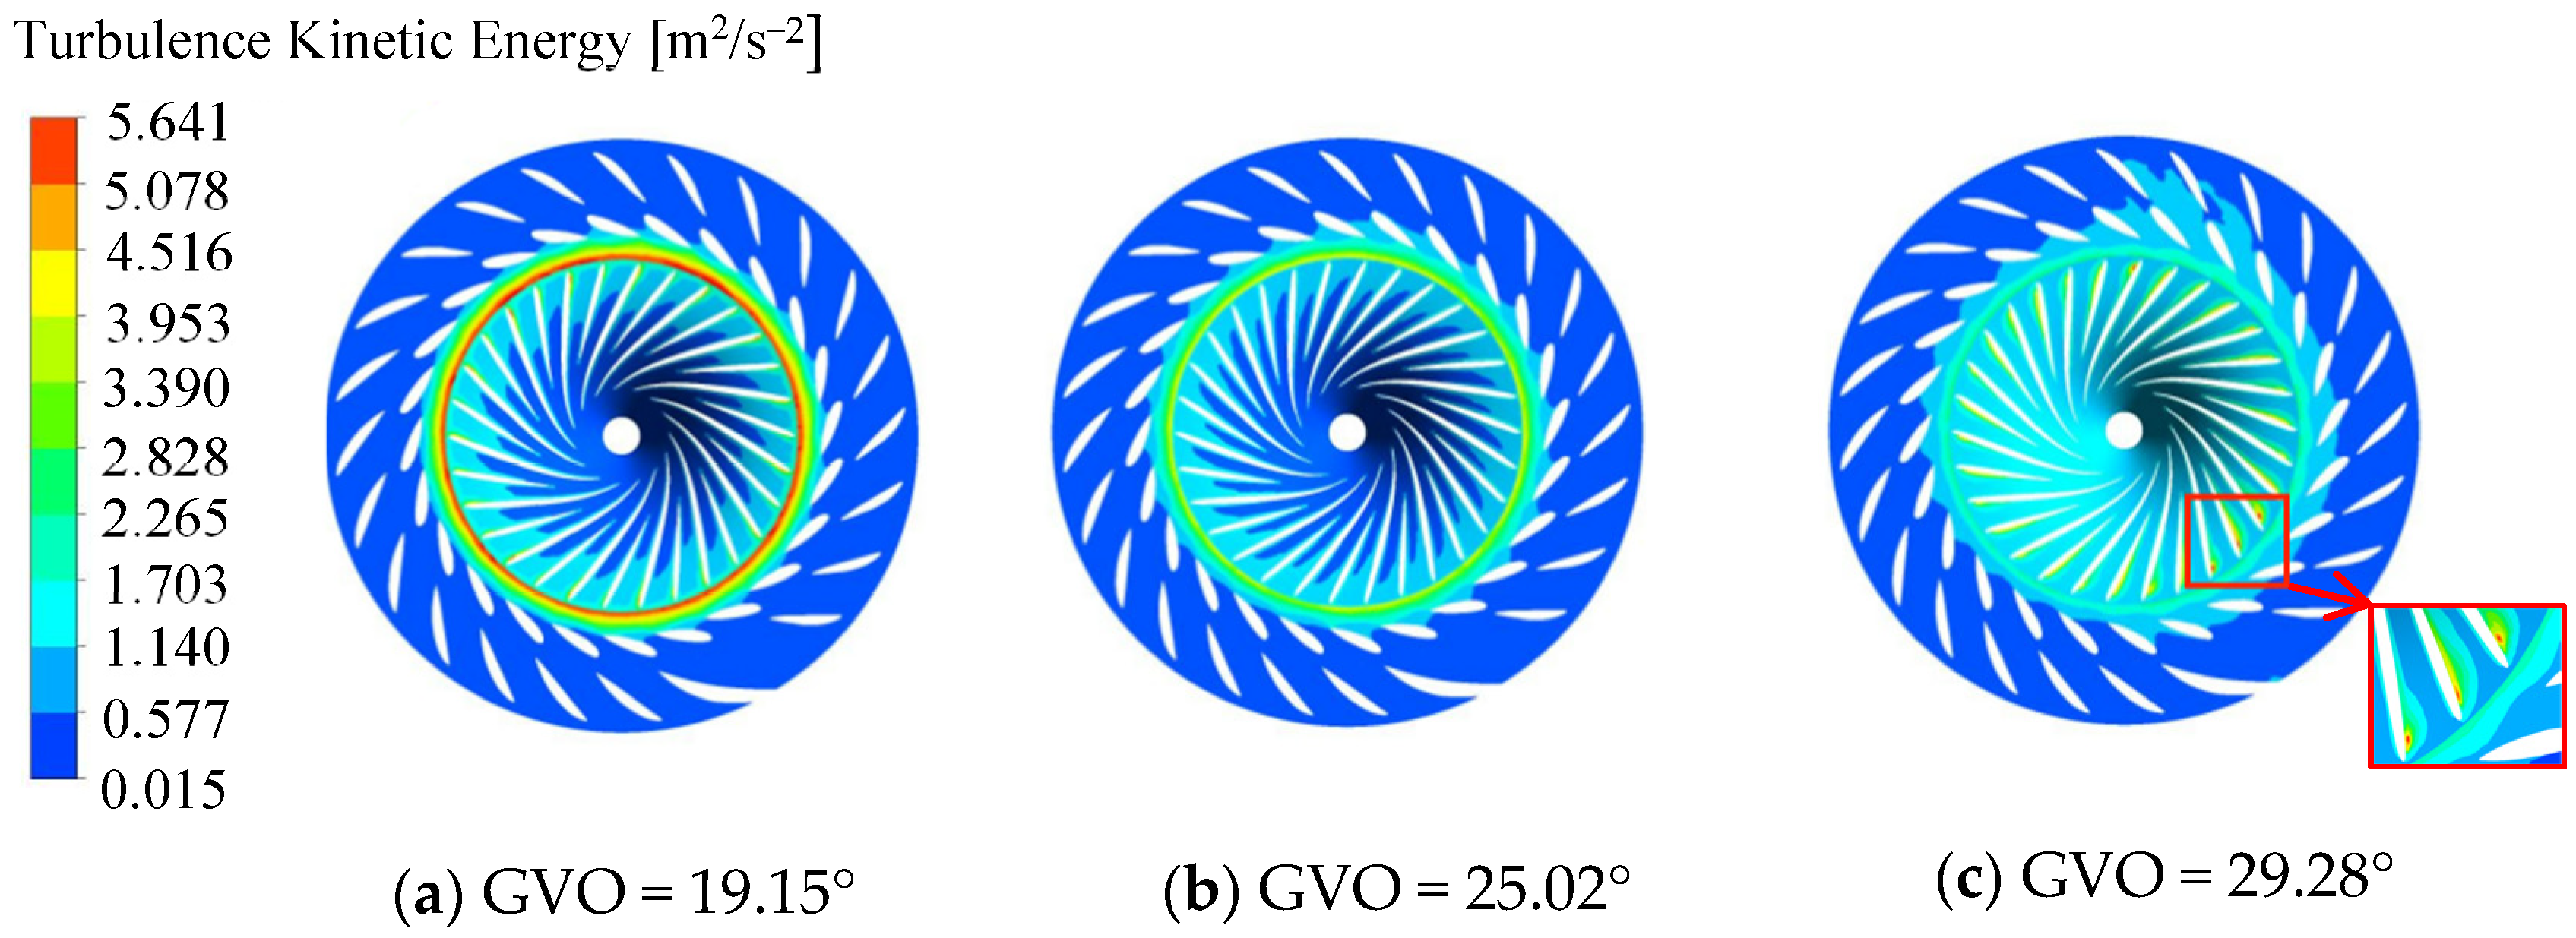
Turbulent kinetic energy (TKE) can more intuitively reflect the stability of the flow of the runner. Figure 7 shows the TKE distribution in the guide vane channel and the runner. It can be seen from the figure that the larger TKE is mainly concentrated in the high-speed flow [14,15]. Under the condition of a 19.15° opening, due to the influence of dynamic and static interference, the larger turbulent kinetic energy appears in the vaneless area and the connection of the guide vane channel and the runner channel, where the hydraulic loss is larger. Under the condition of 25.02° opening, the TKE is small as a whole, and there is no obvious phenomenon of TKE concentration. It can be seen that the flow under this condition is relatively stable, and the hydraulic loss is small. Under the condition of 29.28° opening degree, compared with the other two conditions, the TKE of the vaneless area and the connection between the guide vane flow channel and the runner flow channel is smaller. In addition, due to the instability of the internal flow of the runner, there is a local high TKE at the inlet near the pressure surface of the runner blade. The inlet flow of the runner has a slight flow separation near the pressure surface of the blade, resulting in a local trace hydraulic loss. Through the above analysis, when the opening of the guide vane is 25.02°, the internal flow of the runner is the most stable and the hydraulic loss is the smallest.
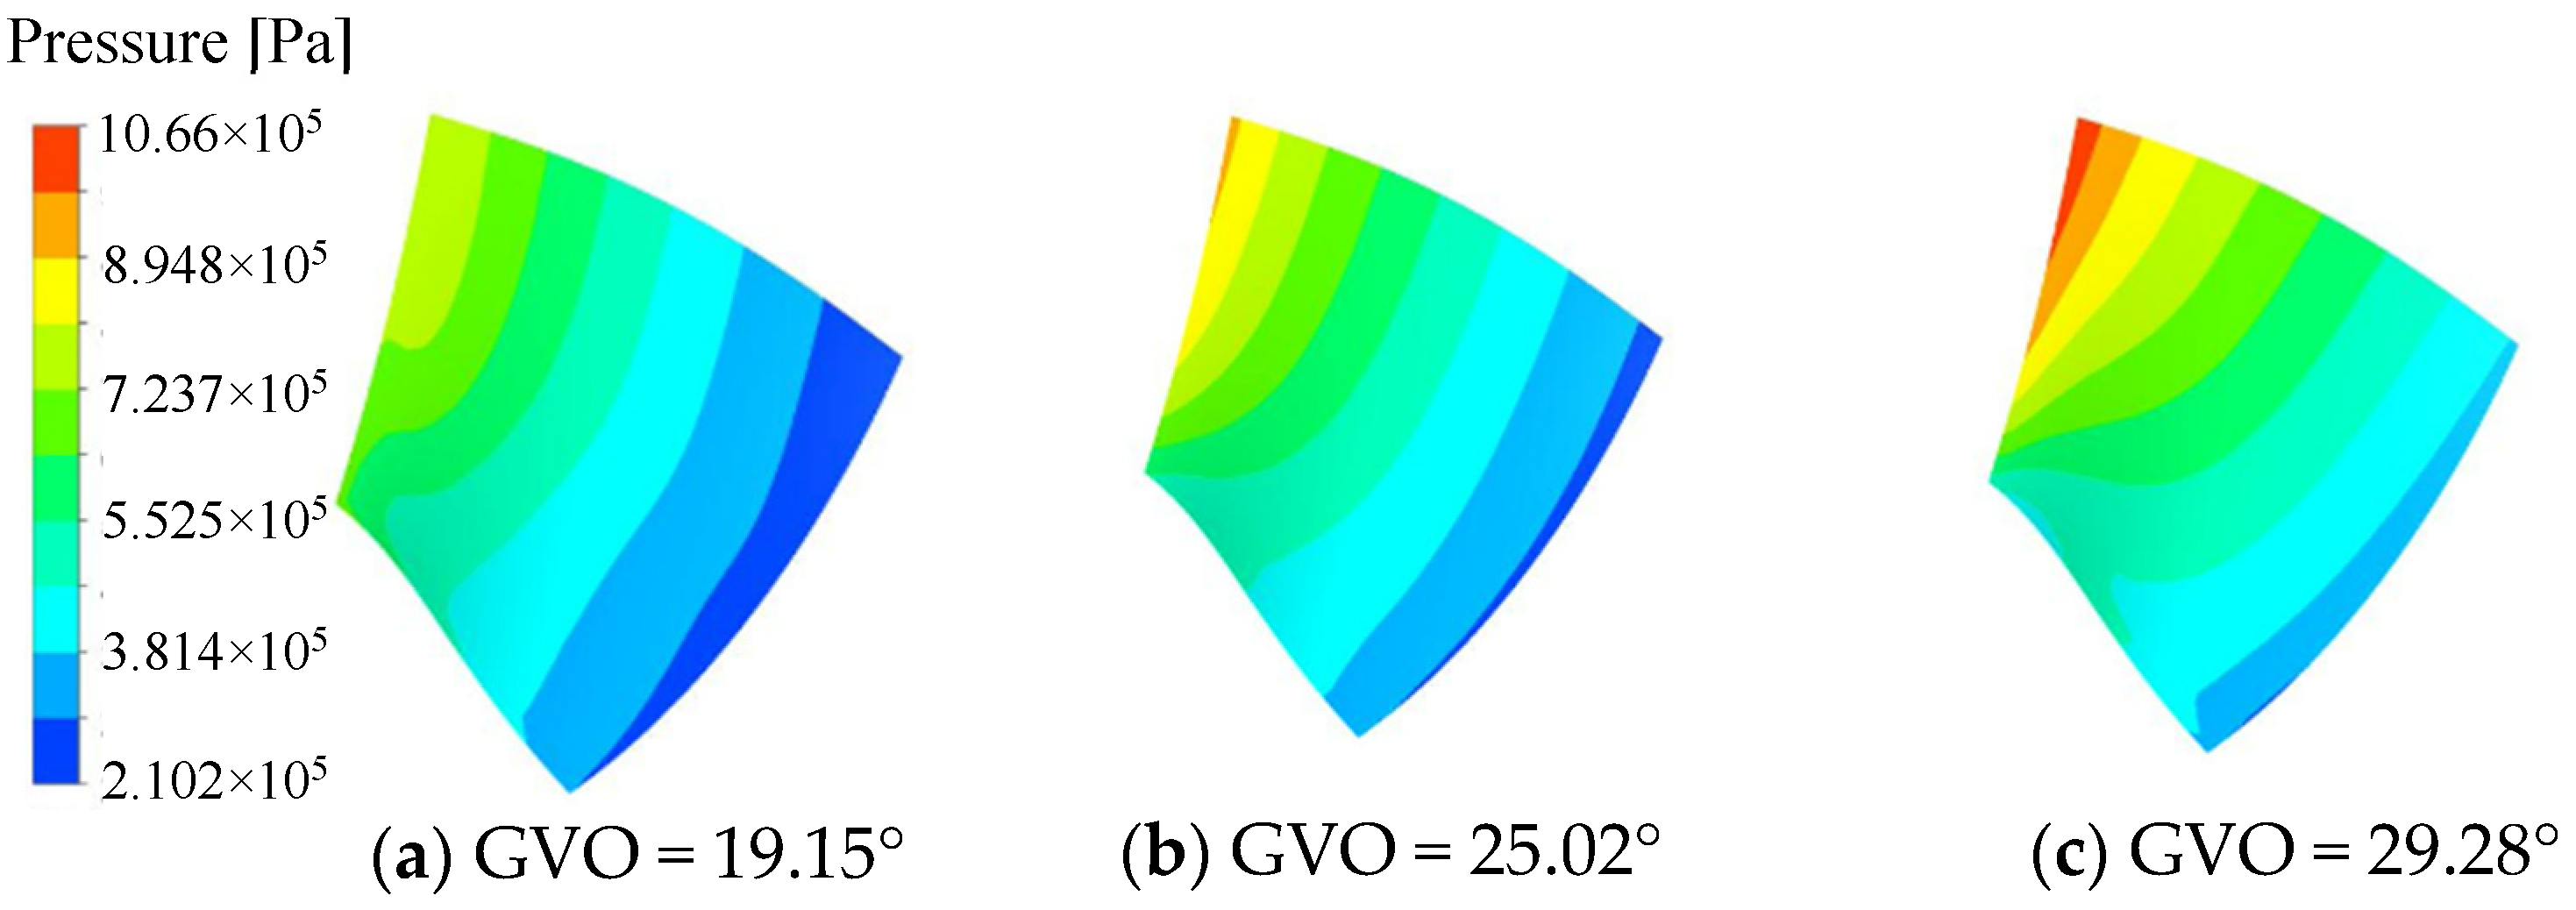
The pressure distribution of the pressure surface and the suction surface of the long and short blades of the runner is shown in Figure 8, Figure 9, Figure 10 and Figure 11. Under the three opening conditions, the pressure distribution of the pressure surface and the suction surface of the long and short blades gradually decreases from the inlet to the outlet, and the pressure of the pressure surface is significantly higher than that of the suction surface. With the increase in the guide vane opening, the surface pressure of the runner blade shows an increasing trend. The pressure gradient distribution on the pressure surface is more uniform than that on the suction surface, and the larger the guide vane opening, the more uneven the pressure distribution gradient of the blade, which is mainly caused by the instability of the internal flow of the runner at large opening.

3.2. Vortex and Velocity Distribution in Runner at Different Opening Conditions

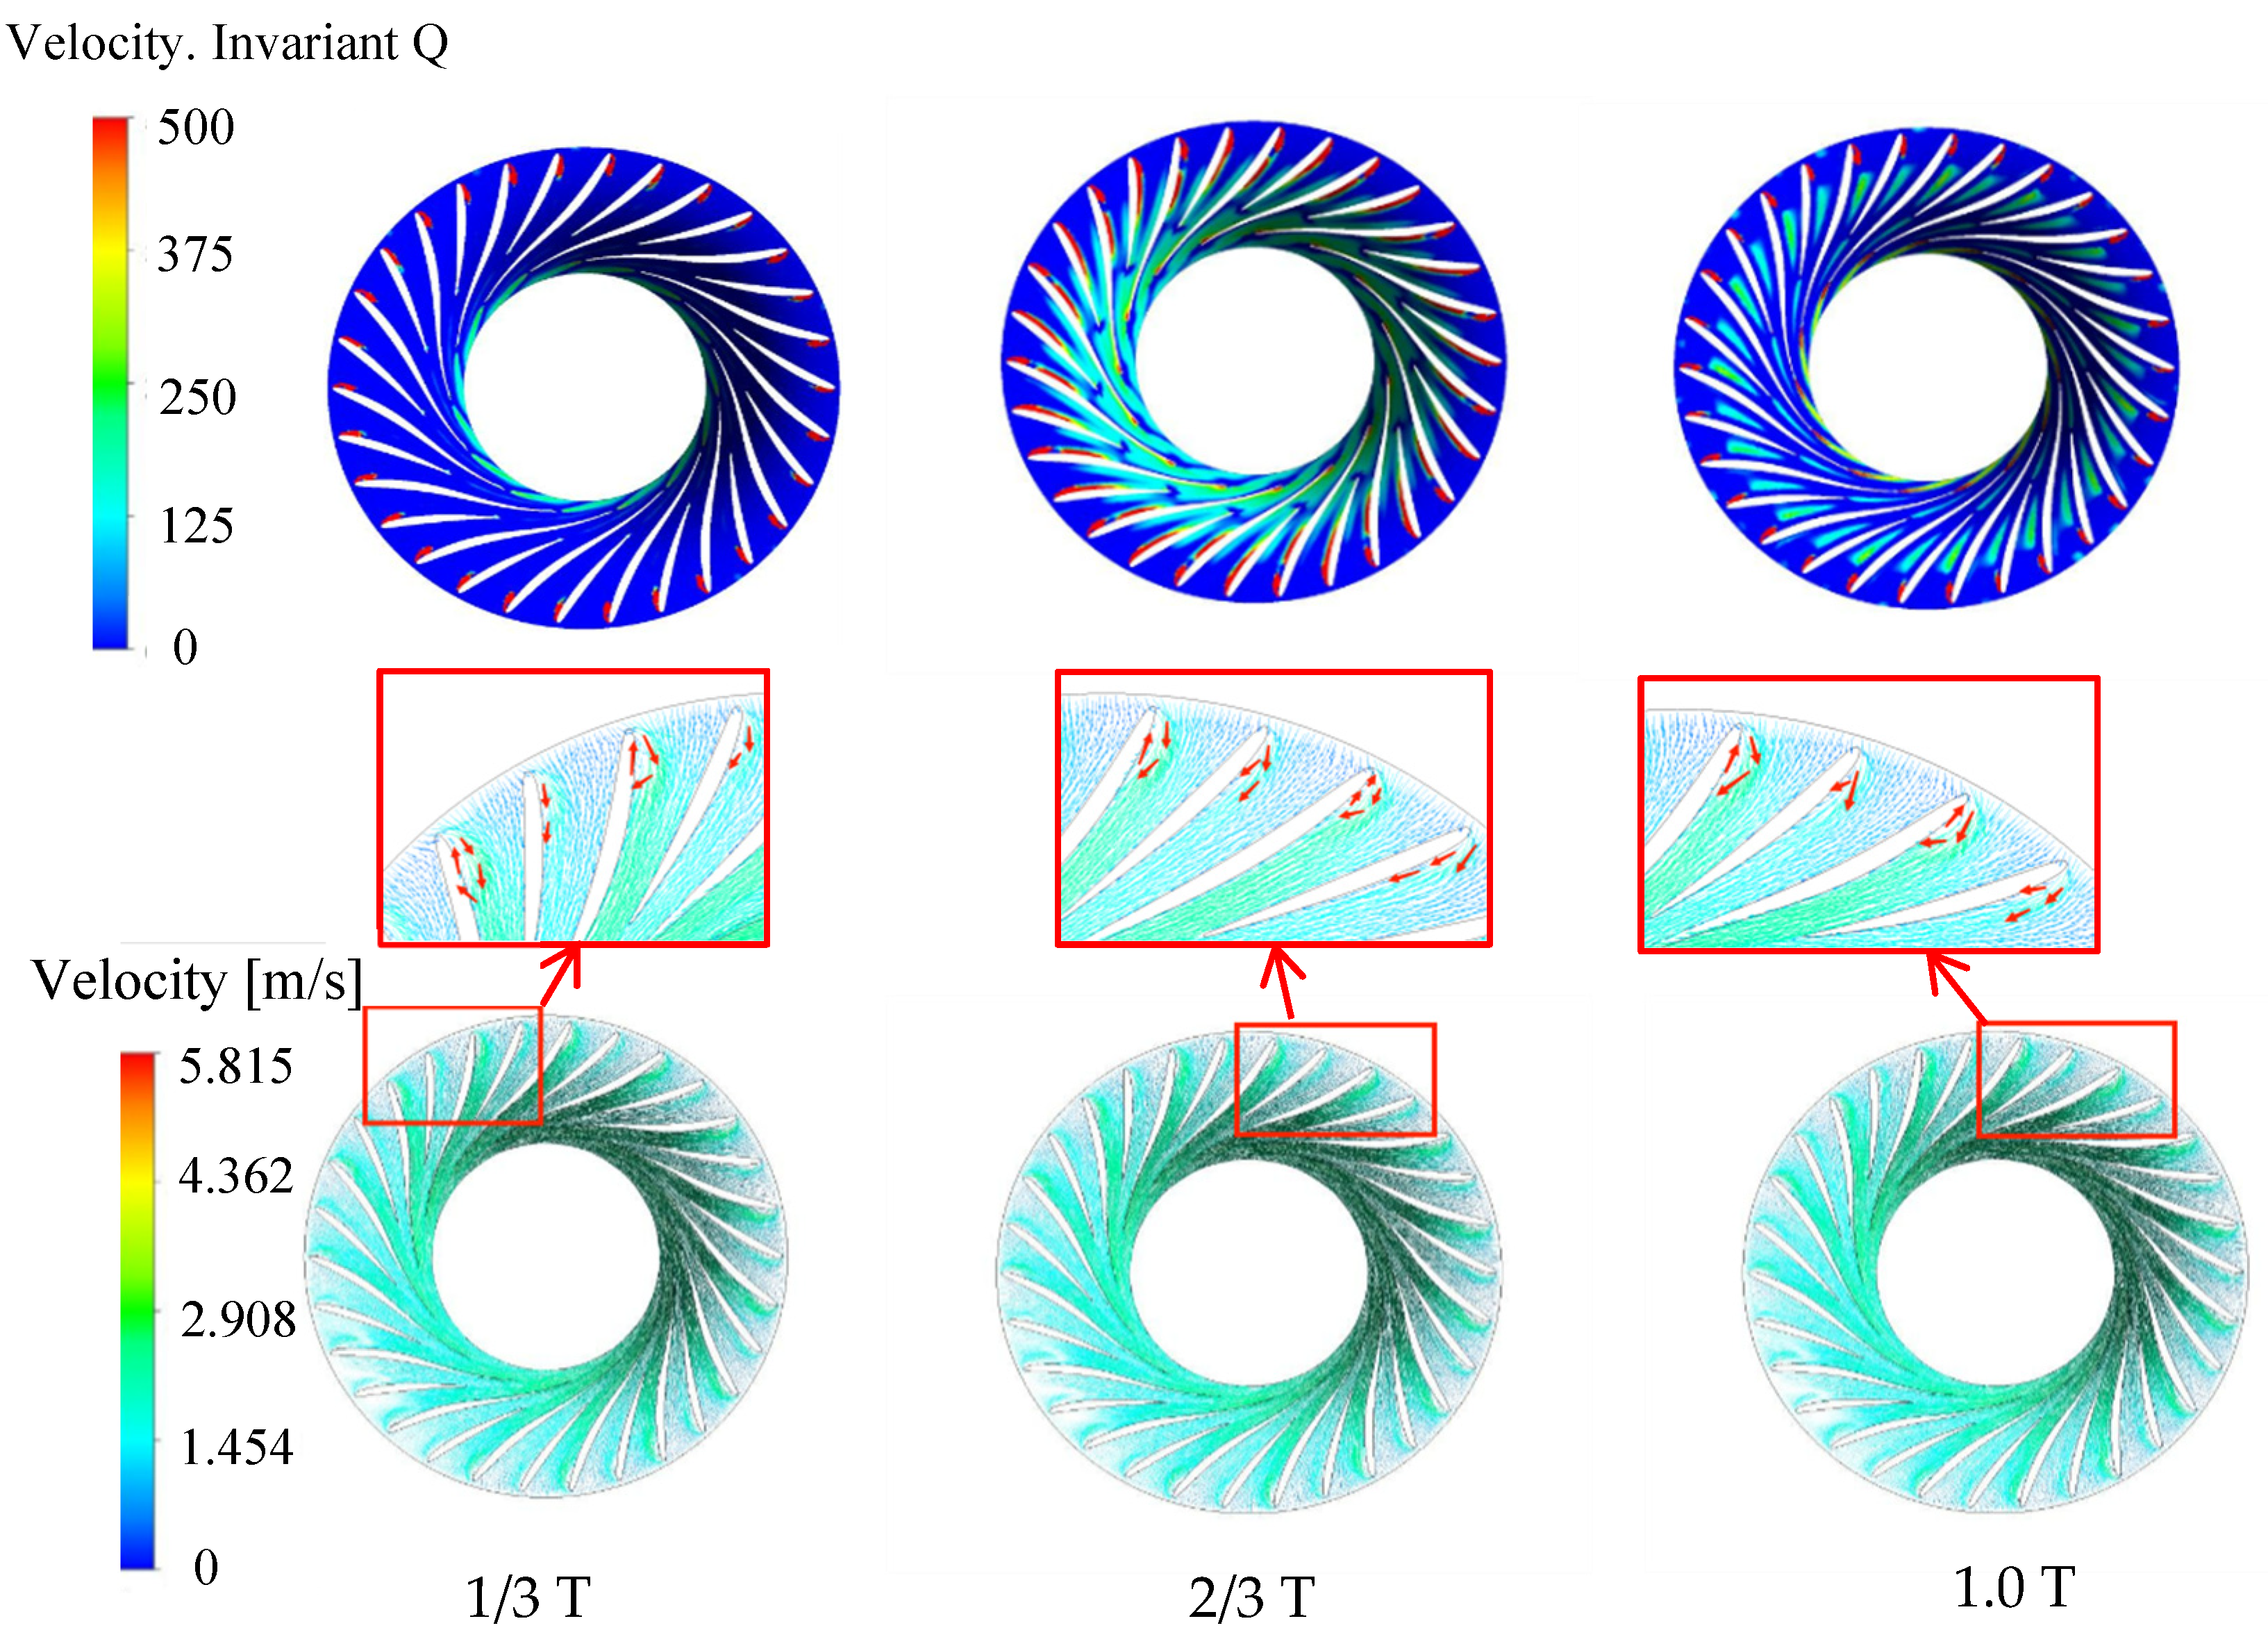
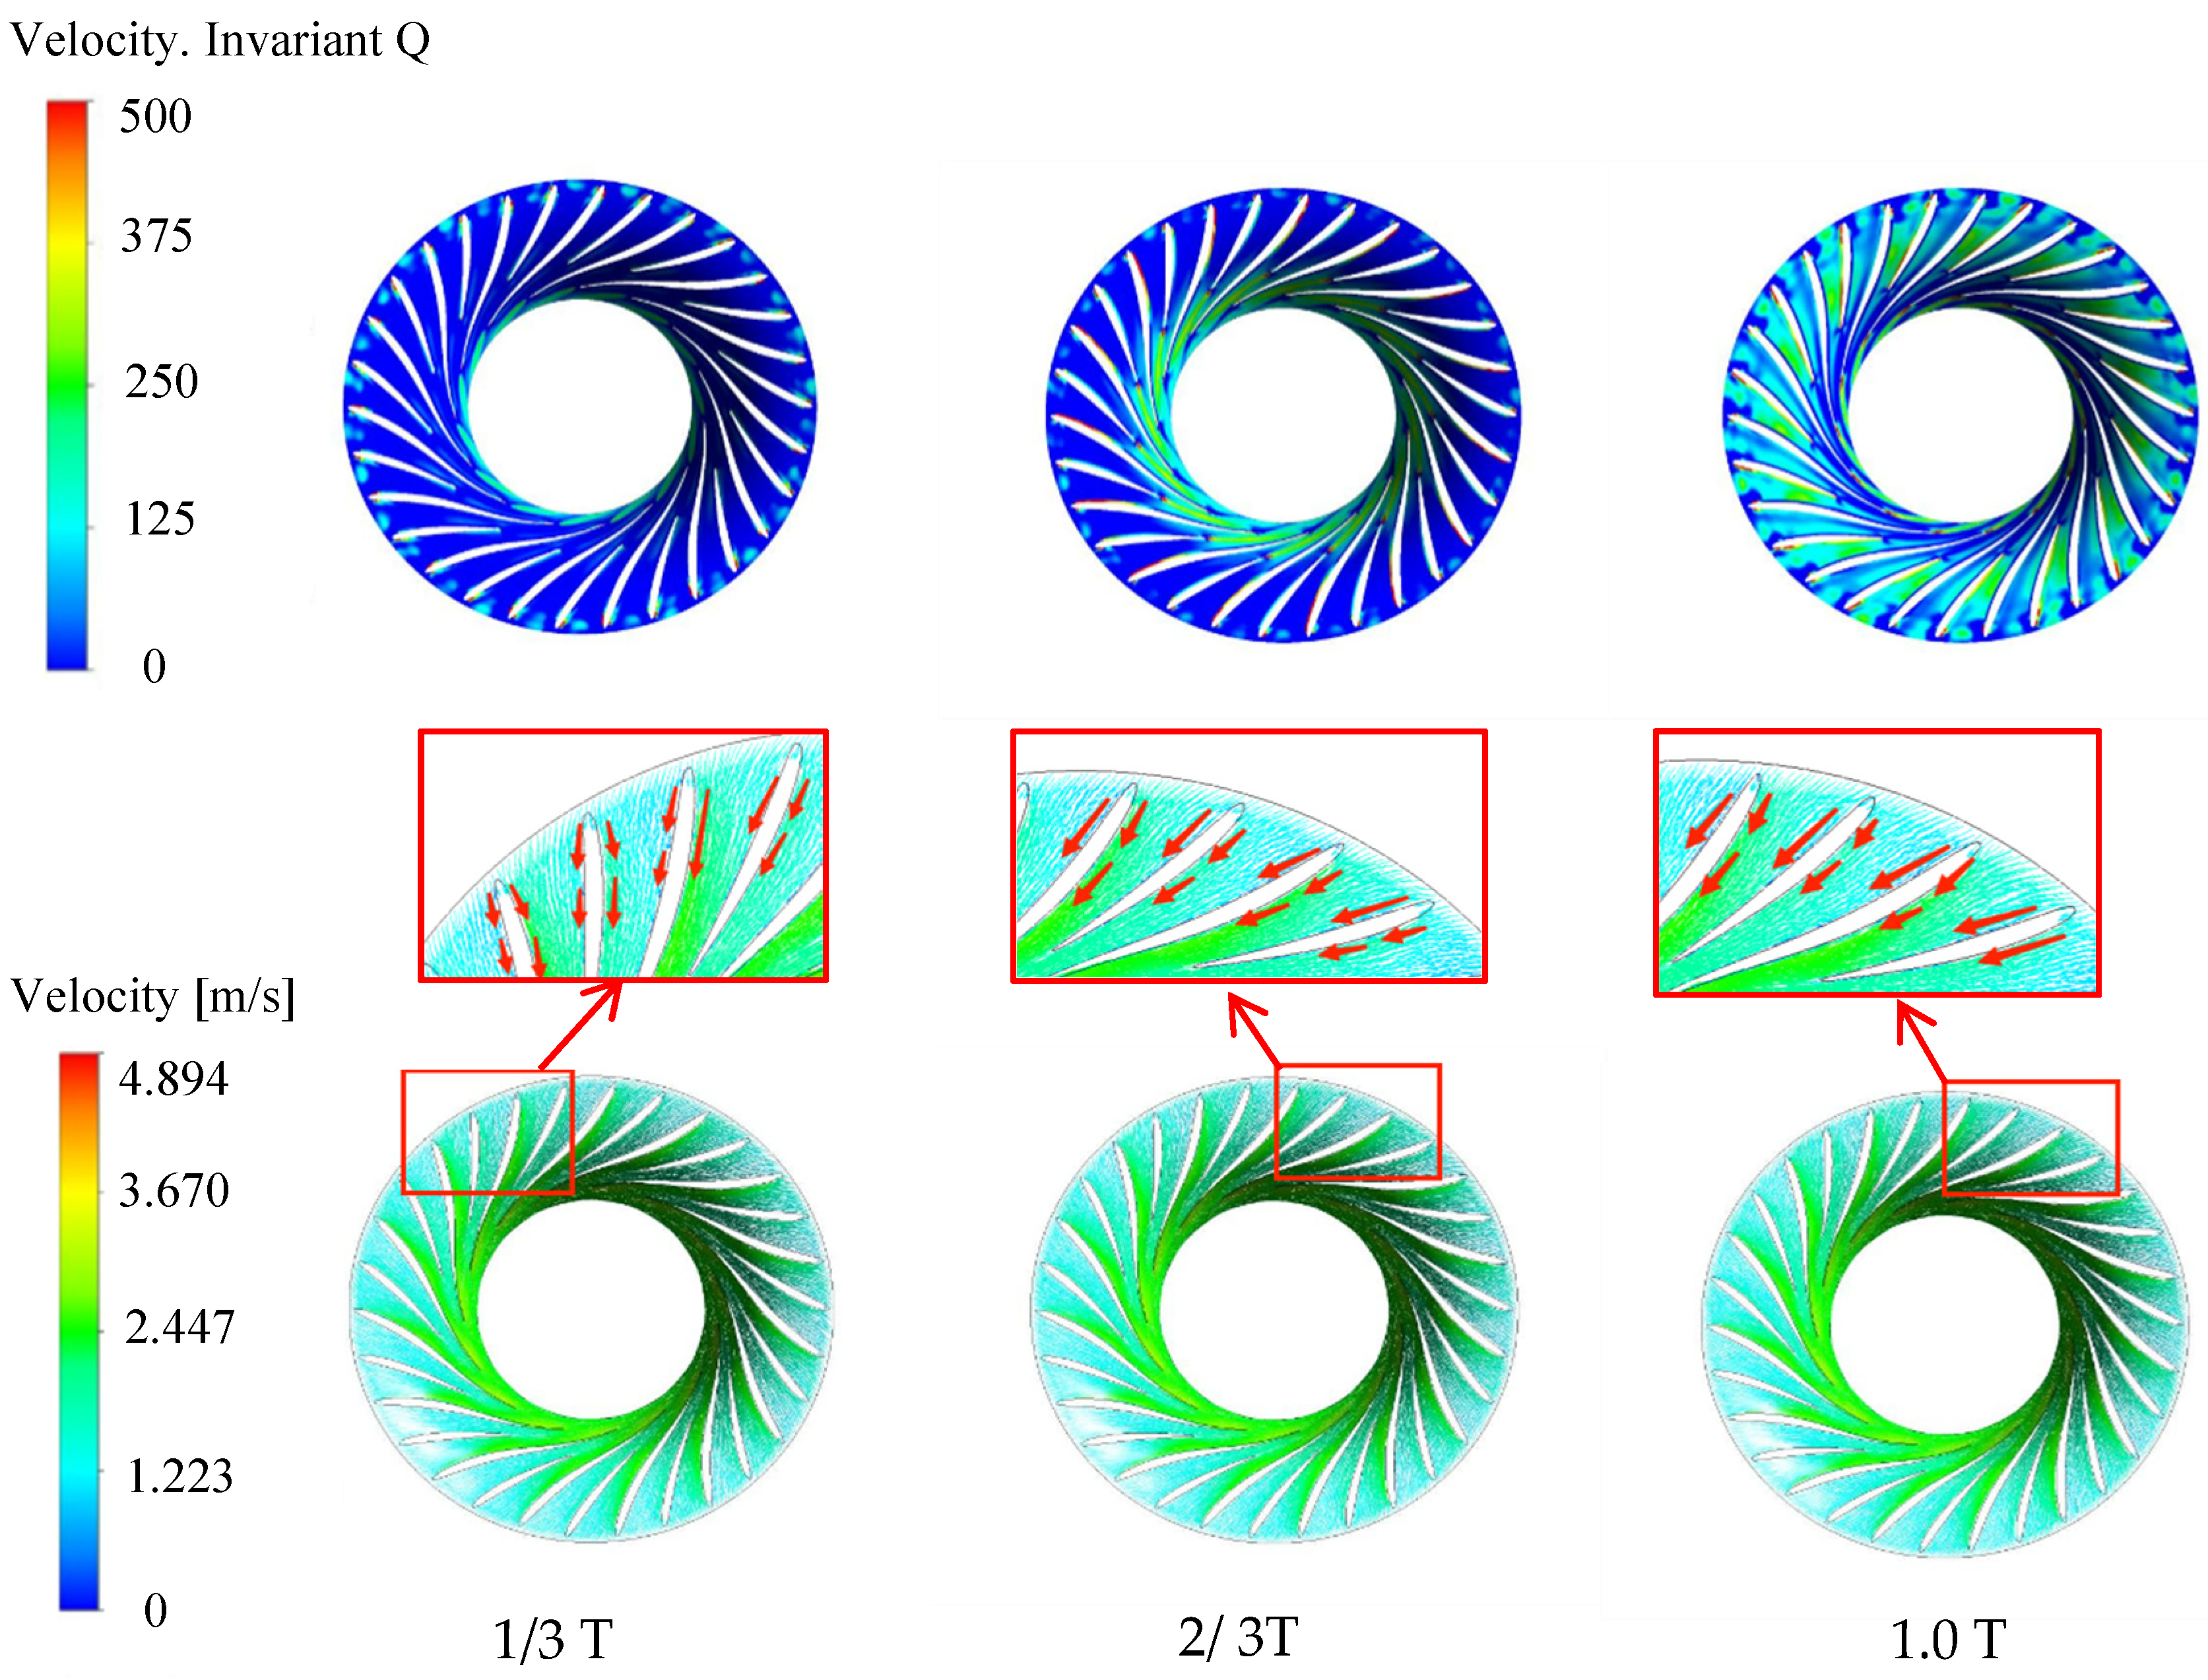
The internal vortex of the runner will have a certain interference effect on the mainstream of the runner, resulting in instability, such as energy dissipation and flow separation. In this study, the Q-criterion is selected to identify the internal vortex of the runner. Q-criterion is used to characterize the streamline of fluid after deflection. Large vorticity often occurs where the Q-criterion is large [16,17]. The vortex and velocity vector distributions are taken at the flow surface of the runner 1/2 blade height. By observing the velocity distribution and vortex distribution of the runner flow channel, the internal flow regime of the runner is qualitatively analyzed, and the distribution and evolution law of the internal vortex of the runner under different opening conditions are obtained.
The rotation of the runner is recorded as one cycle, and the vortex distribution at the 19.15° opening is shown in Figure 12. At 1/3 cycle, the vortex is mainly distributed on the suction surface of the runner blade near the inlet. At 2/3 cycle, the distribution of the vortex extends to most of the range near the suction surface of the blade, and a very small vortex area appears at the trailing edge of the long blade pressure surface. At 1.0 cycle, the vortex in the runner is distributed near the inlet of the blade suction surface, and the vortex area appears from the trailing edge of the long blade to the outlet area. The velocity vector distribution is locally enlarged. In a periodic range, the water flow collides near the inlet of the suction surface of the long blade, resulting in lateral flow or even backflow, thus forming a blade passage vortex, which is obviously corresponding to the vortex distribution. The vortex area mainly develops from the inlet of the blade suction surface to the outlet of the runner. Due to the large attack angle of the blade inlet under this opening, the runner inflow and the blade suction surface are obviously impacted near the inlet, so the vortex area always exists here.
The vortex distribution under the condition of a 25.02° opening is shown in Figure 13. There is almost no vortex inside the runner at 1/3 cycle, and only a small vorticity area appears at the trailing edge of the long blade and extends along the blade direction to the runner outlet. When the cycle is 2/3, the vortex mainly appears near the suction surface of the long blade, and the small vorticity area appears at the trailing edge of the short blade and extends to the runner outlet. In addition, there is a local large-scale vortex at the trailing edge of the short blade. At 1.0 cycle, the runner is filled with small-scale vortices, and local large-scale vortices appear near the pressure surface of the short blade. It can be seen that the inner vortex of the runner mainly develops from the trailing edge of the long blade to the whole runner. By amplifying the velocity vector figure locally, it is found that there is no unstable flow, such as vortex and backflow. It can be seen that the internal flow pattern of the runner under this opening condition is stable, the vortex scale is not large, and the hydraulic loss is small. Therefore, the efficiency of this condition is relatively high.
The vortex distribution under the 29.28° opening condition is shown in Figure 14. At 1/3 cycle, the vortex is mainly distributed near the blade pressure surface, and there are also vortices between some long and short blade channels. At 2/3 cycle, the vortex between the long and short blade channels increases, and the dispersed small-scale vortex appears from the trailing edge of the blade to the outlet of the runner. At 1.0 cycle, the vortex scale near the suction surface of the blade becomes larger, the whole runner is filled with vortex, and the local large-scale vortex appears at the trailing edge of the long blade. The vortex has a tendency to evolve from the runner outlet to the runner inlet. According to the distribution of the velocity vector, the unsteady flow, such as obvious backflow and transverse flow, occurs near the inlet of the blade pressure surface, resulting in a vortex area. The velocity vector distribution of this opening condition is basically consistent with the vortex distribution. It can be seen that the 29.28° opening makes the runner flow and the blade pressure surface have a serious impact so there is always a large-scale vortex on the pressure surface.

3.3. Pressure Pulsation in Runner at Different Opening Conditions

In order to express the pressure pulsation characteristics of runners with long and short blades more intuitively, the dimensionless pressure pulsation coefficient Cp is introduced to represent the amplitude of pressure pulsation. The specific expression is as follows [18]:
C p = P P 0.5 ρ u 2 2
u 2 = n π D 1 60
where P is the pressure of the monitoring point, P is the mean pressure of monitoring points in the cycle, ρ is the density of water, u 2 is the tangential velocity of the runner inlet, n is the runner speed, and D1 is the runner inlet diameter.
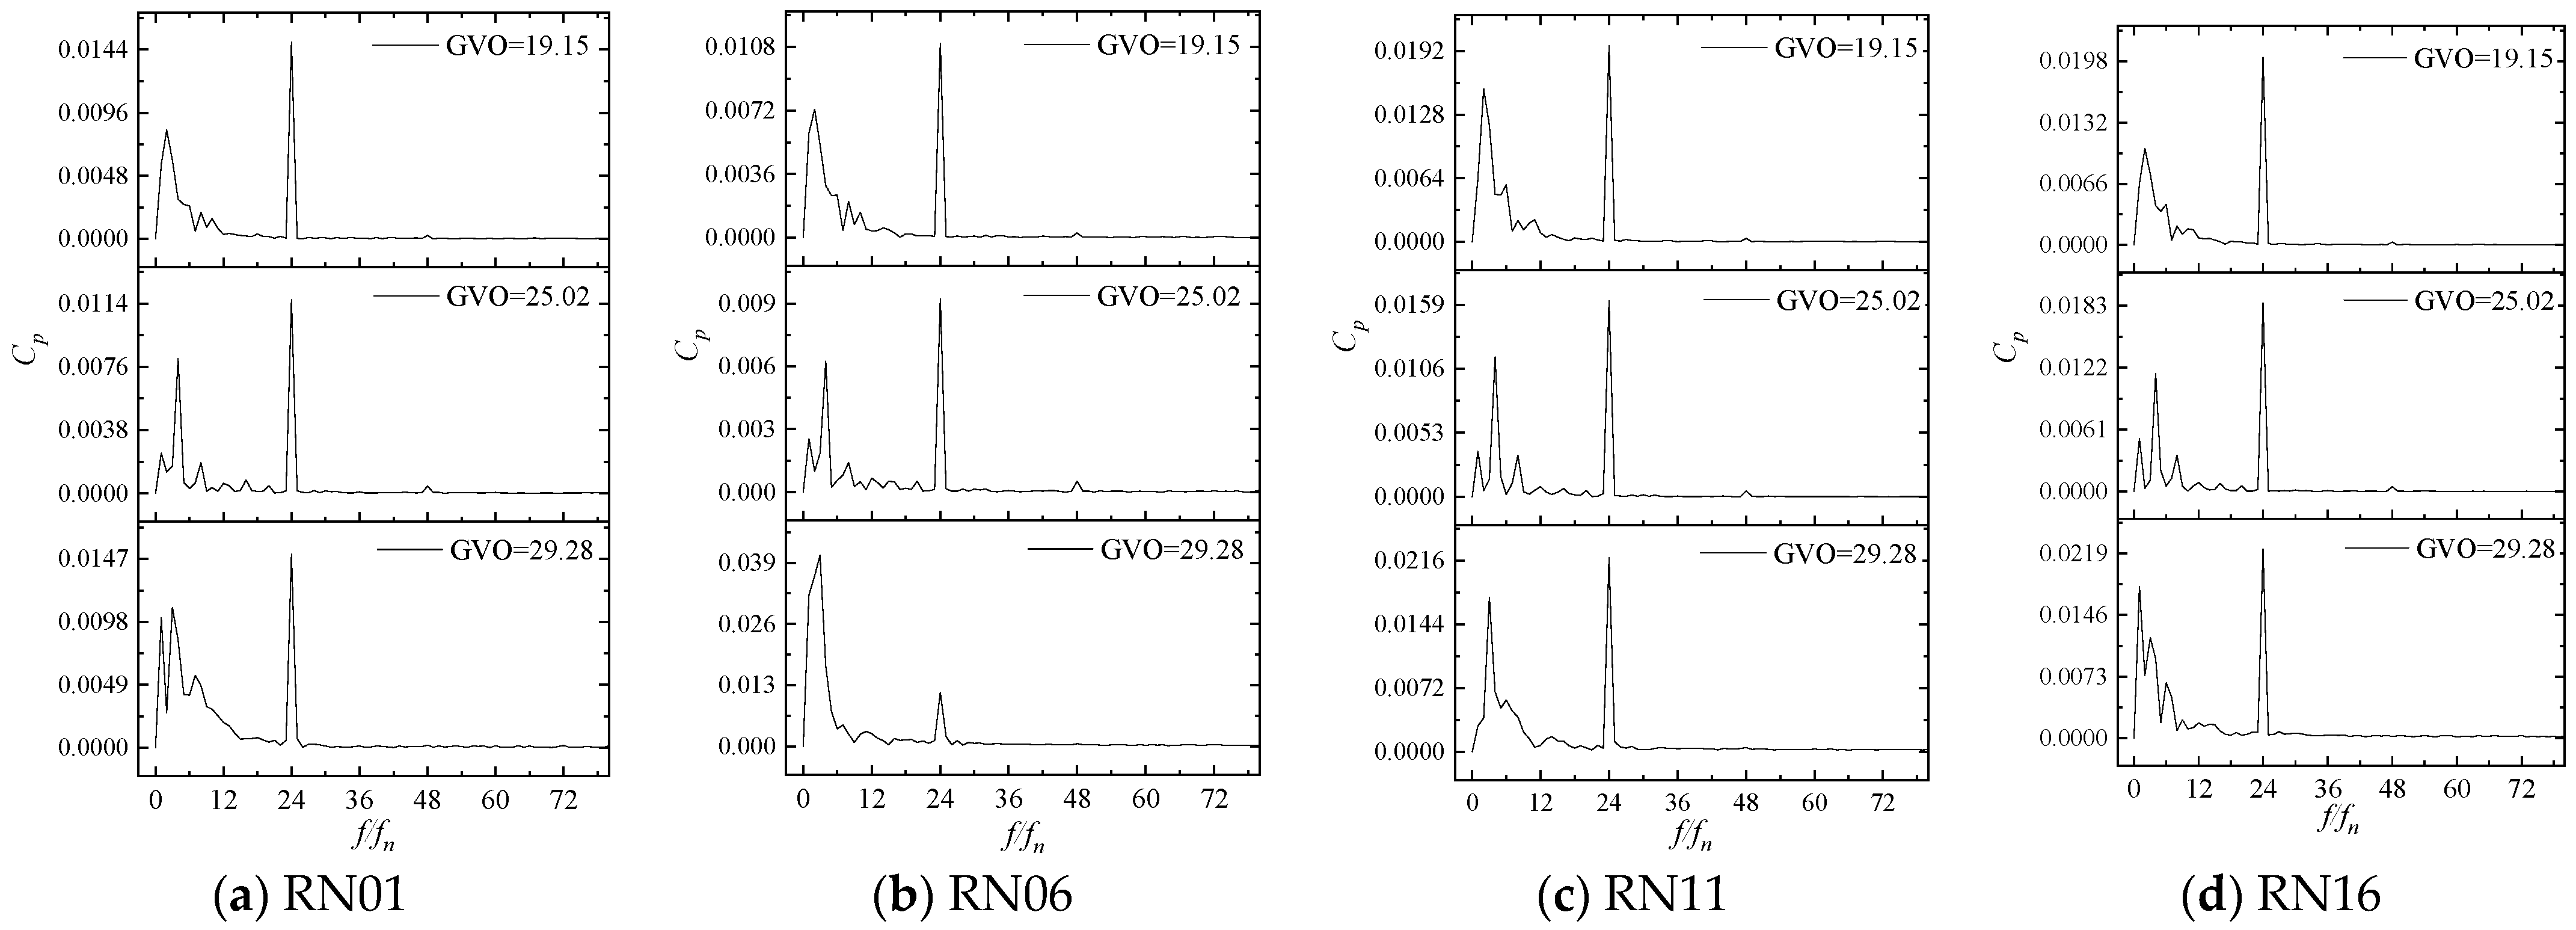
Four monitoring points, RN01, RN06, RN11, and RN16, near the runner inlet are selected. The pressure values of these monitoring points are extracted, then converted into the pressure pulsation coefficient Cp to form the time domain signal. Finally, the time domain signal is converted to the frequency domain signal by Fast Fourier Transform (FFT), and the pressure pulsation of the monitoring points under different opening conditions are shown in Figure 15 and Figure 16.
It is not difficult to find that the time domain distribution of pressure pulsation at 19.15° and 25.02° openings has obvious periodicity, while the unstable flow at 29.28° opening leads to the weak regularity of the time domain distribution of pressure pulsation. There are 24 peaks in a rotation cycle. From Figure 15, it can be seen that the first sub-frequency of the pressure pulsation of the runner blade is 24fn (fn is the shaft frequency 1.875 HZ), which mainly comes from the dynamic and static interference between the guide vane and the runner, while the low-frequency component in the frequency domain figure is mainly caused by the unstable flow inside the runner. In the frequency domain diagram, in addition to the first sub-frequency of 24fn, the prominent frequencies appearing at the same time are all shaft frequency doubling. The amplitude of 2fn is higher at the 19.15° opening, the amplitude of 4fn is higher at the 25.02° opening, and the amplitude of shaft frequency and 3fn is higher at the 29.28° opening. These frequencies perform a secondary role in pressure pulsation.
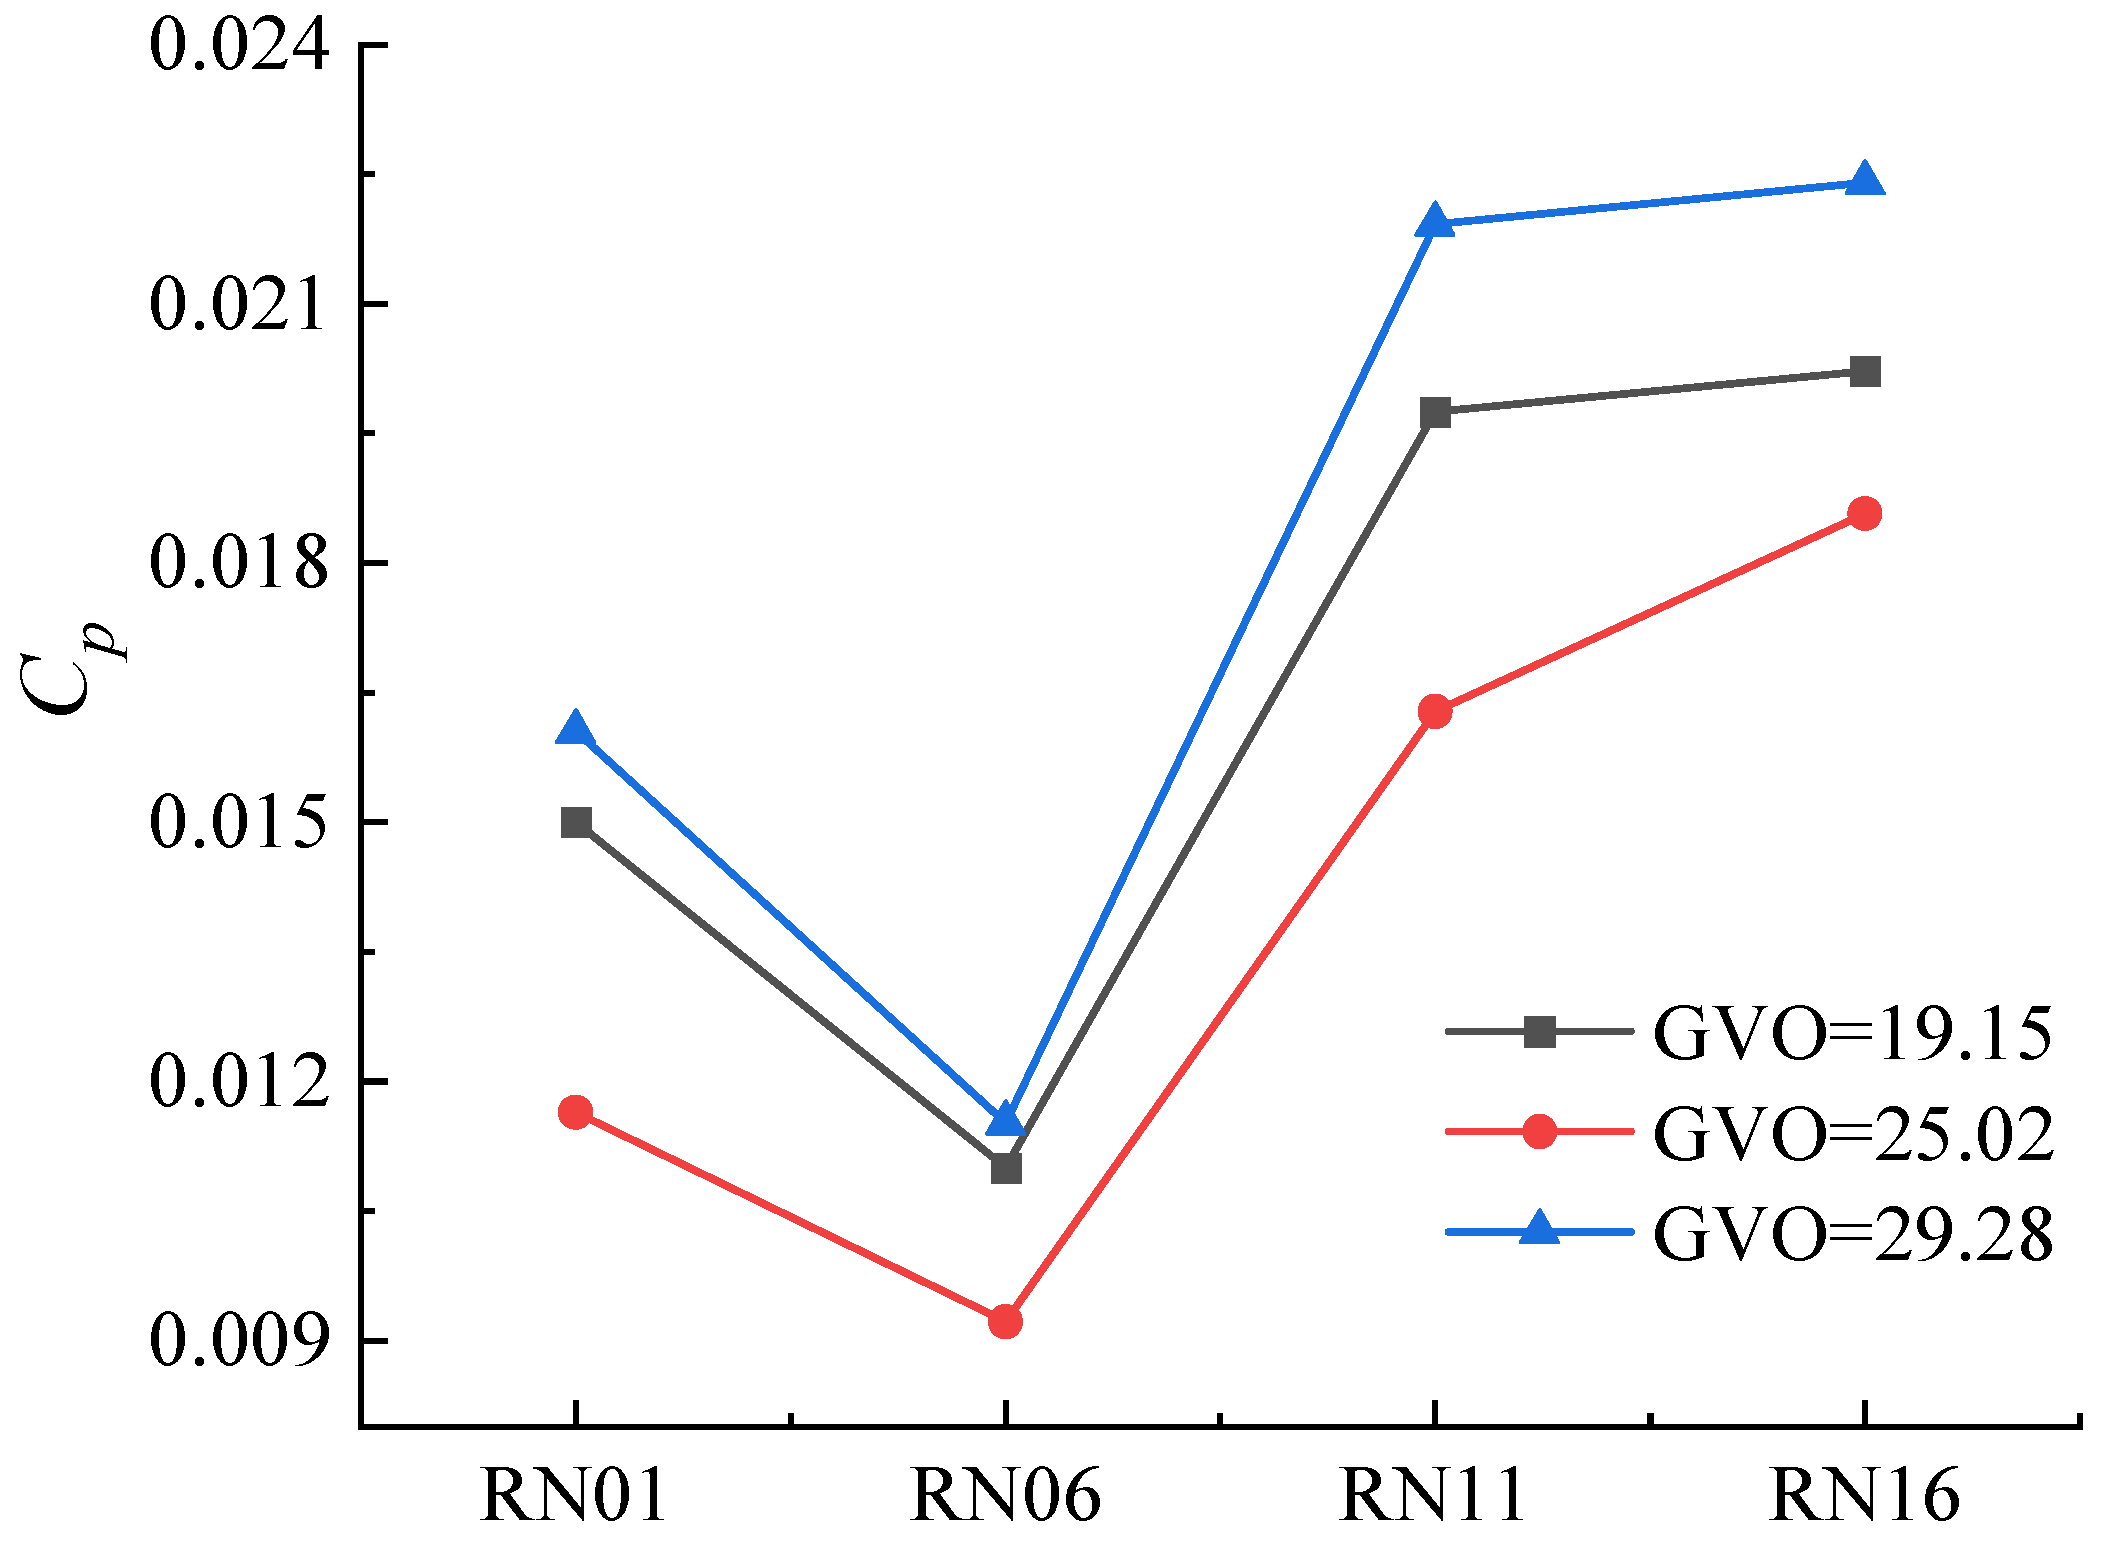
The opening will change the distance between the guide vane and the runner, which in turn affects the effect of dynamic and static interference. In the frequency domain figure, the first sub-frequency amplitude is different. In order to study the influence of the guide vane opening on the dynamic and static interference, the pressure pulsation amplitude of the first sub-frequency 24fn is extracted. The first sub-frequency amplitudes of different monitoring points under three opening conditions are shown in Figure 17. It can be seen from the figure that the first sub-frequency pressure pulsation amplitude is the smallest when the opening is at 25.02°, followed by 19.15°, and the first sub-frequency amplitude is the largest when the opening is at 29.28°. It can be seen that the degree of dynamic and static interference between the movable guide vane and the runner is the least significant at the opening condition of 25.02°, and the dynamic and static interference between the two is the strongest at 29.28°. In addition, the pressure pulsation amplitude of the suction surface is higher than that of the suction surface under different opening conditions, indicating that the pressure pulsation of the suction surface is more significantly affected by the dynamic and static interference, which is consistent with the larger scale vortex in the vortex distribution [19,20].
The pressure pulsations at different positions inside the runner are different. In order to explore the pressure pulsation changes from the inlet of the runner to the outlet of the impeller, the first sub-frequency and the first and second frequencies of each monitoring point at different openings are shown in Figure 18 and Figure 19. The runner radius is denoted as r0, and the flow surface of RN12~RN15 is denoted as flow surface I, which is located near the long blade and is 0.74r0, 0.56r0, 0.43r0, and 0.35r0 away from the center axis of the runner, respectively. The flow surface of RN17~RN20 is denoted as flow surface II, which is located near the short blade, and the distance from the central axis is 0.82r0, 0.73r0, 0.63r0, and 0.53r0, respectively. From the frequency diagram, it can be seen that the first sub-frequency of the monitoring points on the flow surface I at different openings is basically 24fn. Only the first sub-frequency of the monitoring point RN15 at the three openings is fn, 4fn, 3fn, and 24fn appears in the first sub-frequency or the second sub-frequency, mainly because the monitoring point RN15 is the farthest from the runner inlet, and the pressure pulsation at this point is the least affected by the dynamic and static interference, and other frequencies perform a leading role in the pressure pulsation; the first sub-frequency of the monitoring point of the flow surface II at different openings is 24fn. The first sub-frequency and the second sub-frequency become the frequency doubling of other axes as the opening changes. The pressure pulsation near the short blade is dominated by the dynamic and static interference. It can be seen that the farther away from the runner inlet, the less obvious the leading role of the dynamic and static interference in the pressure pulsation, and the greater the influence of the unstable flow inside the runner.

4. Conclusions

  • The internal streamline of the long and short blade runner is uniform, and there is no obvious unstable flow, such as backflow and vortex. It can be seen that the long and short blades can change the inflow of the runner inlet and reduce the hydraulic loss. The dynamic and static interference between the guide vane and the runner induces the local high-speed flow mainly concentrated in the vaneless area. As the opening decreases, the dynamic and static interference at the vaneless area gradually becomes significant. The pressure on the pressure surface of the blade is significantly higher than that on the suction surface, and the pressure distribution gradient is more uniform, showing a gradual decrease from the runner inlet to the outlet.
  • Under the condition of GVO = 19.15°, the vortex in the runner mainly appears near the suction surface and gradually evolves from the runner inlet to the outlet. Under the condition of GVO = 25.02°, there are few vortex areas, and the small vorticity vortex area evolves from the blade near the outlet to the blade passage area. Under the condition of GVO = 29.28°, due to the large impact between the incoming flow and the blade pressure surface, a large vorticity vortex area appears near the blade pressure surface, and the vortex evolves from the runner outlet area to the inlet.
  • The first sub-frequency of pressure pulsation in the runner is basically 24fn, which corresponds to the frequency of dynamic and static interference. The amplitude of first sub-frequency at the GVO = 29.28° condition is the largest, and the dynamic and static interference is the most obvious. The pressure pulsation amplitude from the runner inlet to the outlet gradually decreases along the flow direction. As the distance from the runner inlet increases, the unstable flow gradually performs a leading role in the pressure pulsation.

Author Contributions

Conceptualization, H.C. and Z.W.; methodology, Y.L.; software, Z.Z.; validation, W.Z. and X.H.; formal analysis, H.C. and H.L.; investigation, Z.Z.; resources, K.L.; data curation, Z.Z.; writing—original draft preparation, Y.L. and Z.Z.; writing—review and editing, Z.Z.; visualization, X.H.; supervision, Z.W.; project administration, Z.W.; funding acquisition, Z.W. All authors have read and agreed to the published version of the manuscript.

Funding

This study was supported by Three Gorges Construction Group Co., Ltd. (Contract No.: JGJD0322003), China Postdoctoral Science Foundation Funded Project (2021M701847), China Postdoctoral Science Foundation Funded Project (2022M711768), Natural Science Foundation of Jiangsu Province (BK20210771), Fund Program of State Key Laboratory of Hydroscience and Engineering (No. 2022-KY-06).

Data Availability Statement

The data that supports the findings of this study are available within the article.

Conflicts of Interest

The authors declare no conflict of interest.

References

  1. Du, Q.X.; Song, G.Y.; Wu, S.Y. Technology innovation and quality control of manufacturing of the first million-unit long and short blade runner of Baihetan Hydropower Station. In Proceedings of the 2019 Annual Conference of the Chinese Hydraulic Engineering Society, Nanjing, China, 10–12 May 2019; China Water Resources and Hydropower Press: Beijing, China, 2019; Volume 1, pp. 533–537. [Google Scholar]
  2. Wang, H.M.; Qing, D.Q.; Wei, X.Z.; Zhao, Y.; Chen, Y.L. Research and development and progress of hydraulic engineering of long and short blade runners of Harbin electric Francis pump. Hydropower Pumped Storage 2016, 2, 38–43. [Google Scholar]
  3. Wang, Z.N.; Sun, L.G.; Guo, P.C. Analysis and suppression of blade passage vortex formation in Francis turbine. J. Hydroelectr. Power 2020, 39, 113–120. [Google Scholar]
  4. Gentner, C.; Stachle, M.; Sallaberger, M. Unsteady numerical analysis of pressure pulsations in the spiral casing and runner of a pump turbine. In Proceedings of the 21st IAHR Symposium on Hydraulic Machinery and Systems, Lausanne, Switzerland, 9–12 September 2002. [Google Scholar]
  5. Jacquet, C.; Fortes-Patella, R.; Balarac, L.; Houdeline, J.B. CFD Investigation of Complex Phenomena in s-Shape Region of Reversible Pump-Turbine. In Proceedings of the IOP Conference Series: Earth and Environmental Science, Grenoble, France, 4–8 July 2016; Volume 49. [Google Scholar]
  6. Zhang, W.; Chen, Z.; Zhu, B.; Zhang, F. Pressure fluctuation and flow instability in S-shaped region of a reversible pump-turbine. Renew. Energy 2020, 154, 826–840. [Google Scholar] [CrossRef]
  7. Braun, O.; Kueny, J.; Avellan, F. Numerical analysis of flow phenomena related to unstable energy—Discharge characteristic of a pump-turbine in pump mode. In Proceedings of the Fluids Engineering Division Summer Meeting, Houston, TX, USA, 19–23 June 2005; pp. 1075–1080. [Google Scholar]
  8. Lowys, P.Y.; Paquet, F.; Couston, M. Onboard measurements of pressure and strain pulsation in a model of low head Francis turbine-part 2: Measurements and preliminary analysis results. In Proceedings of the 21st IAHR Symposium on Hydraulic Machinery and Systems, Lausanne, Switzerland, 9–12 September 2002; pp. 873–880. [Google Scholar]
  9. Gohil, P.P.; Saini, R.P. CFD: Numerical analysis and performance prediction in Francis turbine. In Proceedings of the 2014 1st International Conference on Non Conventional Energy (ICONCE 2014), Kalyani, India, 16–17 January 2014. [Google Scholar]
  10. Kurosawa, S.; Lim, S.; Enomoto, Y. Virtual model test for a Francis turbine. In Proceedings of the IOP Conference Series: Earth and Environmental Science, Canberra, Australia, 27–29 January 2010; Volume 12. [Google Scholar]
  11. Yang, J.; Peng, C.; Li, C.; Liu, X.; Liu, J.; Wang, Z. Design and verification of Francis turbine working in sand laden hydro-power plant. Renew. Energy 2023, 207, 40–46. [Google Scholar] [CrossRef]
  12. Tang, Q.; Yu, A.; Wang, Y.; Tang, Y.; Wang, Y. Numerical analysis of vorticity transport and energy dissipation of inner-blade vortex in Francis turbine. Renew. Energy 2023, 203, 634–648. [Google Scholar] [CrossRef]
  13. Murugesan, C.; Rudramoorthy, R. Numerical and experimental study of single stage and multistage centrifugal mixed flow submersible borewell pumps. Int. J. Fluid Mach. Syst. 2016, 9, 107–118. [Google Scholar] [CrossRef] [Green Version]
  14. Booth, C.P.; Leggoe, J.W.; Aman, Z.M. The Use of Computational Fluid Dynamics to Predict the Turbulent Dissipation Rate and Droplet Size in a Stirred Autoclave. Chem. Eng. Sci. 2019, 196, 433–443. [Google Scholar] [CrossRef]
  15. Khawar, R.; Ho, H.S. Influence of lateral flow contraction on bed shear stress estimation by using measured turbulent kinetic energy. Exp. Therm. Fluid Sci. 2022, 139, 110742. [Google Scholar]
  16. Li, P.; Jin, F.; Tao, R.; Zhang, F.; Xiao, R. Unsteady Simulation of the Internal Flow in a Tubular Pump Considering Tip-Leakage Flow. In Proceedings of the IOP Conference Series: Earth and Environmental Science, Dhulikhel, Kavre, Nepal, 22–23 November 2021; Volume 1037. [Google Scholar]
  17. He, Q.L.; Huang, X.X.; Bi, H.L.; Yang, M.Q.; Yang, H.X.; Wang, Z.W. Draft Tube Vortex Rope Analysis of a Pump-turbine Unit under Different Operating Conditions. In Proceedings of the IOP Conference Series: Earth and Environmental Science, Trondheim, Norway, 26 June–1 July 2022; Volume 1079. [Google Scholar]
  18. Skripkin, S.G.; Tsoy, M.A.; Kuibin, P.A.; Shtork, S.I. Aperiodic pressure pulsation under non optimal hydraulic turbine regimes at low swirl number. J. Phys. Conf. Ser. 2017, 899, 022016. [Google Scholar] [CrossRef]
  19. Miao, S.H.; Zhang, H.B.; Zhang, J.W.; Wang, X.H.; Shi, F.X. Unsteady flow characteristics of energy conversion in impeller of centrifugal pump as turbine. Proc. Inst. Mech. Eng. Part C J. Mech. Eng. Sci. 2022, 236, 1502–1511. [Google Scholar] [CrossRef]
  20. Qian, C.; Yang, L.H.; Qi, Z.P.; Yang, C.X. Analysis of the axial force distribution characteristics of multistage pumps and its correlation with hydraulic property. Adv. Mech. Eng. 2022, 14, 16878132221130565. [Google Scholar]
Figure 1. (a) Fluid domain of the Francis turbine; (b) The long and short blade runner.
Processes 11 01796 g001
Figure 2. Validation of grid independence.
Processes 11 01796 g002
Figure 3. Information of the grid for different components in Francis turbine.
Processes 11 01796 g003
Figure 4. Monitoring point distribution in the runner.
Processes 11 01796 g004
Figure 5. Comparison of flow rate between CFD and experiment.
Processes 11 01796 g005
Figure 6. Guide vane and runner velocity streamline.
Processes 11 01796 g006
Figure 7. Turbulent kinetic energy of guide vane and runner.
Processes 11 01796 g007
Figure 8. Pressure distribution of long blade Pressure surface.
Processes 11 01796 g008
Figure 9. Pressure distribution of long blade Suction surface.
Processes 11 01796 g009
Figure 10. Pressure distribution of short blade Pressure surface.
Processes 11 01796 g010
Figure 11. Pressure distribution of short blade Suction surface.
Processes 11 01796 g011
Figure 12. Vortex and velocity distribution under 19.15° opening condition.
Processes 11 01796 g012
Figure 13. Vortex and velocity distribution under 25.02° opening condition.
Processes 11 01796 g013
Figure 14. Vortex and velocity distribution under 29.28° opening condition.
Processes 11 01796 g014
Figure 15. Time domain diagram of pressure pulsation of the monitoring point.
Processes 11 01796 g015
Figure 16. Frequency domain diagram of pressure pulsation of the monitoring point.
Processes 11 01796 g016
Figure 17. First sub-frequency pressure amplitude distribution at different opening conditions.
Processes 11 01796 g017
Figure 18. First three-order frequency distribution along flow surface I.
Processes 11 01796 g018
Figure 19. First three-order frequency distribution along flow surface II.
Processes 11 01796 g019
Table 1. Main parameters and values of the Francis turbine.
ParametersValue
Maximum head Hd, m243.1
Rated head Hd, m202
Rated rotational speed nd, r/min107.1
Rated flow rate Qd, m3/s538.8
Rated output Pd, MW1015
Stay vane blade number, Z123
Guide vane blade number, Z224
Runner blade number, Z315 + 15
Runner inlet diameter D1, mm8710
Runner outlet diameter D2, mm7340
Runner inlet width b1, mm1570
Disclaimer/Publisher’s Note: The statements, opinions and data contained in all publications are solely those of the individual author(s) and contributor(s) and not of MDPI and/or the editor(s). MDPI and/or the editor(s) disclaim responsibility for any injury to people or property resulting from any ideas, methods, instructions or products referred to in the content.