Article

Industrial Drying of Fruit and Vegetable Products: Customized Smart Monitoring and Analytical Characterization of Process Variables in the OTTORTO Project

1
Department of Environmental, Biological and Pharmaceutical Sciences and Technologies, University of Campania “Luigi Vanvitelli”, 81100 Caserta, Italy
2
Energreenup s.r.l., 81051 Pietramelara, Italy
3
Reverseup s.r.l., 84081 Baronissi, Italy
4
FARRIS s.r.l., 71027 Orsara Di Puglia, Italy
5
National Institute of Nuclear Physics—Naples Department, 80126 Napoli, Italy
*
Author to whom correspondence should be addressed.
Processes 2023, 11(6), 1635; https://doi.org/10.3390/pr11061635
Submission received: 3 May 2023 / Revised: 19 May 2023 / Accepted: 24 May 2023 / Published: 26 May 2023
(This article belongs to the Special Issue Innovations in Food Processing and Preservation Methods)

Abstract

:
In the era of digitalization, the process industry is one of the sectors most affected by the need for change. The adoption of IoT-based intelligent monitoring systems for the collection of real-time measurements of energy and other essential operational variables, on one hand, makes it possible to accumulate big data useful for the company management to monitor the stability of the production process over time, and on the other hand, helps to develop predictive models that enable more efficient work and production. The OTTORTO project stems from the need of the FARRIS company to adapt its production line to agriculture 4.0 policies, responding to the higher goals of digitization and technological transition imposed at the national and EU level. The objectives of the current study are (i) to present an “ad hoc” customized intelligent and multi-parameter monitoring system to derive real-time temperature and humidity measurements inside the company’s industrial drying kilns; and (ii) to show how it is possible to extract information from operational data and convert it into a decision support too and an effective knowledge medium to better understand the production process. Studying the correlations between temperature and humidity measurements showed that for most of the observation period, the system was thermodynamically quite stable in terms of major operational risks, such as humidity saturation inside the kilns causing condensation on the products to be dried. However, to remedy the occasional occurrence of such inefficiencies, implementing kilns with the introduction of forced air extraction systems could bring significant benefits in terms of improved energy-environmental performance.

1. Introduction

Fruits and vegetables are major sources of vitamin C (ascorbic acid) and provitamin A (beta carotene) as well as minerals [1]. Moreover, they are a natural source of biological compounds of interest to health and industry (vitamins, minerals, dietary fibers, proteins of various typologies and their potential uses) [1,2]. For example, fruit and vegetables are a very important source for the extraction of natural pigments, such as carotenoids and chlorophylls, in which certain plant species are very rich, and in this regard they play a predominant role despite the growing trend of extracting such biocompounds from microalgal matrices [3,4,5,6].
Fruit and vegetable products can be consumed fresh or processed, and drying is one of the most widely used methods of stabilizing them [7]. Food dehydration is an ancient and important process for food preservation [8], and dehydrated fruits and vegetables have always been produced domestically to preserve food right after its ripening stage, thus ensuring genuine and safe food supplies [9]. Desiccation is a process that can remove water from a product and it is exploited for several important benefits [7,10], namely minimization of the biochemical degradation process; extension of the shelf life; preservation of the nutritional properties of the product; and optimization of transport and storage operations (lighter and less bulky stabilized foods). The trend of the consumers toward dehydrated goods is increasing steadily, along with changing lifestyles, growing perception of the quality of food, and a preference for clean-label [11,12,13,14,15].
Dehydration is perceived as a rather simple process by the general public [16]. However, it is a very complex operation involving physical processes, such as simultaneous transport of heat, mass, and convective motions, with the added complexity of deformation and degradation of the finished product [8]. A further critical issue is the complexity of the fruit/vegetable’s matrices, which have a heterogeneous composition that shows considerable variability depending on the harvest season, variety of that fruit/vegetable, geographic origin, agricultural practices, environmental conditions, and post-harvest handling. This variability is also reflected in their thermophysical properties, which change dynamically during dehydration operations [17,18].
Looking at how the process is put into practice at an industrial scale, typically the machinery settings employed for the dehydration process are established through some initial trials, or after the quality of the machinery is determined by the experienced plant operator, in order to achieve a product quality perceived as optimal, after which they are generally not changed. These measurements require a considerable amount of labor and skilled personnel, and they also involve frequent temporary shutdown of the machinery. On the other hand, when the production process is running at full capacity, there are no interruptions, and the processed vegetables are not impacted by the on/off phases of the dehydration hoods (as is the case with the samples during these tests); therefore, this constitutes an additional measurement error to be taken into account with respect to the operating temperatures and drying time set for the production line [7,19,20]. When all these preliminary operations are completed, usually the plant is finally ready to process the actual flow rate of the food to be dried, which by the way is much higher.
A natural question that arises at this point is, why are optimization and control so crucial in dehydration, when it is a well-structured and operationally mature industrial process? The answer is that the dehydration behavior of foods and the relationship between process variables (e.g., temperature, humidity, and pressure) is yet to be fully understood [18,21,22], and thus it is an obstacle to achieving the highest quality dehydrated product with minimal energy expenditure, even in the simplest case of convective dehydration [23]. Therefore, although dehydration is one of the most industrially used techniques for stabilizing food products, it requires large amounts of energy to maintain certain temperature levels over time (at an industrial scale), thus making it one of the most energy intensive industrial activities [24]. Taking into consideration the increasing cost of energy sources and the significant impact that energy demands has on the environment [25], energy inefficiency is a significant weakness for the companies within the food industry [26,27,28,29].
In this context, it is necessary to emphasize the considerable efforts being sought in the European Union and National States with the “Green New Deal” programs that aims to implement policies for the minimization of CO2 emissions, the development of renewable energies, as well as the recovery of resources from waste matrices, such as solid and liquid wastes [30,31,32,33,34,35]. These energy-environmental optimization goals can only be realized by introducing “smart” methodologies, protocols and technologies in the industrial production processes, as relevant scientific literature has already demonstrated the results of such applications in a variety of industrial sectors related to citizens’ lives [36,37,38,39,40,41,42,43,44,45,46,47]. At the international level, efforts have been undertaken for some years now to fulfil this objective through the activation of specific policies and the encouragement of research and development projects. One such policy, in the context of the European Union, is the Industry 4.0 programs, announced in 2013 with the main aim of revolutionizing industrial processes and increasing efficiency and profitability through the integration of physical and digital technologies, including artificial intelligence (AI), the Internet of Things (IoT), Big Data, cloud computing, business process management, 3D printing, cyberphysical systems (CPS), production digitalization, and service-oriented architecture [48,49].
The agricultural sector is also a key player in this path of innovation and technological advancement [50]. To date, most of the applications that have been introduced mainly concern the use of intelligent monitoring systems in the cultivation of raw materials [51], relegating a secondary role to those production processes that concern the handling and further processing of crops, as could be the case, for example, with the dehydration of fruit and vegetables. Regardless, existing evidence point to at least four reasons that make it worthwhile to introduce IoT-based innovation activities in the fruit and vegetable sector [52,53,54,55,56], namely increased process effectiveness and efficiency; overall supply chain benefits; increased sales; and exploitation of acquired data as a knowledge asset for the business.
The “OTTORTO” R&D project undertaken by the Italian company FARRIS is one of the important projects in recent times that has attempted to respond to the increasingly insistent challenge of digitizing production processes and shifting the agriculture-IoT focus to the industrial processes subsequent to the cultivation and harvesting phases. The OTTORTO project emerged from the need of the company to reduce energy costs and environmental impacts, and it was launched with the aim of introducing smart technologies within the supply chain of the company that would improve the knowledge of the systems and operating parameters involved in the dehydration of fruit and vegetable products, which happens to be one of the company’s leading production processes. The plant under study represents one of the few realities at the international level to have—for the dehydration process—a branched plant system, consisting of numerous sections of kilns in series, through which it is possible to customize the steps for dehydration temperatures and create vegetable-specific “thermal recipes”, taking into account the rules governing the thermodynamic process under consideration.
The purpose of this paper is to show the results obtained in the OTTORTO project in terms of (i) the implementation of an “ad hoc” multi-parameter monitoring system built primarily to integrate the field and real-time acquisition of a considerable amount of process data, along with the interpretation and representation techniques for full usability by the operators involved; and (ii) to show how it is possible to process the measurements collected in real time by the system to extrapolate technical-operational information on the operating status of the production line. All these activities enable the OTTORTO project and the company to take steps toward fulfilling Goal No.12 of the 2030 Agenda for Sustainable Development, which aims to ensure sustainable consumption and production patterns [57]. To the best of our knowledge, there are no similar studies in the relevant literature that focus on intelligent monitoring of internal operational parameters in dehydration kilns and in general, in a production process of this type. Moreover, our study also presents for the first time an entirely purpose-built sensor system for real-time monitoring of process parameters inside industrial kilns. Therefore, this research is particularly important from an application point of view because it provides, to all stakeholders in the industry, knowledge and tools of technical and operational interest with which they will be able to (i) further their understanding of the actual operating performance of the industrial equipment, (ii) and identify rather easily any critical points in the system that needs intervention in a targeted and immediate manner. This study represents a valid application of the industrial process control and emphasizes the importance of extracting information from the operational data in order to convert it into an effective knowledge medium and a decision support tool for a better understanding of the production process.

2. Materials and Methods

FARRIS s.r.l. was founded in 2006 and it is based in the Puglia region (southern Italy), an area rich in both natural and human resources. All the products involved in the production chain are grown in the province of Foggia by the members of the Giardinetto Cooperative. Therefore, they are part of a certified and, above all, a 0 km supply chain, which has adhered to the protocols of agriculture 4.0; some examples of this commitment are the use of electricity from renewable sources, the reduction in water consumption through the reuse of washing water, the use of drones and GPS monitoring for crop control, etc. Continuous technological innovation is at the heart of the company’s philosophy, on the one hand, as a tool for optimizing production processes, and on the other, as a gesture of responsibility and awareness toward the environment.
The company’s factories are located in the Orsara di Puglia area, and they internally receive raw materials grown in the area to produce not only frozen products, but also dry and semi-dry IQF ready-to-eat products, which allow for expanded consumption of fruits and vegetables outside the seasonality calendar.
To meet the objectives of the present study, the work was organized into 3 main phases:
  • Analysis of the conventional drying process of fruit and vegetable products.
  • Implementation of intelligent systems for monitoring the drying process of fruit and vegetable products.
  • Statistical analysis of the process variables for evaluating the operating status of the production line.

2.1. Analysis of the Conventional Drying Process of Fruit and Vegetable Products

For energy and environmental optimization of the production process, the knowledge of the main factors involved in the dehydration process of fruit and vegetable products is rather relevant as it allows to guide the design of the most appropriate monitoring system for the effective acquisition of process data.
From a strict theoretical point of view, dehydration commonly describes the process of thermal removal of volatiles (moisture) to obtain a solid and equilibrium product, where a food product is in equilibrium with its surroundings, i.e., its internal vapor pressure is in equilibrium with the external vapor pressure [10]. Therefore, the two most important parameters around which the effectiveness of a hydration process and the equilibrium conditions of products revolve are [8,58] the process temperature and the recorded moisture level.
Energy transfer as heat from the surroundings to the wetted solid can occur by convection, conduction, or radiation and in some cases occur as a result of a combination of these effects. Depending on the main method of heat transfer used, industrial dryers may differ in type and design, and be suitable with respect to the specific production chain [8,10,58].
Regarding the dynamics of interaction between heat and moisture in the product, in general it must be considered that the heat supplied to the products is transferred first to the surface of the wetted solid and then, from there, to its interior [58]. This heat acts on the moisture present in the product, which may be in “bound” or “unbound” form [59]; the former is the moisture present in loose chemical combination, or as a liquid solution within the solid, or even trapped in the microstructure of the solid, and exerts a lower vapor pressure than that of the pure liquid, and the latter represents the moisture in excess of the bound moisture. The way heat interacts with and drives away the moisture in the solid to be dried occurs mainly in two steps, which determine the overall drying rate [59], and are referred to as Process 1 and Process 2.

2.1.1. Main Phases of Dehydration

Process 1—Evaporation of Excess Moisture Due to Energy in the Form of Heat in the Surrounding Environment

Here, the essential external variables are temperature, humidity, rate and direction of air flow, the physical shape of the solid, and the need for mixing. These external conditions are particularly important during the initial stages of drying, when unbound surface moisture is removed [59]. In some cases, for example, excessive surface evaporation after the initial free moisture has been removed creates high moisture gradients from the interior to the surface [60]. This can cause excessive drying and shrinkage and consequently high tension within the material.
Surface evaporation is controlled by vapor diffusion from the surface of the solid to the surrounding atmosphere through a thin layer of air that is in contact with the surface [19]. Since drying involves interphase mass transfer when a gas is brought into contact with a liquid in which it is essentially insoluble, it is necessary to be familiar with the equilibrium characteristics of the wetted solid. In addition, since mass transfer is usually accompanied by simultaneous heat transfer between the contacted bodies, the enthalpic characteristics of the process must be considered [10,60].

Process 2—Transfer of Bound Moisture from the Interior of the Solid to Its Surface, Where Such Moisture Evaporates by Process 1

When heat is transferred to a wet solid, under the action exerted by temperature, a thermal gradient “sucks” the moisture outward from the solid and promotes its physical removal from the body by evaporation [19]. Moisture migration from the interior of the solid to its surface occurs through one or more mechanisms, namely diffusion, capillary flow, and internal pressures created by the shrinkage during drying [7]. In this specific process, variables, such as air velocity and temperature, which normally enhance the surface evaporation rate, are of minor importance, except being involved in promoting heat transfer.
In the dewatering operation, any one of these two processes (Process 1 and Process 2) may be the limiting factor governing the speed and success of the operation, even if both proceed simultaneously during the dewatering cycle.

2.2. Realization of Intelligent Systems for Monitoring the Drying Process of Fruit and Vegetable Products

After defining the main parameters governing the drying process and toward which the monitoring measurements (ambient temperature and humidity) had to be directed, the objective of the next phase was to develop and install, on the production line, a network of sensors assembled ad hoc for the acquisition of process parameters.

2.2.1. The Production Line

The FARRIS company’s production line for dehydrated and semi-dried fruit and vegetable products consists of 18 sections, each represented by a 2.5 m long dehydration hood with the possibility of adjusting its temperature (Figure 1). The 18 sections, named “Ki” (where i is a progressive number from 1 to 18) are divided into two different branches (Figure 1). In detail, the first branch of the dehydration kiln runs from K1 to K9 and is the one needed to start Process 1 (see Section 2.1.1), that is, the evaporation of surface moisture. This process takes place at a higher temperature and longer retention time than the second branch (K10 to K18), wherein Process 2 occurs, i.e., the process designed to remove the moisture inside the product, which in the meantime will be subject to a temperature gradient that will gradually “suck” it outward.

2.2.2. Multiparameter Monitoring System Assembly

For the implementation of the monitoring system, the focus was on the use of internet-based sensor technology in order to automate the measurement, analysis, control and monitoring of the process. As mentioned earlier, the factors chosen for experimentation are temperature and humidity, because they are considered the pivotal parameters of a good dewatering process and because they require the most effort in terms of control by the company’s technical staff [7,8,10,19]. In fact, the practice usually most applied in this kind of production line is to continuously measure the moisture level inside the dehydrator in a manual manner and use this measurement as a reference to control and possibly adjust the kiln temperature and dehydration time.
The monitoring system is currently composed of No.6 smart devices set up along the production line at strategic points for the acquisition of real-time temperature and humidity measurements; each device sends the detected measurements via radio frequency signal to a web-based data storage, processing, and representation platform (denominated “M.E.T.”).

The Smart Devices

The complete smart devices were designed by the company Energreenup s.r.l. with the technical support of the innovative startup Mint s.r.l., which specializes in IoT application to precision agriculture and environmental monitoring. A complete smart device can be seen in Figure 2. This is composed of a main body, named LOGGER (2), consisting of a 10 × 10 cm Takachi box (Takachi Electronics Enclosure Co., Ltd., Saitama, Japan) to which a power supply with a wall outlet (1) of 1.4 m cable (C1) and one/two gray cables (C2), twisted and braided to resist interference of length of 2.5 m, is connected. To each gray cable, a second smaller box (8 × 8 cm), named hereafter SATELLITE (3), is connected, which is intended to amplify the signal acquired by the probe and obviate the possible loss of data related to the length of the communication cables. Finally, using a cable (C3) of about 1.5 m long which is wrapped in a heat-resistant sheath, a Sensirion SHT31 thermohygrometer is connected to each satellite, encapsulated in a flat-head steel capsule to withstand the high temperatures of the dehydration kiln (4).
The probes of each smart device were calibrated by comparing them with the values recorded by a certified portable thermohygrometer (Delta OHM-HM Group). Regarding calibration frequency, considering the fact that production campaigns are discontinuous throughout the year to match the seasonality of the vegetables, it was decided to calibrate the probes every 2 production cycles. The accuracy of the values measured by the probes at all monitoring points was ±0.3 °C and ±2% for temperature and humidity, respectively.

Signal Processing

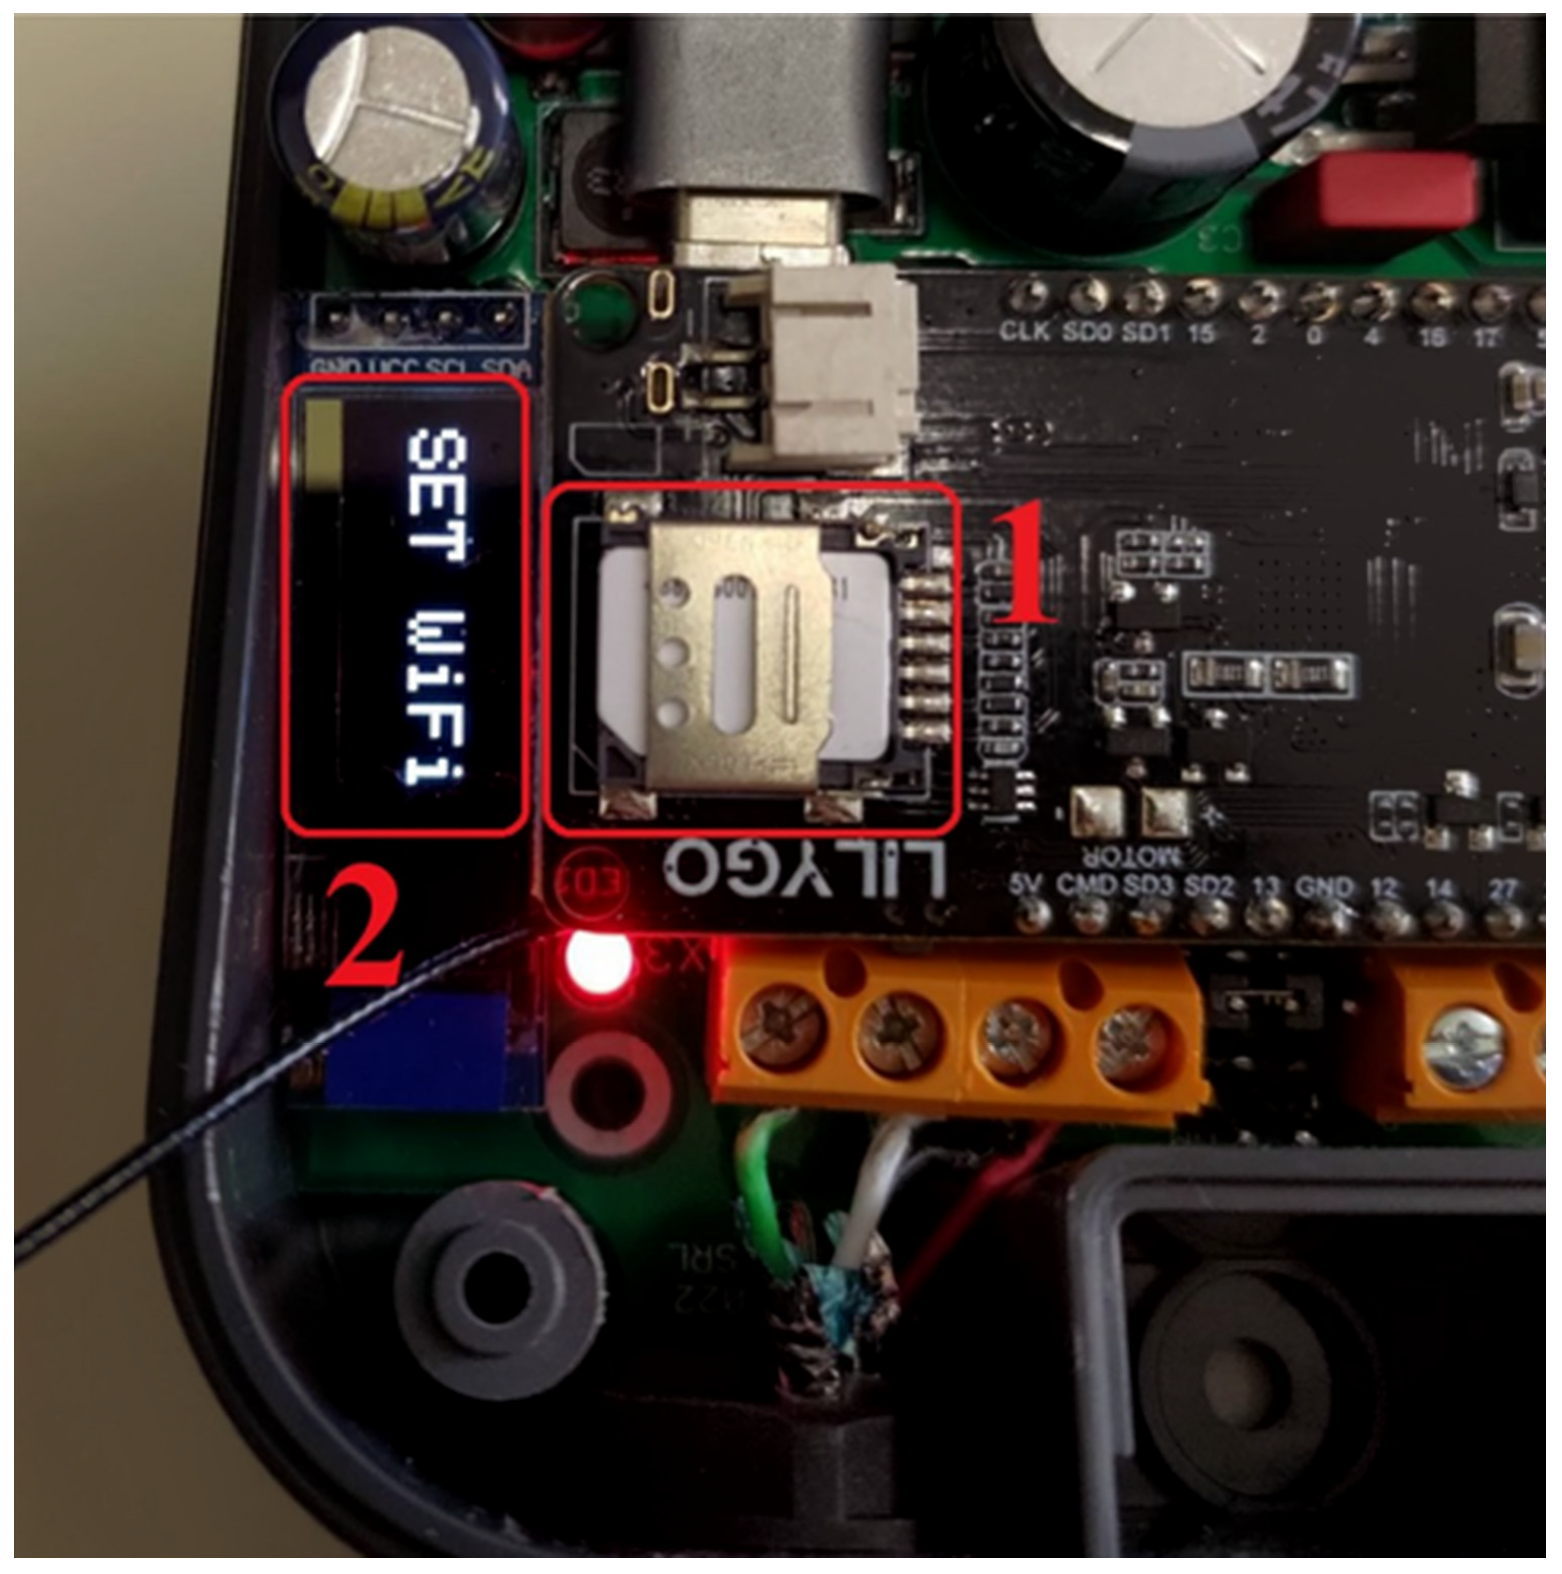
Within the LOGGER, each of these devices has both a WIFI module and a GPRS antenna, so they could constantly transmit information to the platform, always be connected, and not lose data. As an additional safeguard, each device is also equipped with an SD card that can locally store the collected data as well (Figure 3).
A connection with a computational unit based on an ESP32 Wi-Fi/Bluetooth module has been arranged inside the LOGGER, and the sensors are connected to the microcontroller via an I2C serial communication bus. A 7-segment 0.36 inch LED display has been arranged on the case, which is useful for reading parameters even directly on the production line. In general, the device sends data to a cloud via WiFi through a 4G router and via a SHA2 (TCP-AO) algorithm. Figure 3 shows the detailed photos of the LOGGER.
Regarding the measurements to be collected, to interface the SHT31 thermo-hygrometric sensor with the ESP32 microcontroller, a custom firmware was developed that could convert the signals coming from the probe into temperature and humidity values.
The firmware was written to monitor temperature and humidity values with a refresh rate of a few seconds. More specifically, after power-up and initial checks on connection signals, the smart devices started recording the first value of temperature and humidity. From that moment on, the system was programmed to trigger whenever the probe detected a variation, compared to the previously acquired signal of ±5 °C for the temperature and/or ±3% for the humidity. If the probe registered a change beyond these ranges, it instantly acquired the new value; otherwise, if the values monitored by the probe did not exceed these ranges, then the system was programmed to acquire data every 20 min. With this setting for the production campaigns monitored in the present study, data were acquired on average every ~12 min. A conceptual summary of this firmware is shown in Figure 4.
To make the data accessible in a responsive mode on the Web and smartphones as well, the software system for data fruition from the sensors was built in php, accessible at the link https://portal.metemperatura.it/MET/Account/Login?ReturnUrl=%2fMET%2f – accessed on 19 May 2023. The fruition system (M.E.T. Platform) has, in the top line, a series of tabs from which it is possible to access the temperature and humidity data of all the points of the production line placed under monitoring, along with the possibility of selecting specific time intervals to display. In the bottom line, there is a query layer capable of showing the data values recorded on the cloud in CSV format and use for analysis; in addition, a check on the reliability of the WiFi signal and the correctness of the data sent to the platform by the 4G router has been included.

Monitoring Spots

Regarding the specific location of smart devices along the production line, the choice of hoods and points to be monitored was made considering the 2 main processes through which product drying is carried out.
In particular, to monitor the operating parameters of Process 1, it was decided to monitor hoods No. 7 and No. 8 (Figure 1). The latter, since they receive a product that has already been deprived of most of its moisture as a result of passing through the previous hoods, is considered to be more “stable” from a thermo-hygrometric point of view and more representative of the operating conditions of Process 1. In particular, K8 is one of those considered to be fundamental for monitoring the process, because it is the closest to the first point of inspection of the moisture content of the product (output from K9), while remaining sufficiently distant and “isolated” from the point of output of the first branch, so it is less affected by environmental conditions outside the kilns (Figure 1).
To monitor the operating parameters of Process 2, dehydration hoods No.13 and No.14 were chosen to be monitored, measuring thermohygrometric data not only inside the kiln, but also in the drying air outlet chimneys (K13_chimney; and K14_chimney) (Figure 1). These two kilns are considered critical in the production process because they are sufficiently far from the entrance of the second branch (K10), so the product has sufficient time to adapt from a thermohygrometric point of view to the lower temperatures that characterize Process 2. Moreover, of the two selected sections, K14 is of greater interest from a monitoring point of view because it is the last section where tuning of process parameters can be done before the end of the second and final stage. Here, temperature and humidity monitoring are critical to understand how the dehydration is evolving and/or whether it is necessary to change the parameters before the end of the production process. As mentioned, for these two kilns, it was decided to install sensors in the corresponding chimneys as well; the choice is motivated by the need for the company’s managers to investigate whether these two kilns are able to extract exhausted air effectively, or whether they are extracting air that is still thermodynamically suitable to fulfil the drying process.

Monitoring Campaigns

Production campaigns for dried products occur discontinuously over time because efforts are made to respect the seasonality of the various fruits and vegetables as much as possible. Moreover, when the production schedule requires to switch from one product to another, the production line must be reshaped in its parameters so that temperature, airflow, and retention times are adapted to the needs of the new vegetable to be dried.
With the experimental setup previously described, several production campaigns were monitored in the year 2022, especially during the summer season. Without taking into account the testing and maintenance phases of the monitoring system, which show time gaps due to technical interventions, for the purpose of this study it was decided to focus on the month of August 2022, during which 3 production campaigns dedicated to the same type of product, i.e., dried tomatoes, took place. The time frames of the three campaigns are as follows: 2–4 August, 9–12 August, and 23–28 August. Therefore, statistical evaluations were carried out on the data collected during the period from 00:00:00 of 2 August 2022 to 23:59:59 of 28 August 2022. During these 3 production campaigns, the temperature values set for the monitored kilns are as follows: 94 °C in K7, 94 °C in K8, 68 °C in K13 and 68 °C in K14. These data are necessary to establish a comparison between the temperatures manually set on the machines and the actual temperatures recorded by the sensors inside the kilns.

2.3. Statistical Analysis of Process Variables for Evaluating the Operating Status of the Production Line

Temperature and humidity data recorded in real time by the monitoring system were downloaded from the platform in csv format, and then converted into xlsx data tables. Subsequently, statistical analysis and graphical representation of the available data were carried out using the software package JMP Pro 17 (SAS Analytics).
To investigate the presence of potential correlations between variables, time trends and distribution curves of temperature and humidity measurements (main parameters) were analyzed, whilst also making comparisons against the temperatures manually set by the technical staff according to the production “recipe” of the specific product to be processed. In these analyses, regression lines describing the trend of the variables considered for each of the 4 kilns were also derived and compared with each other in order to understand whether the thermohygrometric response was uniform in all the 4 equipment. Another parameter that was considered for the above data analyses was an indirect variable of crucial importance for the identification of possible critical operational issues, namely the difference ΔT between measured ambient temperature and dew point. In fact, dew point indicates the temperature at which water vapor condenses on contact surfaces under constant pressure [61,62]. This parameter is very important for the dehydration phase, since temperature values close to the dew point (ΔT ⟶ 0) indicate the potential formation of liquid aggregates on the fruit and vegetable products to be dried, and thus the release of a “wet” product from the sections, thereby impairing the efficiency of the production process.
For a good approximation, considering a constant air pressure inside the dehydration kiln sections, the dew point was calculated in accordance with what was reported by [62],
T R = R e l a t i v e   h u m i d i t y 100 8 × [ 112 + ( 0.9 × T e m p e r a t u r e ) ] + ( 0.1 × T e m p e r a t u r e ) 112

3. Results and Discussion

The analysis of temperature and moisture data from the monitoring activities allowed us to analyze the actual operation of the sections under consideration and better understand the relationship between drying temperature and moisture extracted from the food. As mentioned in the Materials and Methods section, the analyses presented here refer to two consecutive campaigns dedicated to the production of dried cherry tomatoes, carried out during August 2022. Specifically, the reference period is from 00:00:00 on 2 August 2022 (start day for the first production campaign) to 23:59:59 on 28 August 2022 (end day for the third production campaign).
Table 1 shows a statistical summary of the acquisitions obtained by the monitoring system.
As can be seen, a total of 19,310 simultaneous temperature and humidity measurements were acquired, with an average of about 3218 acquisitions for each kiln/chimney kept under control. Regarding temperature, at first it was assessed that all points had a comparable minimum value, which clearly corresponded to the seasonal ambient temperature inside the equipment when it was not in operation. As for the maximum temperatures, it was noticed immediately that K7 peaked at about 71.9 °C, which is well below the value of 94 °C manually set for both K7 and K8. For the latter, an initial observation of the statistical data reported in the table showed that the standard deviation values obtained for the monitored parameters differ from the others in a statistically non-negligible way; in particular, they are identified as statistical outliers from ~70% of all values. From a practical point of view, a higher standard deviation could conceptually be attributable to greater fluctuations in the parameters recorded in the K8 kiln.
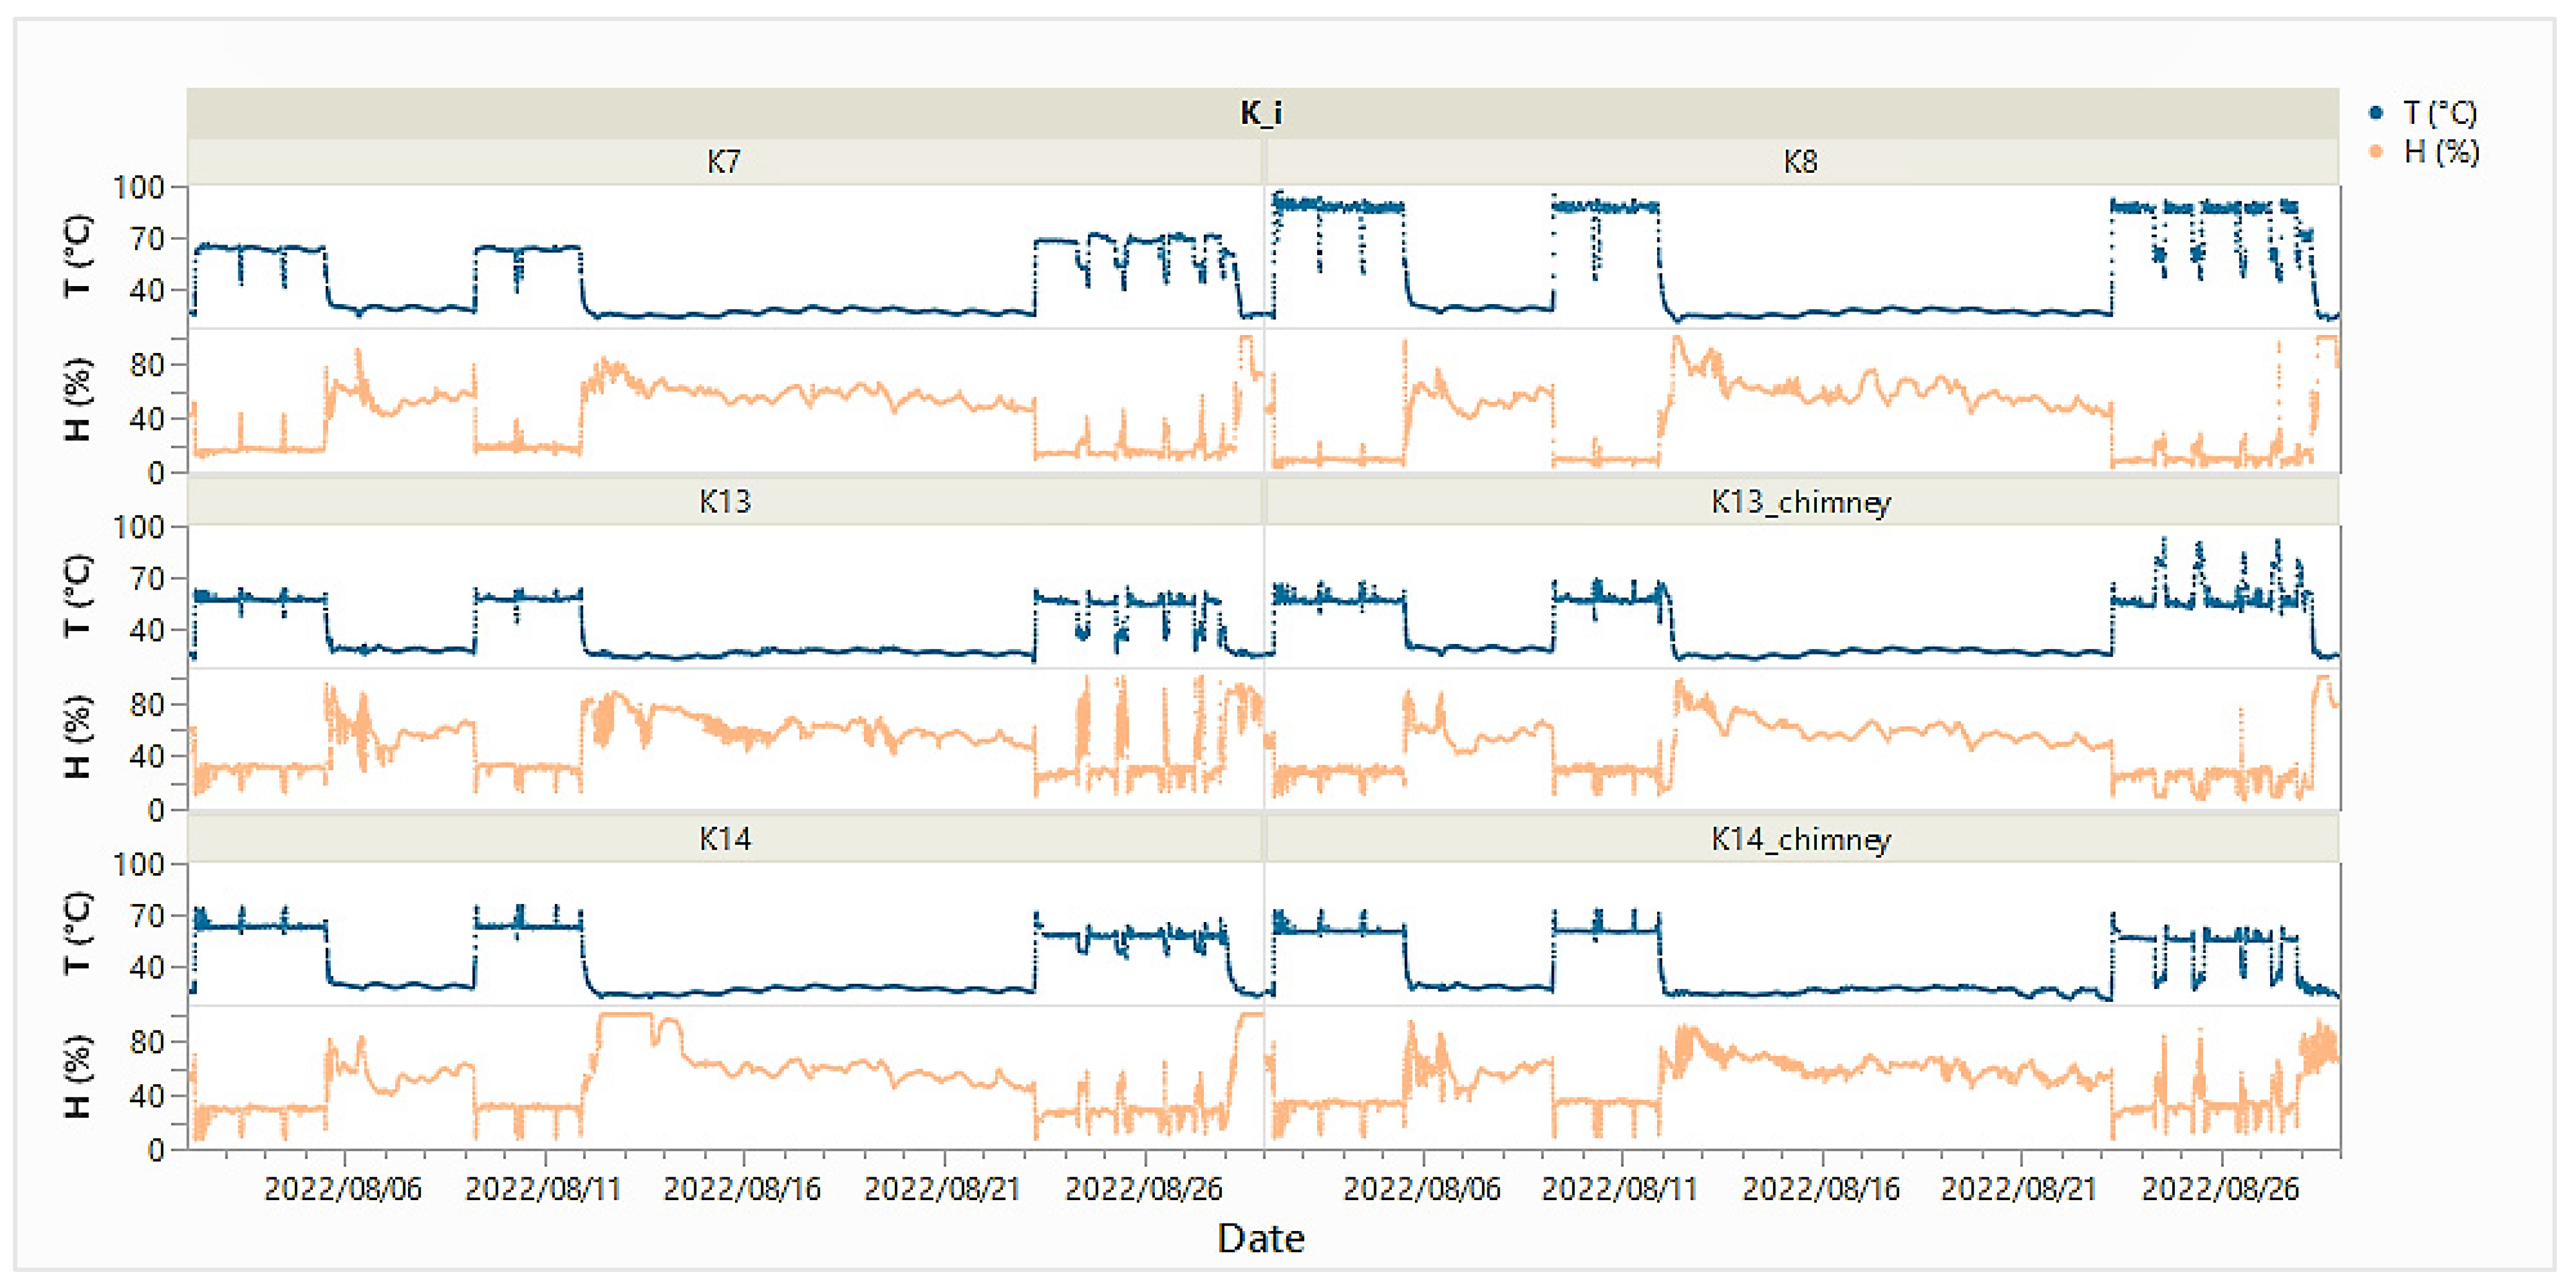
However, the thermo-hygrometric behavior of K8 does not seem to differ markedly from the other sections, as can be seen in Figure 5, which shows the trend of temperature and humidity values recorded for all points during the reference period.
Using Pearson’s correlation index (ρHT) to test the relationship between recorded humidity (H) and process temperature (T) showed a highly significant negative dependence for all monitoring points (|ρHT| > 0.7) (Table 1). However, kiln operating conditions showed higher values of ρHT, and consequently a stronger correlation in Section 7 and Section 8, while Section 13 showed the lower absolute value (−0.74) (Table 1), meaning that here the correlation between temperature and humidity may differ in different kilns. In Figure 5, this inversely proportional correlation between temperature and humidity is very well observable. In fact, each rise in temperature corresponds to a decrease in moisture content, and vice versa. It was also observed that after the kilns were turned off, moisture values tended to remain relatively high for some period of time; this occurred not only because of natural thermodynamic fluctuations in the monitored environment, but also because of the necessary washing operations to which the sections were subjected at the end of a production campaign.
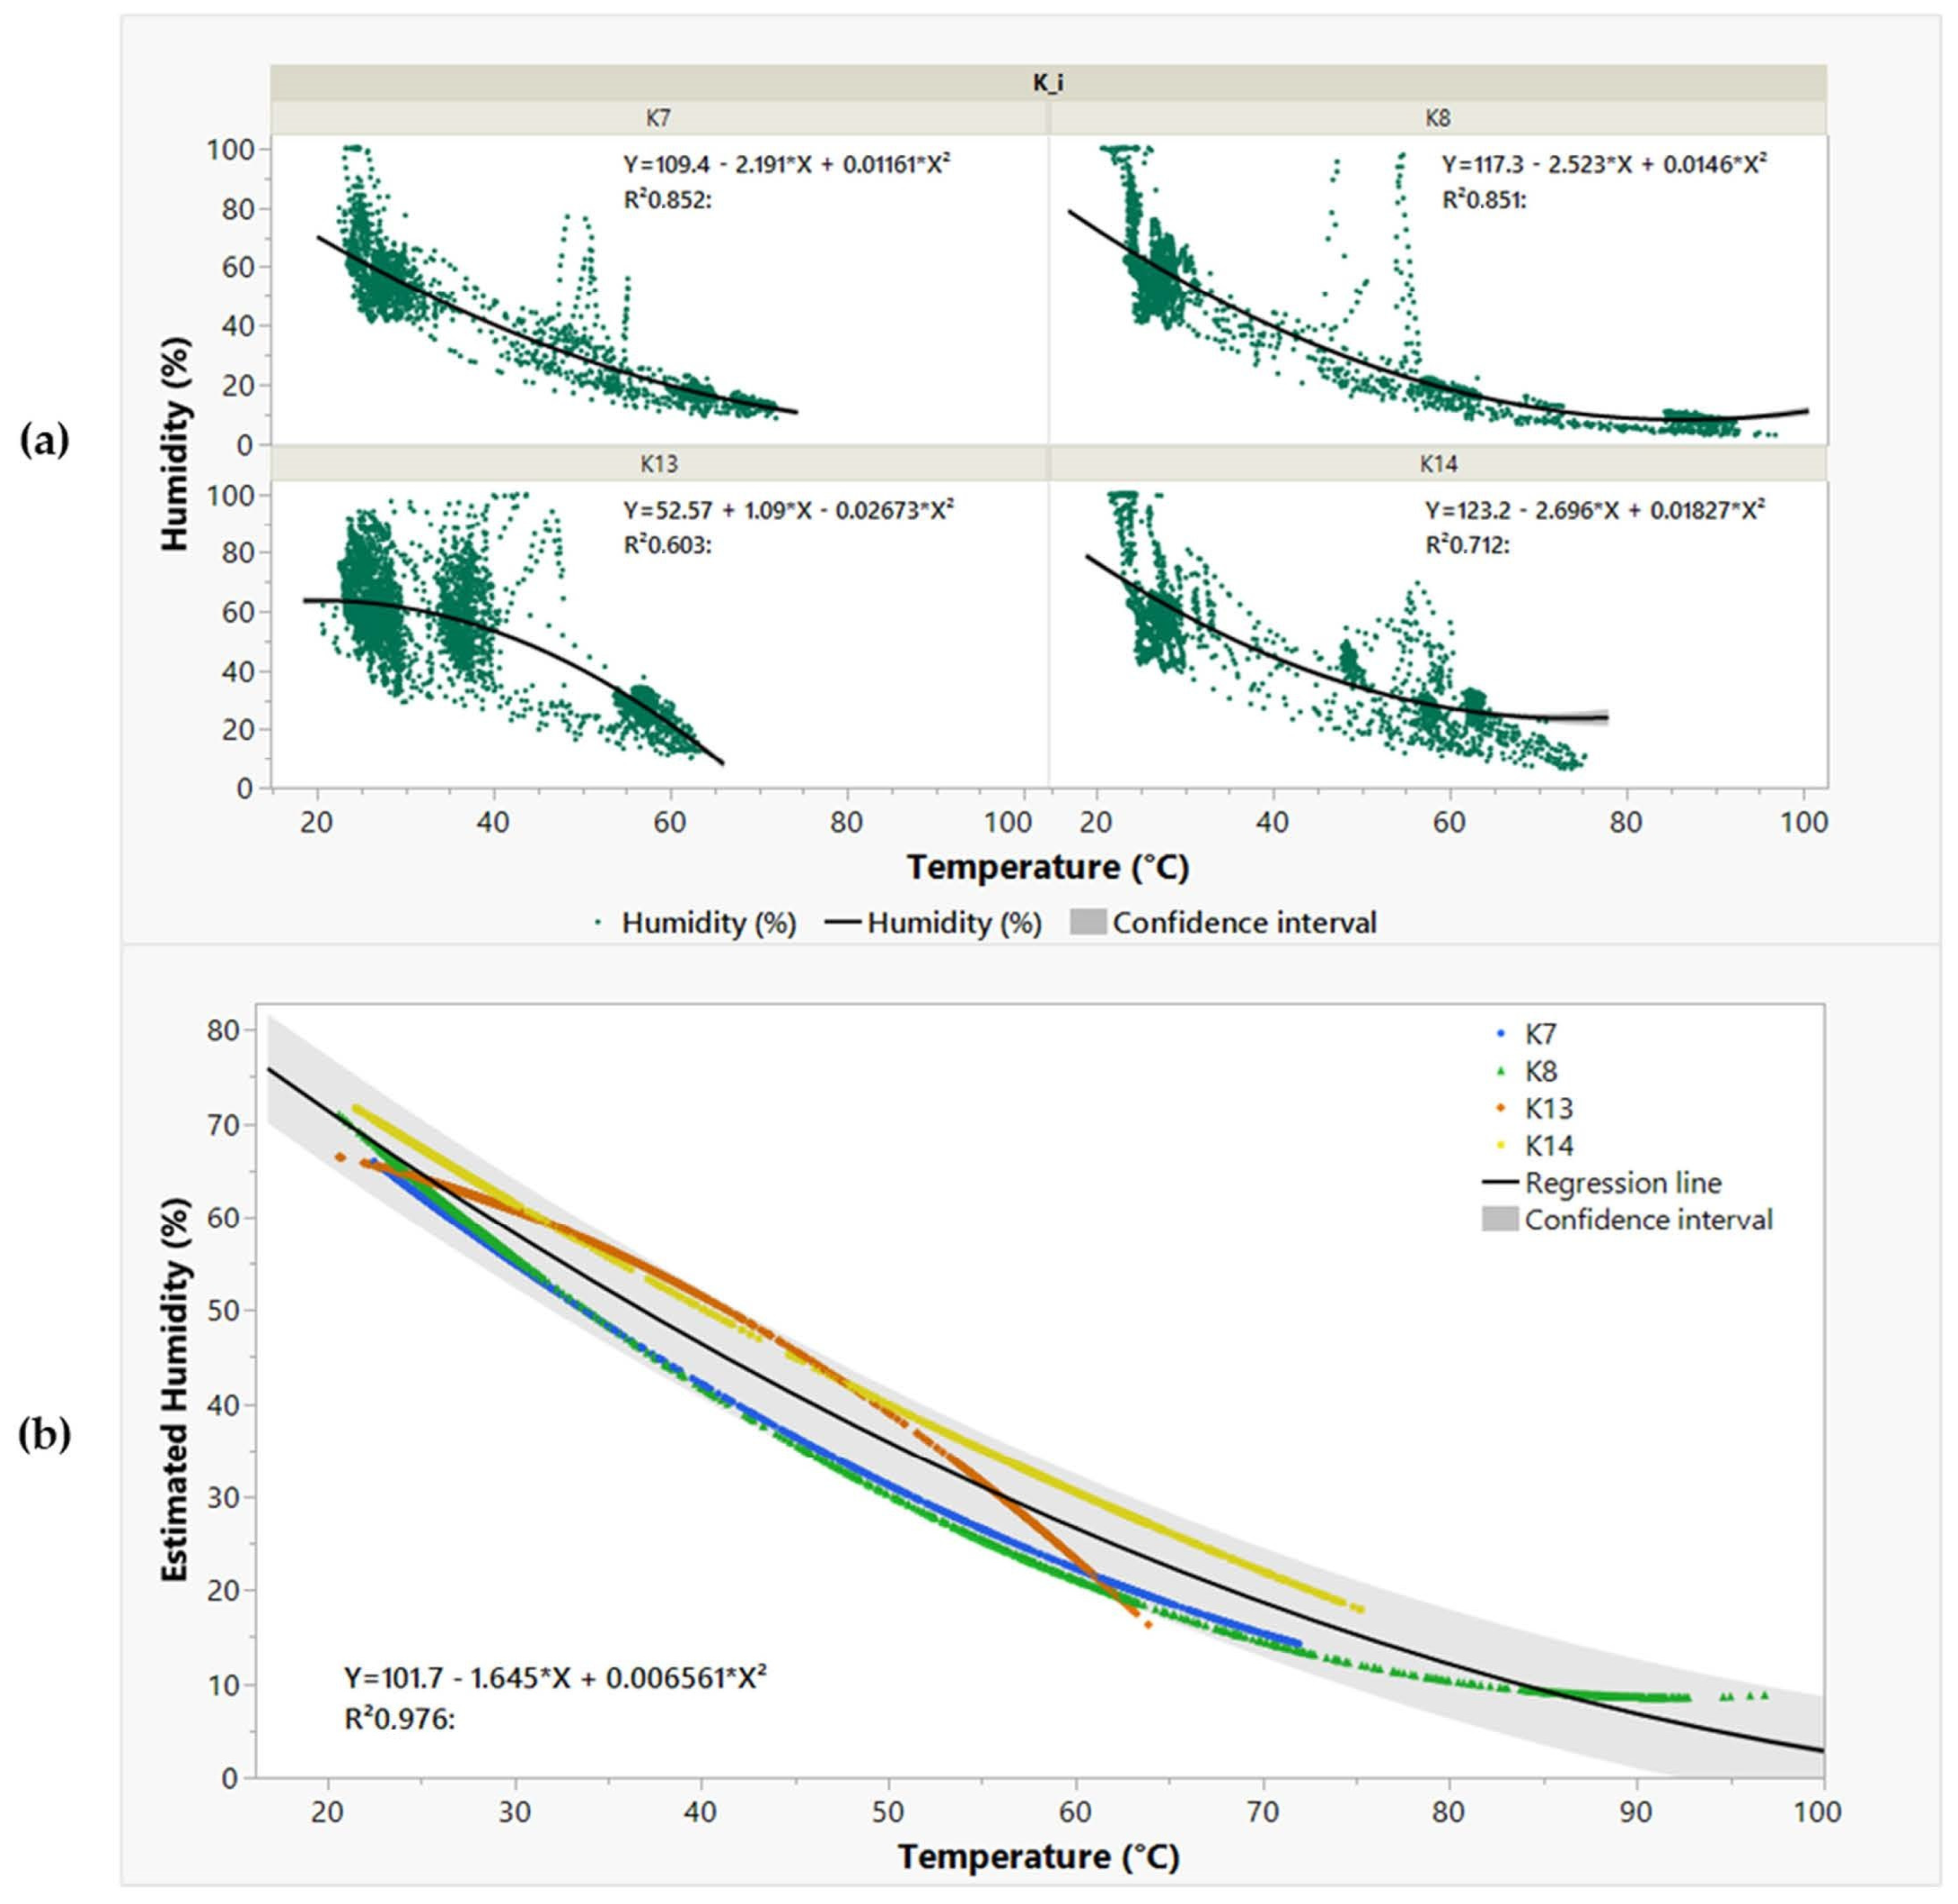
For a more detailed investigation of the correlation between kiln temperature and humidity, it was decided to study the regression lines that best correlated these parameters for each of the four sections. Figure 6 shows (a) the nonlinear (second-degree polynomial) regression lines obtained separately for each kiln, and (b) the same-order nonlinear regression line obtained overall on the four trends.
Confirming what was also highlighted by means of Pearson’s correlation index, K13 was the one that generally differed from the other three kilns and showed a regression line with concavity pointing in the opposite direction compared to the other three polynomials (Figure 6b); as a practical application of this result, it means that within a certain response range, as the ambient temperature increased, the humidity level decreased more slowly than in the other sections.
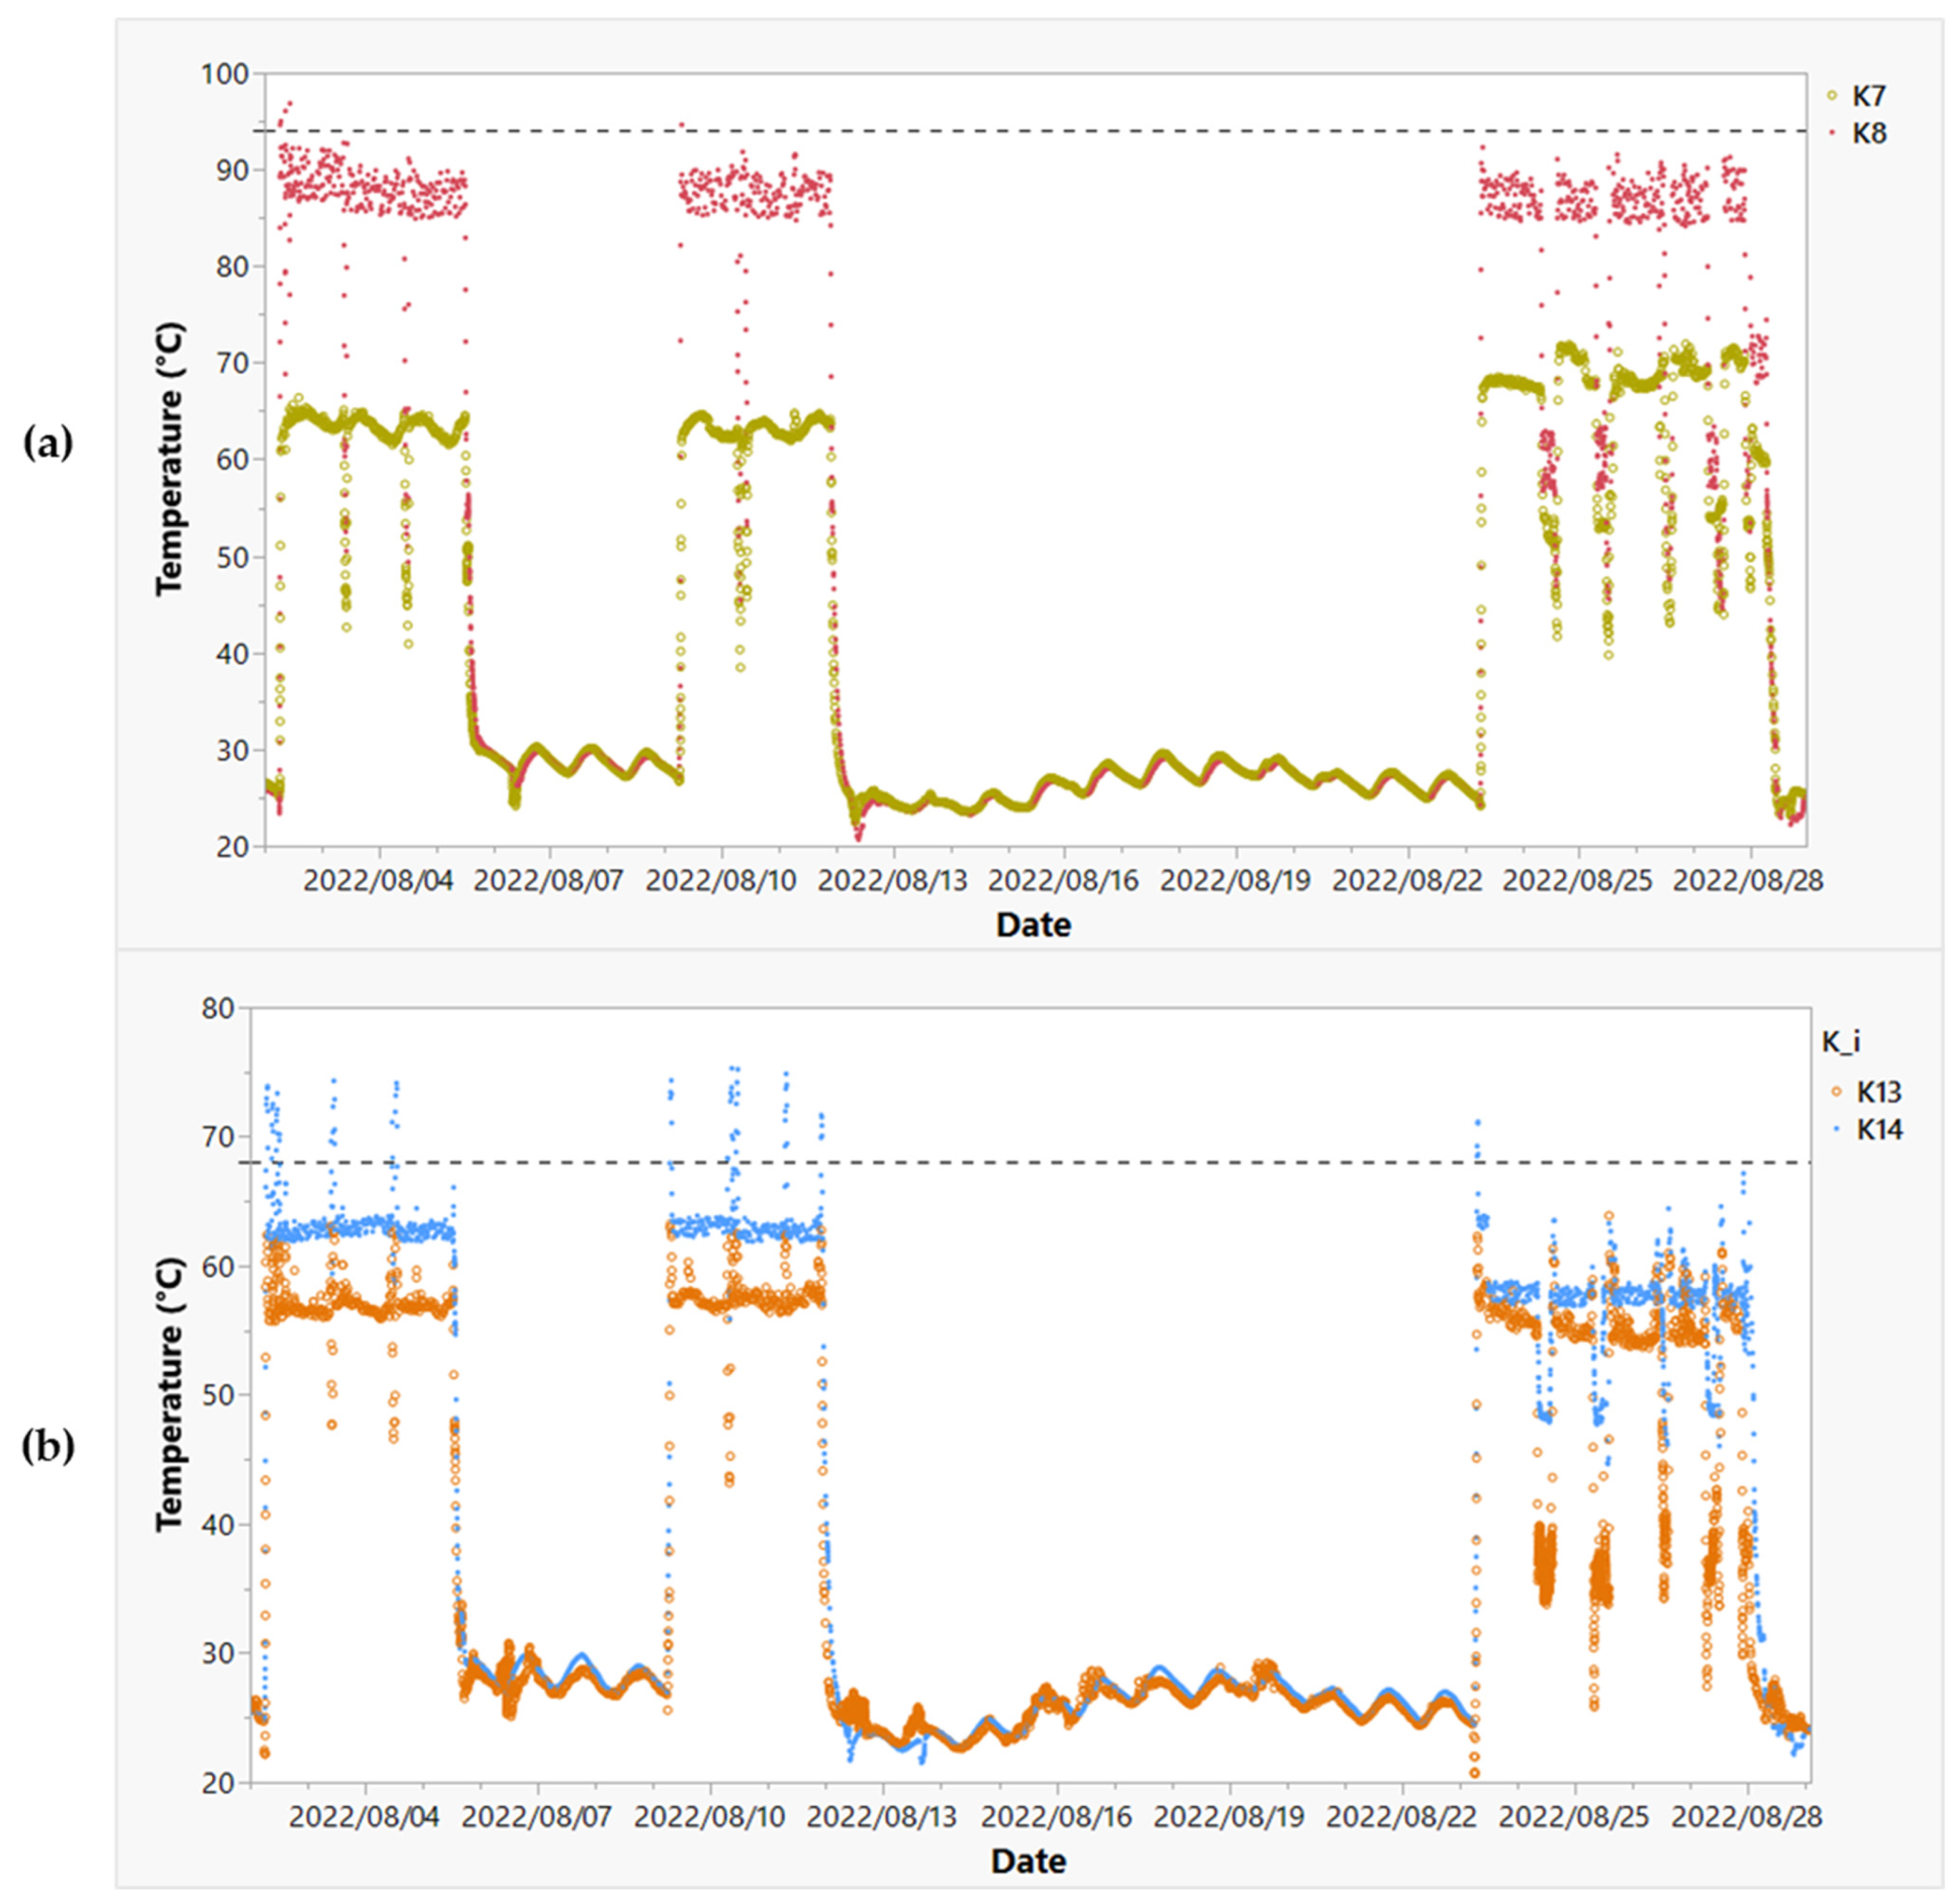
Wanting to focus on the recorded temperature values, Figure 7a,b compares in detail the temperatures recorded in the kilns with respect to the value manually set by the technical staff according to the “recipe” of dried cherry tomatoes (dashed lines).
As can be seen, the kilns never fully reach the set value, and there are differences amongst them. In particular, K7 differs the most from the set value, compared to which it is about 30% lower during production campaigns (Figure 7a), thus working at temperatures comparable to those of Process 2 (K13 and K14); on the other hand, K8, despite not operating at a temperature of 94 °C, still operates at temperatures remarkably close to the set value by maintaining itself at a level of about 90 °C (Figure 7a). In the Process 2 kilns (i.e., K13 and K14), the temperatures again are lower than the set value (68 °C), but with an approximately smaller deviation: an average difference of about 5 °C for K14 and an average difference of about 7 °C for K13 (Figure 7b).
In the humidity values, however, the comparison between the data recorded inside the kilns and those simultaneously acquired in their expulsion chimneys was interesting. For business needs, this monitoring was carried out specifically on Section 13 and Section 14, as mentioned in the Materials and Methods section. Figure 8a,b shows the time trends of the recorded moisture values.
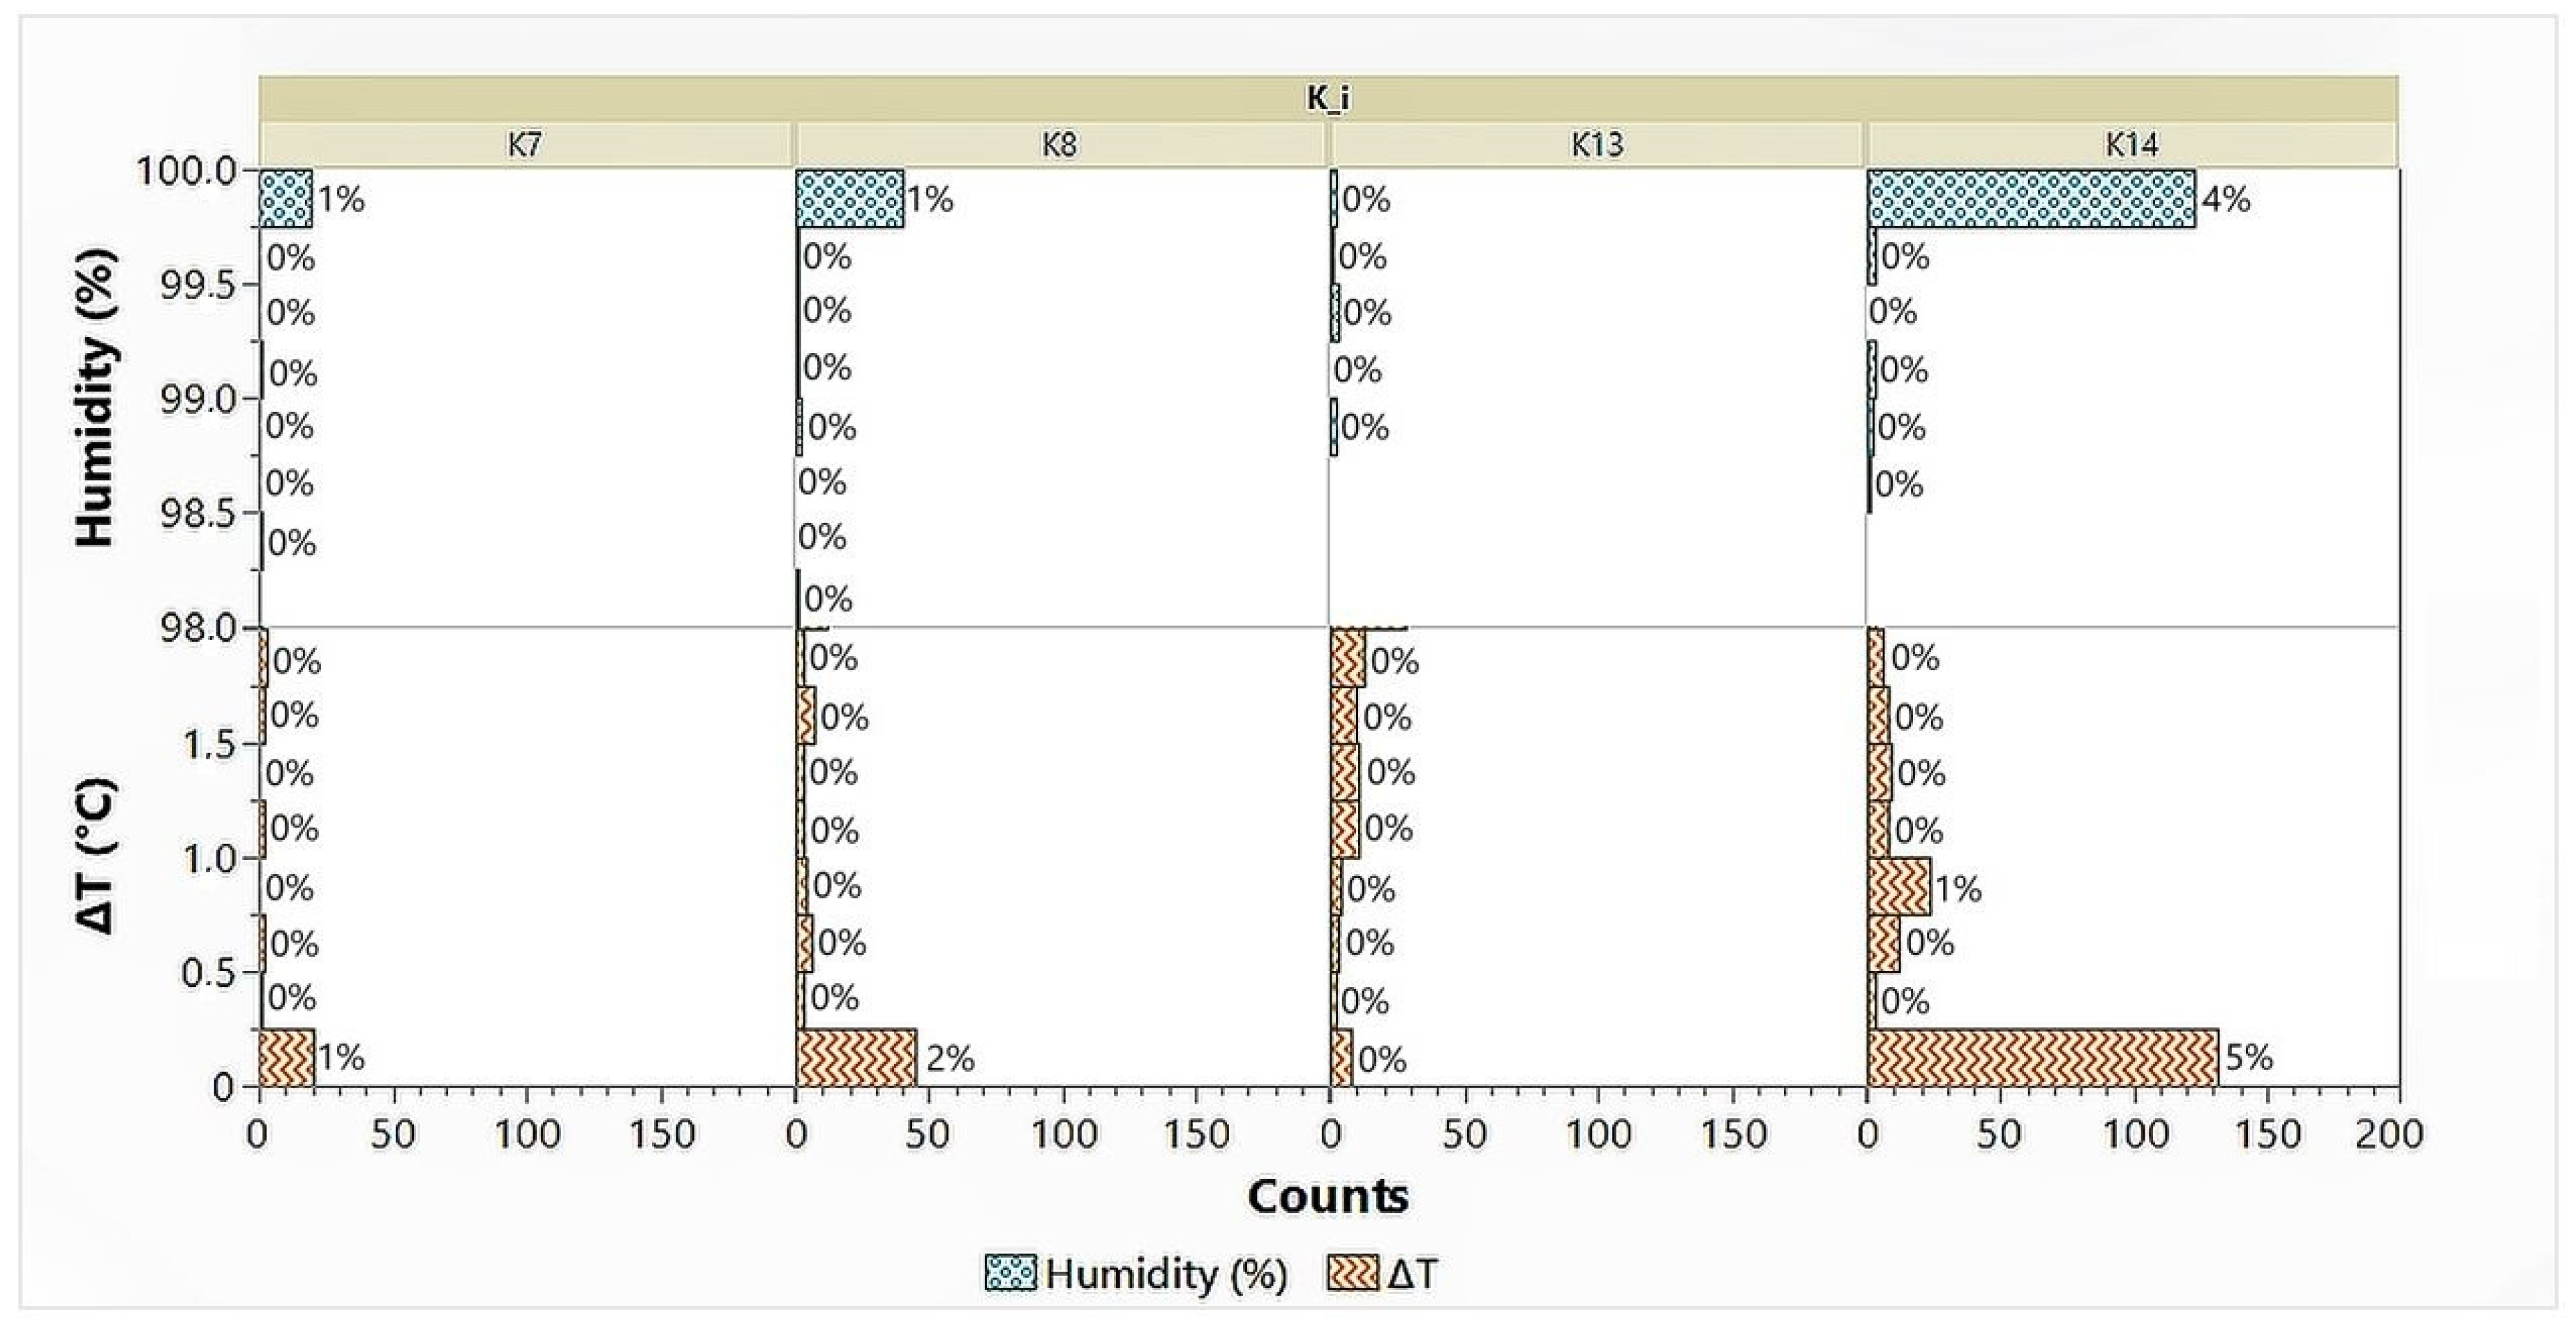
As can be seen, in both sections there was little difference between the humidity values recorded in and out, and in some places these simultaneously recorded values tended to overlap (Figure 8a,b). In general, if the humidity value recorded at the outlet (chimney) is higher than the value inside the kiln, this represents a sign that the exhausted air is being properly extruded; to be precise, when speaking of “exhausted air” we refer to that hot air with a higher vapor content than the air inside the kiln, which has a lower capacity to transfer the energy required to fulfil the drying process (from a thermohygrometric point of view). This does not seem to be the case in Section 13, where there was a tendency to record slightly lower humidity values at the outlet than inside the kiln (Figure 8a); this result may be indicative of a lower efficiency of the exhaust air extraction systems in that section. On the other hand, regarding kiln 14 (Figure 8b), an initial analysis of the moisture content trend suggested that this section was more effective in removing internal moisture than K13 (exit moisture level from the chimney > internal kiln moisture level). However, this apparent result was later contradicted by subsequent analyses, which involved the ΔT parameter. As previously described in the Materials and Methods section, since it represents the difference between measured temperature and dew point, values of ΔT close to 0 °C suggest the formation of liquid aggregates on the surfaces in contact with water vapor, and consequently also on the pieces of vegetables that eventually run on the belt. Figure 9 shows the distributions of moisture and ΔT values within the four kilns, with a particular focus on specific classes of values. In particular, we wanted to investigate the occurrence of two specific events: (i) vapor-saturated environment when the recorded humidity value is close to 100%, and (ii) the possibility of liquid aggregate formation on surfaces at the interface with moist air whenever ΔT is close to 0 °C. The analysis did not include the chimneys in Section 13 and Section 14 because the events strictly investigated the air in contact with the vegetables inside the kilns, i.e., the risk that pieces of vegetables could emerge ‘wet’ from the sections.
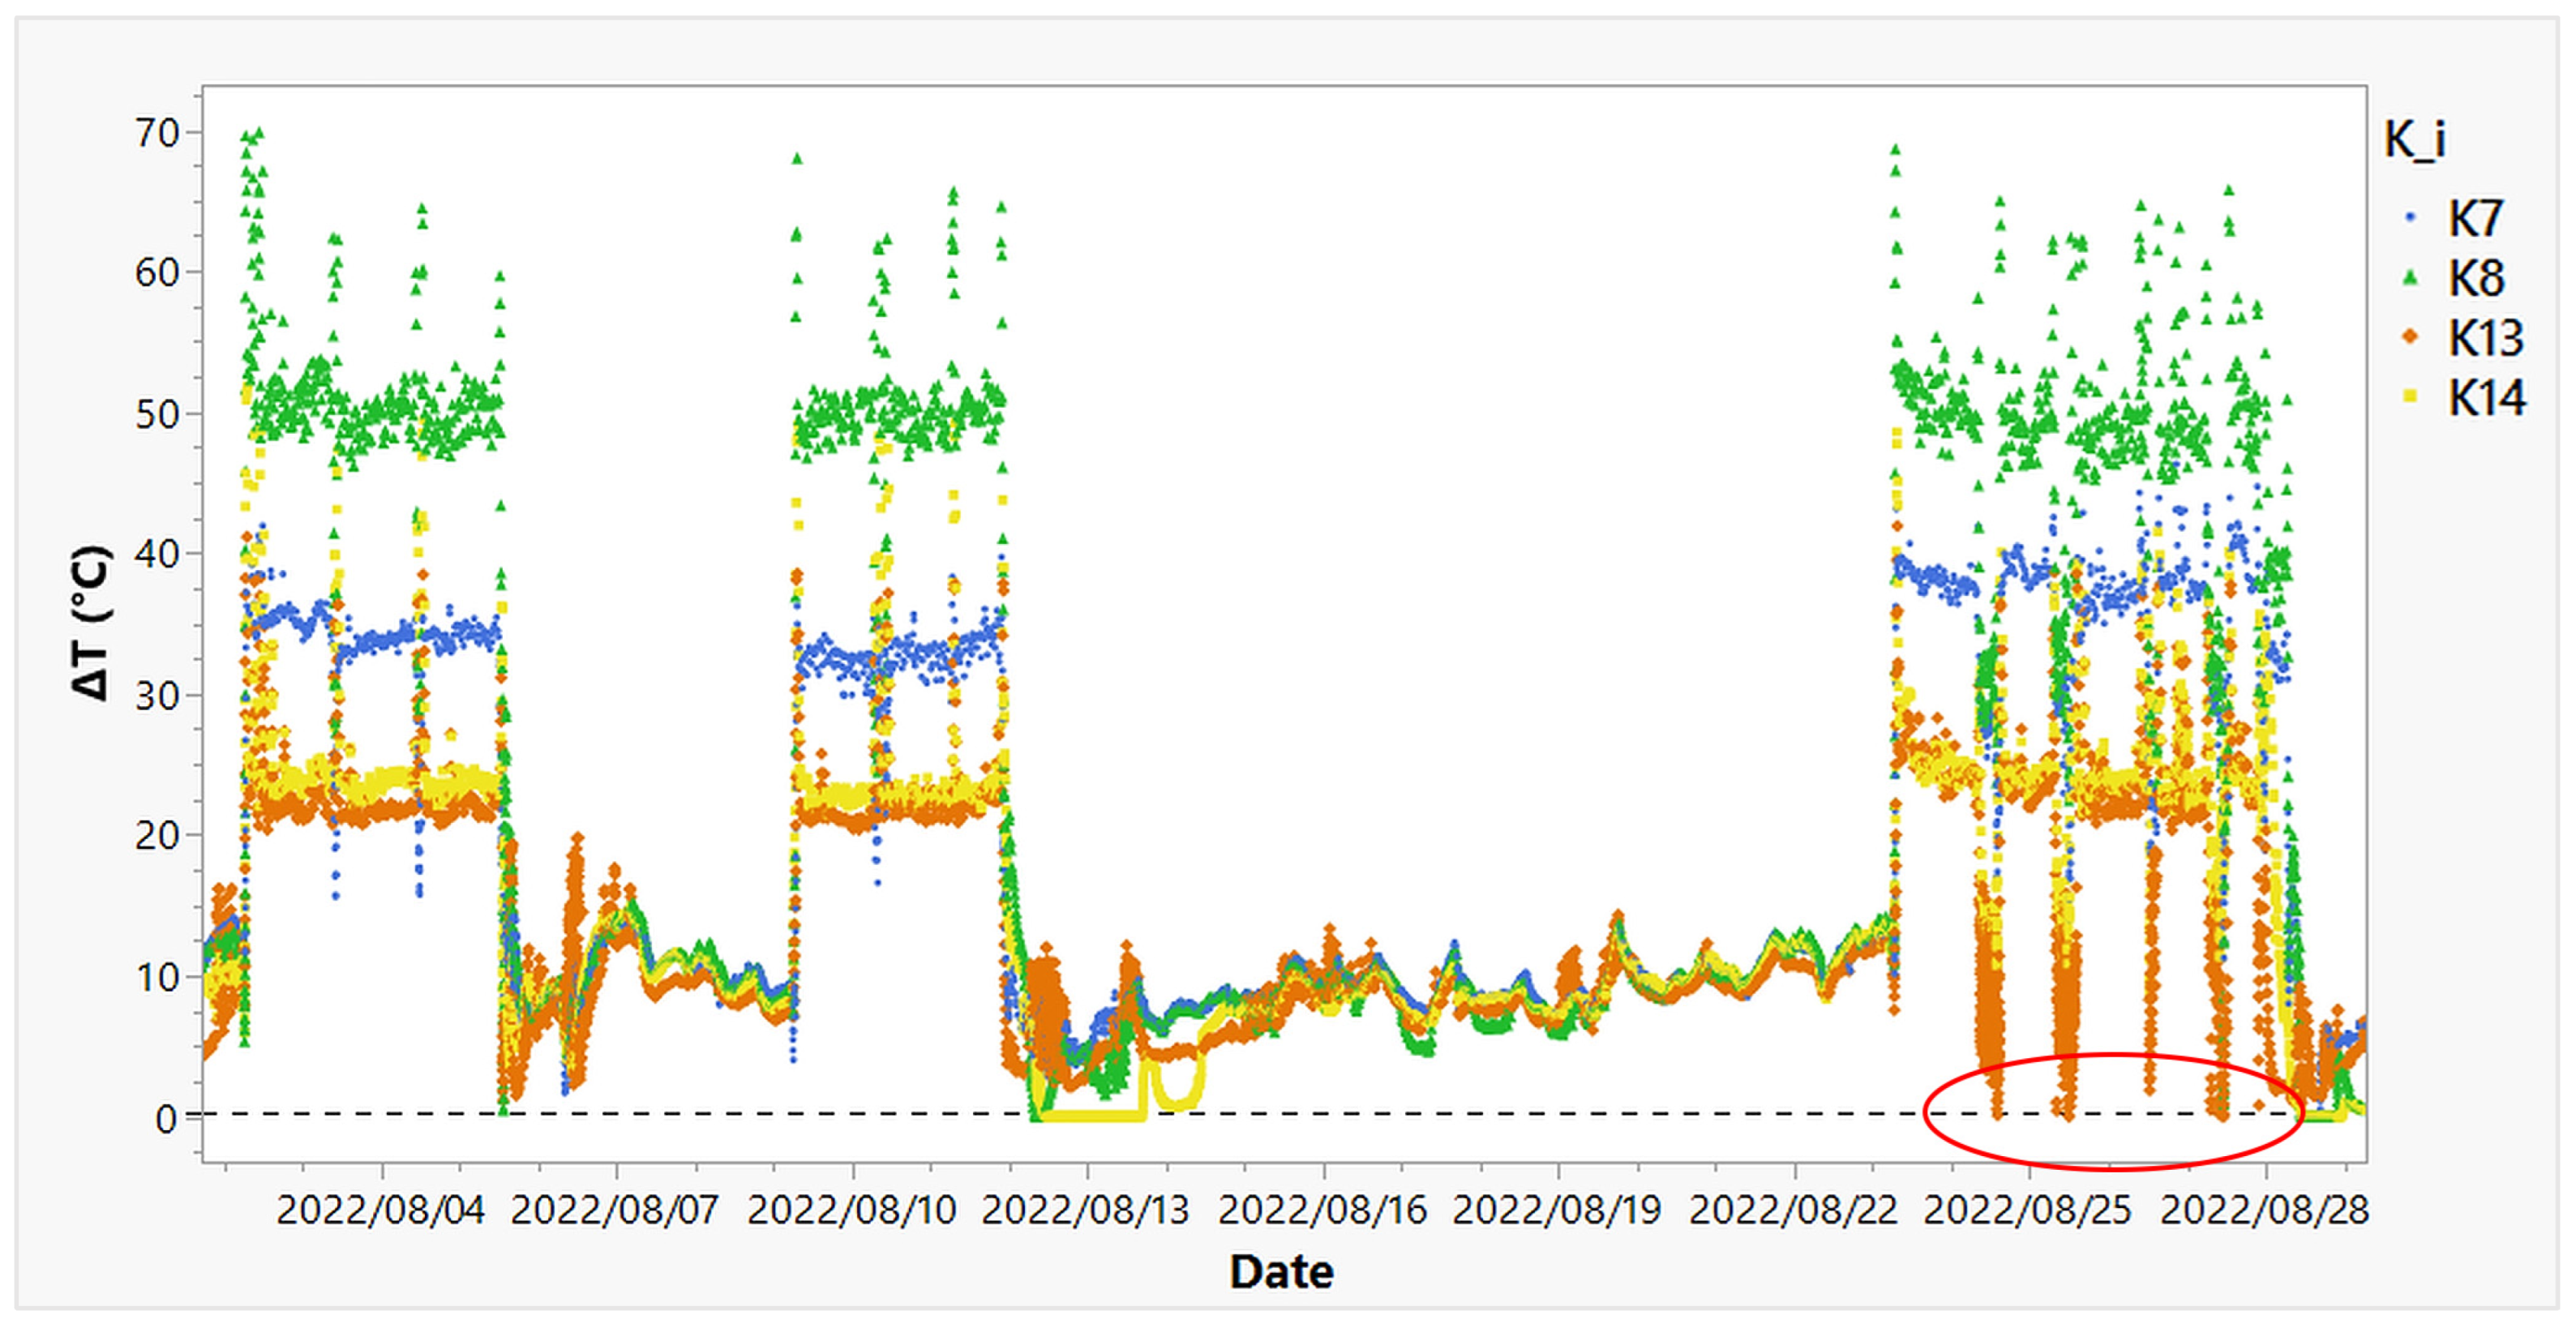
As can be seen from the graph, of the four kilns, number 14 is the one that returned a higher frequency of the occurrence of these events over time. However, the study of the distribution of these values alone did not contain the information of when these events occurred. Figure 10 shows the time trend of the parameter ΔT during the production campaigns.
Noting that ΔT is directly proportional to the recorded temperature, it was observed that during the first two campaigns, the parameter usually reached 0 °C only at times when the kilns were turned off, i.e., during any maintenance phases between campaigns. However, observation of the third production campaign revealed the occurrence of these events even during the tomato’s treatment. This evaluation is very important, because it makes it possible to ascertain whether hygrometric anomalies occur during the drying operations, and therefore whether from this point of view the system guarantees the passage between one section and the products that are always dry, without risking the performance of the production process. In this case, the analysis of the parameter clearly revealed the occurrence of anomalous conditions in K14, probably due to the concomitance of factors that reduced the extraction capacity of the exhausted air from the chimney of that section, which may have required greater efforts in terms of energy demand to adapt the quality of the dried tomatoes to the company’s standards.
The observations of this study lets us conclude that if solutions exist to improve the FARRIS production process in comparison to its current state, consideration must be given to the introduction of further innovative technologies aimed at making the dehydration of fruit and vegetables a more efficient and energy-sustainable process. Most of the applications currently being investigated, implemented, and tested emphasize the use of renewable energy sources, including solar energy, geothermal energy, and the use of hybrid biofuels [63,64,65,66,67]. Yet, these studies focus strongly on the design of ex-novo innovative technologies that can be introduced in developing countries as a way to support their manufacturing activities and to encourage local populations to adopt safer eating habits in terms of hygiene and health [20,68]. By contrast, in the case of FARRIS, it is about working on production lines and machineries that are large-scale and, above all, already existing and operating at full capacity. This results in more invasive intervention from a practical point of view, which limits the range of optimization opportunities available to the company. Other studies suggest the introduction of microwaves in the production process as a strategy to speed up the water evaporation process with a lower energy impact [69,70,71]; however, microwaves have a different impact on the structure of plant products, risking the alteration of structural and organoleptic properties that a final product should preserve [72].
The analysis conducted on the data collected so far with the monitoring system appropriately created for this project, highlighted, among the critical points, the possibility of improving the way in which exhaust air is extracted from the drying kilns to avoid the occurrence of the inefficiency phenomena, such as the one reported for K14 (risk of liquid deposition on the products). In light of all the considerations made so far, it should be emphasized that, in the context of this company’s production line, the sections are equipped with simple chimneys for the expulsion of exhaust air; therefore, they do not, for example, have fans or other electromechanical forced-suction systems. While the adoption of forced extraction systems in the production line may initially constitute an extra element of energy consumption, it could also improve the performance of the drying process, potentially reducing the time needed to complete production campaigns, and consequently reduce energy consumption in the long run. Similarly, being able to obtain a product with the current quality characteristics in less time also offers the possibility of processing more product in the duration of a production campaign, thus increasing the company’s revenues.

4. Conclusions

The aim of this paper was to show, as part of the OTTORTO R&D project, the results of a technological innovation path serving a company operating in the drying of fruit and vegetable products sector.
The research began with a study of the drying process and the identification of temperature and humidity as the main variables in the production process. As a result, a customized monitoring system capable of withstanding high temperatures was developed to monitor temperature and humidity measurements in real time from specific points along the production line. To enable the company’s technical staff and stakeholders to take advantage of the data collected, the smart system was programmed to send this data to a web-based platform called M.E.T (url in the Signal Processing section).
Statistical analysis was conducted on the monitoring data collected during three dried tomato production campaigns in August 2022. The data revealed specific correlations, including an inverse relationship between operating temperature and humidity of the drying air. The study also identified areas where thermohygrometric fluctuations were most significant (K13 and K14) and potential criticalities in the ability to remove moist air from the interior of the kilns.
Overall, this research highlights the benefits of using smart devices for collecting operational big data from production processes, which can provide valuable insights for managers to optimize production and maximize earnings. By identifying potential issues early on, optimization interventions can be implemented before they become significant obstacles.

Author Contributions

Conceptualization, A.S., M.S., G.M. and C.L.; methodology, A.S., C.L. and M.R.D.C.; software, A.S., A.M. and G.D.S.; validation, A.S., C.V. and A.M.; formal analysis, A.S. and M.R.D.C.; investigation, A.S., M.P., G.P. and C.L.; resources, A.S., M.S., G.M., M.P. and G.P.; data curation, A.S. and M.R.D.C.; writing—original draft preparation, A.S., C.V. and M.R.D.C.; writing—review and editing, C.L. and M.R.D.C.; visualization, A.S. and M.R.D.C.; supervision, M.S., G.M., M.P. and C.L.; project administration, A.S., C.L. and M.R.D.C. All authors have read and agreed to the published version of the manuscript.

Funding

This research received no external funding.

Data Availability Statement

The data presented in this study are available on request from the corresponding author. The data are not publicly available due to industrial privacy regulations.

Acknowledgments

The authors would like to thank the Company FARRIS s.r.l. for supporting the monitoring activities and sharing valuable practical information for the purpose of scientific research. Moreover, we also would like to thank the innovative startup Mint s.r.l. for its technical support in the realization of the smart devices involved in the monitoring activities. Finally, the research results pertaining to the design and testing of monitoring systems are closely linked to the research activities of the GLASS project, led by M.R.d. (PI) and C.L. (Co-PI) at the DiSTABiF Department of the University of Campania Luigi Vanvitelli.

Conflicts of Interest

The authors declare no conflict of interest.

References

  1. Jideani, A.I.; Silungwe, H.; Takalani, T.; Omolola, A.O.; Udeh, H.O.; Anyasi, T.A. Antioxidant-rich natural fruit and vegetable products and human health. Int. J. Food Prop. 2021, 24, 41–67. [Google Scholar] [CrossRef]
  2. Bustos, A.Y.; Font, G.; Taranto, M.P. Fruits and vegetables snacks as carriers of probiotics and bioactive compounds: A review. Int. J. Food Sci. Technol. 2023, 58, 3211–3223. [Google Scholar] [CrossRef]
  3. Iovinella, M.; Lombardo, F.; Ciniglia, C.; Palmieri, M.; di Cicco, M.R.; Trifuoggi, M.; Race, M.; Manfredi, C.; Lubritto, C.; Fabbricino, M.; et al. Bioremoval of Yttrium (III), Cerium (III), Europium (III), and Terbium (III) from Single and Quaternary Aqueous Solutions Using the Extremophile Galdieria sulphuraria (Galdieriaceae, Rhodophyta). Plants 2022, 11, 1376. [Google Scholar] [CrossRef] [PubMed]
  4. Di Cicco, M.R.; Iovinella, M.; Palmieri, M.; Lubritto, C.; Ciniglia, C. Extremophilic Microalgae Galdieria Gen. for Urban Wastewater Treatment: Current State, the Case of “POWER” System, and Future Prospects. Plants 2021, 10, 2343. [Google Scholar] [CrossRef]
  5. Renugadevi, K.; Nachiyar, C.V.; Sowmiya, P.; Sunkar, S. Antioxidant activity of phycocyanin pigment extracted from marine filamentous cyanobacteria Geitlerinema sp TRV57. Biocatal. Agric. Biotechnol. 2018, 16, 237–242. [Google Scholar] [CrossRef]
  6. Sydney, E.B.; Schafranski, K.; Barretti, B.R.V.; Sydney, A.C.N.; Zimmerman, J.F.D.A.; Cerri, M.L.; Mottin Demiate, I. Biomolecules from extremophile microalgae: From genetics to bioprocessing of a new candidate for large-scale production. Process Biochem. 2019, 87, 37–44. [Google Scholar] [CrossRef]
  7. Jayaraman, K.; Gupta, D.D. Drying of fruits and vegetables. In Handbook of Industrial Drying; CRC Press: Boca Raton, FL, USA, 2020; pp. 643–690. [Google Scholar]
  8. Sruthy, G.N.; Sandhya, K.R.; Kumkum, C.R.; Mythri, R.; Sharma, M. Chapter 10—Thermal processing technologies for food. In Current Developments in Biotechnology and Bioengineering; Tarafdar, A., Pandey, A., Sirohi, R., Soccol, C., Dussap, C.-G., Eds.; Elsevier: Amsterdam, The Netherlands, 2022; pp. 263–300. [Google Scholar]
  9. Hii, C.L.; Ong, S.P.; Yap, J.Y.; Putranto, A.; Mangindaan, D. Hybrid drying of food and bioproducts: A review. Dry. Technol. 2021, 39, 1554–1576. [Google Scholar] [CrossRef]
  10. Michailidis, P.A.; Krokida, M.K. Drying and Dehydration Processes in Food Preservation and Processing. Conv. Adv. Food Process. Technol. 2014, 1–32. [Google Scholar] [CrossRef]
  11. Maruyama, S.; Streletskaya, N.A.; Lim, J. Clean label: Why this ingredient but not that one? Food Qual. Prefer. 2021, 87, 104062. [Google Scholar] [CrossRef]
  12. Ranganath, K.G. Pigments that colour our fruits: An overview. Erwerbs-Obstbau 2022, 64, 535–547. [Google Scholar] [CrossRef]
  13. Yan, M.R.; Hsieh, S.; Ricacho, N. Innovative food packaging, food quality and safety, and consumer perspectives. Processes 2022, 10, 747. [Google Scholar] [CrossRef]
  14. Lang, B.; Conroy, D.M. When food governance matters to consumer food choice: Consumer perception of and preference for food quality certifications. Appetite 2022, 168, 105688. [Google Scholar]
  15. Ghufran, M.; Ali, S.; Ariyesti, F.R.; Nawaz, M.A.; Aldieri, L.; Xiaobao, P. Impact of COVID-19 to customers switching intention in the food segments: The push, pull and mooring effects in consumer migration towards organic food. Food Qual. Prefer. 2022, 99, 104561. [Google Scholar] [CrossRef]
  16. Nurhaslina, C.R.; Andi Bacho, S.; Mustapa, A.N. Review on drying methods for herbal plants. Mater. Today Proc. 2022, 63, S122–S139. [Google Scholar] [CrossRef]
  17. Igual, M.; Martínez-Monzó, J. Physicochemical Properties and Structure Changes of Food Products during Processing. Foods 2022, 11, 2365. [Google Scholar] [CrossRef]
  18. Tuly, S.S.; Mahiuddin, M.; Karim, A. Mathematical modeling of nutritional, color, texture, and microbial activity changes in fruit and vegetables during drying: A critical review. Crit. Rev. Food Sci. Nutr. 2023, 63, 1877–1900. [Google Scholar] [CrossRef]
  19. Mujumdar, A.S.; Menon, A.S. Drying of solids: Principles, classification, and selection of dryers. In Handbook of Industrial Drying; CRC Press: Boca Raton, FL, USA, 2020; pp. 1–39. [Google Scholar]
  20. Sagar, V.; Suresh Kumar, P. Recent advances in drying and dehydration of fruits and vegetables: A review. J. Food Sci. Technol. 2010, 47, 15–26. [Google Scholar] [CrossRef]
  21. Jin, X.; van der Sman, R.G.M. Interaction between large deformation and moisture transport during dehydration of vegetables. Food Struct. 2022, 32, 100269. [Google Scholar] [CrossRef]
  22. Akter, F.; Muhury, R.; Sultana, A.; Deb, U.K. A Comprehensive Review of Mathematical Modeling for Drying Processes of Fruits and Vegetables. Int. J. Food Sci. 2022, 2022, 6195257. [Google Scholar] [CrossRef]
  23. El-Mesery, H.S. Improving the thermal efficiency and energy consumption of convective dryer using various energy sources for tomato drying. Alex. Eng. J. 2022, 61, 10245–10261. [Google Scholar] [CrossRef]
  24. Du, Y.; Yang, F.; Yu, H.; Xie, Y.; Yao, W. Improving food drying performance by cold plasma pretreatment: A systematic review. Compr. Rev. Food Sci. Food Saf. 2022, 21, 4402–4421. [Google Scholar] [CrossRef] [PubMed]
  25. Osman, A.I.; Chen, L.; Yang, M.; Msigwa, G.; Farghali, M.; Fawzy, S.; Rooney, D.W.; Yap, P.-S. Cost, environmental impact, and resilience of renewable energy under a changing climate: A review. Environ. Chem. Lett. 2023, 21, 741–764. [Google Scholar] [CrossRef]
  26. Greve, H.; Lay, J.; Negrete, A. How vulnerable are small firms to energy price increases? Evidence from Mexico. Environ. Dev. Econ. 2023, 28, 89–109. [Google Scholar] [CrossRef]
  27. Yasmeen, R.; Zhang, X.; Tao, R.; Shah, W.U.H. The impact of green technology, environmental tax and natural resources on energy efficiency and productivity: Perspective of OECD Rule of Law. Energy Rep. 2023, 9, 1308–1319. [Google Scholar] [CrossRef]
  28. Chien, F.; Huang, L.; Zhao, W. The influence of sustainable energy demands on energy efficiency: Evidence from China. J. Innov. Knowl. 2023, 8, 100298. [Google Scholar] [CrossRef]
  29. Tseng, C.-J.; Chetthamrongchai, P.; Mahmudiono, T.; Sharma, S.K.; Al-Awsi, G.R.L.; Abed, S.A.; Mohammed, F.; Opulencia, M.J.C.; Rudiansyah, M. Sustainability assessment of food industry with the approach of water, energy and food nexus. Food Sci. Technol. 2022, 42, e37922. [Google Scholar] [CrossRef]
  30. Bradu, P.; Biswas, A.; Nair, C.; Sreevalsakumar, S.; Patil, M.; Kannampuzha, S.; Mukherjee, A.G.; Wanjari, U.R.; Renu, K.; Vellingiri, B. Recent advances in green technology and Industrial Revolution 4.0 for a sustainable future. Environ. Sci. Pollut. Res. 2022, 1–32. [Google Scholar] [CrossRef]
  31. Morrissey, J.; Heidkamp, P. Sustainability after COVID-19: Pillars for a just transition. Environ. Sustain. 2022, 5, 261–269. [Google Scholar] [CrossRef]
  32. Di Cicco, M.R.; Palmieri, M.; Altieri, S.; Ciniglia, C.; Lubritto, C. Cultivation of the Acidophilic Microalgae Galdieria phlegrea with Wastewater: Process Yields. Int. J. Environ. Res. Public Health 2021, 18, 2291. [Google Scholar] [CrossRef]
  33. Sirakov, M.; Palmieri, M.; Iovinella, M.; Davis, S.J.; Petriccione, M.; di Cicco, M.R.; De Stefano, M.; Ciniglia, C. Cyanidiophyceae (Rhodophyta) Tolerance to Precious Metals: Metabolic Response to Palladium and Gold. Plants 2021, 10, 2367. [Google Scholar] [CrossRef]
  34. Yadav, V.; Sarker, A.; Yadav, A.; Miftah, A.O.; Bilal, M.; Iqbal, H.M. Integrated biorefinery approach to valorize citrus waste: A sustainable solution for resource recovery and environmental management. Chemosphere 2022, 293, 133459. [Google Scholar] [CrossRef] [PubMed]
  35. Devi, C.; Khwairakpam, M. Resource recovery and value addition of terrestrial weeds through vermicomposting. In Advanced Organic Waste Management; Elsevier: Amsterdam, The Netherlands, 2022; pp. 155–175. [Google Scholar]
  36. Paunov, C.; Planes-Satorra, S. How are digital technologies changing innovation?: Evidence from agriculture, the automotive industry and retail. OECD Sci. Technol. Ind. Policy Pap. 2019, 74. [Google Scholar] [CrossRef]
  37. Vetromile, C.; Spagnuolo, A.; Petraglia, A.; Masiello, A.; di Cicco, M.R.; Lubritto, C. Pre- and post-operam comparison of the energy consumption of a radio base station under energy efficiency actions. Energy Build. 2021, 236, 110772. [Google Scholar] [CrossRef]
  38. Di Cicco, M.R.; Masiello, A.; Spagnuolo, A.; Vetromile, C.; Borea, L.; Giannella, G.; Iovinella, M.; Lubritto, C. Real-Time Monitoring and Static Data Analysis to Assess Energetic and Environmental Performances in the Wastewater Sector: A Case Study. Energies 2021, 14, 6948. [Google Scholar] [CrossRef]
  39. Spagnuolo, A.; De Santo, G.; Vetromile, C.; Masiello, A.; Di Costanzo, P.; Esposito, S.; Buono, U.; di Cicco, M.R.; Lubritto, C. Characterizing passenger-ship emissions: Towards improved sustainability for MedMar fleet (gulf of Naples). Energy Effic. 2022, 15, 55. [Google Scholar] [CrossRef]
  40. Di Cicco, M.R.; Spagnuolo, A.; Masiello, A.; Vetromile, C.; Nappa, M.; Lubritto, C. Energetic and environmental analysis of a wastewater treatment plant through static and dynamic monitoring activities. Int. J. Environ. Sci. Technol. 2020, 17, 4299–4312. [Google Scholar] [CrossRef]
  41. Di Cicco, M.R.; Spagnuolo, A.; Masiello, A.; Vetromile, C.; Nappa, M.; Corbo, G.; Lubritto, C. Assessing energy performance and critical issues of a large wastewater treatment plant through full-scale data benchmarking. Water Sci. Technol. 2019, 80, 1421–1429. [Google Scholar] [CrossRef]
  42. Di Cicco, M.R.; Spagnuolo, A.; Masiello, A.; Vetromile, C.; Nappa, M.; Corbo, G.; Lubritto, C. Energy Monitoring of a Wastewater Treatment Plant in Salerno, Campania Region (Southern Italy). In Frontiers in Water-Energy-Nexus—Nature-Based Solutions, Advanced Technologies and Best Practices for Environmental Sustainability, Proceedings of the 2nd WaterEnergyNEXUS Conference, November 2018, Salerno, Italy, 19 September 2019; Springer: Cham, Switzerland, 2020. [Google Scholar]
  43. Bermeo-Ayerbe, M.A.; Ocampo-Martinez, C.; Diaz-Rozo, J. Data-driven energy prediction modeling for both energy efficiency and maintenance in smart manufacturing systems. Energy 2022, 238, 121691. [Google Scholar] [CrossRef]
  44. Nižetić, S.; Djilali, N.; Papadopoulos, A.; Rodrigues, J.J.P.C. Smart technologies for promotion of energy efficiency, utilization of sustainable resources and waste management. J. Clean. Prod. 2019, 231, 565–591. [Google Scholar] [CrossRef]
  45. Ahmad, T.; Zhang, D.; Huang, C.; Zhang, H.; Dai, N.; Song, Y.; Chen, H. Artificial intelligence in sustainable energy industry: Status Quo, challenges and opportunities. J. Clean. Prod. 2021, 289, 125834. [Google Scholar] [CrossRef]
  46. Meng, Y.; Yang, Y.; Chung, H.; Lee, P.-H.; Shao, C. Enhancing sustainability and energy efficiency in smart factories: A review. Sustainability 2018, 10, 4779. [Google Scholar] [CrossRef]
  47. Aslam, W.; Soban, M.; Akhtar, F.; Zaffar, N.A. Smart meters for industrial energy conservation and efficiency optimization in Pakistan: Scope, technology and applications. Renew. Sustain. Energy Rev. 2015, 44, 933–943. [Google Scholar] [CrossRef]
  48. Liu, Z.; Xie, K.; Li, L.; Chen, Y. A paradigm of safety management in Industry 4.0. Syst. Res. Behav. Sci. 2020, 37, 632–645. [Google Scholar] [CrossRef]
  49. Ghoreishi, M.; Happonen, A. The Case of Fabric and Textile Industry: The Emerging Role of Digitalization, Internet-of-Things and Industry 4.0 for Circularity. In Proceedings of the Sixth International Congress on Information and Communication Technology, London, UK, 25–26 February 2021; Springer: Singapore, 2022; pp. 189–200. [Google Scholar]
  50. Pe’er, G.; Bonn, A.; Bruelheide, H.; Dieker, P.; Eisenhauer, N.; Feindt, P.H.; Hagedorn, G.; Hansjürgens, B.; Herzon, I.; Lomba, Â.; et al. Action needed for the EU Common Agricultural Policy to address sustainability challenges. People Nat. 2020, 2, 305–316. [Google Scholar] [CrossRef] [PubMed]
  51. Farooq, M.S.; Riaz, S.; Abid, A.; Umer, T.; Zikria, Y.B. Role of IoT Technology in Agriculture: A Systematic Literature Review. Electronics 2020, 9, 319. [Google Scholar] [CrossRef]
  52. Farooq, M.S.; Riaz, S.; Abid, A.; Abid, K.; Naeem, M.A. A Survey on the Role of IoT in Agriculture for the Implementation of Smart Farming. IEEE Access 2019, 7, 156237–156271. [Google Scholar] [CrossRef]
  53. Quy, V.K.; Hau, N.V.; Anh, D.V.; Quy, N.M.; Ban, N.T.; Lanza, S.; Randazzo, G.; Muzirafuti, A. IoT-Enabled Smart Agriculture: Architecture, Applications, and Challenges. Appl. Sci. 2022, 12, 3396. [Google Scholar] [CrossRef]
  54. Tapakire, B.A.; Patil, M.M. Iot based smart agriculture using thingspeak. Int. J. Eng. Res. Technol. 2019, 8, 270–274. [Google Scholar]
  55. Antony, A.P.; Leith, K.; Jolley, C.; Lu, J.; Sweeney, D.J. A review of practice and implementation of the internet of things (IoT) for smallholder agriculture. Sustainability 2020, 12, 3750. [Google Scholar] [CrossRef]
  56. Tao, W.; Zhao, L.; Wang, G.; Liang, R. Review of the internet of things communication technologies in smart agriculture and challenges. Comput. Electron. Agric. 2021, 189, 106352. [Google Scholar] [CrossRef]
  57. Shulla, K.; Filho, W.L.; Lardjane, S.; Sommer, J.H.; Borgemeister, C. Sustainable development education in the context of the 2030 Agenda for sustainable development. Int. J. Sustain. Dev. World Ecol. 2020, 27, 458–468. [Google Scholar] [CrossRef]
  58. Fellows, P.J. Food Processing Technology: Principles and Practice; Woodhead Publishing: Sawston, UK, 2022. [Google Scholar]
  59. Joardder, M.U.; Mourshed, M.; Masud, M.H. State of Bound Water: Measurement and Significance in Food Processing; Springer: Berlin/Heidelberg, Germany, 2019. [Google Scholar]
  60. Anandharamakrishnan, C. Introduction to drying. In Handbook of Drying for Dairy Products; Wiley Online Library: Hoboken, NJ, USA, 2017; pp. 1–14. [Google Scholar] [CrossRef]
  61. Qasem, S.N.; Samadianfard, S.; Sadri Nahand, H.; Mosavi, A.; Shamshirband, S.; Chau, K.-W. Estimating daily dew point temperature using machine learning algorithms. Water 2019, 11, 582. [Google Scholar] [CrossRef]
  62. Muñoz-García, M.A.; Moreda, G.P.; Raga-Arroyo, M.P.; Marín-González, O. Water harvesting for young trees using Peltier modules powered by photovoltaic solar energy. Comput. Electron. Agric. 2013, 93, 60–67. [Google Scholar] [CrossRef]
  63. Ambriz-Díaz, V.M.; Rubio-Maya, C.; Pacheco Ibarra, J.J.; Galván González, S.R.; Martínez Patiño, J. Analysis of a sequential production of electricity, ice and drying of agricultural products by cascading geothermal energy. Int. J. Hydrog. Energy 2017, 42, 18092–18102. [Google Scholar] [CrossRef]
  64. Kumar, A.; Singh, K.U.; Singh, M.K.; Kushwaha, A.K.S.; Kumar, A.; Mahato, S. Design and Fabrication of Solar Dryer System for Food Preservation of Vegetables or Fruit. J. Food Qual. 2022, 2022, 6564933. [Google Scholar] [CrossRef]
  65. Natarajan, S.K.; Elangovan, E.; Elavarasan, R.M.; Balaraman, A.; Sundaram, S. Review on solar dryers for drying fish, fruits, and vegetables. Environ. Sci. Pollut. Res. 2022, 29, 40478–40506. [Google Scholar] [CrossRef]
  66. Dongmo, M.; Aloyem Kaze, C.V.; Sayouba, J.P.D. Design and construction of a hybrid gas and biogas dryer for fruits, vegetables, meat and fish. E3S Web Conf. 2022, 354, 03008. [Google Scholar] [CrossRef]
  67. Gopinath, G.R.; Muthuvel, S.; Muthukannan, M.; Sudhakarapandian, R.; Praveen Kumar, B.; Santhan Kumar, C.; Thanikanti, S.B. Design, development, and performance testing of thermal energy storage based solar dryer system for seeded grapes. Sustain. Energy Technol. Assess. 2022, 51, 101923. [Google Scholar] [CrossRef]
  68. Wakjira, M. Solar drying of fruits and windows of opportunities in Ethiopia. Afr. J. Food Sci. 2010, 4, 790–802. [Google Scholar]
  69. Funebo, T.; Ohlsson, T. Microwave-assisted air dehydration of apple and mushroom. J. Food Eng. 1998, 38, 353–367. [Google Scholar] [CrossRef]
  70. Ekezie, F.-G.C.; Sun, D.-W.; Han, Z.; Cheng, J.-H. Microwave-assisted food processing technologies for enhancing product quality and process efficiency: A review of recent developments. Trends Food Sci. Technol. 2017, 67, 58–69. [Google Scholar] [CrossRef]
  71. Duan, X.; Zhang, M.; Mujumdar, A.; Wang, R. Trends in microwave-assisted freeze drying of foods. Dry. Technol. 2010, 28, 444–453. [Google Scholar] [CrossRef]
  72. Zhang, M.; Jiang, H.; Lim, R.-X. Recent developments in microwave-assisted drying of vegetables, fruits, and aquatic products—Drying kinetics and quality considerations. Dry. Technol. 2010, 28, 1307–1316. [Google Scholar] [CrossRef]
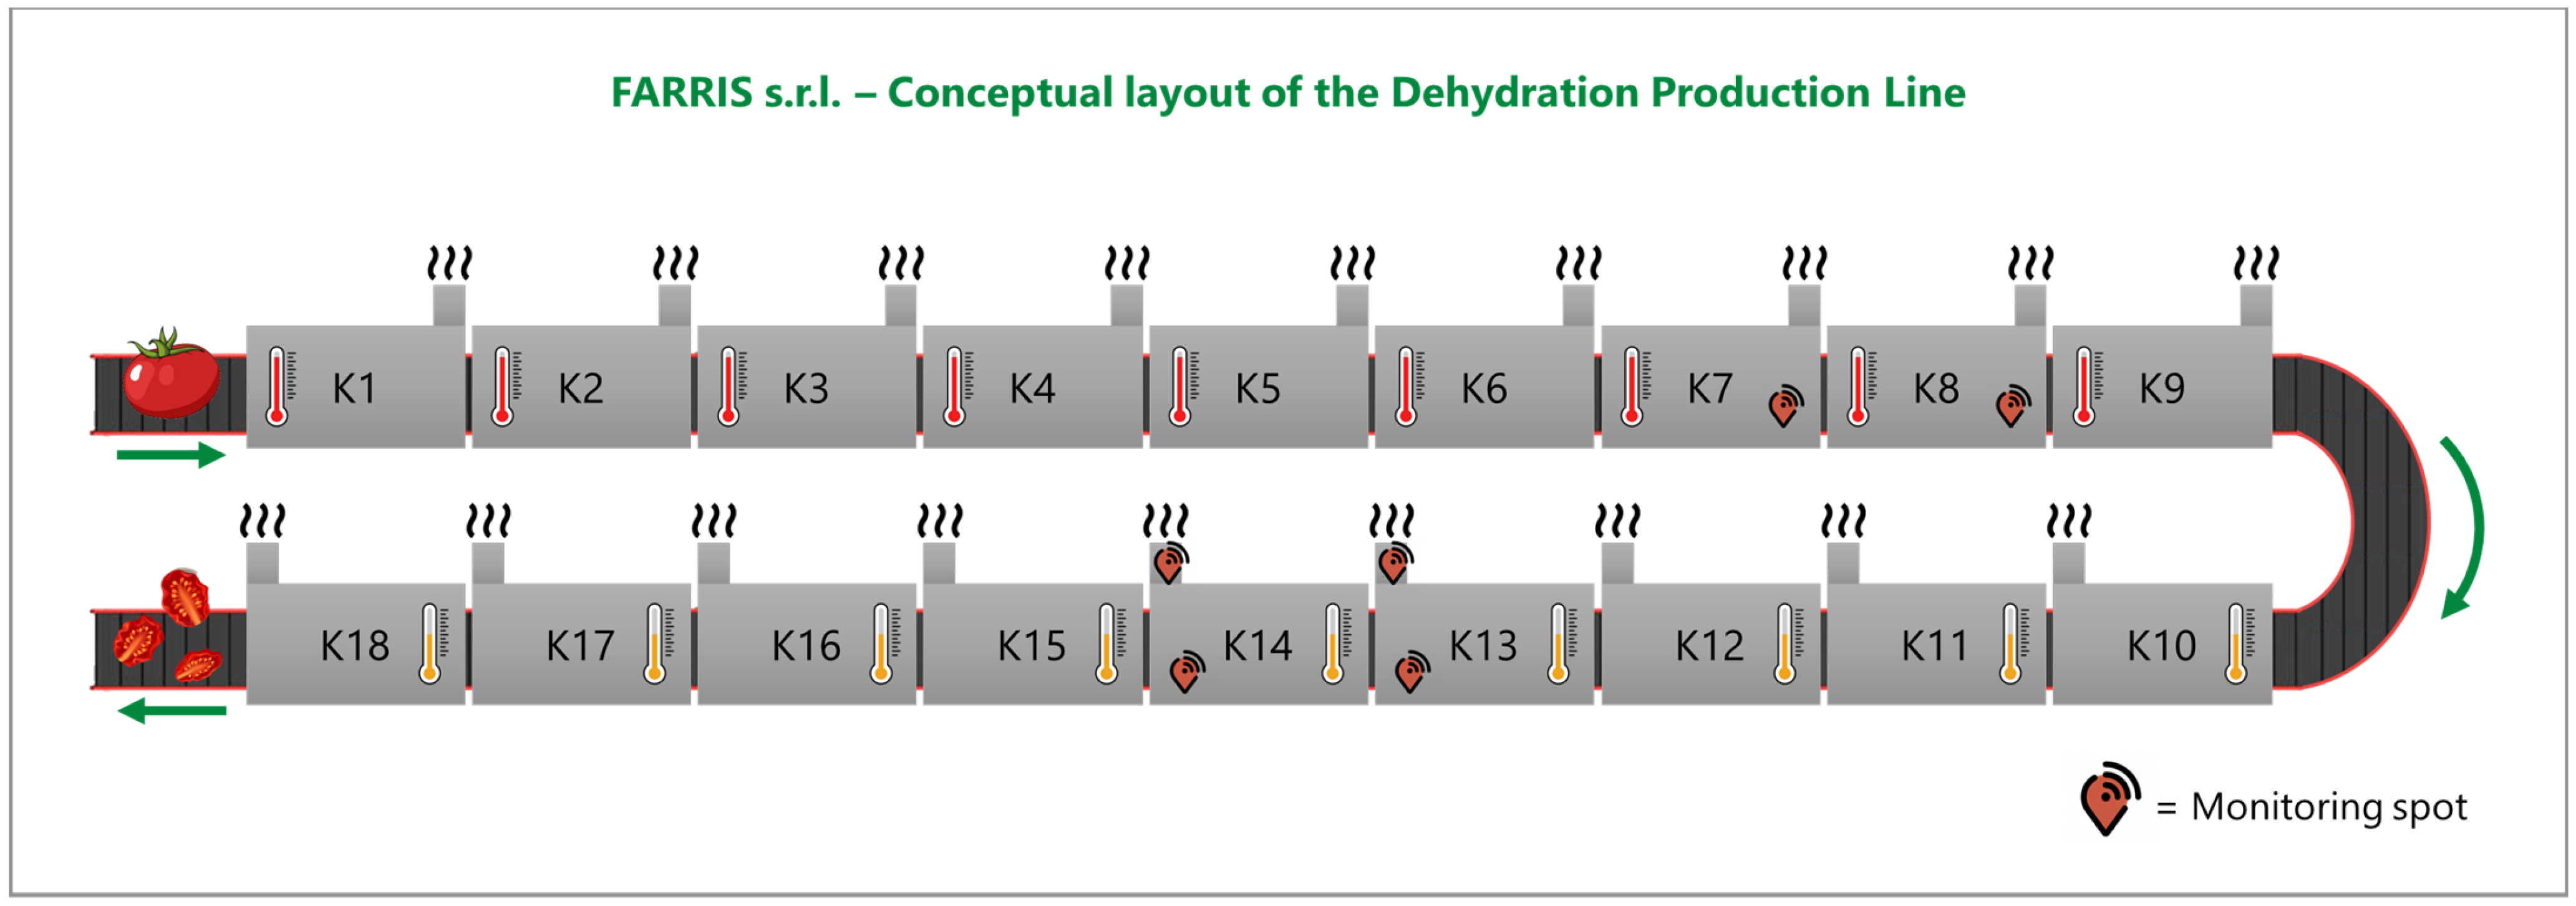
Figure 1. Conceptual diagram of the production line, with indication of the monitoring spots.
Processes 11 01635 g001
Figure 2. Complete detection system. Detailed description is contained in The smart devices section.
Processes 11 01635 g002
Figure 3. LOGGER details: SIM card housing for connection (1) and built-in display (2).
Processes 11 01635 g003
Figure 4. An overview of the firmware for data acquisition by the monitoring system.
Processes 11 01635 g004
Figure 5. Time trend of temperature and humidity values recorded in real time by the monitoring system.
Processes 11 01635 g005
Figure 6. Regression lines for correlation between temperature and humidity measurements in each kiln (a), and mean regression line (b).
Processes 11 01635 g006
Figure 7. Time trend of the temperature of Section 7 and Section 8 (a) and Section 13 and Section 14 (b), compared with the setting temperatures (dashed lines).
Processes 11 01635 g007
Figure 8. Time trend of moisture values recorded in the kilns and chimneys for Section 13 (a) and Section 14, respectively (b).
Processes 11 01635 g008
Figure 9. Distributions of recorded humidity values and ΔT parameter for the four kilns, with special focus on humidity values tending to 100% (vapor saturation) and ΔT values tending to 0 °C (reaching dew point). The percentages next to each bar indicate the percentage frequency with respect to the total values.
Processes 11 01635 g009
Figure 10. Time trend of the ΔT parameter during the two production campaigns for the monitored kilns. The dotted line marks all ΔT values below 0.25 °C (close to 0 °C). The circle emphasizes the liquid formation risk events during the third production campaign.
Processes 11 01635 g010
Table 1. Statistical summary on acquisitions from 2 August 2022 h.00:00:00 to 28 August 2022 h.23:59:59. SD is the standard deviation.
Temperature (°C)Humidity (%)ΔT (°C)
[Temperature—Dew Point]
Pearson Correlation Index ρHT:
H vs. T
K_iNMeanMinMaxSDMeanMinMaxSDMeanMinMaxSD
K7287441.222.5171.9417.3142.368.899.9921.2918.52046.3112.22−0.90
K8282649.6220.6496.8327.0638.73.0199.9926.424.88069.8419.61−0.89
K13407335.6720.6363.912.453.3410.0899.9718.1712.320.0141.917.76−0.74
K13_chimney262143.4722.3792.5516.7542.356.9699.9921.0618.22053.1410.89−0.83
K14282443.0221.5275.2716.846.166.499.9921.7716.37051.8710.03−0.80
K14_chimney409236.1420.1972.6614.6152.217.5395.6518.1212.90.7448.788.33−0.79
ALL1931040.7720.1996.8318.2246.783.0199.9921.6516.6069.8412.43−0.84
Disclaimer/Publisher’s Note: The statements, opinions and data contained in all publications are solely those of the individual author(s) and contributor(s) and not of MDPI and/or the editor(s). MDPI and/or the editor(s) disclaim responsibility for any injury to people or property resulting from any ideas, methods, instructions or products referred to in the content.